Embed Size (px)
Citation preview
A Project Of Strategic Financial Management
On Maximizing Return by minimizing the Risk
Askari Bank
&
Muslim Commercial BankSubmitted to
Sir Rais Ahmad
By:
Avinash Advani-6356
1. Acknowledgment
2. Abstract
3. Introduction
4. Calculation of Askari And MCB band
5. Individual Analysis
6. Business Portfolio Analysis
7. Conclusion
8. References
Sir Rais Ahmed
First of all we would like to thank Almighty GOD who enabled me to work on this report. Then, we would like to show gratitude to my Teacher Sir Rais Ahmed who guided me in every phrase and help me out to prepare this report and also want to thank all of my friends and group members who support me to complete this report on time.
Sir Rais Ahmed we tried our level best to fulfill the requirement of course Strategic finance and management , throughout during this report we learned how we can Analysis company & also we come to know the standard format & steps.We hope this report fulfill the requirements of course Strategic finance and management
Sincerely,Avinash-6356Nazia-6526
Stock return volatilities are related to firms' financial status.
Financially constrained firms are more volatile, In the stock
market and financial markets, volatility refers to the standard
deviation of a financial instrument within a given time frame.
Volatility is thus used to quantify the risk of the financial
instrument over the given time period. In finance, volatility is
calculated over a given time period and then expressed in
annualized terms as a percentage.
The Return on stock and risk very effected the whole market
of stock which is very valuable for stock market there are
many companies which are registered in stock exchange and
they analysis about their return, risk, and beta.
•Asker Bank was incorporated on October 09, 1991 as a Public
Limited Company and is listed on the Karachi, Lahore and
Islamabad Stock Exchange.
•It started its operations from April 01, 1992. The bank was
declared as “Best Bank in Pakistan” in2001 in Global Finance
•Askari Bank Limited has expanded into a nation wide presence
of over a 100 branches, comprising commercial and Islamic
banking branches, connected online and supported by a
network of Automated Teller Machines (ATMs).
Askari Commercial Bank Limited was the first bank in Pakistan to
offer Internet banking Services and B2B e-commerce (Business to
Business electronic Commerce)solutions for merchants looking to
purchase on credit. They believe that balanced growths the key to
survive in the today’s global banking environment
Vision:
“To be the Bank of first choice”
•MCB Bank Ltd formerly known as Muslim Commercial Bank Limited was
incorporated by the Adamjee Group on July 9, 1947, under the Indian
Companies Act, VII of 1913 as a limited company
•The bank was established with a view to provide banking facilities to the
business community of the sub-continent. The bank was nationalized in 1974
during the government of Zulfikar Ali Bhutto.MCB earned Revenue of PKR
31.787 billion and Net Income of PKR 15.266 billion in 2007.
MCB is the fourth largest bank of Pakistan. Its wide network include fully
facilitated branches all over Pakistan. It covers 125 cities, comprising of
978 branches out of which 262 have the ATM machines
MCB has been awarded as a Euro money Award 2008 for the " Best
Bank in Asia". In 2006 MCB yet again received the esteemed Euro
money Award for the "Best Bank in Pakistan”. It is the only bank to
receive the Euro money Award for Excellence for the sixth time in
the past seven years
MCB Continues to shine as once again Asia Money declares MCB as
"The Best Domestic Commercial Bank in Pakistan" for the year 2004
and 2005
MCB Bank’s team of committed
professionals is dedicated to maintaining
long term customer relationships through
outstanding service and convenience
The future is uncertain.
Investors do not know with certainty
whether the economy will be growing
rapidly or be in recession.
Investors do not know what rate of
return their investments will yield.
A measure of variability or dispersion of a
quantity, given as the average squared
deviation of individual observations from
the mean value in a distribution. Its
square root is the standard deviation.
A measure of the volatility of return,
computed as an average squared
deviation of return from the mean value.
Risk reflects the chance that the actual
return on an investment may be different
than the expected return.
If investors accept the idea that
investment risk is defined by a loss of
capital and/or underperformance
relative to expectations, it makes
defining low risk and high-risk investments
substantially easier.
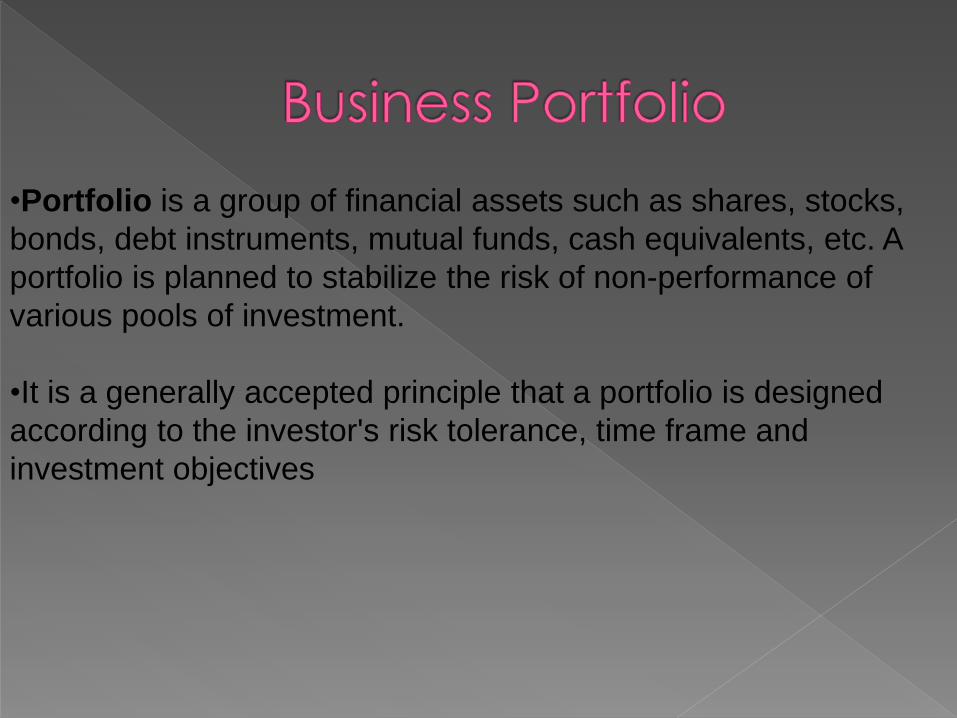
•Portfolio is a group of financial assets such as shares, stocks,
bonds, debt instruments, mutual funds, cash equivalents, etc. A
portfolio is planned to stabilize the risk of non-performance of
various pools of investment.
•It is a generally accepted principle that a portfolio is designed
according to the investor's risk tolerance, time frame and
investment objectives
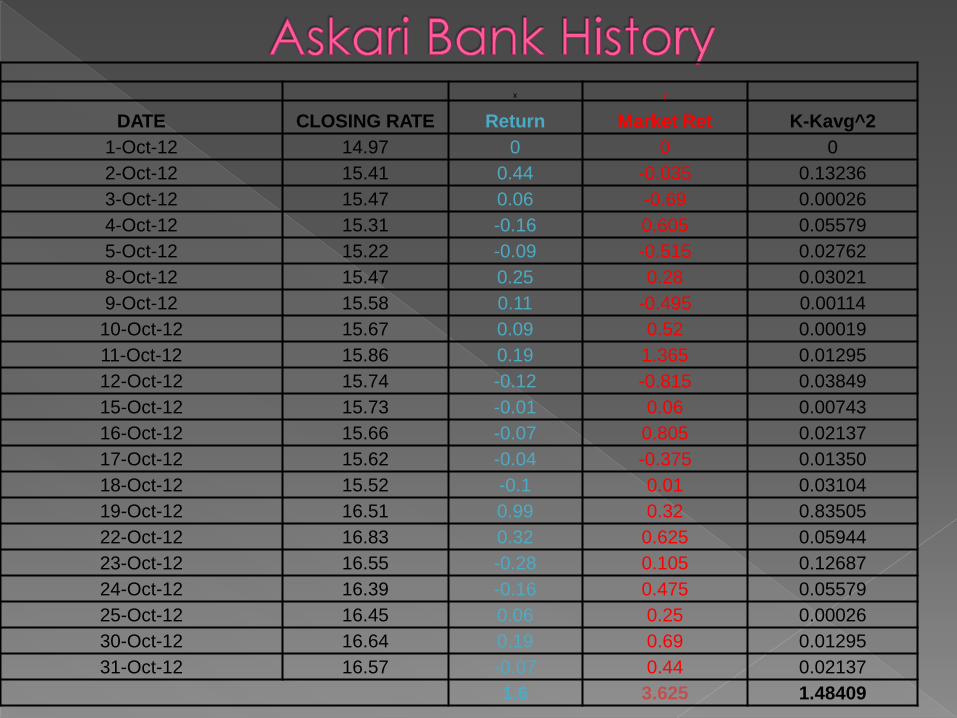
x y
DATE CLOSING RATE Return Market Ret K-Kavg^2
1-Oct-12 14.97 0 0 0
2-Oct-12 15.41 0.44 -0.035 0.13236
3-Oct-12 15.47 0.06 -0.69 0.00026
4-Oct-12 15.31 -0.16 0.605 0.05579
5-Oct-12 15.22 -0.09 -0.515 0.02762
8-Oct-12 15.47 0.25 0.28 0.03021
9-Oct-12 15.58 0.11 -0.495 0.00114
10-Oct-12 15.67 0.09 0.52 0.00019
11-Oct-12 15.86 0.19 1.365 0.01295
12-Oct-12 15.74 -0.12 -0.815 0.03849
15-Oct-12 15.73 -0.01 0.06 0.00743
16-Oct-12 15.66 -0.07 0.805 0.02137
17-Oct-12 15.62 -0.04 -0.375 0.01350
18-Oct-12 15.52 -0.1 0.01 0.03104
19-Oct-12 16.51 0.99 0.32 0.83505
22-Oct-12 16.83 0.32 0.625 0.05944
23-Oct-12 16.55 -0.28 0.105 0.12687
24-Oct-12 16.39 -0.16 0.475 0.05579
25-Oct-12 16.45 0.06 0.25 0.00026
30-Oct-12 16.64 0.19 0.69 0.01295
31-Oct-12 16.57 -0.07 0.44 0.02137
1.6 3.625 1.48409
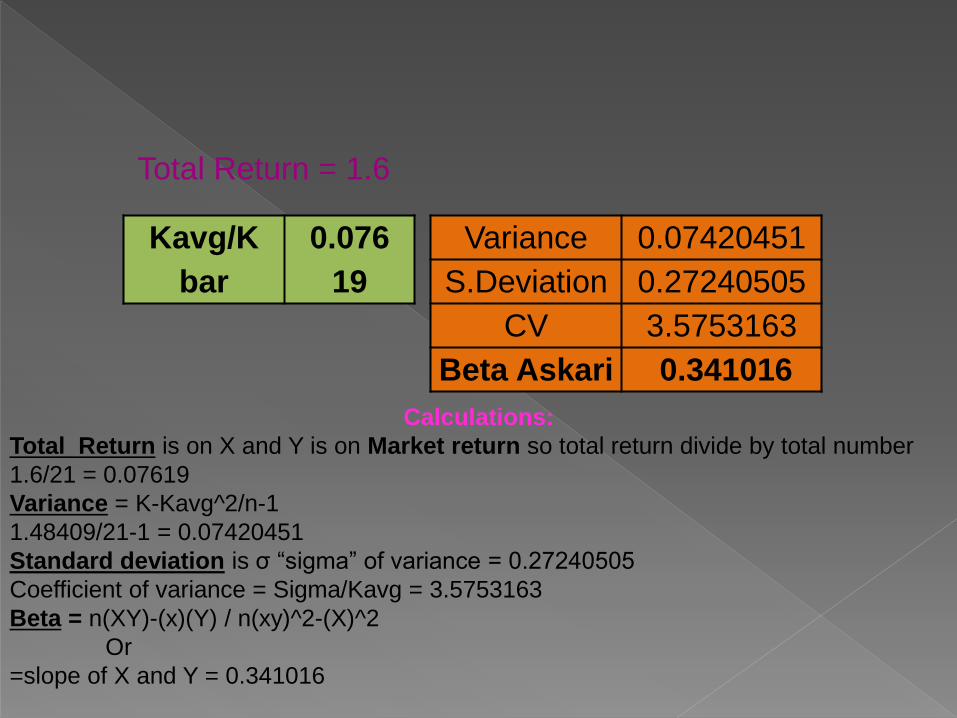
Kavg/K
bar
0.076
19
Total Return = 1.6
Variance 0.07420451
S.Deviation 0.27240505
CV 3.5753163
Beta Askari 0.341016
Calculations:
Total Return is on X and Y is on Market return so total return divide by total number
1.6/21 = 0.07619
Variance = K-Kavg^2/n-1
1.48409/21-1 = 0.07420451
Standard deviation is σ “sigma” of variance = 0.27240505
Coefficient of variance = Sigma/Kavg = 3.5753163
Beta = n(XY)-(x)(Y) / n(xy)^2-(X)^2
Or
=slope of X and Y = 0.341016
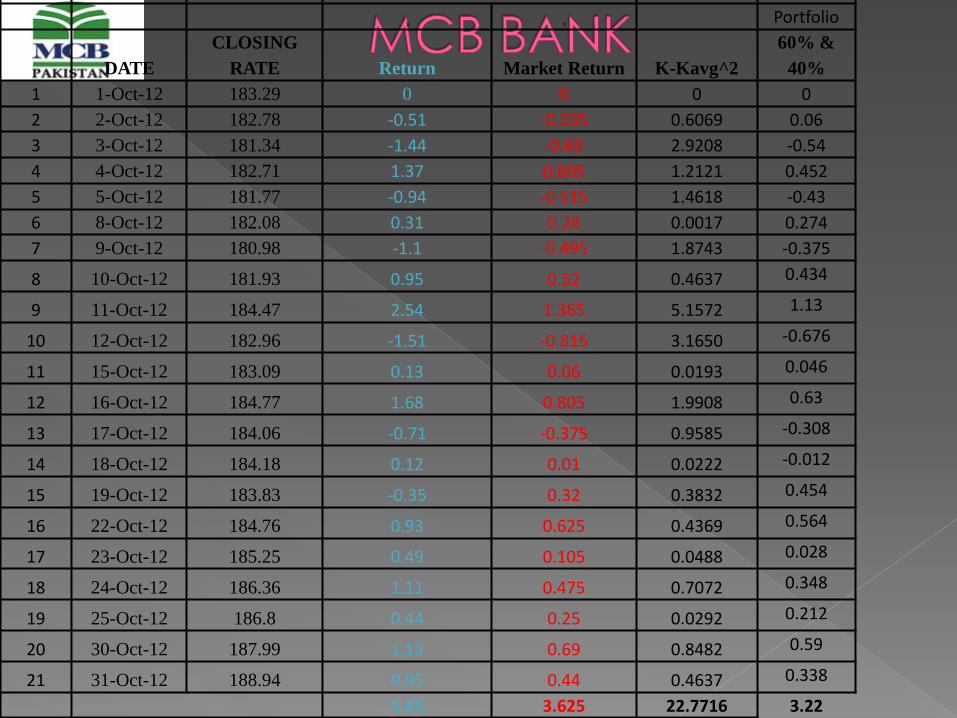
X YPortfolio
DATE
CLOSING
RATE Return Market Return K-Kavg^2
60% &
40%
1 1-Oct-12 183.29 0 0 0 0
2 2-Oct-12 182.78 -0.51 -0.035 0.6069 0.06
3 3-Oct-12 181.34 -1.44 -0.69 2.9208 -0.54
4 4-Oct-12 182.71 1.37 0.605 1.2121 0.452
5 5-Oct-12 181.77 -0.94 -0.515 1.4618 -0.43
6 8-Oct-12 182.08 0.31 0.28 0.0017 0.274
7 9-Oct-12 180.98 -1.1 -0.495 1.8743 -0.375
8 10-Oct-12 181.93 0.95 0.52 0.4637 0.434
9 11-Oct-12 184.47 2.54 1.365 5.1572 1.13
10 12-Oct-12 182.96 -1.51 -0.815 3.1650 -0.676
11 15-Oct-12 183.09 0.13 0.06 0.0193 0.046
12 16-Oct-12 184.77 1.68 0.805 1.9908 0.63
13 17-Oct-12 184.06 -0.71 -0.375 0.9585 -0.308
14 18-Oct-12 184.18 0.12 0.01 0.0222 -0.012
15 19-Oct-12 183.83 -0.35 0.32 0.3832 0.454
16 22-Oct-12 184.76 0.93 0.625 0.4369 0.564
17 23-Oct-12 185.25 0.49 0.105 0.0488 0.028
18 24-Oct-12 186.36 1.11 0.475 0.7072 0.348
19 25-Oct-12 186.8 0.44 0.25 0.0292 0.212
20 30-Oct-12 187.99 1.19 0.69 0.8482 0.59
21 31-Oct-12 188.94 0.95 0.44 0.4637 0.338
5.65 3.625 22.7716 3.22
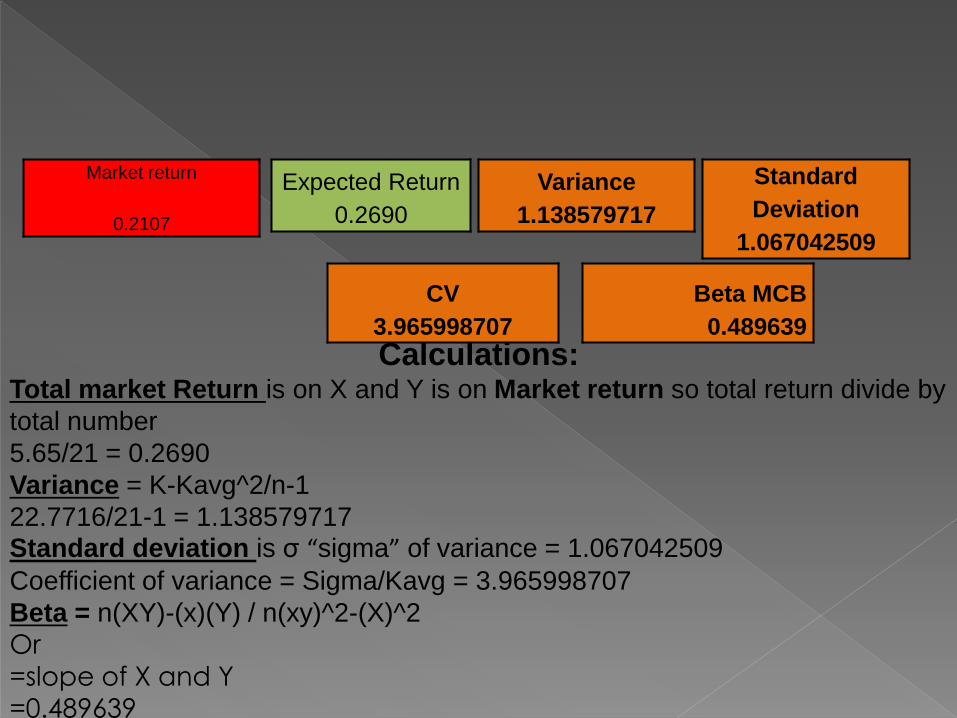
Market return
0.2107
Expected Return
0.2690
Variance
1.138579717
Standard
Deviation
1.067042509
CV
3.965998707
Beta MCB
0.489639
Calculations:Total market Return is on X and Y is on Market return so total return divide by
total number
5.65/21 = 0.2690
Variance = K-Kavg^2/n-1
22.7716/21-1 = 1.138579717Standard deviation is σ “sigma” of variance = 1.067042509
Coefficient of variance = Sigma/Kavg = 3.965998707
Beta = n(XY)-(x)(Y) / n(xy)^2-(X)^2
Or
=slope of X and Y=0.489639
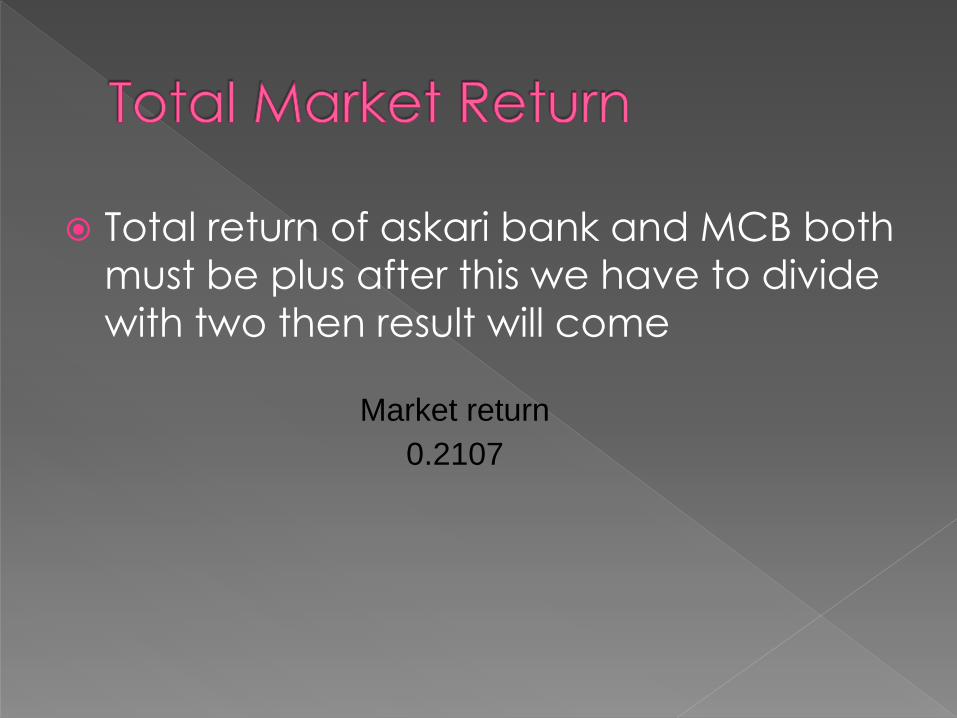
Total return of askari bank and MCB both
must be plus after this we have to divide
with two then result will come
Market return
0.2107
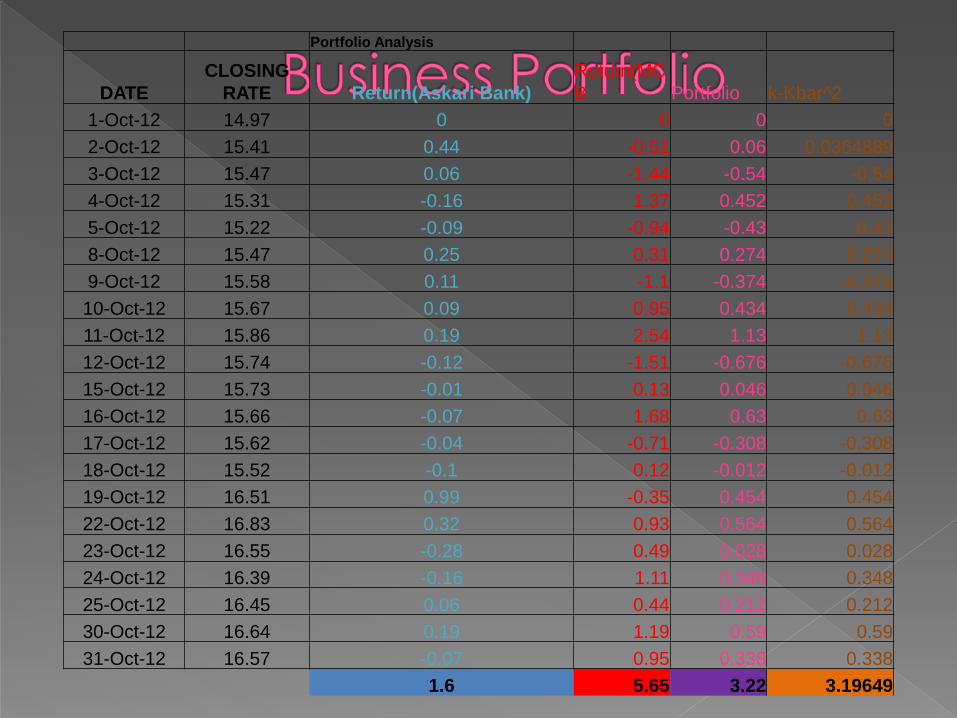
Portfolio Analysis
DATE
CLOSING
RATE Return(Askari Bank)
Return(MC
B Portfolio k-Kbar^2
1-Oct-12 14.97 0 0 0 0
2-Oct-12 15.41 0.44 -0.51 0.06 0.0364889
3-Oct-12 15.47 0.06 -1.44 -0.54 -0.54
4-Oct-12 15.31 -0.16 1.37 0.452 0.452
5-Oct-12 15.22 -0.09 -0.94 -0.43 -0.43
8-Oct-12 15.47 0.25 0.31 0.274 0.274
9-Oct-12 15.58 0.11 -1.1 -0.374 -0.374
10-Oct-12 15.67 0.09 0.95 0.434 0.434
11-Oct-12 15.86 0.19 2.54 1.13 1.13
12-Oct-12 15.74 -0.12 -1.51 -0.676 -0.676
15-Oct-12 15.73 -0.01 0.13 0.046 0.046
16-Oct-12 15.66 -0.07 1.68 0.63 0.63
17-Oct-12 15.62 -0.04 -0.71 -0.308 -0.308
18-Oct-12 15.52 -0.1 0.12 -0.012 -0.012
19-Oct-12 16.51 0.99 -0.35 0.454 0.454
22-Oct-12 16.83 0.32 0.93 0.564 0.564
23-Oct-12 16.55 -0.28 0.49 0.028 0.028
24-Oct-12 16.39 -0.16 1.11 0.348 0.348
25-Oct-12 16.45 0.06 0.44 0.212 0.212
30-Oct-12 16.64 0.19 1.19 0.59 0.59
31-Oct-12 16.57 -0.07 0.95 0.338 0.338
1.6 5.65 3.22 3.19649
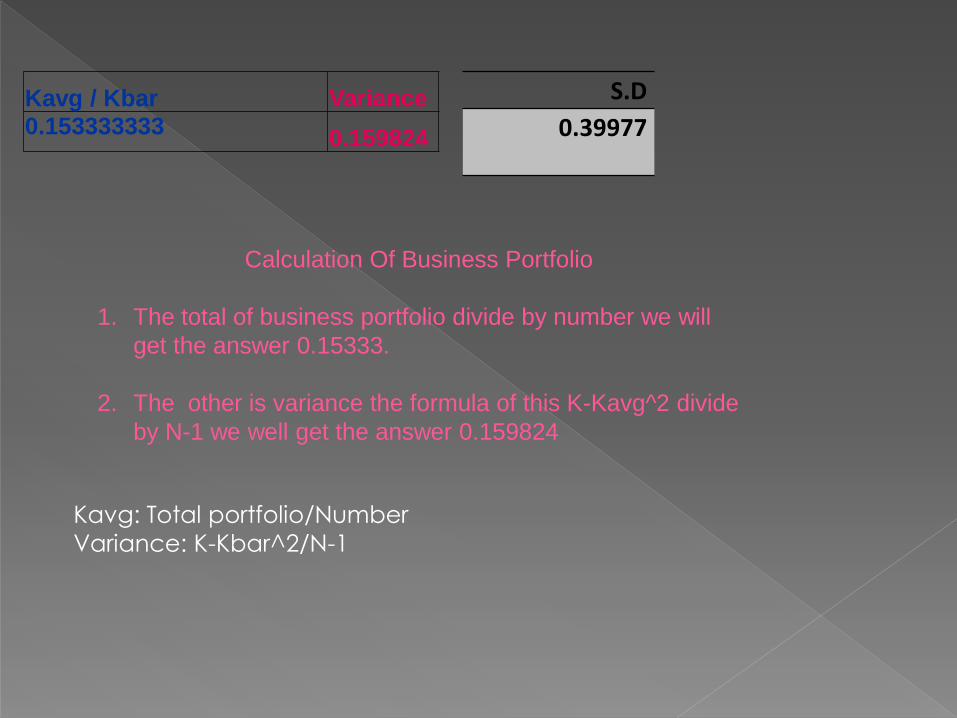
Kavg / Kbar Variance0.153333333
0.159824
Calculation Of Business Portfolio
1. The total of business portfolio divide by number we will
get the answer 0.15333.
2. The other is variance the formula of this K-Kavg^2 divide
by N-1 we well get the answer 0.159824
Kavg: Total portfolio/Number
Variance: K-Kbar^2/N-1
S.D
0.39977
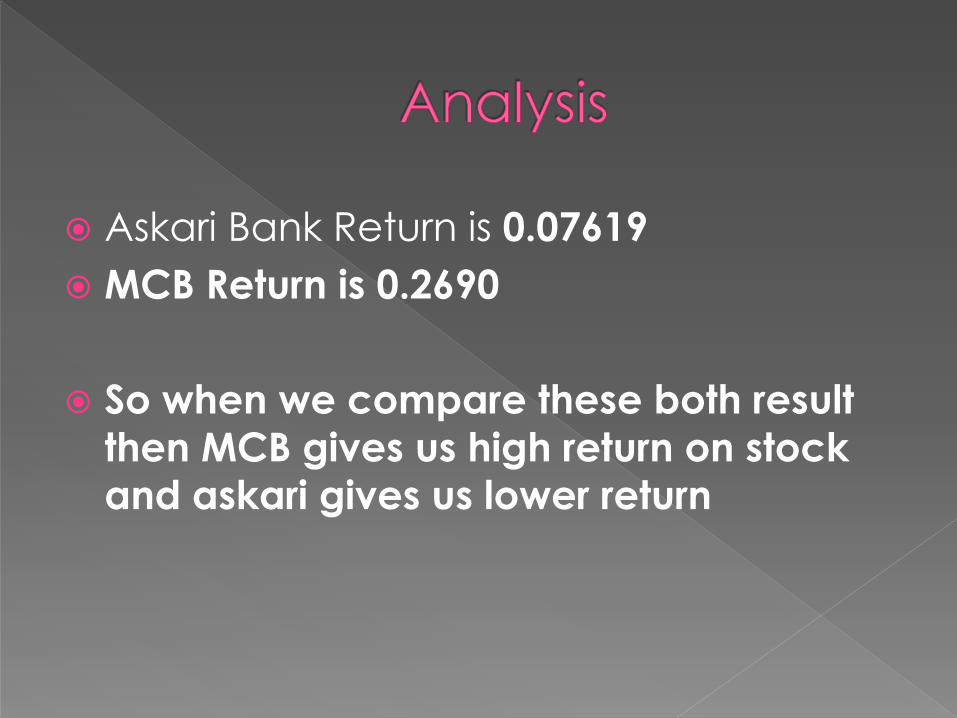
Askari Bank Return is 0.07619
MCB Return is 0.2690
So when we compare these both result
then MCB gives us high return on stock and askari gives us lower return
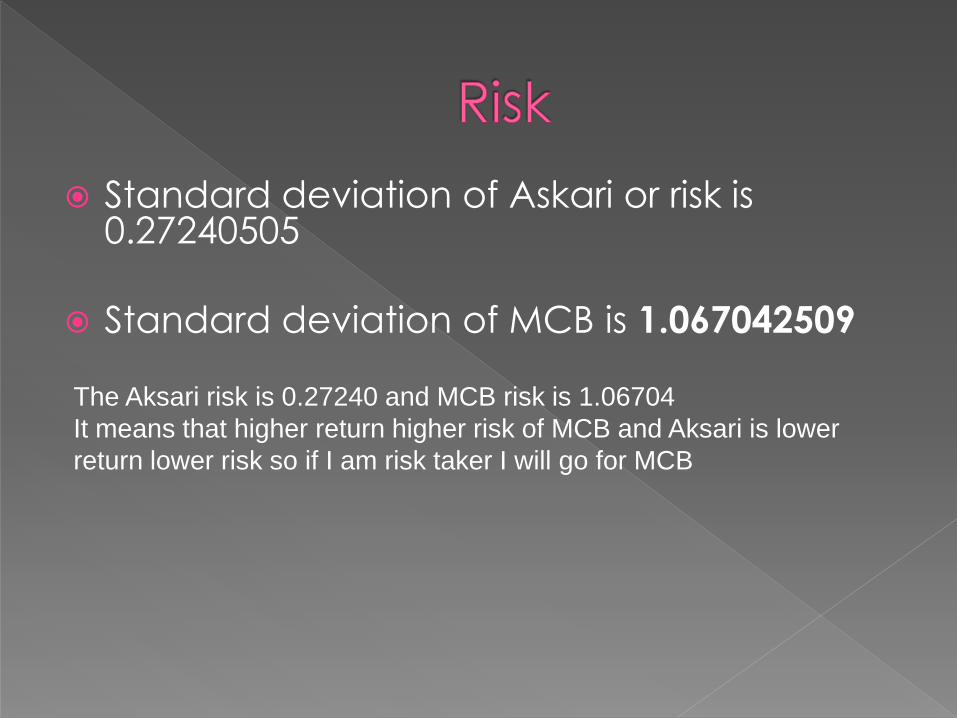
Standard deviation of Askari or risk is 0.27240505
Standard deviation of MCB is 1.067042509
The Aksari risk is 0.27240 and MCB risk is 1.06704
It means that higher return higher risk of MCB and Aksari is lower
return lower risk so if I am risk taker I will go for MCB
Systematic risk is overall market risk as applied to a particular
stock. It cannot be diversified against in a portfolio.
Depending on its volatility compared to the benchmark, a
stock will have a beta of greater or less than 1. The higher the
beta, the more volatile the stock; the lower the beta, the less
volatile.
In this chapter we learn about the total return on stock and their risk. For example if company A gives us 0.9 return on stock and Company B gives us 0.7 on stock then its return is less than company A so we prefer the company A because its gives us high return on stock A and 0.9 is greater than 0.7 so its conceptual that we go for stock A.
The related terms "threat" and "hazard" are often used to mean something that could cause harm.
When we talk about Risk, lower risk is better than high risk but in this risk there are two types of risk
1. Risk Taker 2. Risk Aversion
If a company gives us high return and its risk is also high and if we are risk taker then we go for it because we are expecting the more return but also as well as we are risk taker.
A risk management technique that seeks to eliminate any possibility of risk through hazard prevention, or the discontinuation of activities determined to entail any level of risk. Often used in extreme situations where the risk exposure creates an extraordinary liability potential.
Business portfolio
We are not invest only single company we invest different companies because every individual company gives us dissimilar return and their risk is also dissimilar
So in this chapter it included about the return on stock, market return, risk, and business portfolio and how to calculate them.
:http://www.investorwords.com/19201/risk_avoidance.html#ixzz2EeJATzXn
http://www.investopedia.com/terms/r/riskreturntradeoff.asp
http://riskandreturn.net/
http://www.accessecon.com