Embed Size (px)
Citation preview
COPYRIGHT: No part of this document may be reproduced without the explicit written permission of QNBFS Page 1 of 6
Daily Technical Trader – Qatar
Thursday, 07 May 2015
Stocks Covered Today
Ticker Price 1st
Target
QIBK 104.00 105.90
MRDS 19.18 19.70
QSE Index
Level % Ch. Vol. (mn)
Last 12,334.06 1.0 4.6
Resistance/Support
Levels 1st
2nd
3rd
Resistance 12,400 12,600 12,800
Support 12,200 12,100 12,000
QSE Index Commentary
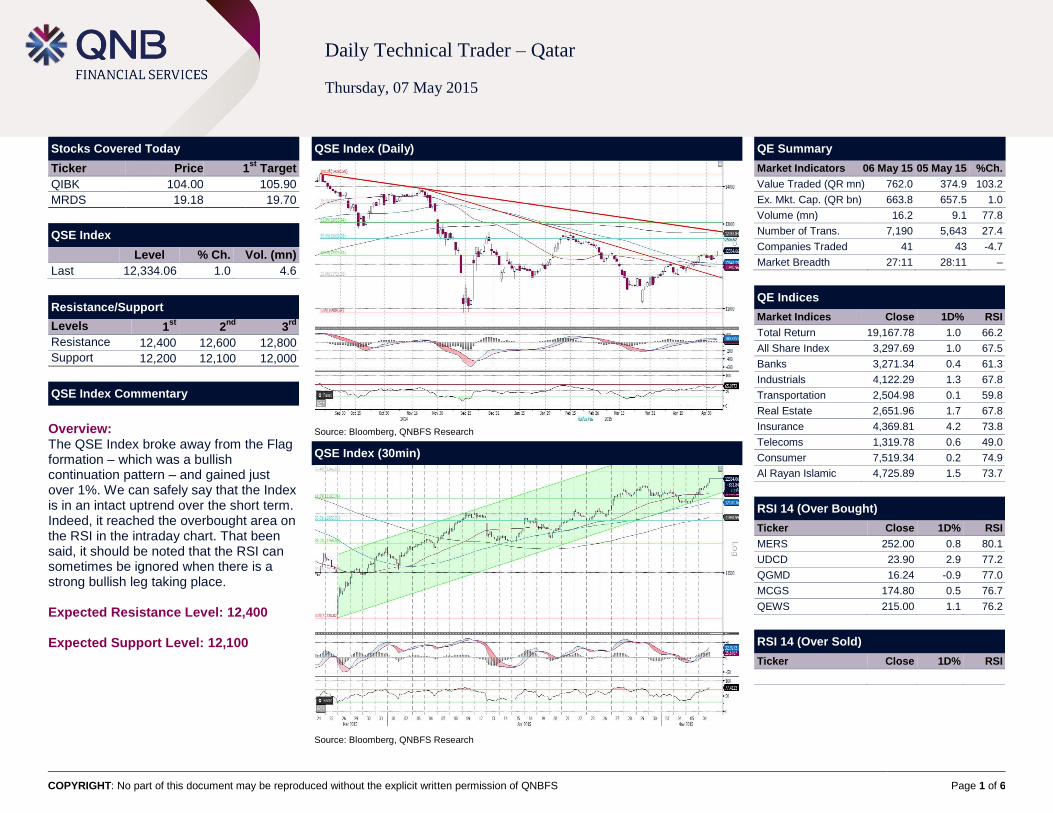
Overview: The QSE Index broke away from the Flag formation – which was a bullish continuation pattern – and gained just over 1%. We can safely say that the Index is in an intact uptrend over the short term. Indeed, it reached the overbought area on the RSI in the intraday chart. That been said, it should be noted that the RSI can sometimes be ignored when there is a strong bullish leg taking place. Expected Resistance Level: 12,400 Expected Support Level: 12,100
QSE Index (Daily)
Source: Bloomberg, QNBFS Research
QE Summary
Market Indicators 06 May 15 05 May 15 %Ch.
Value Traded (QR mn) 762.0 374.9 103.2
Ex. Mkt. Cap. (QR bn) 663.8 657.5 1.0
Volume (mn) 16.2 9.1 77.8
Number of Trans. 7,190 5,643 27.4
Companies Traded 41 43 -4.7
Market Breadth 27:11 28:11 –
QE Indices
Market Indices Close 1D% RSI
Total Return 19,167.78 1.0 66.2
All Share Index 3,297.69 1.0 67.5
Banks 3,271.34 0.4 61.3
Industrials 4,122.29 1.3 67.8
Transportation 2,504.98 0.1 59.8
Real Estate 2,651.96 1.7 67.8
Insurance 4,369.81 4.2 73.8
Telecoms 1,319.78 0.6 49.0
Consumer 7,519.34 0.2 74.9
Al Rayan Islamic 4,725.89 1.5 73.7
RSI 14 (Over Bought)
Ticker Close 1D% RSI
MERS 252.00 0.8 80.1
UDCD 23.90 2.9 77.2
QGMD 16.24 -0.9 77.0
MCGS 174.80 0.5 76.7
QEWS 215.00 1.1 76.2
RSI 14 (Over Sold)
Ticker Close 1D% RSI
QSE Index (30min)
Source: Bloomberg, QNBFS Research
COPYRIGHT: No part of this document may be reproduced without the explicit written permission of QNBFS Page 2 of 6
QIBK
Price % Ch. Volume
Last 104.00 0.97 91,755
Resistance/Support
Levels (QR) 1st
2nd
3rd
Resistance 104.00 105.90 107.00
Support 102.40 101.00 100.00
Commentary
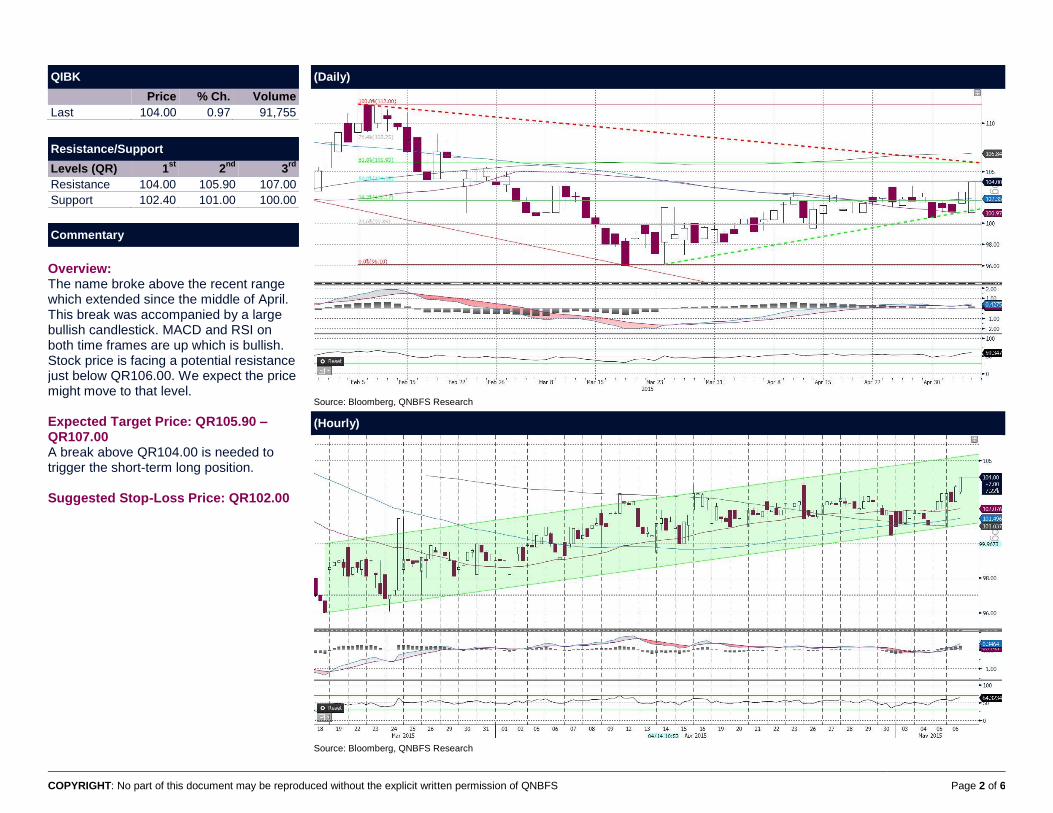
Overview: The name broke above the recent range which extended since the middle of April. This break was accompanied by a large bullish candlestick. MACD and RSI on both time frames are up which is bullish. Stock price is facing a potential resistance just below QR106.00. We expect the price might move to that level. Expected Target Price: QR105.90 – QR107.00 A break above QR104.00 is needed to trigger the short-term long position. Suggested Stop-Loss Price: QR102.00
(Daily)
Source: Bloomberg, QNBFS Research
(Hourly)
Source: Bloomberg, QNBFS Research
COPYRIGHT: No part of this document may be reproduced without the explicit written permission of QNBFS Page 3 of 6
MRDS
Price % Ch. Volume
Last 19.18 1.00 351,410
Resistance/Support
Levels (QR) 1st
2nd
3rd
Resistance 19.34 19.70 20.00
Support 19.00 18.50 17.50
Commentary
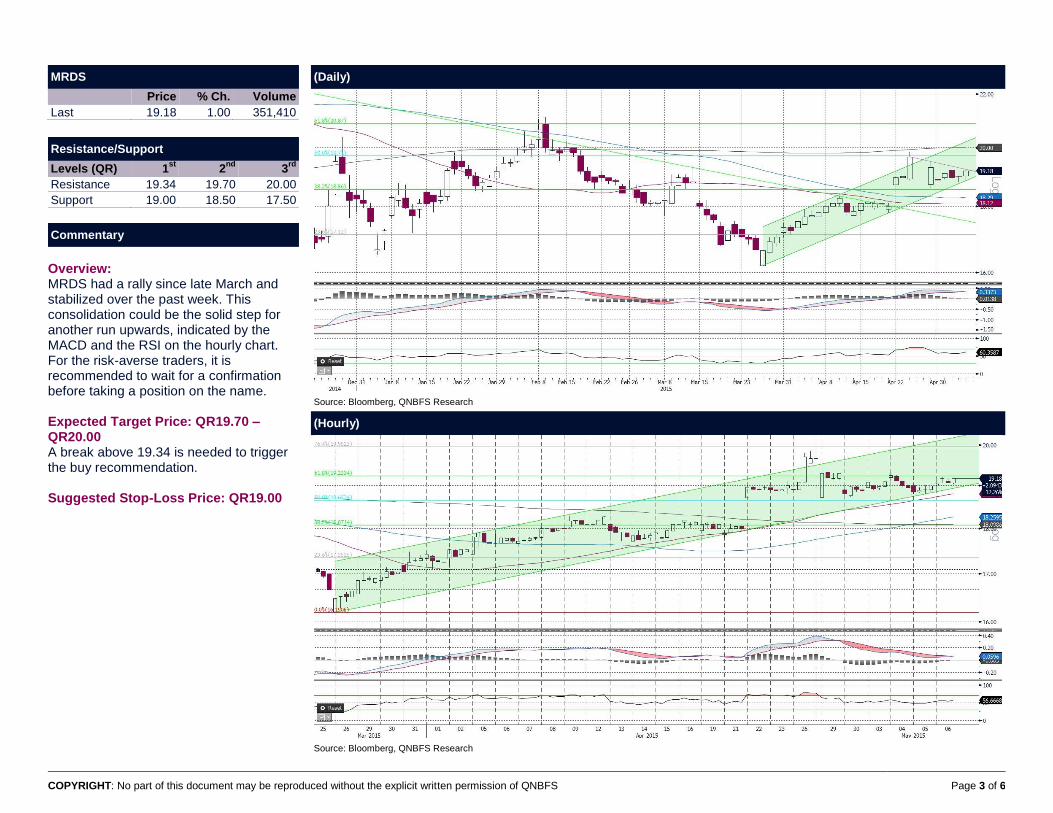
Overview: MRDS had a rally since late March and stabilized over the past week. This consolidation could be the solid step for another run upwards, indicated by the MACD and the RSI on the hourly chart. For the risk-averse traders, it is recommended to wait for a confirmation before taking a position on the name. Expected Target Price: QR19.70 – QR20.00 A break above 19.34 is needed to trigger the buy recommendation. Suggested Stop-Loss Price: QR19.00
(Daily)
Source: Bloomberg, QNBFS Research
(Hourly)
Source: Bloomberg, QNBFS Research
COPYRIGHT: No part of this document may be reproduced without the explicit written permission of QNBFS Page 4 of 6
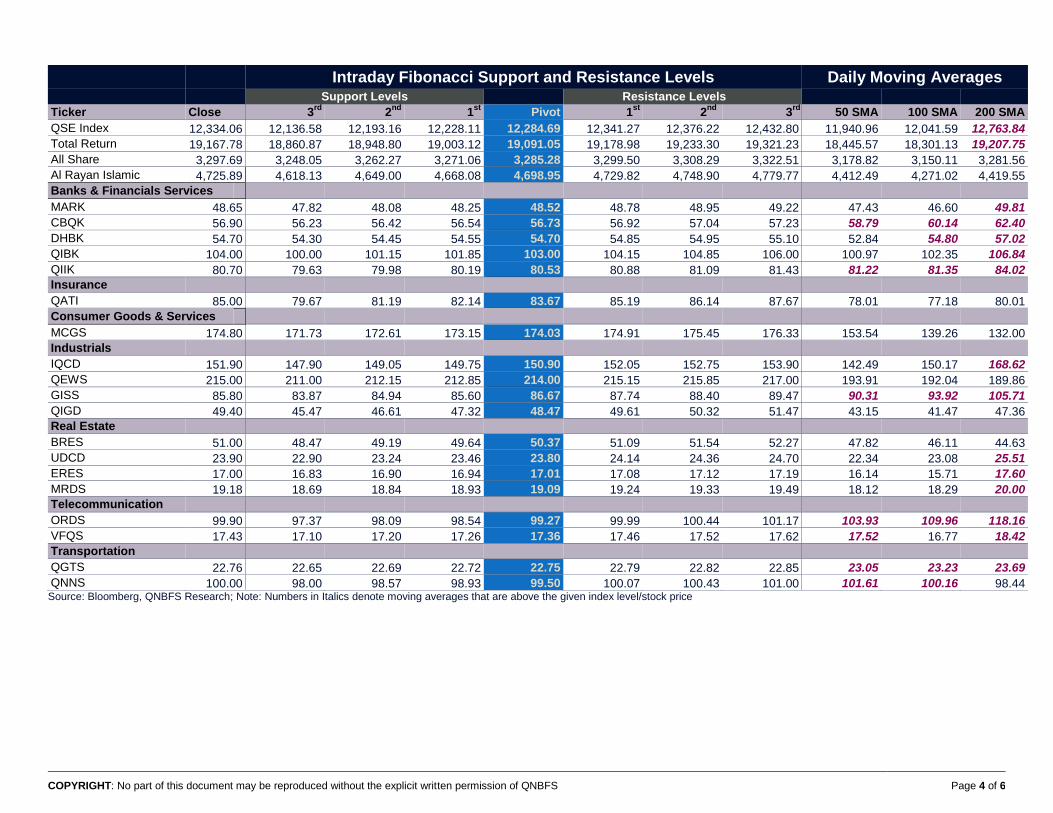
Intraday Fibonacci Support and Resistance Levels Daily Moving Averages Support Levels Resistance Levels
Ticker Close 3rd
2nd
1st
Pivot 1st
2nd
3rd
50 SMA 100 SMA 200 SMA
QSE Index 12,334.06 12,136.58 12,193.16 12,228.11 12,284.69 12,341.27 12,376.22 12,432.80 11,940.96 12,041.59 12,763.84
Total Return 19,167.78 18,860.87 18,948.80 19,003.12 19,091.05 19,178.98 19,233.30 19,321.23 18,445.57 18,301.13 19,207.75
All Share 3,297.69 3,248.05 3,262.27 3,271.06 3,285.28 3,299.50 3,308.29 3,322.51 3,178.82 3,150.11 3,281.56
Al Rayan Islamic 4,725.89 4,618.13 4,649.00 4,668.08 4,698.95 4,729.82 4,748.90 4,779.77 4,412.49 4,271.02 4,419.55
Banks & Financials Services
MARK 48.65 47.82 48.08 48.25 48.52 48.78 48.95 49.22 47.43 46.60 49.81
CBQK 56.90 56.23 56.42 56.54 56.73 56.92 57.04 57.23 58.79 60.14 62.40
DHBK 54.70 54.30 54.45 54.55 54.70 54.85 54.95 55.10 52.84 54.80 57.02
QIBK 104.00 100.00 101.15 101.85 103.00 104.15 104.85 106.00 100.97 102.35 106.84
QIIK 80.70 79.63 79.98 80.19 80.53 80.88 81.09 81.43 81.22 81.35 84.02
Insurance
QATI 85.00 79.67 81.19 82.14 83.67 85.19 86.14 87.67 78.01 77.18 80.01
Consumer Goods & Services
MCGS 174.80 171.73 172.61 173.15 174.03 174.91 175.45 176.33 153.54 139.26 132.00
Industrials
IQCD 151.90 147.90 149.05 149.75 150.90 152.05 152.75 153.90 142.49 150.17 168.62
QEWS 215.00 211.00 212.15 212.85 214.00 215.15 215.85 217.00 193.91 192.04 189.86
GISS 85.80 83.87 84.94 85.60 86.67 87.74 88.40 89.47 90.31 93.92 105.71
QIGD 49.40 45.47 46.61 47.32 48.47 49.61 50.32 51.47 43.15 41.47 47.36
Real Estate
BRES 51.00 48.47 49.19 49.64 50.37 51.09 51.54 52.27 47.82 46.11 44.63
UDCD 23.90 22.90 23.24 23.46 23.80 24.14 24.36 24.70 22.34 23.08 25.51
ERES 17.00 16.83 16.90 16.94 17.01 17.08 17.12 17.19 16.14 15.71 17.60
MRDS 19.18 18.69 18.84 18.93 19.09 19.24 19.33 19.49 18.12 18.29 20.00
Telecommunication
ORDS 99.90 97.37 98.09 98.54 99.27 99.99 100.44 101.17 103.93 109.96 118.16
VFQS 17.43 17.10 17.20 17.26 17.36 17.46 17.52 17.62 17.52 16.77 18.42
Transportation
QGTS 22.76 22.65 22.69 22.72 22.75 22.79 22.82 22.85 23.05 23.23 23.69
QNNS 100.00 98.00 98.57 98.93 99.50 100.07 100.43 101.00 101.61 100.16 98.44 Source: Bloomberg, QNBFS Research; Note: Numbers in Italics denote moving averages that are above the given index level/stock price
COPYRIGHT: No part of this document may be reproduced without the explicit written permission of QNBFS Page 5 of 6
Definitions:
Candlestick: A chart that displays the high, low, opening and closing prices for a security in a single period. The body of the candle is made up by the opening
and the closing prices, i.e., the taller the body the greater the range between these two prices and vice versa. A colored candle denotes a closing price that is
lower than the opening price, while a white candle shows the opposite. The candlestick's shadows or wicks show the period's high and low prices and how they
compare to the opening and closing price. In general, the shape of the candle will vary upon the positions of the period's high, low, opening and closing prices.
Support: A level that could cause more buyers to step in in order to prevent the security from falling or causing the security price to head higher.
Resistance: An inverse of a support level. A resistance area or level could cause more sellers to step in in order to prevent the security from rising or causing the
security price to head lower.
SMA (Simple Moving Average): Is an arithmetic average, which calculates the average price of a security over a defined number of periods and is thus
considered a lagging indicator. SMAs used in our analysis refer to closing prices. In general, SMAs serve many purposes, such as a smoothing tool, an indicative
price direction and potential support/resistance levels.
Market Breadth: Breadth indicates the number of securities that have closed higher vs. the number of decliners in a particular exchange.
MACD (Moving Average Convergence/Divergence): Is a trading indicator, which shows changes in the strength, direction, momentum and duration of a trend in
a stock's price through a collection of three time series calculated from historical closing price data.
RSI (Relative Strength Index): Is a momentum indicator that compares a security’s price gains to its losses for a predetermined number of periods (we generally
use 14 periods). The RSI attempts to point out how a security, in relative terms, is in the overbought/oversold zone. Securities with a RSI above 70 could be
considered as overbought, and below 30 could be considered as oversold.
Pattern/Formation: Is a graphical presentation of a security’s price activity over a certain period of time. Formations come in different shapes (such as, head &
shoulders, triangles, flags, and so on). They can be used to identify potential trends, reversal of trends, price targets, entry and exit points, etc.
Fibonacci Retracements: Are horizontal lines that indicate expected areas of support/resistance for a security based on a predetermined price movement. These
levels are usually indicated by Fibonacci ratios of 23.6%, 38.2%, 50.0%, 61.8% and 100% from that particular movement.
Fibonacci Pivot and Intra-day Support/Resistance: A Pivot Point is generally used to formulate expected future support/resistance levels. From the base Pivot
Point, Fibonacci multiples of the high-low differential are added to form resistance levels and subtracted to form support levels.
COPYRIGHT: No part of this document may be reproduced without the explicit written permission of QNBFS Page 6 of 6
Contacts:
Saugata Sarkar Sahbi Kasraoui QNB Financial Services SPC
Head of Research Head of HNI Contact Center: (+974) 4476 6666
Tel: (+974) 4476 6534 Tel: (+974) 4476 6544 PO Box 24025
[email protected] [email protected] Doha, Qatar
Disclaimer and Copyright Notice: This publication has been prepared by QNB Financial Services SPC (“QNBFS”) a wholly-owned subsidiary of QNB SAQ (“QNB”). QNBFS is regulated by the Qatar Financial Markets Authority and the Qatar Exchange QNB SAQ is regulated by the Qatar Central Bank. This publication expresses the views and opinions of QNBFS at a given time only. It is not an offer, promotion or recommendation to buy or sell securities or other investments, nor is it intended to constitute legal, tax, accounting, or financial advice. QNBFS accepts no liability whatsoever for any direct or indirect losses arising from use of this report. Any investment decision should depend on the individual circumstances of the investor and be based on specifically engaged investment advice. We therefore strongly advise potential investors to seek independent professional advice before making any investment decision. Although the information in this report has been obtained from sources that QNBFS believes to be reliable, we have not independently verified such information and it may not be accurate or complete. QNBFS does not make any representations or warranties as to the accuracy and completeness of the information it may contain, and declines any liability in that respect. For reports dealing with Technical Analysis, expressed opinions and/or recommendations may be different or contrary to the opinions/recommendations of QNBFS Fundamental Research as a result of depending solely on the historical technical data (price and volume). QNBFS reserves the right to amend the views and opinions expressed in this publication at any time. It may also express viewpoints or make investment decisions that differ significantly from, or even contradict, the views and opinions included in this report. This report may not be reproduced in whole or in part without permission from QNBFS.