Embed Size (px)
Citation preview

APPENDIX
CATERPILLAR INC.
GENERAL AND FINANCIAL INFORMATION
2004
A-1

A-2
TABLE OF CONTENTS
Page
Management’s Report on Internal Control Over Financial Reporting. . . . . . . . . . . . . . . . . . . . . . . . . . . . . . A-3
Report of Independent Registered Public Accounting Firm. . . . . . . . . . . . . . . . . . . . . . . . . . . . . . . . . . . . . . . . . A-4
Consolidated Financial Statements and Notes. . . . . . . . . . . . . . . . . . . . . . . . . . . . . . . . . . . . . . . . . . . . . . . . . . . . . . . . A-5
Five-year Financial Summary . . . . . . . . . . . . . . . . . . . . . . . . . . . . . . . . . . . . . . . . . . . . . . . . . . . . . . . . . . . . . . . . . . . . . . . . . A-35
Management’s Discussion and Analysis (MD&A)
Overview . . . . . . . . . . . . . . . . . . . . . . . . . . . . . . . . . . . . . . . . . . . . . . . . . . . . . . . . . . . . . . . . . . . . . . . . . . . . . . . . . . . . . . . . . . . A-36
2004 Compared with 2003. . . . . . . . . . . . . . . . . . . . . . . . . . . . . . . . . . . . . . . . . . . . . . . . . . . . . . . . . . . . . . . . . . . . . . . . A-37
Fourth Quarter 2004 Compared with Fourth Quarter 2003 . . . . . . . . . . . . . . . . . . . . . . . . . . . . . . . . . . . . A-41
Supplemental Information . . . . . . . . . . . . . . . . . . . . . . . . . . . . . . . . . . . . . . . . . . . . . . . . . . . . . . . . . . . . . . . . . . . . . . . . A-43
2003 Compared with 2002. . . . . . . . . . . . . . . . . . . . . . . . . . . . . . . . . . . . . . . . . . . . . . . . . . . . . . . . . . . . . . . . . . . . . . . . A-44
Glossary of Terms . . . . . . . . . . . . . . . . . . . . . . . . . . . . . . . . . . . . . . . . . . . . . . . . . . . . . . . . . . . . . . . . . . . . . . . . . . . . . . . . . A-47
Liquidity & Capital Resources . . . . . . . . . . . . . . . . . . . . . . . . . . . . . . . . . . . . . . . . . . . . . . . . . . . . . . . . . . . . . . . . . . . A-48
Critical Accounting Policies . . . . . . . . . . . . . . . . . . . . . . . . . . . . . . . . . . . . . . . . . . . . . . . . . . . . . . . . . . . . . . . . . . . . . . A-51
Employment. . . . . . . . . . . . . . . . . . . . . . . . . . . . . . . . . . . . . . . . . . . . . . . . . . . . . . . . . . . . . . . . . . . . . . . . . . . . . . . . . . . . . . . . A-52
Other Matters . . . . . . . . . . . . . . . . . . . . . . . . . . . . . . . . . . . . . . . . . . . . . . . . . . . . . . . . . . . . . . . . . . . . . . . . . . . . . . . . . . . . . . A-53
Supplemental Consolidating Data . . . . . . . . . . . . . . . . . . . . . . . . . . . . . . . . . . . . . . . . . . . . . . . . . . . . . . . . . . . . . . . . A-57
Outlook . . . . . . . . . . . . . . . . . . . . . . . . . . . . . . . . . . . . . . . . . . . . . . . . . . . . . . . . . . . . . . . . . . . . . . . . . . . . . . . . . . . . . . . . . . . . . A-60
Supplemental Stockholder Information . . . . . . . . . . . . . . . . . . . . . . . . . . . . . . . . . . . . . . . . . . . . . . . . . . . . . . . . . . . . . . . A-62
Directors and Officers . . . . . . . . . . . . . . . . . . . . . . . . . . . . . . . . . . . . . . . . . . . . . . . . . . . . . . . . . . . . . . . . . . . . . . . . . . . . . . . . . . A-63

The management of Caterpillar Inc. (the Company) is responsible for establishing and maintaining adequate internalcontrol over financial reporting. Our internal control over financial reporting is a process designed to provide reasonableassurance regarding the reliability of our financial reporting and the preparation of financial statements for external purposesin accordance with generally accepted accounting principles. Our internal control over financial reporting includes thosepolicies and procedures that (i) pertain to the maintenance of records that, in reasonable detail, accurately and fairly reflectthe transactions and dispositions of the assets of the Company; (ii) provide reasonable assurance that transactions arerecorded as necessary to permit preparation of financial statements in accordance with generally accepted accountingprinciples, and that receipts and expenditures of the Company are being made only in accordance with authorizations ofmanagement and directors of the Company; and (iii) provide reasonable assurance regarding prevention or timelydetection of unauthorized acquisition, use, or disposition of the Company’s assets that could have a material effect on thefinancial statements.
Because of its inherent limitations, internal control over financial reporting may not prevent or detect misstatements.Also, projections of any evaluation of effectiveness to future periods are subject to the risk that controls may become inad-equate because of changes in conditions, or that the degree of compliance with the policies or procedures may deteriorate.
Management assessed the effectiveness of the Company’s internal control over financial reporting as of December 31,2004. In making this assessment, we used the criteria set forth by the Committee of Sponsoring Organizations of theTreadway Commission in Internal Control — Integrated Framework. Based on our assessment we concluded that, as ofDecember 31, 2004, the Company’s internal control over financial reporting was effective based on those criteria.
Our management’s assessment of the effectiveness of the Company’s internal control over financial reporting as ofDecember 31, 2004 has been audited by PricewaterhouseCoopers LLP, an independent registered public accounting firm,as stated in their report which appears on page A-4.
James W. OwensChairman of the Board
David B. BurrittChief Financial Officer
February 24, 2005
MANAGEMENT’S REPORT ON Caterpillar Inc.INTERNAL CONTROL OVER FINANCIAL REPORTING
A-3

REPORT OF INDEPENDENT REGISTERED PUBLIC ACCOUNTING FIRM
TO THE BOARD OF DIRECTORS AND STOCKHOLDERS OF CATERPILLAR INC.:
We have completed an integrated audit of Caterpillar Inc.’s 2004 consolidated financial statements and of its internal control overfinancial reporting as of December 31, 2004 and audits of its 2003 and 2002 consolidated financial statements in accordance with thestandards of the Public Company Accounting Oversight Board (United States). Our opinions, based on our audits, are presented below.
Consolidated financial statementsIn our opinion, the accompanying statements of consolidated financial position and the related statements of consolidated results ofoperations, changes in stockholders’ equity and consolidated cash flow, including pages A-5 through A-34, present fairly, in all materialrespects, the financial position of Caterpillar Inc. and its subsidiaries at December 31, 2004 and 2003, and the results of their operationsand their cash flows for each of the three years in the period ended December 31, 2004 in conformity with accounting principles generallyaccepted in the United States of America. These financial statements are the responsibility of the Company’s management. Our respon-sibility is to express an opinion on these financial statements based on our audits. We conducted our audits of these statements inaccordance with the standards of the Public Company Accounting Oversight Board (United States). Those standards require that weplan and perform the audit to obtain reasonable assurance about whether the financial statements are free of material misstatement.An audit of financial statements includes examining, on a test basis, evidence supporting the amounts and disclosures in the financialstatements, assessing the accounting principles used and significant estimates made by management, and evaluating the overall financialstatement presentation. We believe that our audits provide a reasonable basis for our opinion.
Internal control over financial reportingAlso, in our opinion, management’s assessment, included in Management’s Report on Internal Control Over Financial Reportingappearing on page A-3, that the Company maintained effective internal control over financial reporting as of December 31, 2004based on criteria established in Internal Control — Integrated Framework issued by the Committee of Sponsoring Organizations ofthe Treadway Commission (COSO), is fairly stated, in all material respects, based on those criteria. Furthermore, in our opinion, theCompany maintained, in all material respects, effective internal control over financial reporting as of December 31, 2004, based oncriteria established in Internal Control — Integrated Framework issued by COSO. The Company’s management is responsible for main-taining effective internal control over financial reporting and for its assessment of the effectiveness of internal control over financialreporting. Our responsibility is to express opinions on management’s assessment and on the effectiveness of the Company’s internalcontrol over financial reporting based on our audit. We conducted our audit of internal control over financial reporting in accordancewith the standards of the Public Company Accounting Oversight Board (United States). Those standards require that we plan andperform the audit to obtain reasonable assurance about whether effective internal control over financial reporting was maintained inall material respects. An audit of internal control over financial reporting includes obtaining an understanding of internal control overfinancial reporting, evaluating management’s assessment, testing and evaluating the design and operating effectiveness of internalcontrol, and performing such other procedures as we consider necessary in the circumstances. We believe that our audit provides areasonable basis for our opinions.
A company’s internal control over financial reporting is a process designed to provide reasonable assurance regarding the reliabilityof financial reporting and the preparation of financial statements for external purposes in accordance with generally accepted accountingprinciples. A company’s internal control over financial reporting includes those policies and procedures that (i) pertain to the main-tenance of records that, in reasonable detail, accurately and fairly reflect the transactions and dispositions of the assets of the company;(ii) provide reasonable assurance that transactions are recorded as necessary to permit preparation of financial statements in accordancewith generally accepted accounting principles, and that receipts and expenditures of the company are being made only in accordancewith authorizations of management and directors of the company; and (iii) provide reasonable assurance regarding prevention ortimely detection of unauthorized acquisition, use, or disposition of the company’s assets that could have a material effect on the finan-cial statements.
Because of its inherent limitations, internal control over financial reporting may not prevent or detect misstatements. Also, projectionsof any evaluation of effectiveness to future periods are subject to the risk that controls may become inadequate because of changes inconditions, or that the degree of compliance with the policies or procedures may deteriorate.
Peoria, IllinoisFebruary 24, 2005
A-4

STATEMENT 1 Caterpillar Inc.Consolidated Results of Operations for the Years Ended December 31(Dollars in millions except per share data)
A-5
2004 2003 2002________ _______ _______Sales and revenues:
Sales of Machinery and Engines . . . . . . . . . . . . . . . . . . . . . . . . . . . . . . . . . . . . . . . . . . . . . . . . . . . . . . . . . . . . . . . . . . . . . . . . . . . . . . . . . . . . . . . . . . . . . . . . . . . . . . . . . . . $28,336 $21,048 $18,648Revenues of Financial Products. . . . . . . . . . . . . . . . . . . . . . . . . . . . . . . . . . . . . . . . . . . . . . . . . . . . . . . . . . . . . . . . . . . . . . . . . . . . . . . . . . . . . . . . . . . . . . . . . . . . . . . . . . . . 1,915 1,715 1,504________ _______ _______
Total sales and revenues . . . . . . . . . . . . . . . . . . . . . . . . . . . . . . . . . . . . . . . . . . . . . . . . . . . . . . . . . . . . . . . . . . . . . . . . . . . . . . . . . . . . . . . . . . . . . . . . . . . . . . . . . . . . . . . 30,251 22,763 20,152
Operating costs:Cost of goods sold. . . . . . . . . . . . . . . . . . . . . . . . . . . . . . . . . . . . . . . . . . . . . . . . . . . . . . . . . . . . . . . . . . . . . . . . . . . . . . . . . . . . . . . . . . . . . . . . . . . . . . . . . . . . . . . . . . . . . . . . . . 22,420 16,945 15,146Selling, general and administrative expenses . . . . . . . . . . . . . . . . . . . . . . . . . . . . . . . . . . . . . . . . . . . . . . . . . . . . . . . . . . . . . . . . . . . . . . . . . . . . . . . . . . . . . . . . . . . . . 3,072 2,470 2,094Research and development expenses. . . . . . . . . . . . . . . . . . . . . . . . . . . . . . . . . . . . . . . . . . . . . . . . . . . . . . . . . . . . . . . . . . . . . . . . . . . . . . . . . . . . . . . . . . . . . . . . . . . . . . 928 669 656Interest expense of Financial Products . . . . . . . . . . . . . . . . . . . . . . . . . . . . . . . . . . . . . . . . . . . . . . . . . . . . . . . . . . . . . . . . . . . . . . . . . . . . . . . . . . . . . . . . . . . . . . . . . . . . 520 470 521Other operating expenses . . . . . . . . . . . . . . . . . . . . . . . . . . . . . . . . . . . . . . . . . . . . . . . . . . . . . . . . . . . . . . . . . . . . . . . . . . . . . . . . . . . . . . . . . . . . . . . . . . . . . . . . . . . . . . . . . . 578 521 411________ _______ _______
Total operating costs . . . . . . . . . . . . . . . . . . . . . . . . . . . . . . . . . . . . . . . . . . . . . . . . . . . . . . . . . . . . . . . . . . . . . . . . . . . . . . . . . . . . . . . . . . . . . . . . . . . . . . . . . . . . . . . . . . . 27,518 21,075 18,828________ _______ _______
Operating profit . . . . . . . . . . . . . . . . . . . . . . . . . . . . . . . . . . . . . . . . . . . . . . . . . . . . . . . . . . . . . . . . . . . . . . . . . . . . . . . . . . . . . . . . . . . . . . . . . . . . . . . . . . . . . . . . . . . . . . . . . . . . . . 2,733 1,688 1,324
Interest expense excluding Financial Products. . . . . . . . . . . . . . . . . . . . . . . . . . . . . . . . . . . . . . . . . . . . . . . . . . . . . . . . . . . . . . . . . . . . . . . . . . . . . . . . . . . . . . . . . . . . 230 246 279Other income (expense) . . . . . . . . . . . . . . . . . . . . . . . . . . . . . . . . . . . . . . . . . . . . . . . . . . . . . . . . . . . . . . . . . . . . . . . . . . . . . . . . . . . . . . . . . . . . . . . . . . . . . . . . . . . . . . . . . . . . 204 35 69________ _______ _______
Consolidated profit before taxes . . . . . . . . . . . . . . . . . . . . . . . . . . . . . . . . . . . . . . . . . . . . . . . . . . . . . . . . . . . . . . . . . . . . . . . . . . . . . . . . . . . . . . . . . . . . . . . . . . . . . . . . . 2,707 1,477 1,114Provision for income taxes . . . . . . . . . . . . . . . . . . . . . . . . . . . . . . . . . . . . . . . . . . . . . . . . . . . . . . . . . . . . . . . . . . . . . . . . . . . . . . . . . . . . . . . . . . . . . . . . . . . . . . . . . . . . . . . . . 731 398 312________ _______ _______Profit of consolidated companies . . . . . . . . . . . . . . . . . . . . . . . . . . . . . . . . . . . . . . . . . . . . . . . . . . . . . . . . . . . . . . . . . . . . . . . . . . . . . . . . . . . . . . . . . . . . . . . . . . . . . . . . . . 1,976 1,079 802
Equity in profit (loss) of unconsolidated affiliated companies. . . . . . . . . . . . . . . . . . . . . . . . . . . . . . . . . . . . . . . . . . . . . . . . . . . . . . . . . . . . . . . . . . . . . . . . . . . . 59 20 (4)________ _______ _______Profit . . . . . . . . . . . . . . . . . . . . . . . . . . . . . . . . . . . . . . . . . . . . . . . . . . . . . . . . . . . . . . . . . . . . . . . . . . . . . . . . . . . . . . . . . . . . . . . . . . . . . . . . . . . . . . . . . . . . . . . . . . . . . . . . . . . . . . . . . . . . $ 2,035 $ 1,099 $ 798________ _______ _______________ _______ _______
Profit per common share. . . . . . . . . . . . . . . . . . . . . . . . . . . . . . . . . . . . . . . . . . . . . . . . . . . . . . . . . . . . . . . . . . . . . . . . . . . . . . . . . . . . . . . . . . . . . . . . . . . . . . . . . . . . . . . . . . . $ 5.95 $ 3.18 $ 2.32Profit per common share — diluted(1) . . . . . . . . . . . . . . . . . . . . . . . . . . . . . . . . . . . . . . . . . . . . . . . . . . . . . . . . . . . . . . . . . . . . . . . . . . . . . . . . . . . . . . . . . . . . . . . . . . . $ 5.75 $ 3.13 $ 2.30Weighted-average common shares outstanding (millions)
— Basic. . . . . . . . . . . . . . . . . . . . . . . . . . . . . . . . . . . . . . . . . . . . . . . . . . . . . . . . . . . . . . . . . . . . . . . . . . . . . . . . . . . . . . . . . . . . . . . . . . . . . . . . . . . . . . . . . . . . . . . . . . . . . . . . . . . . 342.3 345.2 344.0— Diluted(1) . . . . . . . . . . . . . . . . . . . . . . . . . . . . . . . . . . . . . . . . . . . . . . . . . . . . . . . . . . . . . . . . . . . . . . . . . . . . . . . . . . . . . . . . . . . . . . . . . . . . . . . . . . . . . . . . . . . . . . . . . . . . . . . 353.7 351.4 346.9
Cash dividends declared per common share. . . . . . . . . . . . . . . . . . . . . . . . . . . . . . . . . . . . . . . . . . . . . . . . . . . . . . . . . . . . . . . . . . . . . . . . . . . . . . . . . . . . . . . . . . $ 1.60 $ 1.44 $ 1.40
(1) Diluted by assumed exercise of stock options, using the treasury stock method.
See accompanying Notes to Consolidated Financial Statements.

A-6
2004 2003 2002________________ _______________ _______________Common stock:
Balance at beginning of year . . . . . . . . . . . . . . . . . . . . . . . . . . . . . . . . . . . . . . . . . . . . . . . . . . . . . . . . . . . . . . . . . . . . . . . . . . . . . . . . $ 1,059 $ 1,034 $ 1,043Shares issued from treasury stock . . . . . . . . . . . . . . . . . . . . . . . . . . . . . . . . . . . . . . . . . . . . . . . . . . . . . . . . . . . . . . . . . . . . . . . . . . 172 25 (9)_______ ______ ______Balance at year-end . . . . . . . . . . . . . . . . . . . . . . . . . . . . . . . . . . . . . . . . . . . . . . . . . . . . . . . . . . . . . . . . . . . . . . . . . . . . . . . . . . . . . . . . . . 1,231 1,059 1,034_______ ______ ______
Treasury stock:Balance at beginning of year . . . . . . . . . . . . . . . . . . . . . . . . . . . . . . . . . . . . . . . . . . . . . . . . . . . . . . . . . . . . . . . . . . . . . . . . . . . . . . . . (2,914) (2,669) (2,696)Shares issued: 2004 — 6,108,309; 2003 — 4,956,973; 2002 — 878,623. . . . . . . . . . . . . . . . . . . . . . . . . . . . . 176 160 27Shares repurchased: 2004 — 6,933,400; 2003 — 5,450,000 . . . . . . . . . . . . . . . . . . . . . . . . . . . . . . . . . . . . . . . . . . . (539) (405) —_______ ______ ______Balance at year-end . . . . . . . . . . . . . . . . . . . . . . . . . . . . . . . . . . . . . . . . . . . . . . . . . . . . . . . . . . . . . . . . . . . . . . . . . . . . . . . . . . . . . . . . . . (3,277) (2,914) (2,669)_______ ______ ______
Profit employed in the business:Balance at beginning of year . . . . . . . . . . . . . . . . . . . . . . . . . . . . . . . . . . . . . . . . . . . . . . . . . . . . . . . . . . . . . . . . . . . . . . . . . . . . . . . . 8,450 7,849 7,533Profit . . . . . . . . . . . . . . . . . . . . . . . . . . . . . . . . . . . . . . . . . . . . . . . . . . . . . . . . . . . . . . . . . . . . . . . . . . . . . . . . . . . . . . . . . . . . . . . . . . . . . . . . . . 2,035 $2,035 1,099 $ 1,099 798 $ 798Dividends declared . . . . . . . . . . . . . . . . . . . . . . . . . . . . . . . . . . . . . . . . . . . . . . . . . . . . . . . . . . . . . . . . . . . . . . . . . . . . . . . . . . . . . . . . . . (548) (498) (482)_______ ______ ______Balance at year-end . . . . . . . . . . . . . . . . . . . . . . . . . . . . . . . . . . . . . . . . . . . . . . . . . . . . . . . . . . . . . . . . . . . . . . . . . . . . . . . . . . . . . . . . . . 9,937 8,450 7,849_______ ______ ______
Accumulated other comprehensive income:Foreign currency translation adjustment:
Balance at beginning of year . . . . . . . . . . . . . . . . . . . . . . . . . . . . . . . . . . . . . . . . . . . . . . . . . . . . . . . . . . . . . . . . . . . . . . . . . . . . 348 86 (17)Aggregate adjustment for year . . . . . . . . . . . . . . . . . . . . . . . . . . . . . . . . . . . . . . . . . . . . . . . . . . . . . . . . . . . . . . . . . . . . . . . . . . 141 141 262 262 103 103_______ ______ ______Balance at year-end. . . . . . . . . . . . . . . . . . . . . . . . . . . . . . . . . . . . . . . . . . . . . . . . . . . . . . . . . . . . . . . . . . . . . . . . . . . . . . . . . . . . . . 489 348 86_______ ______ ______
Minimum pension liability adjustment — consolidated companies:Balance at beginning of year (net of tax of: 2004 — $460; 2003 — $383; 2002 — $82) . . . . . . . . . (934) (771) (161)Aggregate adjustment for year (net of tax of: 2004 — $25; 2003 — $77; 2002 — $301) . . . . . . . . . (59) (59) (163) (163) (610) (610)_______ ______ ______Balance at year-end (net of tax of: 2004 — $485; 2003 — $460; 2002 — $383). . . . . . . . . . . . . . . . . . (993) (934) (771)_______ ______ ______
Minimum pension liability adjustment — unconsolidated companies:Balance at beginning of year . . . . . . . . . . . . . . . . . . . . . . . . . . . . . . . . . . . . . . . . . . . . . . . . . . . . . . . . . . . . . . . . . . . . . . . . . . . . (48) (37) (41)Aggregate adjustment for year . . . . . . . . . . . . . . . . . . . . . . . . . . . . . . . . . . . . . . . . . . . . . . . . . . . . . . . . . . . . . . . . . . . . . . . . . . — — (11) (11) 4 4_______ ______ ______Balance at year-end. . . . . . . . . . . . . . . . . . . . . . . . . . . . . . . . . . . . . . . . . . . . . . . . . . . . . . . . . . . . . . . . . . . . . . . . . . . . . . . . . . . . . . (48) (48) (37)_______ ______ ______
Derivative financial instruments:Balance at beginning of year (net of tax of: 2004 — $54; 2003 — $5; 2002 — $17). . . . . . . . . . . . . . 104 11 (26)Gains deferred during year (net of tax of: 2004 — $48; 2003 — $29; 2002 — $10) . . . . . . . . . . . . . . 90 90 53 53 15 15(Gains)/losses reclassified to earnings during year
(net of tax of: 2004 — $44; 2003 — $20; 2002 — $11) . . . . . . . . . . . . . . . . . . . . . . . . . . . . . . . . . . . . . . . . (84) (84) 40 40 22 22_______ ______ ______Balance at year-end (net of tax of: 2004 — $58; 2003 — $54; 2002 — $4) . . . . . . . . . . . . . . . . . . . . . . . 110 104 11_______ ______ ______
Available-for-sale securities:Balance at beginning of year (net of tax of: 2004 — $7; 2003 — $17; 2002 — $13). . . . . . . . . . . . . . 13 (31) (24)Gains/(losses) deferred during year (net of tax of: 2004 — $3; 2003 — $12; 2002 — $16). . . . . . 6 6 23 23 (29) (29)(Gains)/losses reclassified to earnings during year
(net of tax of: 2004 — $1; 2003 — $11; 2002 — $12). . . . . . . . . . . . . . . . . . . . . . . . . . . . . . . . . . . . . . . . . . (1) (1) 21 21 22 22_______ ______ ______ ______ ______ ______Balance at year-end (net of tax of: 2004 — $10; 2003 — $7; 2002 — $17) . . . . . . . . . . . . . . . . . . . . . . . 18 13 (31)_______ ______ ______
Total accumulated other comprehensive income . . . . . . . . . . . . . . . . . . . . . . . . . . . . . . . . . . . . . . . . . . . . . . . . . . . . . (424) (517) (742)_______ ______ ______Comprehensive income . . . . . . . . . . . . . . . . . . . . . . . . . . . . . . . . . . . . . . . . . . . . . . . . . . . . . . . . . . . . . . . . . . . . . . . . . . . . . . . . . . . . . $2,128 $ 1,324 $ 325______ ______ ____________ ______ ______
Stockholders’ equity at year-end. . . . . . . . . . . . . . . . . . . . . . . . . . . . . . . . . . . . . . . . . . . . . . . . . . . . . . . . . . . . . . . . . . . . . . . . . . $ 7,467 $ 6,078 $ 5,472_______ ______ _____________ ______ ______
STATEMENT 2Changes in Consolidated Stockholders’ Equity for the Years Ended December 31(Dollars in millions)
See accompanying Notes to Consolidated Financial Statements.
A-7
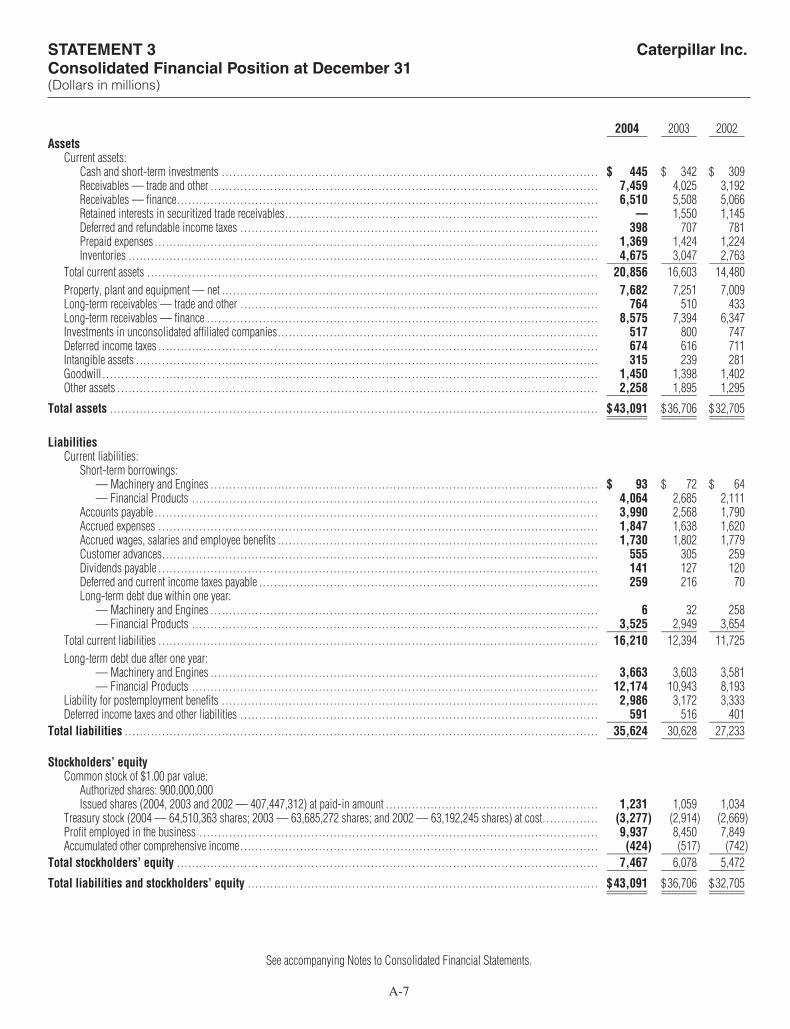
STATEMENT 3 Caterpillar Inc.Consolidated Financial Position at December 31(Dollars in millions)
2004 2003 2002________ _______ _______Assets
Current assets:Cash and short-term investments . . . . . . . . . . . . . . . . . . . . . . . . . . . . . . . . . . . . . . . . . . . . . . . . . . . . . . . . . . . . . . . . . . . . . . . . . . . . . . . . . . . . . . . . . . . . . . . . . . . . . $ 445 $ 342 $ 309Receivables — trade and other . . . . . . . . . . . . . . . . . . . . . . . . . . . . . . . . . . . . . . . . . . . . . . . . . . . . . . . . . . . . . . . . . . . . . . . . . . . . . . . . . . . . . . . . . . . . . . . . . . . . . . . . 7,459 4,025 3,192Receivables — finance. . . . . . . . . . . . . . . . . . . . . . . . . . . . . . . . . . . . . . . . . . . . . . . . . . . . . . . . . . . . . . . . . . . . . . . . . . . . . . . . . . . . . . . . . . . . . . . . . . . . . . . . . . . . . . . . . 6,510 5,508 5,066Retained interests in securitized trade receivables. . . . . . . . . . . . . . . . . . . . . . . . . . . . . . . . . . . . . . . . . . . . . . . . . . . . . . . . . . . . . . . . . . . . . . . . . . . . . . . . . . . . — 1,550 1,145Deferred and refundable income taxes . . . . . . . . . . . . . . . . . . . . . . . . . . . . . . . . . . . . . . . . . . . . . . . . . . . . . . . . . . . . . . . . . . . . . . . . . . . . . . . . . . . . . . . . . . . . . . . . 398 707 781Prepaid expenses . . . . . . . . . . . . . . . . . . . . . . . . . . . . . . . . . . . . . . . . . . . . . . . . . . . . . . . . . . . . . . . . . . . . . . . . . . . . . . . . . . . . . . . . . . . . . . . . . . . . . . . . . . . . . . . . . . . . . . . 1,369 1,424 1,224Inventories . . . . . . . . . . . . . . . . . . . . . . . . . . . . . . . . . . . . . . . . . . . . . . . . . . . . . . . . . . . . . . . . . . . . . . . . . . . . . . . . . . . . . . . . . . . . . . . . . . . . . . . . . . . . . . . . . . . . . . . . . . . . . . 4,675 3,047 2,763________ _______ _______
Total current assets . . . . . . . . . . . . . . . . . . . . . . . . . . . . . . . . . . . . . . . . . . . . . . . . . . . . . . . . . . . . . . . . . . . . . . . . . . . . . . . . . . . . . . . . . . . . . . . . . . . . . . . . . . . . . . . . . . . . . . . . . 20,856 16,603 14,480Property, plant and equipment — net . . . . . . . . . . . . . . . . . . . . . . . . . . . . . . . . . . . . . . . . . . . . . . . . . . . . . . . . . . . . . . . . . . . . . . . . . . . . . . . . . . . . . . . . . . . . . . . . . . . . . 7,682 7,251 7,009Long-term receivables — trade and other . . . . . . . . . . . . . . . . . . . . . . . . . . . . . . . . . . . . . . . . . . . . . . . . . . . . . . . . . . . . . . . . . . . . . . . . . . . . . . . . . . . . . . . . . . . . . . . . 764 510 433Long-term receivables — finance . . . . . . . . . . . . . . . . . . . . . . . . . . . . . . . . . . . . . . . . . . . . . . . . . . . . . . . . . . . . . . . . . . . . . . . . . . . . . . . . . . . . . . . . . . . . . . . . . . . . . . . . . 8,575 7,394 6,347Investments in unconsolidated affiliated companies. . . . . . . . . . . . . . . . . . . . . . . . . . . . . . . . . . . . . . . . . . . . . . . . . . . . . . . . . . . . . . . . . . . . . . . . . . . . . . . . . . . . . . 517 800 747Deferred income taxes . . . . . . . . . . . . . . . . . . . . . . . . . . . . . . . . . . . . . . . . . . . . . . . . . . . . . . . . . . . . . . . . . . . . . . . . . . . . . . . . . . . . . . . . . . . . . . . . . . . . . . . . . . . . . . . . . . . . . . 674 616 711Intangible assets . . . . . . . . . . . . . . . . . . . . . . . . . . . . . . . . . . . . . . . . . . . . . . . . . . . . . . . . . . . . . . . . . . . . . . . . . . . . . . . . . . . . . . . . . . . . . . . . . . . . . . . . . . . . . . . . . . . . . . . . . . . . 315 239 281Goodwill . . . . . . . . . . . . . . . . . . . . . . . . . . . . . . . . . . . . . . . . . . . . . . . . . . . . . . . . . . . . . . . . . . . . . . . . . . . . . . . . . . . . . . . . . . . . . . . . . . . . . . . . . . . . . . . . . . . . . . . . . . . . . . . . . . . . . 1,450 1,398 1,402Other assets . . . . . . . . . . . . . . . . . . . . . . . . . . . . . . . . . . . . . . . . . . . . . . . . . . . . . . . . . . . . . . . . . . . . . . . . . . . . . . . . . . . . . . . . . . . . . . . . . . . . . . . . . . . . . . . . . . . . . . . . . . . . . . . . . 2,258 1,895 1,295________ _______ _______
Total assets . . . . . . . . . . . . . . . . . . . . . . . . . . . . . . . . . . . . . . . . . . . . . . . . . . . . . . . . . . . . . . . . . . . . . . . . . . . . . . . . . . . . . . . . . . . . . . . . . . . . . . . . . . . . . . . . . . . . . . . . . . . . . . . . . . . $43,091 $36,706 $32,705________ _______ _______________ _______ _______
LiabilitiesCurrent liabilities:
Short-term borrowings:— Machinery and Engines . . . . . . . . . . . . . . . . . . . . . . . . . . . . . . . . . . . . . . . . . . . . . . . . . . . . . . . . . . . . . . . . . . . . . . . . . . . . . . . . . . . . . . . . . . . . . . . . . . . . . . . . $ 93 $ 72 $ 64— Financial Products . . . . . . . . . . . . . . . . . . . . . . . . . . . . . . . . . . . . . . . . . . . . . . . . . . . . . . . . . . . . . . . . . . . . . . . . . . . . . . . . . . . . . . . . . . . . . . . . . . . . . . . . . . . . . 4,064 2,685 2,111
Accounts payable . . . . . . . . . . . . . . . . . . . . . . . . . . . . . . . . . . . . . . . . . . . . . . . . . . . . . . . . . . . . . . . . . . . . . . . . . . . . . . . . . . . . . . . . . . . . . . . . . . . . . . . . . . . . . . . . . . . . . . . 3,990 2,568 1,790Accrued expenses . . . . . . . . . . . . . . . . . . . . . . . . . . . . . . . . . . . . . . . . . . . . . . . . . . . . . . . . . . . . . . . . . . . . . . . . . . . . . . . . . . . . . . . . . . . . . . . . . . . . . . . . . . . . . . . . . . . . . . 1,847 1,638 1,620Accrued wages, salaries and employee benefits . . . . . . . . . . . . . . . . . . . . . . . . . . . . . . . . . . . . . . . . . . . . . . . . . . . . . . . . . . . . . . . . . . . . . . . . . . . . . . . . . . . . . . 1,730 1,802 1,779Customer advances. . . . . . . . . . . . . . . . . . . . . . . . . . . . . . . . . . . . . . . . . . . . . . . . . . . . . . . . . . . . . . . . . . . . . . . . . . . . . . . . . . . . . . . . . . . . . . . . . . . . . . . . . . . . . . . . . . . . . 555 305 259Dividends payable . . . . . . . . . . . . . . . . . . . . . . . . . . . . . . . . . . . . . . . . . . . . . . . . . . . . . . . . . . . . . . . . . . . . . . . . . . . . . . . . . . . . . . . . . . . . . . . . . . . . . . . . . . . . . . . . . . . . . . 141 127 120Deferred and current income taxes payable . . . . . . . . . . . . . . . . . . . . . . . . . . . . . . . . . . . . . . . . . . . . . . . . . . . . . . . . . . . . . . . . . . . . . . . . . . . . . . . . . . . . . . . . . . . 259 216 70Long-term debt due within one year:
— Machinery and Engines . . . . . . . . . . . . . . . . . . . . . . . . . . . . . . . . . . . . . . . . . . . . . . . . . . . . . . . . . . . . . . . . . . . . . . . . . . . . . . . . . . . . . . . . . . . . . . . . . . . . . . . . 6 32 258— Financial Products . . . . . . . . . . . . . . . . . . . . . . . . . . . . . . . . . . . . . . . . . . . . . . . . . . . . . . . . . . . . . . . . . . . . . . . . . . . . . . . . . . . . . . . . . . . . . . . . . . . . . . . . . . . . . 3,525 2,949 3,654________ _______ _______
Total current liabilities . . . . . . . . . . . . . . . . . . . . . . . . . . . . . . . . . . . . . . . . . . . . . . . . . . . . . . . . . . . . . . . . . . . . . . . . . . . . . . . . . . . . . . . . . . . . . . . . . . . . . . . . . . . . . . . . . . . . . . 16,210 12,394 11,725Long-term debt due after one year:
— Machinery and Engines . . . . . . . . . . . . . . . . . . . . . . . . . . . . . . . . . . . . . . . . . . . . . . . . . . . . . . . . . . . . . . . . . . . . . . . . . . . . . . . . . . . . . . . . . . . . . . . . . . . . . . . . 3,663 3,603 3,581— Financial Products . . . . . . . . . . . . . . . . . . . . . . . . . . . . . . . . . . . . . . . . . . . . . . . . . . . . . . . . . . . . . . . . . . . . . . . . . . . . . . . . . . . . . . . . . . . . . . . . . . . . . . . . . . . . . 12,174 10,943 8,193
Liability for postemployment benefits . . . . . . . . . . . . . . . . . . . . . . . . . . . . . . . . . . . . . . . . . . . . . . . . . . . . . . . . . . . . . . . . . . . . . . . . . . . . . . . . . . . . . . . . . . . . . . . . . . . . . 2,986 3,172 3,333Deferred income taxes and other liabilities . . . . . . . . . . . . . . . . . . . . . . . . . . . . . . . . . . . . . . . . . . . . . . . . . . . . . . . . . . . . . . . . . . . . . . . . . . . . . . . . . . . . . . . . . . . . . . . . 591 516 401________ _______ _______
Total liabilities . . . . . . . . . . . . . . . . . . . . . . . . . . . . . . . . . . . . . . . . . . . . . . . . . . . . . . . . . . . . . . . . . . . . . . . . . . . . . . . . . . . . . . . . . . . . . . . . . . . . . . . . . . . . . . . . . . . . . . . . . . . . . . . 35,624 30,628 27,233________ _______ _______
Stockholders’ equityCommon stock of $1.00 par value:
Authorized shares: 900,000,000Issued shares (2004, 2003 and 2002 — 407,447,312) at paid-in amount . . . . . . . . . . . . . . . . . . . . . . . . . . . . . . . . . . . . . . . . . . . . . . . . . . . . . . . . . 1,231 1,059 1,034
Treasury stock (2004 — 64,510,363 shares; 2003 — 63,685,272 shares; and 2002 — 63,192,245 shares) at cost. . . . . . . . . . . . . . . (3,277) (2,914) (2,669)Profit employed in the business . . . . . . . . . . . . . . . . . . . . . . . . . . . . . . . . . . . . . . . . . . . . . . . . . . . . . . . . . . . . . . . . . . . . . . . . . . . . . . . . . . . . . . . . . . . . . . . . . . . . . . . . . . . 9,937 8,450 7,849Accumulated other comprehensive income . . . . . . . . . . . . . . . . . . . . . . . . . . . . . . . . . . . . . . . . . . . . . . . . . . . . . . . . . . . . . . . . . . . . . . . . . . . . . . . . . . . . . . . . . . . . . . . . (424) (517) (742)________ _______ _______
Total stockholders’ equity . . . . . . . . . . . . . . . . . . . . . . . . . . . . . . . . . . . . . . . . . . . . . . . . . . . . . . . . . . . . . . . . . . . . . . . . . . . . . . . . . . . . . . . . . . . . . . . . . . . . . . . . . . . . . . . . . 7,467 6,078 5,472________ _______ _______
Total liabilities and stockholders’ equity . . . . . . . . . . . . . . . . . . . . . . . . . . . . . . . . . . . . . . . . . . . . . . . . . . . . . . . . . . . . . . . . . . . . . . . . . . . . . . . . . . . . . . . . . . . . . . $43,091 $36,706 $32,705________ _______ _______________ _______ _______
See accompanying Notes to Consolidated Financial Statements.

2004 2003 2002________ _______ _______Cash flow from operating activities:
Profit . . . . . . . . . . . . . . . . . . . . . . . . . . . . . . . . . . . . . . . . . . . . . . . . . . . . . . . . . . . . . . . . . . . . . . . . . . . . . . . . . . . . . . . . . . . . . . . . . . . . . . . . . . . . . . . . . . . . . . . . . . . . . . . . . . . . . . . . . $ 2,035 $ 1,099 $ 798Adjustments for non-cash items:
Depreciation and amortization . . . . . . . . . . . . . . . . . . . . . . . . . . . . . . . . . . . . . . . . . . . . . . . . . . . . . . . . . . . . . . . . . . . . . . . . . . . . . . . . . . . . . . . . . . . . . . . . . . . . . . . . . 1,397 1,347 1,220Other. . . . . . . . . . . . . . . . . . . . . . . . . . . . . . . . . . . . . . . . . . . . . . . . . . . . . . . . . . . . . . . . . . . . . . . . . . . . . . . . . . . . . . . . . . . . . . . . . . . . . . . . . . . . . . . . . . . . . . . . . . . . . . . . . . . . . (113) (69) 350
Changes in assets and liabilities:Receivables — trade and other (see non-cash item below) . . . . . . . . . . . . . . . . . . . . . . . . . . . . . . . . . . . . . . . . . . . . . . . . . . . . . . . . . . . . . . . . . . . . . . . . . . (7,616) (8,115) (6,323)Inventories . . . . . . . . . . . . . . . . . . . . . . . . . . . . . . . . . . . . . . . . . . . . . . . . . . . . . . . . . . . . . . . . . . . . . . . . . . . . . . . . . . . . . . . . . . . . . . . . . . . . . . . . . . . . . . . . . . . . . . . . . . . . . . (1,391) (286) 162Accounts payable and accrued expenses. . . . . . . . . . . . . . . . . . . . . . . . . . . . . . . . . . . . . . . . . . . . . . . . . . . . . . . . . . . . . . . . . . . . . . . . . . . . . . . . . . . . . . . . . . . . . . 1,457 542 97Other — net . . . . . . . . . . . . . . . . . . . . . . . . . . . . . . . . . . . . . . . . . . . . . . . . . . . . . . . . . . . . . . . . . . . . . . . . . . . . . . . . . . . . . . . . . . . . . . . . . . . . . . . . . . . . . . . . . . . . . . . . . . . . 240 (129) (266)________ _______ _______
Net cash used for operating activities . . . . . . . . . . . . . . . . . . . . . . . . . . . . . . . . . . . . . . . . . . . . . . . . . . . . . . . . . . . . . . . . . . . . . . . . . . . . . . . . . . . . . . . . . . . . . . . . . . . . . . . . . . (3,991) (5,611) (3,962)________ _______ _______
Cash flow from investing activities:Capital expenditures — excluding equipment leased to others. . . . . . . . . . . . . . . . . . . . . . . . . . . . . . . . . . . . . . . . . . . . . . . . . . . . . . . . . . . . . . . . . . . . . . . . . . (926) (682) (728)Expenditures for equipment leased to others. . . . . . . . . . . . . . . . . . . . . . . . . . . . . . . . . . . . . . . . . . . . . . . . . . . . . . . . . . . . . . . . . . . . . . . . . . . . . . . . . . . . . . . . . . . . . . (1,188) (1,083) (1,045)Proceeds from disposals of property, plant and equipment . . . . . . . . . . . . . . . . . . . . . . . . . . . . . . . . . . . . . . . . . . . . . . . . . . . . . . . . . . . . . . . . . . . . . . . . . . . . . . 673 761 561Additions to finance receivables . . . . . . . . . . . . . . . . . . . . . . . . . . . . . . . . . . . . . . . . . . . . . . . . . . . . . . . . . . . . . . . . . . . . . . . . . . . . . . . . . . . . . . . . . . . . . . . . . . . . . . . . . . . (8,930) (6,868) (5,933)Collections of finance receivables . . . . . . . . . . . . . . . . . . . . . . . . . . . . . . . . . . . . . . . . . . . . . . . . . . . . . . . . . . . . . . . . . . . . . . . . . . . . . . . . . . . . . . . . . . . . . . . . . . . . . . . . . 6,216 5,251 4,569Proceeds from sale of finance receivables. . . . . . . . . . . . . . . . . . . . . . . . . . . . . . . . . . . . . . . . . . . . . . . . . . . . . . . . . . . . . . . . . . . . . . . . . . . . . . . . . . . . . . . . . . . . . . . . . 700 661 613Collections of retained interests in securitized trade receivables . . . . . . . . . . . . . . . . . . . . . . . . . . . . . . . . . . . . . . . . . . . . . . . . . . . . . . . . . . . . . . . . . . . . . . . . 5,722 7,129 5,917Investments and acquisitions (net of cash acquired) . . . . . . . . . . . . . . . . . . . . . . . . . . . . . . . . . . . . . . . . . . . . . . . . . . . . . . . . . . . . . . . . . . . . . . . . . . . . . . . . . . . . . (290) (268) (294)Proceeds from sale of partnership investment . . . . . . . . . . . . . . . . . . . . . . . . . . . . . . . . . . . . . . . . . . . . . . . . . . . . . . . . . . . . . . . . . . . . . . . . . . . . . . . . . . . . . . . . . . . . 290 — —Other — net. . . . . . . . . . . . . . . . . . . . . . . . . . . . . . . . . . . . . . . . . . . . . . . . . . . . . . . . . . . . . . . . . . . . . . . . . . . . . . . . . . . . . . . . . . . . . . . . . . . . . . . . . . . . . . . . . . . . . . . . . . . . . . . . . (190) (17) (40)________ _______ _______
Net cash provided by investing activities . . . . . . . . . . . . . . . . . . . . . . . . . . . . . . . . . . . . . . . . . . . . . . . . . . . . . . . . . . . . . . . . . . . . . . . . . . . . . . . . . . . . . . . . . . . . . . . . . . . . . . 2,077 4,884 3,620________ _______ _______
Cash flow from financing activities:Dividends paid . . . . . . . . . . . . . . . . . . . . . . . . . . . . . . . . . . . . . . . . . . . . . . . . . . . . . . . . . . . . . . . . . . . . . . . . . . . . . . . . . . . . . . . . . . . . . . . . . . . . . . . . . . . . . . . . . . . . . . . . . . . . . . (534) (491) (481)Common stock issued, including treasury shares reissued . . . . . . . . . . . . . . . . . . . . . . . . . . . . . . . . . . . . . . . . . . . . . . . . . . . . . . . . . . . . . . . . . . . . . . . . . . . . . . 317 157 10Treasury shares purchased . . . . . . . . . . . . . . . . . . . . . . . . . . . . . . . . . . . . . . . . . . . . . . . . . . . . . . . . . . . . . . . . . . . . . . . . . . . . . . . . . . . . . . . . . . . . . . . . . . . . . . . . . . . . . . . . . (539) (405) —Proceeds from long-term debt issued:
— Machinery and Engines . . . . . . . . . . . . . . . . . . . . . . . . . . . . . . . . . . . . . . . . . . . . . . . . . . . . . . . . . . . . . . . . . . . . . . . . . . . . . . . . . . . . . . . . . . . . . . . . . . . . . . . . . . . . 9 128 248— Financial Products. . . . . . . . . . . . . . . . . . . . . . . . . . . . . . . . . . . . . . . . . . . . . . . . . . . . . . . . . . . . . . . . . . . . . . . . . . . . . . . . . . . . . . . . . . . . . . . . . . . . . . . . . . . . . . . . . . 5,079 5,506 3,889
Payments on long-term debt:— Machinery and Engines . . . . . . . . . . . . . . . . . . . . . . . . . . . . . . . . . . . . . . . . . . . . . . . . . . . . . . . . . . . . . . . . . . . . . . . . . . . . . . . . . . . . . . . . . . . . . . . . . . . . . . . . . . . . (35) (463) (225)— Financial Products. . . . . . . . . . . . . . . . . . . . . . . . . . . . . . . . . . . . . . . . . . . . . . . . . . . . . . . . . . . . . . . . . . . . . . . . . . . . . . . . . . . . . . . . . . . . . . . . . . . . . . . . . . . . . . . . . . (2,973) (3,774) (3,114)
Short-term borrowings — net . . . . . . . . . . . . . . . . . . . . . . . . . . . . . . . . . . . . . . . . . . . . . . . . . . . . . . . . . . . . . . . . . . . . . . . . . . . . . . . . . . . . . . . . . . . . . . . . . . . . . . . . . . . . . 550 87 (102)________ _______ _______Net cash provided by financing activities . . . . . . . . . . . . . . . . . . . . . . . . . . . . . . . . . . . . . . . . . . . . . . . . . . . . . . . . . . . . . . . . . . . . . . . . . . . . . . . . . . . . . . . . . . . . . . . . . . . . . . 1,874 745 225________ _______ _______Effect of exchange rate changes on cash. . . . . . . . . . . . . . . . . . . . . . . . . . . . . . . . . . . . . . . . . . . . . . . . . . . . . . . . . . . . . . . . . . . . . . . . . . . . . . . . . . . . . . . . . . . . . . . . . . . . . . . 143 15 26________ _______ _______Increase (decrease) in cash and short-term investments . . . . . . . . . . . . . . . . . . . . . . . . . . . . . . . . . . . . . . . . . . . . . . . . . . . . . . . . . . . . . . . . . . . . . . . . . . 103 33 (91)Cash and short-term investments at beginning of period. . . . . . . . . . . . . . . . . . . . . . . . . . . . . . . . . . . . . . . . . . . . . . . . . . . . . . . . . . . . . . . . . . . . . . . . . . . . . . . . . . . . . 342 309 400________ _______ _______
Cash and short-term investments at end of period. . . . . . . . . . . . . . . . . . . . . . . . . . . . . . . . . . . . . . . . . . . . . . . . . . . . . . . . . . . . . . . . . . . . . . . . . . . . . . . . . . . . . . . . . . . . $ 445 $ 342 $ 309________ _______ _______________ _______ _______
All short-term investments, which consist primarily of highly liquid investments with original maturities of three months or less, are considered to be cash equivalents.
Non-cash operating and investing activities:Trade receivables of $6,786 million, $7,534 million and $6,278 million were exchanged for retained interests in securitized trade receivables in 2004, 2003and 2002, respectively. See Note 2 on page A-12 for further discussion.
STATEMENT 4Consolidated Statement of Cash Flow for the Years Ended December 31(Millions of dollars)
A-8
See accompanying Notes to Consolidated Financial Statements.

A-9
1. Operations and summary ofsignificant accounting policies
A. Nature of operationsWe operate in three principal lines of business:
(1) Machinery — A principal line of business which includesthe design, manufacture, marketing and sales of construction,mining and forestry machinery — track and wheel tractors, trackand wheel loaders, pipelayers, motor graders, wheel tractor-scrapers, track and wheel excavators, backhoe loaders, log skid-ders, log loaders, off-highway trucks, articulated trucks, pavingproducts, telescopic handlers, skid steer loaders and related parts.Also includes logistics services for other companies.
(2) Engines — A principal line of business including thedesign, manufacture, marketing and sales of engines for Caterpillarmachinery, electric power generation systems; on-highwayvehicles and locomotives; marine, petroleum, construction,industrial, agricultural and other applications; and related parts.Reciprocating engines meet power needs ranging from 5 to over22,000 horsepower (4 to over 16 200 kilowatts). Turbines rangefrom 1,200 to 20,500 horsepower (900 to 15 000 kilowatts).
(3) Financial Products — A principal line of business consist-ing primarily of Caterpillar Financial Services Corporation (CatFinancial), Caterpillar Insurance Holdings, Inc. (Cat Insurance),Caterpillar Power Ventures Corporation (Cat Power Ventures) andtheir subsidiaries. Cat Financial provides a wide range of financ-ing alternatives for Caterpillar machinery and engines, Solar gasturbines, as well as other equipment and marine vessels. CatFinancial also extends loans to customers and dealers. Cat Insuranceprovides various forms of insurance to customers and dealers tohelp support the purchase and lease of our equipment. Cat PowerVentures is an active investor in independent power projectsusing Caterpillar power generation equipment and services.
Our Machinery and Engines operations are highly integrated.Throughout the Notes, Machinery and Engines represents theaggregate total of these principal lines of business.
Our products are sold primarily under the brands “Caterpillar,”“Cat,” “Solar Turbines,” “MaK,” “Perkins,” “FG Wilson” and“Olympian.”
We conduct operations in our Machinery and Engines lines ofbusiness under highly competitive conditions, including intense pricecompetition. We place great emphasis on the high quality and per-formance of our products and our dealers’ service support. Althoughno one competitor is believed to produce all of the same types ofmachines and engines that we do, there are numerous compa-nies, large and small, which compete with us in the sale of eachof our products.
Machines are distributed principally through a worldwide orga-nization of dealers (dealer network), 53 located in the United Statesand 145 located outside the United States. Worldwide, thesedealers serve 178 countries and operate 3,324 places of business,including 1,437 dealer rental outlets. Reciprocating engines are soldprincipally through the dealer network and to other manufacturersfor use in products manufactured by them. Some of the recipro-cating engines manufactured by Perkins are also sold through aworldwide network of 170 distributors located in 150 countries.Most of the electric power generation systems manufactured byFG Wilson are sold through a worldwide network of 250 dealerslocated in 170 countries. Our dealers do not deal exclusively with our
products; however, in most cases sales and servicing of our prod-ucts are the dealers’ principal business. Turbines and large marinereciprocating engines are sold through sales forces employed bySolar and MaK, respectively. Occasionally, these employees areassisted by independent sales representatives.
Manufacturing activities of the Machinery and Engines lines ofbusiness are conducted in 40 plants in the United States; nine inthe United Kingdom; eight in Italy; five in Mexico; four in China;three each in France, India and Northern Ireland; two each inAustralia, Germany, Brazil, and Japan; and one each in Belgium,Canada, Hungary, Indonesia, The Netherlands, Poland, Russia,South Africa and Switzerland. Thirteen parts distribution centersare located in the United States and twelve are located outside theUnited States.
The Financial Products line of business also conducts opera-tions under highly competitive conditions. Financing for users ofCaterpillar products is available through a variety of competitivesources, principally commercial banks and finance and leasingcompanies. We emphasize prompt and responsive service tomeet customer requirements and offer various financing plansdesigned to increase the opportunity for sales of our products andgenerate financing income for our company. Financial Productsactivity is conducted primarily in the United States, with additionaloffices in Asia, Australia, Canada, Europe and Latin America.
See Note 2 on page A-12 for discussion of the reclassifica-tion of certain receivables and related cash flows.
B. Basis of consolidation
The financial statements include the accounts of Caterpillar Inc.and its subsidiaries. Investments in companies that are owned20% to 50% or are less than 20% owned and for which we havesignificant influence are accounted for by the equity method (seeNote 11 on pages A-18 to A-19). We consolidate all variable inter-est entities where Caterpillar Inc. is the primary beneficiary.
Certain amounts for prior years have been reclassified to con-form with the current-year financial statement presentation. Thesereclassifications had no impact on operating profit.
In the second quarter of 2003, we revised our policy regardingthe classification of certain costs related to distributing replace-ment parts. Previously, these costs had been included in selling,general and administrative expenses and now are included incost of goods sold. This classification is more consistent withindustry practice. The parts distribution costs include shipping andhandling (including warehousing) along with related supportcosts such as information technology, purchasing and inventorymanagement. Prior period amounts have been revised to con-form to the new classification. In 2003 and 2002, the amountsreclassified from selling, general and administrative expenses tocost of goods sold were $443 million and $437 million, respectively.
C. Sales and revenue recognition
Sales of Machinery and Engines are recognized when title trans-fers and the risks and rewards of ownership have passed to cus-tomers or independently owned and operated dealers.
Our standard invoice terms are established by marketing region.When a sale is made to a dealer, the dealer is responsible for pay-ment even if the product is not sold to an end customer and mustmake payment within the standard terms to avoid interest costs.Interest at or above prevailing market rates is charged on any pastdue balance. Our policy is to not forgive this interest. In 2004,
NOTES TO CONSOLIDATED FINANCIAL STATEMENTS

NOTES continued
A-10
2003 and 2002, terms were extended to not more than one yearfor $15 million, $54 million and $193 million of receivables,respectively. For 2004 and 2003, these amounts represent lessthan 1% of consolidated sales. For 2002, this amount representsapproximately 1% of consolidated sales.
Sales with payment terms of two months or more were as follows:(Dollars in millions)
2 $ 96 0.3% $ 116 0.6% $ 62 0.3%3 175 0.6% 27 0.1% 118 0.6%4 117 0.4% 28 0.1% 11 0.1%5 750 2.6% 594 2.8% 447 2.4%6 6,172 21.9% 4,104 19.5% 3,503 18.8%
7-12 831 2.9% 671 3.2% 465 2.5%
We establish a bad debt allowance for Machinery and Enginesreceivables when it becomes probable that the receivable willnot be collected. Our allowance for bad debts is not significant.No significant write-offs of Machinery and Engines receivableswere made during 2004, 2003 or 2002.
Revenues of Financial Products represent primarily financeand lease revenues of Cat Financial. Finance revenues are rec-ognized over the term of the contract at a constant rate of returnon the scheduled uncollected principal balance. Lease revenuesare recognized in the period earned. Recognition of income issuspended when collection of future income is not probable.Accrual is resumed, and previously suspended income is recog-nized, when the receivable becomes contractually current and/orcollection doubts are removed. Cat Financial provides whole-sale inventory financing to dealers. Please refer to Note 7 onpage A-16 for more information.
D. InventoriesInventories are stated at the lower of cost or market. Cost is prin-cipally determined using the last-in, first-out (LIFO) method.The value of inventories on the LIFO basis represented about80% of total inventories at December 31, 2004, 2003 and 2002.
If the FIFO (first-in, first-out) method had been in use, inven-tories would have been $2,124 million, $1,863 million and$1,977 million higher than reported at December 31, 2004, 2003and 2002, respectively.
E. Securitized receivablesWhen retail finance receivables are securitized, we retain interestin the receivables in the form of interest-only strips, servicingrights, cash reserve accounts and subordinated certificates. Gainsor losses on the securitization are dependent on the purchase pricebeing allocated between the carrying value of the securitizedreceivables and the retained interests based on their relative fairvalue. We estimate fair value based on the present value of futureexpected cash flows using key assumptions for credit losses, pre-payment speeds, forward yield curves and discount rates. Pleaserefer to Note 8 on page A-17 for more information.
When trade receivables are securitized, we retain interests inthe receivables in the form of certificates. The fair value of thesecertificated retained interests approximates carrying value dueto their short-term nature. Please refer to Note 6 on page A-16for more information.
F. Depreciation and amortizationDepreciation of plant and equipment is computed principallyusing accelerated methods. Depreciation on equipment leasedto others, primarily for Financial Products, is computed using thestraight-line method over the term of the lease. The depreciablebasis is the original cost of the equipment less the estimated residualvalue of the equipment at the end of the lease term. In 2004, 2003and 2002, Financial Products depreciation on equipment leased toothers was $575 million, $527 million and $415 million, respectively,and was included in “Other operating expenses” in Statement 1.Amortization of purchased intangibles is computed using thestraight-line method, generally not to exceed a period of 20 years.Accumulated amortization was $91 million, $44 million and$47 million at December 31, 2004, 2003 and 2002, respectively.
G. Foreign currency translationThe functional currency for most of our Machinery and Enginesconsolidated companies is the U.S. dollar. The functional currencyfor most of our Financial Products and equity basis companies isthe respective local currency. Gains and losses resulting from thetranslation of foreign currency amounts to the functional currencyare included in “Other income (expense)” in Statement 1. Gainsand losses resulting from translating assets and liabilities from thefunctional currency to U.S. dollars are included in “Accumulatedother comprehensive income” in Statement 3.
H. Derivative financial instrumentsOur earnings and cash flow are subject to fluctuations due tochanges in foreign currency exchange rates, interest rates andcommodity prices. Our Risk Management Policy (policy) allowsfor the use of derivative financial instruments to prudently man-age foreign currency exchange rate, interest rate and commod-ity price exposure. Our policy specifies that derivatives are notto be used for speculative purposes. Derivatives that we use areprimarily foreign currency forward and option contracts, inter-est rate swaps and commodity forward and option contracts. Ourderivative activities are subject to the management, direction andcontrol of our financial officers. Risk management practices, includ-ing the use of financial derivative instruments, are presented tothe Audit Committee of the board of directors at least annually.
All derivatives are recognized on the Consolidated FinancialPosition at their fair value. On the date the derivative contract isentered, we designate the derivative as (1) a hedge of the fairvalue of a recognized liability (“fair value” hedge), (2) a hedgeof a forecasted transaction or the variability of cash flow to bepaid (“cash flow” hedge), or (3) an “undesignated” instrument.Changes in the fair value of a derivative that is qualified, desig-nated and highly effective as a fair value hedge, along with thegain or loss on the hedged liability that is attributable to thehedged risk, are recorded in current earnings. Changes in the fairvalue of a derivative that is qualified, designated and highlyeffective as a cash flow hedge are recorded in other compre-hensive income until earnings are affected by the forecastedtransaction or the variability of cash flow and are then reportedin current earnings. Changes in the fair value of undesignatedderivative instruments and the ineffective portion of designatedderivative instruments are reported in current earnings.
We formally document all relationships between hedginginstruments and hedged items, as well as the risk-managementobjective and strategy for undertaking various hedge transactions.
24.7%$ 4,60626.3%$ 5,54028.7%$8,141
Percentof SalesSales
Percentof SalesSales
Percentof SalesSales
Payment Terms(months)
200220032004
Caterpillar Inc.
A-11
This process includes linking all derivatives that are designatedas fair value hedges to specific liabilities on the ConsolidatedFinancial Position and linking cash flow hedges to specific fore-casted transactions or variability of cash flow.
We also formally assess, both at the hedge’s inception and on anongoing basis, whether the derivatives that are used in hedgingtransactions are highly effective in offsetting changes in fair valuesor cash flow of hedged items. When it is determined that a deriva-tive is not highly effective as a hedge or that it has ceased to be ahighly effective hedge, we discontinue hedge accounting prospec-tively, in accordance with Statement of Financial AccountingStandards No. 133 “Accounting for Derivative Instruments andHedging Activities” (SFAS 133). Please refer to Note 3 on pagesA-13 to A-14 for more information on derivatives.
I. Impairment of available-for-sale securitiesAvailable-for-sale securities are reviewed monthly to identifymarket values below cost of 20% or more. If a decline for a debtsecurity is in excess of 20% for six months, the investment isevaluated to determine if the decline is due to general declinesin the marketplace or if the investment has been impaired andshould be written down to market value pursuant to Statement ofFinancial Accounting Standards No. 115, “Accounting for CertainInvestments in Debt and Equity Securities” (SFAS 115). Afterthe six-month period, debt securities with declines from cost inexcess of 20% are evaluated monthly for impairment. For equitysecurities, if a decline from cost of 20% or more continues for a12-month period, an other than temporary impairment is recog-nized without continued analysis.
J. Income taxesThe provision for income taxes is determined using the asset andliability approach for accounting for income taxes in accordancewith Statement of Financial Accounting Standards No. 109,“Accounting for Income Taxes” (SFAS 109). Tax laws requireitems to be included in tax filings at different times than the itemsare reflected in the financial statements. A current liability isrecognized for the estimated taxes payable for the current year.Deferred taxes represent the future tax consequences expected tooccur when the reported amounts of assets and liabilities arerecovered or paid. Deferred taxes are adjusted for enacted changesin tax rates and tax laws. Valuation allowances are recorded toreduce deferred tax assets when it is more likely than not that atax benefit will not be realized.
K. Estimates in financial statementsThe preparation of financial statements in conformity with account-ing principles generally accepted in the United States of Americarequires management to make estimates and assumptions that affectreported amounts. The more significant estimates include: residualvalues for leased assets, fair market values for goodwill impairmenttests, and reserves for warranty, product liability and insurancelosses, postemployment benefits, post-sale discounts, credit lossesand income taxes.
L. New accounting standardsIn November 2004, the FASB issued Statement of FinancialAccounting Standards No. 151 (SFAS 151), “Inventory Costs anamendment of ARB No. 43, Chapter 4.” SFAS 151 discussesthe general principles applicable to the pricing of inventory. Para-graph 5 of ARB 43, Chapter 4 provides guidance on allocating
certain costs to inventory. This Statement amends ARB 43, Chap-ter 4, to clarify that abnormal amounts of idle facility expense,freight, handling costs, and wasted materials (spoilage) should berecognized as current-period charges. In addition, this Statementrequires that allocation of fixed production overheads to the costsof conversion be based on the normal capacity of production facil-ities. As required by SFAS 151, we will adopt this new account-ing standard on January 1, 2006. The adoption of SFAS 151 is notexpected to have a material impact on our financial statements.
In December 2004, the FASB issued Statement of FinancialAccounting Standards No. 153 (SFAS 153), “Exchanges of Non-monetary Assets — an amendment of APB Opinion No. 29.”SFAS 153 addresses the measurement of exchanges of nonmon-etary assets. It eliminates the exception from fair value measure-ment for nonmonetary exchanges of similar productive assets inparagraph 21(b) of APB Opinion No. 29 “Accounting for Non-monetary Transactions” and replaces it with an exception forexchanges that do not have commercial substance. A nonmon-etary exchange has commercial substance if the future cash flowsof the entity are expected to change significantly as a result ofthe exchange. As required by SFAS 153, we will adopt this newaccounting standard effective July 1, 2005. The adoption ofSFAS 153 is not expected to have a material impact on our finan-cial statements.
In December 2004, the FASB issued Statement of FinancialAccounting Standards No. 123R (SFAS 123R) “Share-BasedPayment.” SFAS 123R requires that the cost resulting from allshare-based payment transactions be recognized in the financialstatements. SFAS 123R also establishes fair value as the mea-surement method in accounting for share-based payments toemployees. As required by SFAS 123R, we will adopt this newaccounting standard effective July 1, 2005. We will transitionto the new guidance using the modified prospective method. Inanticipation of delaying vesting until three years after the grantdate for future grants, the 2004 employee stock option grant(issued in June) fully vested on December 31, 2004. In order tobetter align our employee stock option program with the over-all market, the number of options granted in 2005 (issued inFebruary) was significantly reduced from the previous year. Inresponse to this decrease, we elected to immediately vest the2005 option grant. We expect the application of the expensingprovisions of SFAS 123R will result in a pretax expense ofapproximately $20 million in the second half of 2005. As a resultof the vesting decisions discussed above, a full complement ofexpense related to stock options will not be recognized in ourresults of operations until 2009. Based on the same assumptionsused to calculate our 2004 stock option grant, we estimate ourpretax expense associated with our stock option grants will rangefrom $50 million in 2006 to $150 million in 2009.
M. Stock based compensationWe currently use the intrinsic value method of accounting for stock-based employee compensation in accordance with AccountingPrinciples Board Opinion No. 25, “Accounting for Stock Issuedto Employees.” Therefore, no compensation expense is recog-nized in association with our options.
The fair value of the options granted in 2004 was estimatedusing the binomial option-pricing model. We believe this modelmore accurately reflects the value of the options than using the

Black-Scholes option-pricing model. Previous years grants con-tinue to be valued using the Black-Scholes model. Please referto Note 18 on page A-25 for additional information on our stockbased compensation plans.
Pro forma net profit and profit per share using the binomial option-pricing model for the 2004 grant and the Black-Scholes option-pricingmodel for 2003 and previous grants were:
Years ended December 31,
(Dollars in millions except per share data) 2004 2003 2002_____ _____ _____Profit, as reported . . . . . . . . . . . . . . . . . . . . . . . . . . . . . . . . . . . $2,035 $ 1,099 $ 798Deduct: Total stock-based employee
compensation expense determined underfair value based method for all awards,net of related tax effects. . . . . . . . . . . . . . . . . . . . . . . . . . . (161) (69) (65)_____ _____ _____
Pro forma net income . . . . . . . . . . . . . . . . . . . . . . . . . . . . . . . $1,874 $ 1,030 $ 733_____ _____ __________ _____ _____
Profit per share of common stock:As reported:
Basic . . . . . . . . . . . . . . . . . . . . . . . . . . . . . . . . . . . . . . . . . . . . . $ 5.95 $ 3.18 $ 2.32Diluted . . . . . . . . . . . . . . . . . . . . . . . . . . . . . . . . . . . . . . . . . . . $ 5.75 $ 3.13 $ 2.30
Pro forma:Basic . . . . . . . . . . . . . . . . . . . . . . . . . . . . . . . . . . . . . . . . . . . . . $ 5.48 $ 2.98 $ 2.13Diluted . . . . . . . . . . . . . . . . . . . . . . . . . . . . . . . . . . . . . . . . . . . $ 5.30 $ 2.93 $ 2.13
Pro forma net profit and profit per share in 2004 using the Black-Scholesoption-pricing model would have been:
Years endedDecember 31,
(Dollars in millions except per share data) 2004_____Profit, as reported . . . . . . . . . . . . . . . . . . . . . . . . . . . . . . . . . . . . . . . . . . . . . . . . . . . . . . $2,035Deduct: Total stock-based employee
compensation expense determined underfair value based method for all awards,net of related tax effects . . . . . . . . . . . . . . . . . . . . . . . . . . . . . . . . . . . . . . . . . . . . . . (202)_____
Pro forma net income . . . . . . . . . . . . . . . . . . . . . . . . . . . . . . . . . . . . . . . . . . . . . . . . . . $1,833__________
Profit per share of common stock:As reported:
Basic . . . . . . . . . . . . . . . . . . . . . . . . . . . . . . . . . . . . . . . . . . . . . . . . . . . . . . . . . . . . . . . . $ 5.95Diluted . . . . . . . . . . . . . . . . . . . . . . . . . . . . . . . . . . . . . . . . . . . . . . . . . . . . . . . . . . . . . . $ 5.75
Pro forma:Basic . . . . . . . . . . . . . . . . . . . . . . . . . . . . . . . . . . . . . . . . . . . . . . . . . . . . . . . . . . . . . . . . $ 5.35Diluted . . . . . . . . . . . . . . . . . . . . . . . . . . . . . . . . . . . . . . . . . . . . . . . . . . . . . . . . . . . . . . $ 5.18
2. Reclassification of certain receivables andrelated cash flows
A. Consolidated financial positionOur Machinery and Engines operations generate trade receivablesfrom the sale of inventory to dealers and customers. Certain ofthese receivables are sold to Cat Financial. Cat Financial holdsthe receivables and periodically securitizes a portion of the dealerreceivables using a revolving securitization structure. Cat Financial’sportion of the securitized trade receivables is represented by cer-tificated retained interests. Cat Financial also generates whole-sale inventory receivables from its direct financing of inventorypurchases by dealers. Previously, the certificated retained inter-ests as well as the wholesale inventory receivables were classi-fied as Finance Receivables in our Consolidated FinancialPosition. In the fourth quarter of 2004, we reclassified the cer-tificated retained interests from Finance Receivables to RetainedInterests in Securitized Trade Receivables and the wholesale
inventory receivables from Finance Receivables to Trade andOther Receivables in our Consolidated Financial Position. Thesechanges were made to align the financial position with the cashflow changes discussed below.
B. Consolidated statement of cash flow
During the fourth quarter of 2004, the staff of the Securities andExchange Commission expressed concern regarding the classi-fications of certain cash flows by companies with captive financesubsidiaries. As a result of this concern, management decided tomake reclassifications to the 2003 and 2002 Consolidated State-ments of Cash Flow as described below.
Securitized trade receivables
Previously, we reported an increase in cash flow from operatingactivities in the Consolidated Statement of Cash Flow whenMachinery and Engines sold receivables to Cat Financial thatwere subsequently securitized. Concurrently, Cat Financial’sentire purchase of these receivables was included in Additionsto Finance Receivables (investing activity) in the ConsolidatedStatement of Cash Flow. The receivables were immediately secu-ritized and the portion sold to a third party was included in Proceedsfrom Sale of Finance Receivables (investing activity) in theConsolidated Statement of Cash Flow. Subsequently, collectionof the certificated retained interests was included in Collectionof Finance Receivables (investing activity) in the ConsolidatedStatement of Cash Flow. This cash flow treatment followed ourprincipal lines of business reporting, however, when we reportedan increase in cash flow from operating activities and a corre-sponding outflow from investing activities there was no increasein cash on a consolidated basis from the sale of inventory to ourdealers and customers.
In the fourth quarter of 2004, we made a reclassification toeliminate the offsetting non-cash intercompany transactions inthe Consolidated Statement of Cash Flow. In addition, we reclas-sified the proceeds from sale of trade receivables to operatingactivities. The reclassification properly classifies cash receiptsfrom the sale of inventory as operating activities and reflects thatthese cash flows, although held and managed by Cat Financial,arise from our sale of Machinery and Engines inventory.
The securitization structure mentioned above involves a secu-ritization trust. During 2002 and 2003, the trust was a qualify-ing special purpose entity (QSPE) and thus, in accordance withStatement of Financial Accounting Standards No. 140 (SFAS 140),“Accounting for Transfers and Servicing of Financial Assets andExtinguishment of Liabilities,” was not consolidated. (See Note 6on page A-16 for discussion of the 2004 QSPE status of the trust.)When receivables were placed into the trust, we received cash forthe portion sold to third party purchasers and the portion retainedby Cat Financial was represented by certificated retained interests.Placing receivables into a securitization trust changes their natureand the receipt of certificated retained interests is considered anon-cash transaction. We have noted this non-cash transactionon the Consolidated Statement of Cash Flow and quantified thereceivables decrease resulting from this transaction and thusexcluded from operating activities. This reflects that certificatedretained interests, not cash, were received for these sales. The cer-tificated retained interests are considered held-to-maturity secu-rities as defined by SFAS 115. SFAS 115 requires that collection
NOTES continued
A-12

Caterpillar Inc.
A-13
3. Derivative financial instrumentsand risk management
A. Foreign currency exchange rate risk
Foreign currency exchange rate movements create a degree of riskby affecting the U.S. dollar value of sales made and costs incurredin foreign currencies. Movements in foreign currency rates also affectour competitive position as these changes may affect business prac-tices and/or pricing strategies of non-U.S.-based competitors. Addi-tionally, we have balance sheet positions denominated in foreigncurrency, thereby creating exposure to movements in exchange rates.
Our Machinery and Engines operations purchase, manufactureand sell products in many locations around the world. As we have adiversified revenue and cost base, we manage our future foreigncurrency cash flow exposure on a net basis. We use foreign cur-rency forward and option contracts to manage unmatched foreigncurrency cash inflow and outflow. Our objective is to minimize the
risk of exchange rate movements that would reduce the U.S. dollarvalue of our foreign currency cash flow. Our policy allows for man-aging anticipated foreign currency cash flow for up to four years.
We generally designate as cash flow hedges at inception ofthe contract any Australian dollar, Brazilian real, British pound,Canadian dollar, euro, Japanese yen, Mexican peso or Singaporedollar forward or option contracts that exceed 90 days in duration.Designation is performed on a specific exposure basis to supporthedge accounting. The remainder of Machinery and Engines for-eign currency contracts are undesignated.
As of December 31, 2004, $102 million of deferred net gainsincluded in equity (“Accumulated other comprehensive income”in Statement 3), related to Machinery and Engines foreign cur-rency contracts designated as cash flow hedges, is expected to bereclassified to current earnings [“Other income (expense)”] overthe next twelve months. There were no circumstances wherehedge treatment was discontinued during 2004, 2003 or 2002.
of held-to-maturity securities be classified as an investing activity.We have therefore reclassified the collection of the certificatedretained interests from Collection of Finance Receivables toCollections of Retained Interests in Securitized Trade Receivableswithin the investing activities section of the Consolidated State-ment of Cash Flow. The impact of these changes is a significantreduction to cash flow from operating activities and a signifi-cant increase in cash flow from investing activities. This reflectsthat although inventory was sold, the nature of the receivablewas changed to a security. The subsequent collection of thatsecurity is shown as an investing activity.
Wholesale inventory receivables
Previously, we reported an increase in cash flow from operatingactivities when a dealer remitted payment for a trade receivablethat was subsequently financed with the issuance of a wholesaleinventory receivable by Cat Financial. The issuance of a wholesaleinventory receivable by Cat Financial was reported as an Additionto Finance Receivables in the Consolidated Statement of Cash
Flow and the subsequent collection was reported as a Collectionof Finance Receivables. Similar to securitized receivables, thiscash flow treatment followed our principal lines of businessreporting, however, when we reported an increase in cash flowfrom operating activities and a corresponding outflow from invest-ing activities there was no increase in cash on a consolidatedbasis from the sale of inventory to our dealers and customers.We therefore eliminated the offsetting non-cash transaction inthe Consolidated Statement of Cash Flow. In addition, we reclas-sified the collection of wholesale inventory receivables to oper-ating activities. The reclassification properly classifies cashreceipts from the sale of inventory as operating activities andreflects that these cash flows, although held and managed by CatFinancial, arise from our sale of Machinery and Engines inventory.
These reclassifications had no impact on the Increase in Cashand Short-term Investments on the Statement of ConsolidatedCash Flow.
Prior amounts reported have been reclassified to conform tothis presentation as follows:
2003 2002______________________________ ______________________________Previous As Previous As
(Millions of dollars) classification(1) Change Reclassified classification(1) Change Reclassified__________ _______ ________ __________ _______ ________Consolidated Financial Position — Statement 3
Receivables — trade and other . . . . . . . . . . . . . . . . . . . . . . . . . . . . . . . $ 3,666 $ 359 $ 4,025 $ 2,838 $ 354 $ 3,192Receivables — finance . . . . . . . . . . . . . . . . . . . . . . . . . . . . . . . . . . . . . . . . 7,417 (1,909) 5,508 6,565 (1,499) 5,066Retained interests in securitized trade receivables . . . . . . . . . . . — 1,550 1,550 — 1,145 1,145Long-term receivables — trade and other . . . . . . . . . . . . . . . . . . . 82 428 510 66 367 433Long-term receivables — finance . . . . . . . . . . . . . . . . . . . . . . . . . . . . 7,822 (428) 7,394 6,714 (367) 6,347
Consolidated Statement of Cash Flow — Statement 4Receivables — trade and other . . . . . . . . . . . . . . . . . . . . . . . . . . . . . . . $ (438) $ (7,677) $ (8,115) $ 5 $ (6,328) $ (6,323)Net cash provided by (used for)
operating activities ........ . . . . . . . . . . . . . . . . . . 2,066 (7,677) (5,611) 2,366 (6,328) (3,962)
Additions to finance receivables . . . . . . . . . . . . . . . . . . . . . . . . . . . . . . (17,146) 10,278 (6,868) (15,338) 9,405 (5,933)Collections of finance receivables . . . . . . . . . . . . . . . . . . . . . . . . . . . . 13,882 (8,631) 5,251 11,866 (7,297) 4,569Proceeds from sale of finance receivables. . . . . . . . . . . . . . . . . . . . 1,760 (1,099) 661 2,310 (1,697) 613Collections of retained interests in securitized
trade receivables. . . . . . . . . . . . . . . . . . . . . . . . . . . . . . . . . . . . . . . . . . . — 7,129 7,129 — 5,917 5,917Net cash provided by (used for)
investing activities ........ . . . . . . . . . . . . . . . . . . (2,793) 7,677 4,884 (2,708) 6,328 3,620(1) Certain amounts do not agree to prior period reported amounts due to unrelated reclassifications.

NOTES continued
A-14
In managing foreign currency risk for our Financial Productsoperations, our objective is to minimize earnings volatility resultingfrom conversion and the remeasurement of net foreign currencybalance sheet positions. Our policy allows the use of foreign cur-rency forward contracts to offset the risk of currency mismatchbetween our receivables and debt. All such foreign currency for-ward contracts are undesignated.
(Losses) included in current earnings [Other income (expense)] onundesignated contracts:(Millions of dollars) 2004 2003 2002_____ _____ _____Machinery and Engines:
On undesignated contracts . . . . . . . . . . . . . . . . . . . . . . . $ (9) $ (1) $ —Due to changes in time and
volatility value on options . . . . . . . . . . . . . . . . . . . . . . — — $ (1)Financial Products:
On undesignated contracts . . . . . . . . . . . . . . . . . . . . . . . $ (46) $ (121) $ (96)_____ ____ ____$ (55) $ (122) $ (97)_____ ____ _________ ____ ____
Gains and losses on the Financial Products contracts aboveare substantially offset by balance sheet remeasurement and con-version gains and losses.
B. Interest rate riskInterest rate movements create a degree of risk by affecting theamount of our interest payments and the value of our fixed ratedebt. Our policy is to use interest rate swap agreements and for-ward rate agreements to manage our exposure to interest ratechanges and lower the cost of borrowed funds.
Machinery and Engines operations generally use fixed ratedebt as a source of funding. Our objective is to minimize the costof borrowed funds. Our policy allows us to enter fixed-to-floatinginterest rate swaps and forward rate agreements to meet that objec-tive with the intent to designate as fair value hedges at inceptionof the contract all fixed-to-floating interest rate swaps. Designa-tion as a hedge of the fair value of our fixed rate debt is performedto support hedge accounting. During 2001, our Machinery andEngines operations liquidated all fixed-to-floating interest rateswaps. Deferred gains on liquidated fixed-to-floating interestrate swaps, which were previously designated as fair value hedges,are being amortized to earnings ratably over the remaining lifeof the hedged debt. We designate as cash flow hedges at incep-tion of the contract all forward rate agreements. Designation asa hedge of the anticipated issuance of debt is performed to sup-port hedge accounting. Machinery and Engines forward rateagreements are 100% effective.
Financial Products operations have a “match funding” objec-tive whereby, within specified boundaries, the interest rate profile(fixed rate or floating rate) of their debt portfolio matches theinterest rate profile of their receivables. In connection with thatobjective, we use interest rate derivative instruments to modifythe debt structure to match the receivable portfolio. This “matchfunding” reduces the volatility of margins between interest-bearingassets and interest-bearing liabilities, regardless of which direc-tion interest rates move. We also use these instruments to gainan economic and/or competitive advantage through a lower costof borrowed funds. This is accomplished by changing the charac-teristics of existing debt instruments or entering into new agree-ments in combination with the issuance of new debt.
Our policy allows us to issue floating-to-fixed, fixed-to-floatingand floating-to-floating interest rate swaps to meet the “match
funding” objective. To support hedge accounting, we designatefixed-to-floating interest rate swaps as fair value hedges of the fairvalue of our fixed rate debt at inception of the swap contract.Financial Products policy is to designate most floating-to-fixedinterest rate swaps as cash flow hedges of the variability of futurecash flows at inception of the swap contract. Designation as ahedge of the variability of cash flow is performed to supporthedge accounting. During 2004, Financial Products operationsliquidated three fixed-to-floating interest rate swaps and during2002, Financial Products liquidated four such swaps. As a result,the fair value adjustment of the original debt is being amortizedto earnings ratably over the remaining life of the hedged debt.
Gains (losses) included in current earnings [Other income (expense)]:(Millions of dollars) 2004 2003 2002_____ _____ _____Fixed-to-floating interest rate swaps
Machinery and Engines:Gain on liquidated swaps. . . . . . . . . . . . . . . . . . . . . . . $ 5 $ 6 $ 8
Financial Products:Gain/(loss) on designated interest
rate derivatives . . . . . . . . . . . . . . . . . . . . . . . . . . . . . . . . (28) (20) 17Gain/(loss) on hedged debt . . . . . . . . . . . . . . . . . . . . 28 20 (17)Gain on liquidated swaps —
included in interest expense . . . . . . . . . . . . . . . . . 2 2 1______ _____ _____$ 7 $ 8 $ 9______ _____ ___________ _____ _____
As of December 31, 2004, $3 million of deferred net lossesincluded in equity (“Accumulated other comprehensive income”in Statement 3), related to Financial Products floating-to-fixedinterest rate swaps, is expected to be reclassified to current earn-ings (“Interest expense of Financial Products”) over the nexttwelve months. There were no circumstances where hedge treat-ment was discontinued during 2004, 2003 or 2002 in eitherMachinery and Engines or Financial Products.
C. Commodity price riskCommodity price movements create a degree of risk by affect-ing the price we must pay for certain raw material. Our policy isto use commodity forward and option contracts to manage thecommodity risk and reduce the cost of purchased materials.
Our Machinery and Engines operations purchase aluminum,copper and nickel embedded in the components we purchasefrom suppliers. Our suppliers pass on to us price changes in thecommodity portion of the component cost.
Our objective is to minimize volatility in the price of these com-modities. Our policy allows us to enter commodity forward andoption contracts to lock in the purchase price of the commodi-ties within a four-year horizon. All such commodity forward andoption contracts are undesignated. Gains on the undesignatedcontracts of $15 million, $27 million and $1 million were recordedin current earnings [“Other income (expense)”] for 2004, 2003and 2002, respectively.
4. Other income (expense)Years ended December 31,
(Millions of dollars) 2004 2003 2002______ _____ _____Investment and interest income . . . . . . . . . . . . . . . . . $ 96 $ 49 $ 31Foreign exchange gains . . . . . . . . . . . . . . . . . . . . . . . . 116 35 13Charge for early retirement of debt . . . . . . . . . . . . . . — (55) —Miscellaneous income (loss) . . . . . . . . . . . . . . . . . . . (8) 6 25______ _____ _____
$ 204 $ 35 $ 69______ _____ ___________ _____ _____

Caterpillar Inc.
A-15
5. Income taxes
The components of profit before taxes were:Years ended December 31,
(Millions of dollars) 2004 2003 2002______ _____ _____U.S. . . . . . . . . . . . . . . . . . . . . . . . . . . . . . . . . . . . . . . . . . . . $1,106 $ 489 $ 343Non-U.S. . . . . . . . . . . . . . . . . . . . . . . . . . . . . . . . . . . . . . 1,601 988 771______ _____ _____
$2,707 $ 1,477 $1,114______ _____ ___________ _____ _____
Profit before taxes, as shown above, is based on the locationof the entity to which such earnings are attributable. However,since such earnings are subject to taxation in more than one coun-try, the income tax provision shown below as U.S. or non-U.S.may not correspond to the earnings shown above.
The components of the provision for income taxes were:Years ended December 31,
(Millions of dollars) 2004 2003 2002______ _____ _____Current tax provision (credit):
U.S. Federal . . . . . . . . . . . . . . . . . . . . . . . . . . . . . . . . . $ 136 $ 24 $ (62)Non-U.S. . . . . . . . . . . . . . . . . . . . . . . . . . . . . . . . . . . . . 308 196 210State (U.S.) . . . . . . . . . . . . . . . . . . . . . . . . . . . . . . . . . . 13 10 1______ _____ _____
457 230 149______ _____ _____
Deferred tax provision (credit):U.S. Federal . . . . . . . . . . . . . . . . . . . . . . . . . . . . . . . . . 301 182 172Non-U.S. . . . . . . . . . . . . . . . . . . . . . . . . . . . . . . . . . . . . (24) (21) (20)State (U.S.) . . . . . . . . . . . . . . . . . . . . . . . . . . . . . . . . . . (3) 7 11______ _____ _____
274 168 163______ _____ _____Total provision for income taxes . . . . . . . . . . . . . . . . $ 731 $ 398 $ 312______ _____ ___________ _____ _____
Reconciliation of the U.S. federal statutory rate to effective rate:Years ended December 31,
2004 2003 2002______ _____ _____U.S. statutory rate . . . . . . . . . . . . . . . . . . . . . . . . . . . . . . 35.0)% 35.0)% 35.0)%(Decreases) increases in taxes resulting from:
Benefit of foreign sales corporation/extraterritorial income exclusion. . . . . . . . . . . . . (4.9)% (4.9)% (4.4)%
Non-U.S. subsidiaries taxedat other than 35% . . . . . . . . . . . . . . . . . . . . . . . . . . (3.7)% (4.0)% (3.4)%
Other — net . . . . . . . . . . . . . . . . . . . . . . . . . . . . . . . . . 0.6)% 0.9)% 0.8)%______ _____ _____Provision for income taxes. . . . . . . . . . . . . . . . . . . . . . 27.0)% 27.0)% 28.0)%______ _____ ___________ _____ _____
We paid income taxes of $326 million, $55 million and$124 million in 2004, 2003 and 2002, respectively.
We have recorded income tax expense at U.S. tax rates on allprofits, except for undistributed profits of non-U.S. companieswhich are considered indefinitely reinvested. Determination ofthe amount of unrecognized deferred tax liability related to indef-initely reinvested profits is not feasible.
Certain subsidiaries operating in China qualify for holidaysfrom income tax, which consist of a two-year full exemption fromtax followed by a three-year 50% reduction in the applicable taxrate. The tax holiday begins the first year the subsidiary gener-ates taxable income after utilization of any carryforward losses.The dollar effect in 2004 was $2 million or less than $.01 per shareand $10 million or $.03 per share in 2003.
Deferred income tax assets and liabilities:December 31,
(Millions of dollars) 2004 2003 2002_____ _____ _____Deferred income tax assets:
Postemployment benefits other than pensions. . . $1,092 $ 1,147 $1,130Warranty reserves . . . . . . . . . . . . . . . . . . . . . . . . . . . . 212 163 204Unrealized profit excluded from inventories . . . . 153 136 109Tax carryforwards . . . . . . . . . . . . . . . . . . . . . . . . . . . . 480 370 230Inventory valuation method . . . . . . . . . . . . . . . . . . . 35 37 60Pension . . . . . . . . . . . . . . . . . . . . . . . . . . . . . . . . . . . . . — — 39Deferred compensation . . . . . . . . . . . . . . . . . . . . . . . 57 48 38Allowance for credit losses. . . . . . . . . . . . . . . . . . . . 73 66 55Unremitted earnings of non-U.S. subs . . . . . . . . . — 25 60Other . . . . . . . . . . . . . . . . . . . . . . . . . . . . . . . . . . . . . . . . 200 158 144_____ _____ _____
2,302 2,150 2,069_____ _____ __________ _____ _____Deferred income tax liabilities:
Capital assets . . . . . . . . . . . . . . . . . . . . . . . . . . . . . . . . (903) (731) (597)Pension . . . . . . . . . . . . . . . . . . . . . . . . . . . . . . . . . . . . . (216) (102) —Unremitted earnings of non-U.S. subs . . . . . . . . . (131) — —_____ _____ _____
(1,250) (833) (597)_____ _____ _____Valuation allowance for deferred tax assets . . . . . . (24) (37) (34)_____ _____ _____Deferred income taxes — net . . . . . . . . . . . . . . . . . . . $1,028 $ 1,280 $1,438_____ _____ __________ _____ _____
SFAS 109 requires that individual tax-paying entities of the com-pany offset all current deferred tax liabilities and assets within eachparticular tax jurisdiction and present them as a single amount inthe Consolidated Financial Position. A similar procedure is fol-lowed for all noncurrent deferred tax liabilities and assets. Amountsin different tax jurisdictions cannot be offset against each other.The amount of deferred income taxes at December 31, includedon the following lines in Statement 3, are as follows:(Millions of dollars) 2004 2003 2002_____ _____ _____Assets:
Deferred and refundable income taxes . . . . . . . . . $ 397 $ 702 $ 777Deferred income taxes . . . . . . . . . . . . . . . . . . . . . . . 674 616 711_____ _____ _____
$1,071 $ 1,318 $1,488
Liabilities:Deferred and current income taxes payable . . . . $ 20 $ 18 $ 8Deferred income taxes and other liabilities . . . . . 23 20 42_____ _____ _____
Deferred income taxes — net . . . . . . . . . . . . . . . . . . . $1,028 $ 1,280 $1,438______ _____ ___________ _____ _____
A valuation allowance has been recorded at certain non-U.S. sub-sidiaries that have not yet demonstrated consistent and/or sustain-able profitability to support the recognition of net deferred tax assets.
As of December 31, 2004, amounts and expiration dates ofnet operating loss carryforwards in various non-U.S. taxing juris-dictions were:
(Millions of dollars)
2005 2006 2007 2008 2009-2014 Unlimited Total_____________________________________________________$9 $10 $6 $6 $95 $557 $683
As of December 31, 2004, approximately $592 million of statetax net operating loss carryforwards were available. Of these,86% expire after 2014.
As of December 31, 2004, approximately $222 million of regu-lar foreign tax credits and $19 million of credit for research activ-ities were available to carry forward in the United States. Of theforeign tax credits, $115 million will expire in 2013, $75 millionwill expire in 2014, and $32 million will expire in 2015. Theresearch credits will begin to expire in 2023.

In December 2004, the FASB issued FASB Staff PositionNo. 109-1 “Application of FASB Statement No. 109, Accountingfor Income Taxes, to the Tax Deduction on Qualified ProductionActivities Provided by the American Jobs Creation Act of 2004”(FSP 109-1). FSP 109-1 provides accounting guidance for com-panies that will be eligible for a tax deduction resulting from “qual-ified production activities income” as defined in the AmericanJobs Creation Act of 2004 (the Act). FSP 109-1 requires thisdeduction be treated as a special deduction in accordance withSFAS 109, which does not require a revaluation of our U.S.deferred tax assets. We will apply the guidance in FSP 109-1upon recognition of this tax deduction beginning January 1, 2005.The application of FSP 109-1 will not have a material impact onour financial statements.
In December 2004, the FASB issued FASB Staff PositionNo. 109-2 “Accounting and Disclosure Guidance for the ForeignEarnings Repatriation Provision within the American Jobs Crea-tion Act of 2004” (FSP 109-2). FSP 109-2 provides accountingguidance for the one-time tax deduction of 85% of certain non-U.S. earnings that are repatriated in excess of a base amount asdefined in the Act. SFAS 109 requires a company to reflect in theperiod of enactment the effect of a new tax law. Due to the lackof clarification of certain provisions within the Act, FSP 109-2allows companies time beyond the financial reporting period ofenactment to evaluate the effect of the Act.
We have started an evaluation of the effects of the repatriationprovision. However, we do not expect to be able to complete thisevaluation until after Congress and the Treasury Department pro-vide additional clarification on key elements of the provision.We expect to complete our evaluation of the effects of the repa-triation provision within a reasonable period of time followingthe publication of all relevant guidance. The range of possibleamounts, including the base, which we are considering for repa-triation under this provision, is between zero and $1 billion. Therelated potential range of incremental provision for income taxesis between zero and $75 million.
6. Retained interests in securitized trade receivables
Our Machinery and Engines operations generate trade receiv-ables from the sale of inventory to dealers and customers. Certainof these receivables are sold to Cat Financial. Cat Financial holdsthe receivables and periodically securitizes a portion of the dealerreceivables using a revolving securitization structure. The trustissues a collateralized trust obligation (CTO) certificate to thirdparty purchasers for their portion of these receivables. The trustalso issues a transferor certificate (certificated retained interests)to Cat Financial for the portion not represented by the CTO.
For 2002 and 2003 and through August of 2004, the trust was aqualifying special purpose entity (QSPE) and thus, in accordanceSFAS 140 was not consolidated. The outstanding principal bal-ance of the CTO was not included in our Consolidated FinancialPosition during these periods. The certificated retained interestswere included in “Retained Interests in Securitized Trade Receiv-ables” in Statement 3.
From September through December of 2004, because of a sig-nificant increase in Machinery and Engines’ sales and subse-quent sale of the receivables to Cat Financial, our certificatedretained interests in the trust exceeded 90% of the fair value oftrust assets. Thus, during this period, the trust did not qualify as
a QSPE as defined by SFAS 140. We therefore consolidated thetrust in accordance with FIN 46R, “Consolidation of VariableInterest Entities” (revised) as it represents a variable interestentity for which Cat Financial is the primary beneficiary. As ofDecember 31, 2004, assets of the trust of $2,587 million wereincluded in “Receivables — trade and other” in Statement 3 and theCTO of $240 million was included in “Short-term Borrowings.”Please refer to Note 15 on page A-24.
Cat Financial services the dealer receivables and receives anannual servicing fee of approximately 1% of the average out-standing principal balance of the CTO. Consolidated expenses of$7 million, $6 million and $10 million related to the CTO wererecognized during 2004, 2003 and 2002, respectively, and areincluded in “Other income (expense)” on Statement 1. Expectedcredit losses are assumed to be 0% because dealer receivableshave historically had no losses and none are expected in thefuture. The fair value of the certificated retained interests indealer receivables approximates carrying value due to their short-term nature. Other than the certificated retained interests (assetsof the trust when consolidated), the investors and the securiti-zation facilities have no recourse to Cat Financial’s assets forfailure of debtors to pay when due.
2004 2003 2002______ ______ ______Cash flow from securitizations:Proceeds from sales of receivables(1) . . . . . $ 663 $ 1,099 $ 1,696Servicing fees received . . . . . . . . . . . . . . . . . . . 2 2 3Characteristics ofsecuritized receivables:Principal balance at December 31:
Certificated retained interests . . . . . . . . . . $ — $ 1,550 $ 1,145Collateralized trust obligation . . . . . . . . . . — 240 240
Average balance for theyear ended December 31(1):
Certificated retained interests . . . . . . . . . . 1,936 1,350 1,012Collateralized trust obligation . . . . . . . . . . 240 240 324
(1) For 2004, proceeds and average balances include only the periods the trust was a QSPE.
7. Wholesale inventory receivables
Wholesale inventory receivables are receivables of Cat Financialthat arise when Cat Financial provides financing for a dealer’s pur-chase of inventory. These receivables are included in “Receivables— trade and other” and “Long-term receivables — trade and other”in Statement 3 and were $991 million, $764 million and $691 mil-lion at December 31, 2004, 2003 and 2002, respectively. Pleaserefer to Note 20 on pages A-25 and A-26 and Table III onpage A-27 for fair value information.
Contractual maturities of outstanding wholesale inventory receivables:December 31, 2004
Wholesale WholesaleInstallment Finance Wholesale
Amounts Due In Contracts Leases Notes Total____________ _______ ______ ______ ______2005 . . . . . . . . . . . . . . . . . . . . . . $ 40 $ 23 $ 424 $ 4872006 . . . . . . . . . . . . . . . . . . . . . . 12 17 177 2062007 . . . . . . . . . . . . . . . . . . . . . . 7 16 125 1482008 . . . . . . . . . . . . . . . . . . . . . . 1 11 111 1232009 . . . . . . . . . . . . . . . . . . . . . . — 5 8 13Thereafter . . . . . . . . . . . . . . . . . — — 2 2_____ _____ _____ ______
60 72 847 979Guaranteed residual value . . — 53 — 53Less: Unearned income . . . . . 1 14 26 41_____ _____ _____ ______Total . . . . . . . . . . . . . . . . . . . . . . $ 59 $ 111 $ 821 $ 991_____ _____ _____ ___________ _____ _____ ______
NOTES continued
A-16
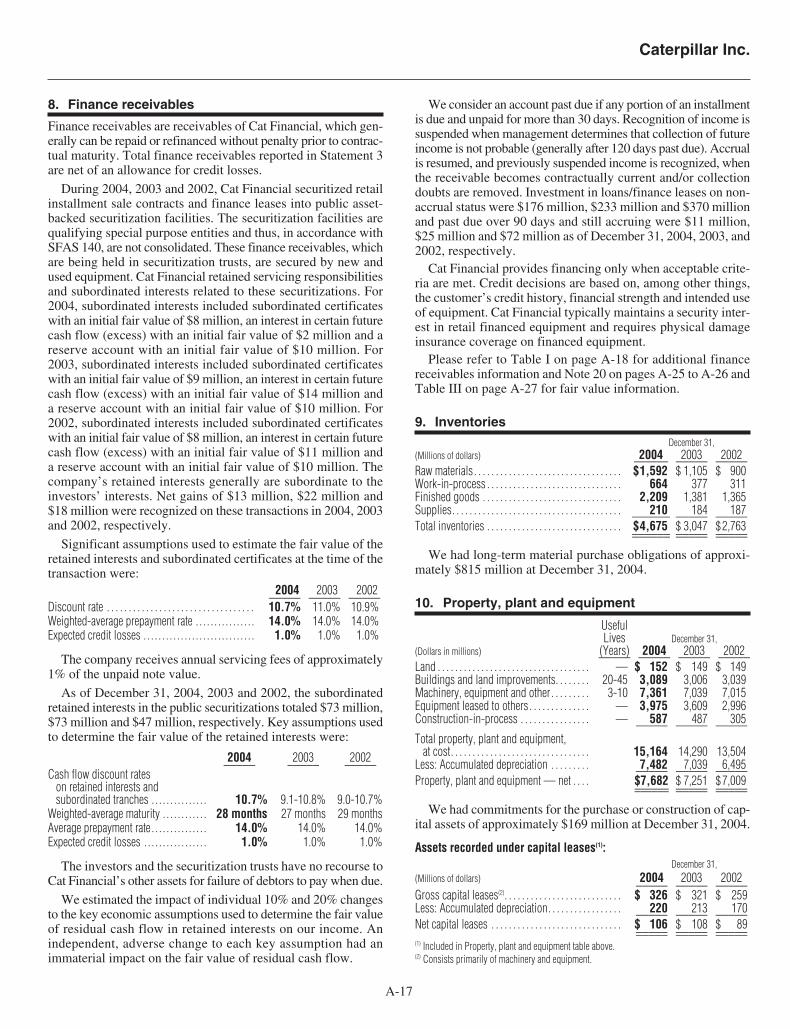
Caterpillar Inc.
A-17
8. Finance receivables
Finance receivables are receivables of Cat Financial, which gen-erally can be repaid or refinanced without penalty prior to contrac-tual maturity. Total finance receivables reported in Statement 3are net of an allowance for credit losses.
During 2004, 2003 and 2002, Cat Financial securitized retailinstallment sale contracts and finance leases into public asset-backed securitization facilities. The securitization facilities arequalifying special purpose entities and thus, in accordance withSFAS 140, are not consolidated. These finance receivables, whichare being held in securitization trusts, are secured by new andused equipment. Cat Financial retained servicing responsibilitiesand subordinated interests related to these securitizations. For2004, subordinated interests included subordinated certificateswith an initial fair value of $8 million, an interest in certain futurecash flow (excess) with an initial fair value of $2 million and areserve account with an initial fair value of $10 million. For2003, subordinated interests included subordinated certificateswith an initial fair value of $9 million, an interest in certain futurecash flow (excess) with an initial fair value of $14 million anda reserve account with an initial fair value of $10 million. For2002, subordinated interests included subordinated certificateswith an initial fair value of $8 million, an interest in certain futurecash flow (excess) with an initial fair value of $11 million anda reserve account with an initial fair value of $10 million. Thecompany’s retained interests generally are subordinate to theinvestors’ interests. Net gains of $13 million, $22 million and$18 million were recognized on these transactions in 2004, 2003and 2002, respectively.
Significant assumptions used to estimate the fair value of theretained interests and subordinated certificates at the time of thetransaction were:
2004 2003 2002_____ _____ _____Discount rate . . . . . . . . . . . . . . . . . . . . . . . . . . . . . . . . . . 10.7% 11.0% 10.9%Weighted-average prepayment rate . . . . . . . . . . . . . . . . 14.0% 14.0% 14.0%Expected credit losses . . . . . . . . . . . . . . . . . . . . . . . . . . . . . . 1.0% 1.0% 1.0%
The company receives annual servicing fees of approximately1% of the unpaid note value.
As of December 31, 2004, 2003 and 2002, the subordinatedretained interests in the public securitizations totaled $73 million,$73 million and $47 million, respectively. Key assumptions usedto determine the fair value of the retained interests were:
2004 2003 2002_____ _____ _____Cash flow discount rates
on retained interests andsubordinated tranches . . . . . . . . . . . . . . . 10.7% 9.1-10.8% 9.0-10.7%
Weighted-average maturity . . . . . . . . . . . . 28 months 27 months 29 monthsAverage prepayment rate . . . . . . . . . . . . . . . 14.0% 14.0% 14.0%Expected credit losses . . . . . . . . . . . . . . . . . 1.0% 1.0% 1.0%
The investors and the securitization trusts have no recourse toCat Financial’s other assets for failure of debtors to pay when due.
We estimated the impact of individual 10% and 20% changesto the key economic assumptions used to determine the fair valueof residual cash flow in retained interests on our income. Anindependent, adverse change to each key assumption had animmaterial impact on the fair value of residual cash flow.
We consider an account past due if any portion of an installmentis due and unpaid for more than 30 days. Recognition of income issuspended when management determines that collection of futureincome is not probable (generally after 120 days past due). Accrualis resumed, and previously suspended income is recognized, whenthe receivable becomes contractually current and/or collectiondoubts are removed. Investment in loans/finance leases on non-accrual status were $176 million, $233 million and $370 millionand past due over 90 days and still accruing were $11 million,$25 million and $72 million as of December 31, 2004, 2003, and2002, respectively.
Cat Financial provides financing only when acceptable crite-ria are met. Credit decisions are based on, among other things,the customer’s credit history, financial strength and intended useof equipment. Cat Financial typically maintains a security inter-est in retail financed equipment and requires physical damageinsurance coverage on financed equipment.
Please refer to Table I on page A-18 for additional financereceivables information and Note 20 on pages A-25 to A-26 andTable III on page A-27 for fair value information.
9. InventoriesDecember 31,
(Millions of dollars) 2004 2003 2002______ _____ _____Raw materials. . . . . . . . . . . . . . . . . . . . . . . . . . . . . . . . . . $1,592 $ 1,105 $ 900Work-in-process . . . . . . . . . . . . . . . . . . . . . . . . . . . . . . . 664 377 311Finished goods . . . . . . . . . . . . . . . . . . . . . . . . . . . . . . . . 2,209 1,381 1,365Supplies. . . . . . . . . . . . . . . . . . . . . . . . . . . . . . . . . . . . . . . 210 184 187______ _____ _____Total inventories . . . . . . . . . . . . . . . . . . . . . . . . . . . . . . . $4,675 $ 3,047 $2,763______ _____ ___________ _____ _____
We had long-term material purchase obligations of approxi-mately $815 million at December 31, 2004.
10. Property, plant and equipment
UsefulLives December 31,
(Dollars in millions) (Years) 2004 2003 2002_____ _____ _____ _____Land . . . . . . . . . . . . . . . . . . . . . . . . . . . . . . . . . . . — $ 152 $ 149 $ 149Buildings and land improvements. . . . . . . . 20-45 3,089 3,006 3,039Machinery, equipment and other. . . . . . . . . 3-10 7,361 7,039 7,015Equipment leased to others . . . . . . . . . . . . . . — 3,975 3,609 2,996Construction-in-process . . . . . . . . . . . . . . . . — 587 487 305_____ _____ _____Total property, plant and equipment,
at cost. . . . . . . . . . . . . . . . . . . . . . . . . . . . . . . . 15,164 14,290 13,504Less: Accumulated depreciation . . . . . . . . . 7,482 7,039 6,495_____ _____ _____Property, plant and equipment — net . . . . $7,682 $ 7,251 $7,009______ _____ ___________ _____ _____
We had commitments for the purchase or construction of cap-ital assets of approximately $169 million at December 31, 2004.
Assets recorded under capital leases(1):December 31,
(Millions of dollars) 2004 2003 2002_____ _____ _____Gross capital leases(2). . . . . . . . . . . . . . . . . . . . . . . . . . . $ 326 $ 321 $ 259Less: Accumulated depreciation. . . . . . . . . . . . . . . . . 220 213 170_____ _____ _____Net capital leases . . . . . . . . . . . . . . . . . . . . . . . . . . . . . . $ 106 $ 108 $ 89_____ _____ __________ _____ _____(1) Included in Property, plant and equipment table above.(2) Consists primarily of machinery and equipment.

NOTES continued
A-18
Equipment leased to others (primarily by Financial Products):December 31,
(Millions of dollars) 2004 2003 2002_____ _____ _____Equipment leased to others —
at original cost . . . . . . . . . . . . . . . . . . . . . . . . . . . . . . . $3,975 $ 3,609 $ 2,996Less: Accumulated depreciation. . . . . . . . . . . . . . . . . 1,196 1,074 809_____ _____ _____Equipment leased to others — net . . . . . . . . . . . . . . $2,779 $ 2,535 $ 2,187_____ _____ __________ _____ _____
At December 31, 2004, scheduled minimum rental paymentsto be received for equipment leased to others were:
(Millions of dollars)After
2005 2006 2007 2008 2009 2009_____________________________________________________$603 $438 $278 $150 $70 $31
11. Investment in unconsolidated affiliated companies
Our investment in affiliated companies accounted for by the equitymethod consists primarily of a 50% interest in Shin CaterpillarMitsubishi Ltd. (SCM) located in Japan. Combined financial infor-mation of the unconsolidated affiliated companies accounted forby the equity method (generally on a three-month lag, e.g., SCMresults reflect the periods ending September 30) was as follows:
Years ended December 31,(Millions of dollars) 2004 2003 2002_____ _____ _____Results of Operations:
Sales . . . . . . . . . . . . . . . . . . . . . . . . . . . . . . . . . . . . . . . . $3,628 $ 2,946 $ 2,734Cost of goods sold . . . . . . . . . . . . . . . . . . . . . . . . . . . 2,788 2,283 2,168_____ _____ _____Gross profit . . . . . . . . . . . . . . . . . . . . . . . . . . . . . . . . . . 840 663 566Profit (loss) . . . . . . . . . . . . . . . . . . . . . . . . . . . . . . . . . . $ 129 $ 48 $ (1)_____ _____ __________ _____ _____Caterpillar’s profit (loss) . . . . . . . . . . . . . . . . . . . . . . $ 59 $ 20 $ (4)_____ _____ __________ _____ _____
TABLE I — Finance Receivables Information (Millions of dollars)_______________________________________________________________________________________________________________
2004 2003 2002______ ______ ______Cash flow from securitizations:Proceeds from initial sales of receivables . . . . . . . . . . . . . . . . . . . . . . . . . . . . . . . . . . . . . . . . . . . . . . . . . . . . . . . . . . . . . . . . . . . . . . . . . $ 639 $ 661 $ 614Servicing fees received . . . . . . . . . . . . . . . . . . . . . . . . . . . . . . . . . . . . . . . . . . . . . . . . . . . . . . . . . . . . . . . . . . . . . . . . . . . . . . . . . . . . . . . . . . . . . 9 8 7Cash flows received on retained interests . . . . . . . . . . . . . . . . . . . . . . . . . . . . . . . . . . . . . . . . . . . . . . . . . . . . . . . . . . . . . . . . . . . . . . . . . 34 15 33Characteristics of securitized receivables:At December 31:
Total securitized principal balance . . . . . . . . . . . . . . . . . . . . . . . . . . . . . . . . . . . . . . . . . . . . . . . . . . . . . . . . . . . . . . . . . . . . . . . . . . . . $ 815 $ 813 $ 726Loans more than 30 days past due . . . . . . . . . . . . . . . . . . . . . . . . . . . . . . . . . . . . . . . . . . . . . . . . . . . . . . . . . . . . . . . . . . . . . . . . . . . . 26 34 32Weighted average maturity (in months) . . . . . . . . . . . . . . . . . . . . . . . . . . . . . . . . . . . . . . . . . . . . . . . . . . . . . . . . . . . . . . . . . . . . . . . 28 27 29
For the year ended December 31:Average securitized principal balance . . . . . . . . . . . . . . . . . . . . . . . . . . . . . . . . . . . . . . . . . . . . . . . . . . . . . . . . . . . . . . . . . . . . . . . . . 873 884 619Net credit losses. . . . . . . . . . . . . . . . . . . . . . . . . . . . . . . . . . . . . . . . . . . . . . . . . . . . . . . . . . . . . . . . . . . . . . . . . . . . . . . . . . . . . . . . . . . . . . . . 4 6 5
Contractual maturities of outstanding finance receivables:December 31, 2004
Retail RetailInstallment Finance Retail Wholesale
Amounts Due In Contracts Leases Notes Notes Total___________ _______ ______ ______ ______ ______2005 . . . . . . . . . . . . . . . . $ 2,361 $ 1,804 $ 1,698 $ 168 $ 6,0312006 . . . . . . . . . . . . . . . . 1,712 1,355 767 12 3,8462007 . . . . . . . . . . . . . . . . 1,089 820 536 8 2,4532008 . . . . . . . . . . . . . . . . 576 445 395 5 1,4212009 . . . . . . . . . . . . . . . . 189 210 366 4 769Thereafter . . . . . . . . . . . . 47 242 775 3 1,067_____ _____ _____ _____ ______
5,974 4,876 4,537 200 15,587Residual value . . . . . . . — 919 — — 919Less: Unearned
income . . . . . . . . . . . . 534 550 56 3 1,143_____ _____ _____ _____ ______Total. . . . . . . . . . . . . . . . . $ 5,440 $ 5,245 $ 4,481 $ 197 $ 15,363_____ _____ _____ _____ ___________ _____ _____ _____ ______
Impaired loans and leases:2004 2003 2002____ ____ ____
Average recorded investment . . . . . . . . . . . . . . . . . . . . . . $ 265 $ 321 $ 292____ ____ ________ ____ ____At December 31:
Recorded investment . . . . . . . . . . . . . . . . . . . . . . . . . . . . $ 181 $ 275 $ 366Less: Impaired loans/finance leases for which
there is no related allowance for credit losses(due to the fair value of underlying collateral) . . . 130 177 233____ ____ ____
Impaired loans/finance leases for which thereis a related allowance for credit losses. . . . . . . . . . . . $ 51 $ 98 $ 133____ ____ ________ ____ ____
Allowance for credit loss activity:2004 2003 2002_____ _____ _____
Balance at beginning of year . . . . . . . . . . . . . . . . . . . . . . $ 241 $ 207 $ 177Provision for credit losses . . . . . . . . . . . . . . . . . . . . . . . . 105 101 109Receivables written off . . . . . . . . . . . . . . . . . . . . . . . . . . . (88) (104) (103)Recoveries on receivables previously written off. . . . 16 22 18Other — net . . . . . . . . . . . . . . . . . . . . . . . . . . . . . . . . . . . . . 4 15 6_____ _____ _____Balance at end of year . . . . . . . . . . . . . . . . . . . . . . . . . . . . $ 278 $ 241 $ 207_____ _____ __________ _____ _____
In estimating the allowance for credit losses, we review accountsthat are past due, non-performing or in bankruptcy.
Cat Financial’s net retail finance leases:December 31,
2004 2003 2002_____ _____ _____Total minimum lease payments receivable . . . . . . . . . $4,876 $ 4,096 $3,752Estimated residual value of leased assets:
Guaranteed . . . . . . . . . . . . . . . . . . . . . . . . . . . . . . . . . . . . 379 323 268Unguaranteed. . . . . . . . . . . . . . . . . . . . . . . . . . . . . . . . . . 540 558 597_____ _____ _____
5,795 4,977 4,617Less: Unearned income . . . . . . . . . . . . . . . . . . . . . . . . . . 550 498 473_____ _____ _____Net retail finance leases . . . . . . . . . . . . . . . . . . . . . . . . . . $5,245 $ 4,479 $ 4,144_____ _____ __________ _____ _____

Caterpillar Inc.
A-19
December 31,(Millions of dollars) 2004 2003 2002_____ _____ _____Financial Position:
Assets:Current assets. . . . . . . . . . . . . . . . . . . . . . . . . . . . . . . . . . . $1,540 $ 1,494 $1,389Property, plant and equipment — net . . . . . . . . . 1,097 961 1,209Other assets . . . . . . . . . . . . . . . . . . . . . . . . . . . . . . . . . . . . . 145 202 493_____ _____ _____
2,782 2,657 3,091_____ _____ _____Liabilities:
Current liabilities. . . . . . . . . . . . . . . . . . . . . . . . . . . . . . . . $1,345 $ 1,247 $1,117Long-term debt due after one year . . . . . . . . . . . . . 276 343 808Other liabilities . . . . . . . . . . . . . . . . . . . . . . . . . . . . . . . . . . 214 257 249_____ _____ _____
1,835 1,847 2,174_____ _____ _____Ownership . . . . . . . . . . . . . . . . . . . . . . . . . . . . . . . . . . . . . . . . . $ 947 $ 810 $ 917_____ _____ __________ _____ _____
Caterpillar’s investment in unconsolidated affiliated companies:(Millions of dollars)Investment in equity method companies . . . . . . . . . $ 487 $ 432 $ 437Plus: Investment in cost method companies . . . . . 30 368 310_____ _____ _____Investment in unconsolidated
affiliated companies . . . . . . . . . . . . . . . . . . . . . . . . . . $ 517 $ 800 $ 747_____ _____ __________ _____ _____At December 31, 2004, consolidated “Profit employed in the
business” in Statement 2 included $153 million representingundistributed profit of the unconsolidated affiliated companies.In 2004, 2003 and 2002, we received $20 million, $25 millionand $4 million, respectively, in dividends from unconsolidatedaffiliated companies.
Certain investments in unconsolidated affiliated companiesare accounted for using the cost method. During first quarter2001, Cat Financial invested for a limited partnership interest ina venture financing structure associated with Caterpillar’s rentalstrategy in the United Kingdom. In the fourth quarter 2004, wesold our investment in this limited partnership. This sale had noimpact on earnings.
12. Intangible assets and goodwill
A. Intangible assetsIntangible assets are comprised of the following:(Millions of dollars) 2004 2003 2002______ _____ _____Intellectual property . . . . . . . . . . . . . . . . . . . . . . . . . . . . $ 213 $ 126 $ 137Pension-related . . . . . . . . . . . . . . . . . . . . . . . . . . . . . . . . 120 157 191Other . . . . . . . . . . . . . . . . . . . . . . . . . . . . . . . . . . . . . . . . . . 73 — —_____ _____ _____Total intangible assets — gross . . . . . . . . . . . . . . . . 406 283 328Less: Accumulated amortization of
finite lived intangible assets . . . . . . . . . . . . . . . . . . (91) (44) (47)_____ _____ _____Intangible assets — net . . . . . . . . . . . . . . . . . . . . . . . . $ 315 $ 239 $ 281_____ _____ __________ _____ _____
During 2004 we acquired finite lived intangible assets of $130 mil-lion. (See Note 26 on page A-34 for details on the acquisition ofthese assets.) Amortization expense was $18 million, $15 millionand $13 million for 2004, 2003 and 2002, respectively.
Amortization expense related to intangible assets is expectedto be:
(Millions of dollars)2005 2006 2007 2008 2009 Thereafter_____________________________________________________$22 $21 $18 $16 $15 $104
B. GoodwillDuring 2004 we acquired assets with related goodwill of $55 mil-lion. (See Note 26 on page A-34 for details on the acquisition ofthese assets.) No goodwill was acquired during the years endedDecember 31, 2003 and 2002. During 2003 we disposed of assets
with related goodwill of $3 million. No goodwill was disposedof during the years ended December 31, 2004 and 2002. On anannual basis, we test goodwill for impairment in accordance withStatement of Financial Accounting Standards No. 142 “Goodwilland Other Intangible Assets.” No goodwill was impaired duringthe years ended December 31, 2004, 2003 and 2002.
13. Available-for-sale securities
Cat Insurance and Caterpillar Investment Management Ltd. hadinvestments in certain debt and equity securities at December 31,2004, 2003 and 2002, that have been classified as available-for-salein accordance with SFAS 115 and recorded at fair value basedupon quoted market prices. These fair values are included in“Other assets” in Statement 3. Gains and losses arising from therevaluation of available-for-sale securities are included, net ofapplicable deferred income taxes, in equity (“Accumulated othercomprehensive income” in Statement 3). Realized gains andlosses on sales of investments are generally determined usingthe specific identification method for debt instruments and theFIFO method for equity securities. Realized gains and losses areincluded in “Other income (expense)” in Statement 1.
December 31, 2004Unrealized
Cost Pre-Tax Net Fair(Millions of dollars) Basis Gains (Losses) Value____ __________ ____Government debt . . . . . . . . . . . . . . . . . . . . . . . . . . . $ 239 $ (1) $ 238Corporate bonds . . . . . . . . . . . . . . . . . . . . . . . . . . . . 342 — 342Equity securities . . . . . . . . . . . . . . . . . . . . . . . . . . . . 203 21 224____ ____ ____
$ 784 $ 20 $ 804____ ____ ________ ____ ____December 31, 2003
UnrealizedCost Pre-Tax Net Fair
(Millions of dollars) Basis Gains Value____ __________ ____Government debt . . . . . . . . . . . . . . . . . . . . . . . . . . . $ 102 $ — $ 102Corporate bonds . . . . . . . . . . . . . . . . . . . . . . . . . . . . 288 3 291Equity securities . . . . . . . . . . . . . . . . . . . . . . . . . . . . 191 21 212____ ____ ____
$ 581 $ 24 $ 605____ ____ ________ ____ ____December 31, 2002
UnrealizedCost Pre-Tax Net Fair
(Millions of dollars) Basis Gains (Losses) Value____ __________ ____Government debt . . . . . . . . . . . . . . . . . . . . . . . . . . . $ 89 $ — $ 89Corporate bonds . . . . . . . . . . . . . . . . . . . . . . . . . . . . 208 1 209Equity securities . . . . . . . . . . . . . . . . . . . . . . . . . . . . 220 (51) 169____ ____ ____
$ 517 $ (50) $ 467____ ____ ________ ____ ____Investments in an unrealized loss position thatare not other-than-temporarily impaired
(Millions of dollars)
Government debt . . .Corporate bonds . . .Equity securities. . . .
Total . . . . . . . . . . . . . .(1) Indicates length of time that individual securities have been in a continuous unrealized loss position.
$ 5$ 414$ 1$ 46$ 4$ 368148—2146319113521561175—91166
Unreal-ized
LossesFair
Value
Unreal-ized
LossesFair
Value
Unreal-ized
LossesFair
Value
TotalMore than
12 months(1)Less than
12 months(1)
December 31, 2004
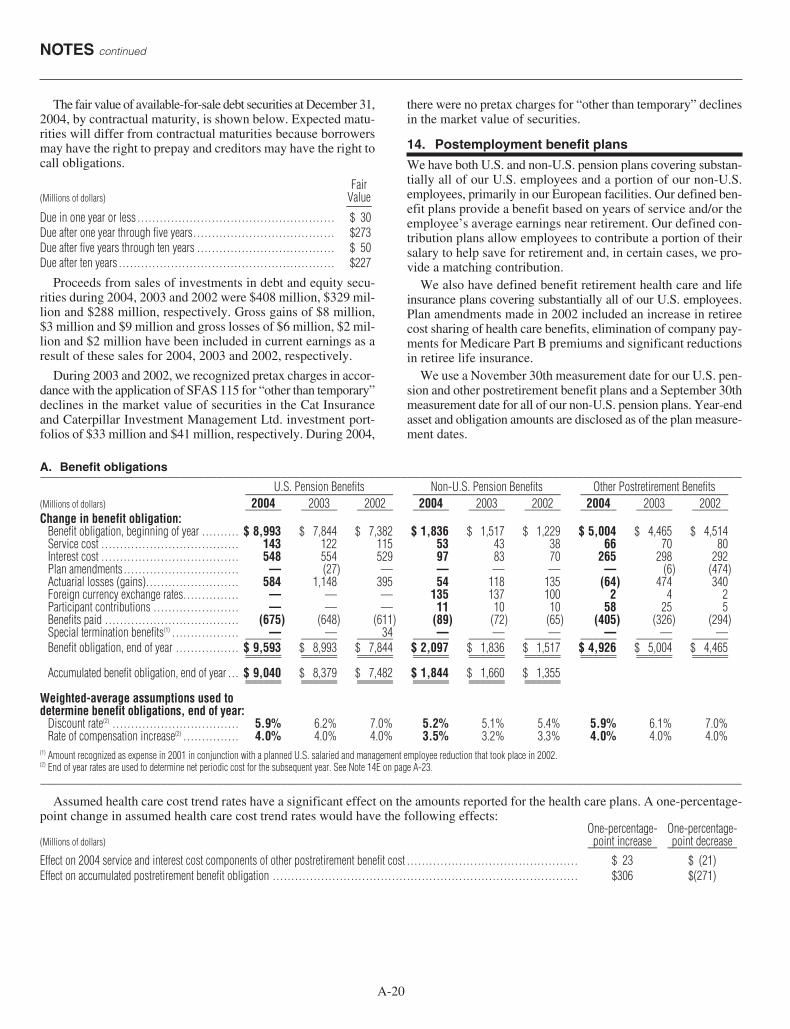
NOTES continued
A-20
A. Benefit obligations_______________________________________________________________________________________________________________U.S. Pension Benefits Non-U.S. Pension Benefits Other Postretirement Benefits________________________ ________________________ ________________________
(Millions of dollars) 2004 2003 2002 2004 2003 2002 2004 2003 2002______ ______ ______ ______ ______ ______ ______ ______ ______Change in benefit obligation:
Benefit obligation, beginning of year . . . . . . . . . . $ 8,993 $ 7,844 $ 7,382 $ 1,836 $ 1,517 $ 1,229 $ 5,004 $ 4,465 $ 4,514Service cost . . . . . . . . . . . . . . . . . . . . . . . . . . . . . . . . . . . . . 143 122 115 53 43 38 66 70 80Interest cost . . . . . . . . . . . . . . . . . . . . . . . . . . . . . . . . . . . . . 548 554 529 97 83 70 265 298 292Plan amendments . . . . . . . . . . . . . . . . . . . . . . . . . . . . . . . — (27) — — — — — (6) (474)Actuarial losses (gains). . . . . . . . . . . . . . . . . . . . . . . . . 584 1,148 395 54 118 135 (64) 474 340Foreign currency exchange rates. . . . . . . . . . . . . . . — — — 135 137 100 2 4 2Participant contributions . . . . . . . . . . . . . . . . . . . . . . . — — — 11 10 10 58 25 5Benefits paid . . . . . . . . . . . . . . . . . . . . . . . . . . . . . . . . . . . . (675) (648) (611) (89) (72) (65) (405) (326) (294)Special termination benefits(1) . . . . . . . . . . . . . . . . . . — — 34 — — — — — —______ ______ ______ ______ ______ ______ ______ ______ ______Benefit obligation, end of year . . . . . . . . . . . . . . . . . $ 9,593 $ 8,993 $ 7,844 $ 2,097 $ 1,836 $ 1,517 $ 4,926 $ 5,004 $ 4,465______ ______ ______ ______ ______ ______ ______ ______ ____________ ______ ______ ______ ______ ______ ______ ______ ______
Accumulated benefit obligation, end of year . . . $ 9,040 $ 8,379 $ 7,482 $ 1,844 $ 1,660 $ 1,355______ ______ ______ ______ ______ ____________ ______ ______ ______ ______ ______
Weighted-average assumptions used todetermine benefit obligations, end of year:
Discount rate(2) . . . . . . . . . . . . . . . . . . . . . . . . . . . . . . . . . . 5.9% 6.2% 7.0% 5.2% 5.1% 5.4% 5.9% 6.1% 7.0%Rate of compensation increase(2) . . . . . . . . . . . . . . . 4.0% 4.0% 4.0% 3.5% 3.2% 3.3% 4.0% 4.0% 4.0%
(1) Amount recognized as expense in 2001 in conjunction with a planned U.S. salaried and management employee reduction that took place in 2002.(2) End of year rates are used to determine net periodic cost for the subsequent year. See Note 14E on page A-23._______________________________________________________________________________________________________________
Assumed health care cost trend rates have a significant effect on the amounts reported for the health care plans. A one-percentage-point change in assumed health care cost trend rates would have the following effects:
One-percentage- One-percentage-(Millions of dollars) point increase point decrease___________ ___________Effect on 2004 service and interest cost components of other postretirement benefit cost . . . . . . . . . . . . . . . . . . . . . . . . . . . . . . . . . . . . . . . . . . . . . . $ 23 $ (21)Effect on accumulated postretirement benefit obligation . . . . . . . . . . . . . . . . . . . . . . . . . . . . . . . . . . . . . . . . . . . . . . . . . . . . . . . . . . . . . . . . . . . . . . . . . . . . . . . . . . $306 $(271)
The fair value of available-for-sale debt securities at December 31,2004, by contractual maturity, is shown below. Expected matu-rities will differ from contractual maturities because borrowersmay have the right to prepay and creditors may have the right tocall obligations.
Fair(Millions of dollars) Value____Due in one year or less . . . . . . . . . . . . . . . . . . . . . . . . . . . . . . . . . . . . . . . . . . . . . . . . . . . . . $ 30Due after one year through five years. . . . . . . . . . . . . . . . . . . . . . . . . . . . . . . . . . . . . . $273Due after five years through ten years . . . . . . . . . . . . . . . . . . . . . . . . . . . . . . . . . . . . . $ 50Due after ten years . . . . . . . . . . . . . . . . . . . . . . . . . . . . . . . . . . . . . . . . . . . . . . . . . . . . . . . . . . $227
Proceeds from sales of investments in debt and equity secu-rities during 2004, 2003 and 2002 were $408 million, $329 mil-lion and $288 million, respectively. Gross gains of $8 million,$3 million and $9 million and gross losses of $6 million, $2 mil-lion and $2 million have been included in current earnings as aresult of these sales for 2004, 2003 and 2002, respectively.
During 2003 and 2002, we recognized pretax charges in accor-dance with the application of SFAS 115 for “other than temporary”declines in the market value of securities in the Cat Insuranceand Caterpillar Investment Management Ltd. investment port-folios of $33 million and $41 million, respectively. During 2004,
there were no pretax charges for “other than temporary” declinesin the market value of securities.
14. Postemployment benefit plans
We have both U.S. and non-U.S. pension plans covering substan-tially all of our U.S. employees and a portion of our non-U.S.employees, primarily in our European facilities. Our defined ben-efit plans provide a benefit based on years of service and/or theemployee’s average earnings near retirement. Our defined con-tribution plans allow employees to contribute a portion of theirsalary to help save for retirement and, in certain cases, we pro-vide a matching contribution.
We also have defined benefit retirement health care and lifeinsurance plans covering substantially all of our U.S. employees.Plan amendments made in 2002 included an increase in retireecost sharing of health care benefits, elimination of company pay-ments for Medicare Part B premiums and significant reductionsin retiree life insurance.
We use a November 30th measurement date for our U.S. pen-sion and other postretirement benefit plans and a September 30thmeasurement date for all of our non-U.S. pension plans. Year-endasset and obligation amounts are disclosed as of the plan measure-ment dates.
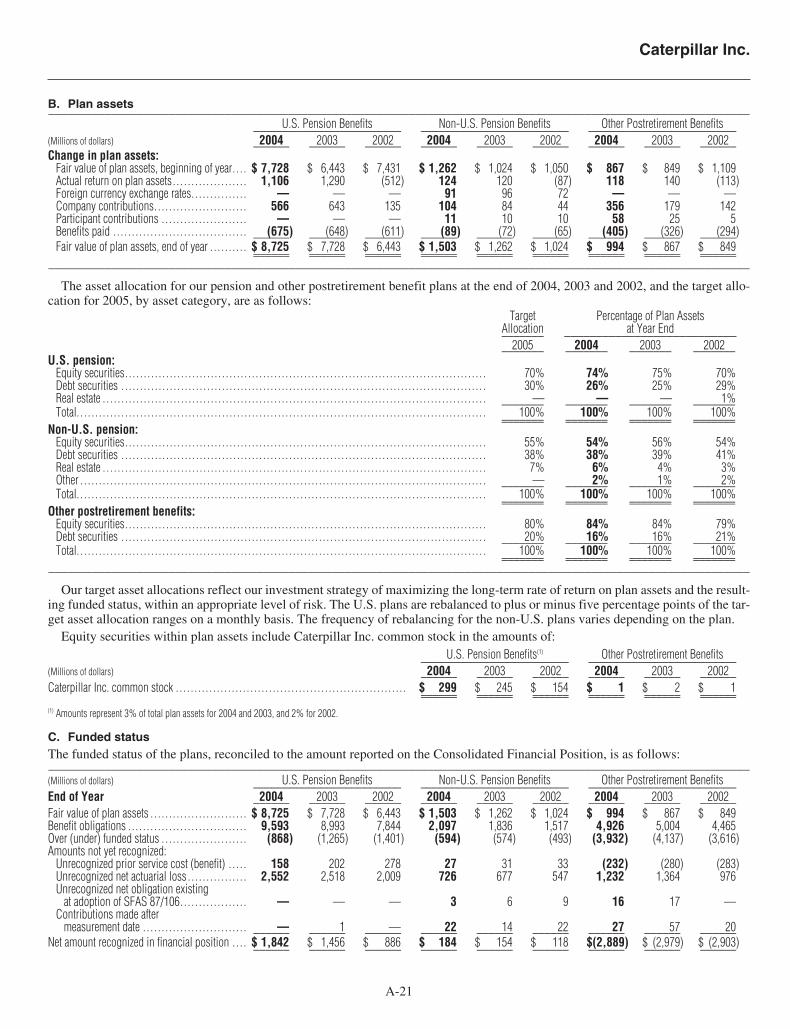
Caterpillar Inc.
A-21
B. Plan assets_______________________________________________________________________________________________________________U.S. Pension Benefits Non-U.S. Pension Benefits Other Postretirement Benefits________________________ ________________________ ________________________
(Millions of dollars) 2004 2003 2002 2004 2003 2002 2004 2003 2002______ ______ ______ ______ ______ ______ ______ ______ ______Change in plan assets:
Fair value of plan assets, beginning of year. . . . $ 7,728 $ 6,443 $ 7,431 $ 1,262 $ 1,024 $ 1,050 $ 867 $ 849 $ 1,109Actual return on plan assets. . . . . . . . . . . . . . . . . . . . 1,106 1,290 (512) 124 120 (87) 118 140 (113)Foreign currency exchange rates. . . . . . . . . . . . . . . — — — 91 96 72 — — —Company contributions. . . . . . . . . . . . . . . . . . . . . . . . . 566 643 135 104 84 44 356 179 142Participant contributions . . . . . . . . . . . . . . . . . . . . . . . — — — 11 10 10 58 25 5Benefits paid . . . . . . . . . . . . . . . . . . . . . . . . . . . . . . . . . . . . (675) (648) (611) (89) (72) (65) (405) (326) (294)______ ______ ______ ______ ______ ______ ______ ______ ______Fair value of plan assets, end of year . . . . . . . . . . $ 8,725 $ 7,728 $ 6,443 $ 1,503 $ 1,262 $ 1,024 $ 994 $ 867 $ 849______ ______ ______ ______ ______ ______ ______ ______ ____________ ______ ______ ______ ______ ______ ______ ______ ______
_______________________________________________________________________________________________________________
The asset allocation for our pension and other postretirement benefit plans at the end of 2004, 2003 and 2002, and the target allo-cation for 2005, by asset category, are as follows:
Target Percentage of Plan Assets Allocation at Year End_______ ___________________________
2005 2004 2003 2002_______ _______ _______ _______U.S. pension:
Equity securities. . . . . . . . . . . . . . . . . . . . . . . . . . . . . . . . . . . . . . . . . . . . . . . . . . . . . . . . . . . . . . . . . . . . . . . . . . . . . . . . . . . . . . . . . . . . . . . . . 70% 74% 75% 70%Debt securities . . . . . . . . . . . . . . . . . . . . . . . . . . . . . . . . . . . . . . . . . . . . . . . . . . . . . . . . . . . . . . . . . . . . . . . . . . . . . . . . . . . . . . . . . . . . . . . . . . 30% 26% 25% 29%Real estate . . . . . . . . . . . . . . . . . . . . . . . . . . . . . . . . . . . . . . . . . . . . . . . . . . . . . . . . . . . . . . . . . . . . . . . . . . . . . . . . . . . . . . . . . . . . . . . . . . . . . . . — — — 1%_______ _______ _______ _______Total. . . . . . . . . . . . . . . . . . . . . . . . . . . . . . . . . . . . . . . . . . . . . . . . . . . . . . . . . . . . . . . . . . . . . . . . . . . . . . . . . . . . . . . . . . . . . . . . . . . . . . . . . . . . . . 100% 100% 100% 100%_______ _______ _______ ______________ _______ _______ _______
Non-U.S. pension:Equity securities. . . . . . . . . . . . . . . . . . . . . . . . . . . . . . . . . . . . . . . . . . . . . . . . . . . . . . . . . . . . . . . . . . . . . . . . . . . . . . . . . . . . . . . . . . . . . . . . . 55% 54% 56% 54%Debt securities . . . . . . . . . . . . . . . . . . . . . . . . . . . . . . . . . . . . . . . . . . . . . . . . . . . . . . . . . . . . . . . . . . . . . . . . . . . . . . . . . . . . . . . . . . . . . . . . . . 38% 38% 39% 41%Real estate . . . . . . . . . . . . . . . . . . . . . . . . . . . . . . . . . . . . . . . . . . . . . . . . . . . . . . . . . . . . . . . . . . . . . . . . . . . . . . . . . . . . . . . . . . . . . . . . . . . . . . . 7% 6% 4% 3%Other . . . . . . . . . . . . . . . . . . . . . . . . . . . . . . . . . . . . . . . . . . . . . . . . . . . . . . . . . . . . . . . . . . . . . . . . . . . . . . . . . . . . . . . . . . . . . . . . . . . . . . . . . . . . . — 2% 1% 2%_______ _______ _______ _______Total. . . . . . . . . . . . . . . . . . . . . . . . . . . . . . . . . . . . . . . . . . . . . . . . . . . . . . . . . . . . . . . . . . . . . . . . . . . . . . . . . . . . . . . . . . . . . . . . . . . . . . . . . . . . . . 100% 100% 100% 100%_______ _______ _______ ______________ _______ _______ _______
Other postretirement benefits:Equity securities. . . . . . . . . . . . . . . . . . . . . . . . . . . . . . . . . . . . . . . . . . . . . . . . . . . . . . . . . . . . . . . . . . . . . . . . . . . . . . . . . . . . . . . . . . . . . . . . . 80% 84% 84% 79%Debt securities . . . . . . . . . . . . . . . . . . . . . . . . . . . . . . . . . . . . . . . . . . . . . . . . . . . . . . . . . . . . . . . . . . . . . . . . . . . . . . . . . . . . . . . . . . . . . . . . . . 20% 16% 16% 21%_______ _______ _______ _______Total. . . . . . . . . . . . . . . . . . . . . . . . . . . . . . . . . . . . . . . . . . . . . . . . . . . . . . . . . . . . . . . . . . . . . . . . . . . . . . . . . . . . . . . . . . . . . . . . . . . . . . . . . . . . . . 100% 100% 100% 100%_______ _______ _______ ______________ _______ _______ _______
_______________________________________________________________________________________________________________
Our target asset allocations reflect our investment strategy of maximizing the long-term rate of return on plan assets and the result-ing funded status, within an appropriate level of risk. The U.S. plans are rebalanced to plus or minus five percentage points of the tar-get asset allocation ranges on a monthly basis. The frequency of rebalancing for the non-U.S. plans varies depending on the plan.
Equity securities within plan assets include Caterpillar Inc. common stock in the amounts of:U.S. Pension Benefits(1) Other Postretirement Benefits________________________ ________________________
(Millions of dollars) 2004 2003 2002 2004 2003 2002______ ______ ______ ______ ______ ______Caterpillar Inc. common stock . . . . . . . . . . . . . . . . . . . . . . . . . . . . . . . . . . . . . . . . . . . . . . . . . . . . . . . . . . . . . . $ 299 $ 245 $ 154 $ 1 $ 2 $ 1______ ______ ______ ______ ______ ____________ ______ ______ ______ ______ ______(1) Amounts represent 3% of total plan assets for 2004 and 2003, and 2% for 2002.
C. Funded statusThe funded status of the plans, reconciled to the amount reported on the Consolidated Financial Position, is as follows:_______________________________________________________________________________________________________________(Millions of dollars) U.S. Pension Benefits Non-U.S. Pension Benefits Other Postretirement Benefits________________________ ________________________ ________________________End of Year 2004 2003 2002 2004 2003 2002 2004 2003 2002______ ______ ______ ______ ______ ______ ______ ______ ______Fair value of plan assets . . . . . . . . . . . . . . . . . . . . . . . . . . $ 8,725 $ 7,728 $ 6,443 $ 1,503 $ 1,262 $ 1,024 $ 994 $ 867 $ 849Benefit obligations . . . . . . . . . . . . . . . . . . . . . . . . . . . . . . . . 9,593 8,993 7,844 2,097 1,836 1,517 4,926 5,004 4,465Over (under) funded status . . . . . . . . . . . . . . . . . . . . . . . (868) (1,265) (1,401) (594) (574) (493) (3,932) (4,137) (3,616)Amounts not yet recognized:
Unrecognized prior service cost (benefit) . . . . . 158 202 278 27 31 33 (232) (280) (283)Unrecognized net actuarial loss . . . . . . . . . . . . . . . . 2,552 2,518 2,009 726 677 547 1,232 1,364 976Unrecognized net obligation existing
at adoption of SFAS 87/106. . . . . . . . . . . . . . . . . . — — — 3 6 9 16 17 —Contributions made after
measurement date . . . . . . . . . . . . . . . . . . . . . . . . . . . . — 1 — 22 14 22 27 57 20______ ______ ______ ______ ______ ______ ______ ______ ______Net amount recognized in financial position . . . . $ 1,842 $ 1,456 $ 886 $ 184 $ 154 $ 118 $(2,889) $ (2,979) $ (2,903)______ ______ ______ ______ ______ ______ ______ ______ ______
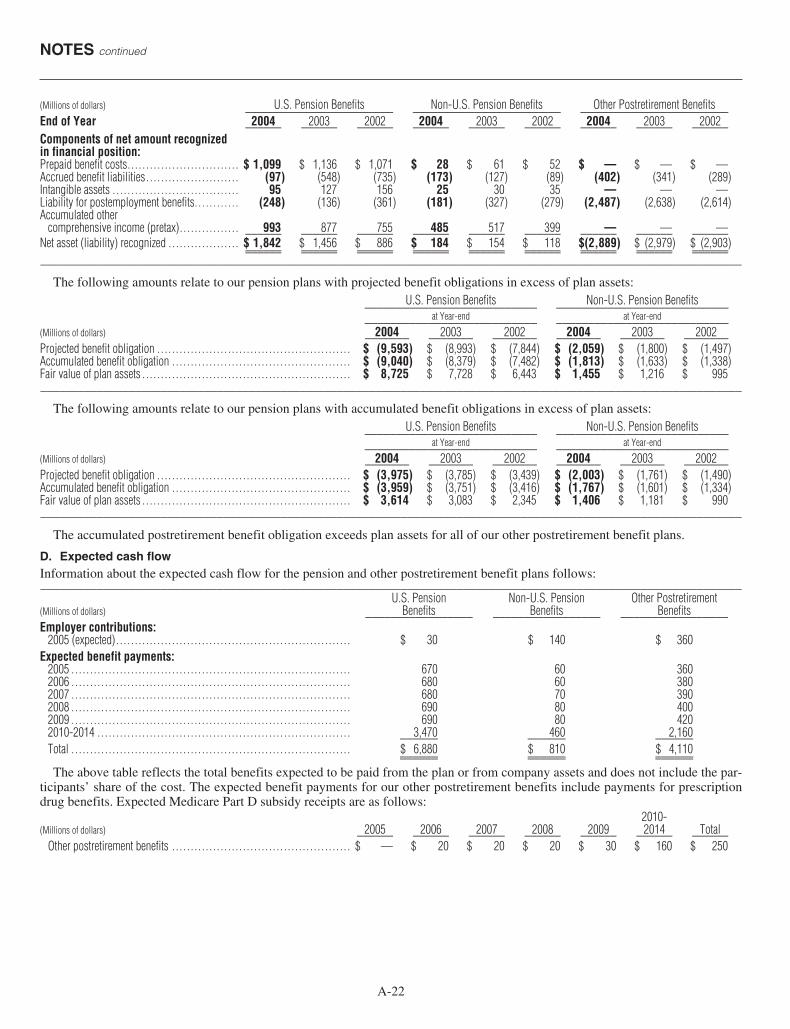
NOTES continued
A-22
(Millions of dollars) U.S. Pension Benefits Non-U.S. Pension Benefits Other Postretirement Benefits________________________ ________________________ ________________________End of Year 2004 2003 2002 2004 2003 2002 2004 2003 2002______ ______ ______ ______ ______ ______ ______ ______ ______Components of net amount recognizedin financial position:Prepaid benefit costs. . . . . . . . . . . . . . . . . . . . . . . . . . . . . . $ 1,099 $ 1,136 $ 1,071 $ 28 $ 61 $ 52 $ — $ — $ —Accrued benefit liabilities. . . . . . . . . . . . . . . . . . . . . . . . . (97) (548) (735) (173) (127) (89) (402) (341) (289)Intangible assets . . . . . . . . . . . . . . . . . . . . . . . . . . . . . . . . . . 95 127 156 25 30 35 — — —Liability for postemployment benefits. . . . . . . . . . . . (248) (136) (361) (181) (327) (279) (2,487) (2,638) (2,614)Accumulated other
comprehensive income (pretax). . . . . . . . . . . . . . . . 993 877 755 485 517 399 — — —______ ______ ______ ______ ______ ______ ______ ______ ______Net asset (liability) recognized . . . . . . . . . . . . . . . . . . . $ 1,842 $ 1,456 $ 886 $ 184 $ 154 $ 118 $(2,889) $ (2,979) $ (2,903)______ ______ ______ ______ ______ ______ ______ ______ ____________ ______ ______ ______ ______ ______ ______ ______ _____________________________________________________________________________________________________________________
The following amounts relate to our pension plans with projected benefit obligations in excess of plan assets:U.S. Pension Benefits Non-U.S. Pension Benefits___________________________ ___________________________
at Year-end at Year-end___________________________ ___________________________(Millions of dollars) 2004 2003 2002 2004 2003 2002_______ _______ _______ _______ _______ _______Projected benefit obligation . . . . . . . . . . . . . . . . . . . . . . . . . . . . . . . . . . . . . . . . . . . . . . . . . . . . $ (9,593) $ (8,993) $ (7,844) $ (2,059) $ (1,800) $ (1,497)Accumulated benefit obligation . . . . . . . . . . . . . . . . . . . . . . . . . . . . . . . . . . . . . . . . . . . . . . . . $ (9,040) $ (8,379) $ (7,482) $ (1,813) $ (1,633) $ (1,338)Fair value of plan assets . . . . . . . . . . . . . . . . . . . . . . . . . . . . . . . . . . . . . . . . . . . . . . . . . . . . . . . . $ 8,725 $ 7,728 $ 6,443 $ 1,455 $ 1,216 $ 995_______________________________________________________________________________________________________________
The following amounts relate to our pension plans with accumulated benefit obligations in excess of plan assets:U.S. Pension Benefits Non-U.S. Pension Benefits___________________________ ___________________________
at Year-end at Year-end___________________________ ___________________________(Millions of dollars) 2004 2003 2002 2004 2003 2002_______ _______ _______ _______ _______ _______Projected benefit obligation . . . . . . . . . . . . . . . . . . . . . . . . . . . . . . . . . . . . . . . . . . . . . . . . . . . . $ (3,975) $ (3,785) $ (3,439) $ (2,003) $ (1,761) $ (1,490)Accumulated benefit obligation . . . . . . . . . . . . . . . . . . . . . . . . . . . . . . . . . . . . . . . . . . . . . . . . $ (3,959) $ (3,751) $ (3,416) $ (1,767) $ (1,601) $ (1,334)Fair value of plan assets . . . . . . . . . . . . . . . . . . . . . . . . . . . . . . . . . . . . . . . . . . . . . . . . . . . . . . . . $ 3,614 $ 3,083 $ 2,345 $ 1,406 $ 1,181 $ 990_______________________________________________________________________________________________________________
The accumulated postretirement benefit obligation exceeds plan assets for all of our other postretirement benefit plans.
D. Expected cash flowInformation about the expected cash flow for the pension and other postretirement benefit plans follows:_______________________________________________________________________________________________________________
U.S. Pension Non-U.S. Pension Other Postretirement(Millions of dollars) Benefits Benefits Benefits_________________ _________________ _________________Employer contributions:
2005 (expected). . . . . . . . . . . . . . . . . . . . . . . . . . . . . . . . . . . . . . . . . . . . . . . . . . . . . . . . . . . . . . . $ 30 $ 140 $ 360Expected benefit payments:
2005 . . . . . . . . . . . . . . . . . . . . . . . . . . . . . . . . . . . . . . . . . . . . . . . . . . . . . . . . . . . . . . . . . . . . . . . . . . . 670 60 3602006 . . . . . . . . . . . . . . . . . . . . . . . . . . . . . . . . . . . . . . . . . . . . . . . . . . . . . . . . . . . . . . . . . . . . . . . . . . . 680 60 3802007 . . . . . . . . . . . . . . . . . . . . . . . . . . . . . . . . . . . . . . . . . . . . . . . . . . . . . . . . . . . . . . . . . . . . . . . . . . . 680 70 3902008 . . . . . . . . . . . . . . . . . . . . . . . . . . . . . . . . . . . . . . . . . . . . . . . . . . . . . . . . . . . . . . . . . . . . . . . . . . . 690 80 4002009 . . . . . . . . . . . . . . . . . . . . . . . . . . . . . . . . . . . . . . . . . . . . . . . . . . . . . . . . . . . . . . . . . . . . . . . . . . . 690 80 4202010-2014 . . . . . . . . . . . . . . . . . . . . . . . . . . . . . . . . . . . . . . . . . . . . . . . . . . . . . . . . . . . . . . . . . . . . 3,470 460 2,160______ ______ ______Total . . . . . . . . . . . . . . . . . . . . . . . . . . . . . . . . . . . . . . . . . . . . . . . . . . . . . . . . . . . . . . . . . . . . . . . . . . . $ 6,880 $ 810 $ 4,110______ ______ ____________ ______ ______The above table reflects the total benefits expected to be paid from the plan or from company assets and does not include the par-
ticipants’ share of the cost. The expected benefit payments for our other postretirement benefits include payments for prescriptiondrug benefits. Expected Medicare Part D subsidy receipts are as follows:
2010-(Millions of dollars) 2005 2006 2007 2008 2009 2014 Total______ ______ ______ ______ ______ ______ ______
Other postretirement benefits . . . . . . . . . . . . . . . . . . . . . . . . . . . . . . . . . . . . . . . . . . . . . . . . $ — $ 20 $ 20 $ 20 $ 30 $ 160 $ 250

E. Net periodic cost_______________________________________________________________________________________________________________U.S. Pension Benefits Non-U.S. Pension Benefits Other Postretirement Benefits________________________ ________________________ ________________________
(Millions of dollars) 2004 2003 2002 2004 2003 2002 2004 2003 2002______ ______ ______ ______ ______ ______ ______ ______ ______Components of net periodic benefit cost:
Service cost . . . . . . . . . . . . . . . . . . . . . . . . . . . . . . . . . . . . . $ 143 $ 122 $ 115 $ 53 $ 43 $ 38 $ 66 $ 70 $ 80Interest cost . . . . . . . . . . . . . . . . . . . . . . . . . . . . . . . . . . . . . 548 554 529 97 83 70 265 298 292Expected return on plan assets. . . . . . . . . . . . . . . . . (697) (680) (783) (103) (94) (94) (74) (88) (115)Amortization of:
Net asset existing at adoptionof SFAS 87/106. . . . . . . . . . . . . . . . . . . . . . . . . . . . . — — — 3 3 (2) 2 — —
Prior service cost(1). . . . . . . . . . . . . . . . . . . . . . . . . . . . 44 49 50 6 5 5 (48) (47) (22)Net actuarial loss (gain) . . . . . . . . . . . . . . . . . . . . . . 142 27 (1) 38 14 — 45 36 5______ ______ ______ ______ ______ ______ ______ ______ ______
Total cost (benefit) included inoperating profit. . . . . . . . . . . . . . . . . . . . . . . . . . . . . . . . $ 180 $ 72 $ (90) $ 94 $ 54 $ 17 $ 256 $ 269 $ 240______ ______ ______ ______ ______ ______ ______ ______ ____________ ______ ______ ______ ______ ______ ______ ______ ______
Weighted-average assumptionsused to determine net cost:
Discount rate . . . . . . . . . . . . . . . . . . . . . . . . . . . . . . . . . . . . 6.2% 7.0% 7.3% 5.1% 5.4% 5.7% 6.1% 7.0% 7.2%Expected return on plan assets(2) . . . . . . . . . . . . . . . 9.0% 9.0% 9.8% 7.4% 7.1% 7.6% 9.0% 9.0% 9.8%Rate of compensation increase. . . . . . . . . . . . . . . . . 4.0% 4.0% 4.0% 3.2% 3.3% 3.3% 4.0% 4.0% 4.0%
(1) Prior service costs are amortized using the straight-line method over the average remaining service period to the full retirement eligibility date of employees expected to receive benefits from the plan amendment.(2) The weighted-average rates for 2005 are 9.0% and 7.4% for U.S. and non-U.S. plans, respectively._______________________________________________________________________________________________________________
Caterpillar Inc.
A-23
Our U.S. expected long-term rate of return on plan assets isbased on our estimate of long-term passive returns for equitiesand fixed income securities weighted by the allocation of ourpension assets. Based on historical performance, we increase thepassive returns due to our active management of the plan assets.To arrive at our expected long-term return, the amount addedfor active management was 1% for 2004, 2003 and 2002. A simi-lar process is used to determine this rate for our non-U.S. plans.
The assumed health care trend rate represents the rate at whichhealth care costs are assumed to increase. To calculate the 2004benefit expense, we assumed an increase of 8.5% for 2004. Thisrate was assumed to decrease gradually to the ultimate health caretrend rate of 4.5% in 2009. This rate represents 2.5% generalinflation plus 2.0% additional health care inflation. Based on ourrecent expenses and our forecast of changes, we expect an increaseof 8.4% during 2005 with a gradual decrease to the ultimatehealth care trend rate of 5.0% in 2012. The revised ultimate raterepresents 3.0% general inflation plus 2.0% additional healthcare inflation.
Our U.S. postretirement health care plans provide for pre-scription drug benefits. On December 8, 2003, the MedicarePrescription Drug, Improvement and Modernization Act of 2003(the Act) was signed into law. The Act introduces a prescriptiondrug benefit under Medicare (Medicare Part D) as well as a fed-eral subsidy to sponsors of retiree health care benefit plans thatprovide a benefit that is at least actuarially equivalent to MedicarePart D. In January 2004, the FASB issued FASB Staff PositionNo. 106-1 (FSP 106-1), “Accounting and Disclosure Require-ments Related to the Medicare Prescription Drug, Improvementand Modernization Act of 2003.” As permitted by FSP 106-1,we made a one-time election to defer accounting for the effectsof the Act pending further guidance from the FASB.
In May 2004, the FASB issued FASB Staff Position No. 106-2(FSP 106-2), which superseded FSP 106-1. FSP 106-2 providesaccounting guidance to employers that have determined that pre-scription drug benefits available under their retiree health carebenefit plans are at least actuarially equivalent to Medicare Part D.
The FSP requires that the benefit attributable to past service beaccounted for as an actuarial gain and the benefit related to cur-rent service be reported as a reduction in service cost.
We have determined that most of our U.S. retiree health careplans are at least actuarially equivalent to Medicare Part D andwill qualify for the federal subsidy. In the third quarter of 2004,we adopted FSP 106-2 retroactive to December 31, 2003 (theperiod end that includes the date of the Act’s enactment) as per-mitted by the FSP. The impact was a reduction in our accumu-lated postretirement benefit obligation of $284 million relatedto benefits attributed to past service. The reduction in the com-ponents of 2004 net periodic postretirement benefits expensewas as follows:(Millions of dollars) 2004______Service cost . . . . . . . . . . . . . . . . . . . . . . . . . . . . . . . . . . . . . . . . . . . . . . . . . . . . . . . $ 4Interest cost . . . . . . . . . . . . . . . . . . . . . . . . . . . . . . . . . . . . . . . . . . . . . . . . . . . . . . . 18Amortization of actuarial gain . . . . . . . . . . . . . . . . . . . . . . . . . . . . . . . . . . . . . . 29______Total reduction in net periodic postretirement benefit cost . . . . . . . . . . . $ 51____________F. Other postemployment benefit plansWe offer long-term disability benefits, continued health care fordisabled employees, survivor income benefits insurance and sup-plemental unemployment benefits to substantially all eligibleU.S. employees.
G. Summary of long-term liability:December 31,
(Millions of dollars) 2004 2003 2002______ _____ _____Pensions:
U.S. pensions. . . . . . . . . . . . . . . . . . . . . . . . . . . . . . . . $ 248 $ 136 $ 361Non-U.S. pensions . . . . . . . . . . . . . . . . . . . . . . . . . . . 181 327 279______ _____ _____
Total pensions . . . . . . . . . . . . . . . . . . . . . . . . . . . . . . . . . 429 463 640Postretirement benefits other than pensions. . . . . . 2,487 2,638 2,614Other postemployment benefits . . . . . . . . . . . . . . . . . 70 71 79______ _____ _____
$2,986 $ 3,172 $3,333______ _____ ___________ _____ _____H. Defined contribution plansWe have both U.S. and non-U.S. employee defined contributionplans to help employees save for retirement. In January 2003,

NOTES continued
A-24
we introduced a company match to our U.S. 401(k) plan. Thisplan allows eligible employees to contribute a portion of theirsalary to the plan on a tax-deferred basis, and we provide amatching contribution equal to 100% of employee contributionsto the plan up to 6% of their compensation.
Various other U.S. and non-U.S. defined contribution plansallow eligible employees to contribute a portion of their salaryto the plans and, in some cases, we provide a matching contri-bution to the funds.
Total company costs related to U.S. and non-U.S. defined con-tribution plans were:(Millions of dollars) 2004 2003 2002______ _____ _____U.S. plans . . . . . . . . . . . . . . . . . . . . . . . . . . . . . . . . . . . . . $ 110 $ 106 $ 28Non-U.S. plans . . . . . . . . . . . . . . . . . . . . . . . . . . . . . . . . 11 11 7______ _____ _____
$ 121 $ 117 $ 35______ _____ ___________ _____ _____
15. Short-term borrowingsDecember 31,
(Millions of dollars) 2004 2003 2002______ _____ _____Machinery and Engines:
Notes payable to banks . . . . . . . . . . . . . . . . . . . . . . . $ 93 $ 72 $ 64Financial Products:
Notes payable to banks . . . . . . . . . . . . . . . . . . . . . . . 370 183 174Commercial paper. . . . . . . . . . . . . . . . . . . . . . . . . . . . 2,972 2,087 1,682Collateralized trust obligation . . . . . . . . . . . . . . . . . 240 — —Demand notes . . . . . . . . . . . . . . . . . . . . . . . . . . . . . . . 482 415 255_____ _____ _____
4,064 2,685 2,111_____ _____ _____Total short-term borrowings . . . . . . . . . . . . . . . . . . . . $4,157 $ 2,757 $2,175_____ _____ __________ _____ _____
See Note 6 on page A-16 for further discussion of the collat-eralized trust obligation.
The weighted average interest rates on external short-termborrowings outstanding were: December 31,
2004 2003 2002_____ _____ _____Notes payable to banks . . . . . . . . . . . . . . . . . . . . . . . . . 5.9% 6.5% 5.7%Commercial paper . . . . . . . . . . . . . . . . . . . . . . . . . . . . . 2.5% 2.1% 2.5%Collateralized trust obligation . . . . . . . . . . . . . . . . . . . 2.3% — —Demand notes . . . . . . . . . . . . . . . . . . . . . . . . . . . . . . . . . 2.3% 2.3% 2.8%
Please refer to Note 20 on pages A-25 to A-26 and Table IIIon page A-27 for fair value information on short-term borrowings.
16. Long-term debtDecember 31,
(Millions of dollars) 2004 2003 2002_____ _____ _____Machinery and Engines:
Notes — 6.550% due 2011 . . . . . . . . . . . . . . . . $ 250 $ 250 $ 249Debentures — 9.000% due 2006. . . . . . . . . . . 206 208 209Debentures — 6.000% due 2007. . . . . . . . . . . — — 189Debentures — 7.250% due 2009. . . . . . . . . . . 313 315 318Debentures — 9.375% due 2011. . . . . . . . . . . 123 123 123Debentures — 9.375% due 2021. . . . . . . . . . . 236 236 236Debentures — 8.000% due 2023. . . . . . . . . . . 199 199 199Debentures — 6.625% due 2028. . . . . . . . . . . 299 299 299Debentures — 7.300% due 2031. . . . . . . . . . . 348 348 348Debentures — 6.950% due 2042. . . . . . . . . . . 249 249 249Debentures — 7.375% due 2097. . . . . . . . . . . 297 297 297Medium-term notes . . . . . . . . . . . . . . . . . . . . . . . . — — 25Capital lease obligations . . . . . . . . . . . . . . . . . . . 665 611 538Commercial paper . . . . . . . . . . . . . . . . . . . . . . . . . 40 45 —Deposit obligations . . . . . . . . . . . . . . . . . . . . . . . . 245 236 178Other. . . . . . . . . . . . . . . . . . . . . . . . . . . . . . . . . . . . . . 193 187 124______ ______ ______
Total Machinery and Engines . . . . . . . . . . . . . . . . . 3,663 3,603 3,581
December 31,(Millions of dollars) 2004 2003 2002_____ _____ _____Financial Products:
Commercial paper . . . . . . . . . . . . . . . . . . . . . . . . . $ 1,400 $ 1,825 $ 1,825Medium-term notes . . . . . . . . . . . . . . . . . . . . . . . . 10,468 8,775 6,298Deposit obligations . . . . . . . . . . . . . . . . . . . . . . . . 232 232 —Other. . . . . . . . . . . . . . . . . . . . . . . . . . . . . . . . . . . . . . 74 111 70______ ______ ______
Total Financial Products . . . . . . . . . . . . . . . . . . . . . 12,174 10,943 8,193______ ______ ______Total long-term debt due after one year . . . . . . . $15,837 $ 14,546 $11,774______ ______ ____________ ______ ______
All outstanding notes and debentures are unsecured. The cap-ital lease obligations are collateralized by leased manufacturingequipment and/or security deposits. The deposit obligations havecorresponding security deposits, which are included in “Otherassets” in Statement 3. These deposit obligations and correspond-ing security deposits relate to two finance arrangements whichprovide us a return. These finance arrangements require that wecommit to certain long-term obligations and provide securitydeposits which will fulfill these obligations when they become due.
The 6% debentures due in 2007 were sold at significant orig-inal issue discounts ($144 million). This issue was carried netof the unamortized portion of its discount, which was amortizedas interest expense over the life of the issue. These debentureshad a principal at maturity of $250 million and an effective annualrate of 13.3%. The debentures were redeemed in August 2003.
We may redeem the 6.55% notes and the 7.25%, 6.625%, 7.3%,6.95% and 7.375% debentures in whole or in part at our optionat any time at a redemption price equal to the greater of 100%of the principal amount of the debentures to be redeemed or thesum of the present value of the remaining scheduled payments.
The terms of other notes and debentures do not specify aredemption option prior to maturity.
Based on long-term credit agreements, $1,440 million,$1,870 million and $1,825 million of commercial paper out-standing at December 31, 2004, 2003 and 2002, respectively,was classified as long-term debt due after one year.
Medium-term notes are offered by prospectus and are issuedthrough agents at fixed and floating rates. Financial Productsmedium-term notes have a weighted average interest rate of 3.3%with remaining maturities up to 20 years at December 31, 2004.
The aggregate amounts of maturities of long-term debt duringeach of the years 2005 through 2009, including amounts duewithin one year and classified as current, are:
December 31,(Millions of dollars) 2005 2006 2007 2008 2009_____ _____ _____ _____ _____Machinery and Engines . . . . . . . . $ 6 $ 290 $ 297 $ 26 $ 363Financial Products. . . . . . . . . . . . . 3,525 4,137 2,567 1,134 3,103_____ _____ _____ _____ _____
$ 3,531 $ 4,427 $ 2,864 $ 1,160 $ 3,466_____ _____ _____ _____ __________ _____ _____ _____ _____Interest paid on short-term and long-term borrowings for 2004,
2003 and 2002 was $766 million, $718 million and $815 mil-lion, respectively.
Financial Products was in compliance with all debt covenantsat December 31, 2004 except Cat Financial’s debt-to-equity ratio,as defined under the global credit facilities, which was 8.23 to 1 atDecember 31, 2004. By covenant, this is not to exceed 8.00 to 1 atyear-end (8.5 to 1 moving six-month average at other than year-end). At December 31, 2004, there were no borrowings under thesefacilities. The higher year-end ratio was primarily the result ofunexpected record levels of financing activity in the fourth quarter.Cat Financial received a waiver from its banks for said failure.

Caterpillar Inc.
A-25
Please refer to Note 20 on pages A-25 to A-26 and Table IIIon page A-27 for fair value information on long-term debt.
17. Credit commitments
December 31, 2004
Machinery Financial(Millions of dollars) Consolidated and Engines Products_________ _________ _______Credit lines available:
Global credit facilities. . . . . . . . . . . . $5,000 (1) $ 600 (1) $4,400 (1)
Other external . . . . . . . . . . . . . . . . . . . . 1,849 758 1,091_____ _____ _____Total credit lines available . . . . . . . . . 6,849 1,358 5,491Less: Global credit facilities
supporting commercial paper . . . 4,412 40 4,372Less: Utilized credit . . . . . . . . . . . . . . . . 463 93 370_____ _____ _____Available credit . . . . . . . . . . . . . . . . . . . . . $1,974 $1,225 $ 749_____ _____ __________ _____ _____(1) We have two global credit facilities with a syndicate of banks totaling $5,000 million available
in the aggregate to both Machinery and Engines and Financial Products to support commercialpaper programs. Based on management’s allocation decision, which can be revised at any timeduring the year, the portion of the facility available to Cat Financial at December 31, 2004 was$4,400 million. The five-year facility of $2,500 million expires in September 2009. The 364-dayfacility of $2,500 million expires in September 2005. The facility expiring in September 2005 hasa provision that allows Caterpillar or Cat Financial to obtain a one-year loan in September 2005that would mature in September 2006.
18. Capital stock
A. Stock optionsIn 1996, stockholders approved the Stock Option and Long-TermIncentive Plan (the Plan) providing for the granting of options topurchase common stock to officers and other key employees, aswell as non-employee directors. The Plan reserves 72 million sharesof common stock for issuance (64 million under the Plan and 8 mil-lion under prior stock option plans). Options granted prior to 2004vest at the rate of one-third per year over the three year periodfollowing the date of grant. In anticipation of delaying vestinguntil three years after the grant date for future grants, the 2004grant vested on December 31, 2004. All grants continue to havea maximum term of 10 years. Common shares issued under stockoptions, including treasury shares reissued, totaled 6,103,710 for2004, 4,925,496 for 2003 and 882,580 for 2002. We recognizedincome tax benefits related to employees’ exercise of stock optionsof $80 million, $45 million, and $13 million in 2004, 2003 and2002, respectively.
The Plan grants options which have exercise prices equal to theaverage market price on the date of grant. A summary of the proforma net income and profit per share amounts is shown in Item Mof Note 1 on pages A-11 to A-12. The fair value of options grantedin 2004 was estimated at the date of grant using the binomialoption-pricing model. We believe this model more accuratelyreflects the value of the options than using the Black-Scholesoption-pricing model. Previous years’ grants continue to be val-ued using the Black-Scholes model.
Please refer to Table II on page A-26 for additional financialinformation on our stock options.
B. Restricted stockThe Plan permits the award of restricted stock to officers and otherkey employees. During 2004, 2003 and 2002, officers and otherkey employees were awarded 44,350 shares, 42,210 shares and52,475 shares, respectively, of restricted stock. Restricted shares(in phantom form) awarded to officers and other key employeestotaled 7,400, 4,425 and 8,450 in 2004, 2003 and 2002, respectively.
C. Stockholders’ rights planWe are authorized to issue 5,000,000 shares of preferred stock,of which 2,000,000 shares have been designated as Series AJunior Participating Preferred Stock of $1 par value. None of thepreferred shares have been issued.
Stockholders would receive certain preferred stock purchaserights if someone acquired or announced a tender offer to acquire15% or more of outstanding Caterpillar stock. In essence, thoserights would permit each holder (other than the acquiring per-son) to purchase one share of Caterpillar stock at a 50% discountfor every share owned. The rights, designed to protect the inter-ests of Caterpillar stockholders during a takeover attempt, expireDecember 11, 2006.
19. Profit per share
Computations of profit per share:(Dollars in millions except per share data) 2004 2003 2002_____ _____ _____Profit for the period (A) . . . . . . . . . . . . . . . . . . . . . . . . . . . . . $2,035 $ 1,099 $ 798Determination of shares (millions):
Weighted average number of common sharesoutstanding (B). . . . . . . . . . . . . . . . . . . . . . . . . . . . . . . . . . 342.3 345.2 344.0
Shares issuable on exercise of stock options,net of shares assumed to be purchased outof proceeds at average market price . . . . . . . . . . . 11.4 6.2 2.9
Average common shares outstanding for fullydiluted computation (C) . . . . . . . . . . . . . . . . . . . . . . . . 353.7 351.4 346.9
Profit per share of common stock:Assuming no dilution (A/B) . . . . . . . . . . . . . . . . . . . . . . $ 5.95 $ 3.18 $ 2.32Assuming full dilution (A/C) . . . . . . . . . . . . . . . . . . . . . $ 5.75 $ 3.13 $ 2.30
Shares outstanding as of December 31(in millions) . . . . . . . . . . . . . . . . . . . . . . . . . . . . . . . . . . . . . . . 342.9 343.8 344.3
Stock options to purchase 52,000, 4,267,544 and 27,881,279shares of common stock at a weighted-average price of $81.27,$62.34 and $54.34 were outstanding during 2004, 2003 and2002, respectively, but were not included in the computation ofdiluted profit per share because the options’ exercise price wasgreater than the average market price of the common shares.
20. Fair values of financial instruments
We used the following methods and assumptions to estimate thefair value of our financial instruments:
Cash and short-term investments — carrying amount approxi-mated fair value.
Long-term investments (other than investments in uncon-solidated affiliated companies) — fair value for available forsale securities was estimated based on quoted market prices. Fairvalue for security deposits approximated carrying value.
Foreign currency forward and option contracts — fair valueof forward contracts was determined by discounting the futurecash flow resulting from the differential between the contractprice and the forward rate. Fair value of option contracts was deter-mined by using the Black-Scholes model.
Finance receivables — fair value was estimated by discount-ing the future cash flow using current rates, representative ofreceivables with similar remaining maturities. Historical bad-debt experience also was considered.
Wholesale inventory receivables — fair value was estimatedby discounting the future cash flow using current rates, repre-sentative of receivables with similar remaining maturities.

NOTES continued
A-26
Short-term borrowings — carrying amount approximatedfair value.
Long-term debt — for Machinery and Engines notes anddebentures, fair value was estimated based on quoted marketprices. For Financial Products, fair value was estimated by dis-counting the future cash flow using our current borrowing ratesfor similar types and maturities of debt, except for floating ratenotes and commercial paper supported by long-term credit agree-ments for which the carrying amounts were considered a reason-able estimate of fair value. For deposit obligations carrying valueapproximated fair value.
Interest rate swaps — fair value was estimated based on theamount that we would receive or pay to terminate our agree-ments as of year-end.
Guarantees — fair value is estimated based on the premiumwe would require to issue the same guarantee in a stand alonearm’s-length transaction with an unrelated party.
Please refer to Table III on page A-27 for the fair values ofour financial instruments.
21. Concentration of credit risk
Financial instruments with potential credit risk consist primar-ily of trade and finance receivables and short-term and long-terminvestments. Additionally, to a lesser extent, we have a potentialcredit risk associated with counterparties to derivative contracts.
Trade receivables are primarily short-term receivables from inde-pendently owned and operated dealers which arise in the normalcourse of business. We perform regular credit evaluations of ourdealers. Collateral generally is not required, and the majority ofour trade receivables are unsecured. We do, however, when deemednecessary, make use of various devices such as security agree-ments and letters of credit to protect our interests. No single dealeror customer represents a significant concentration of credit risk.
Finance receivables and wholesale inventory receivables pri-marily represent receivables under installment sales contracts,receivables arising from leasing transactions and notes receiv-able. We generally maintain a secured interest in the equipmentfinanced. No single customer or region represents a significantconcentration of credit risk.
TABLE II — Financial Information Related to Capital Stock_______________________________________________________________________________________________________________
Changes in the status of common shares subject to issuance under options:2004 2003 2002___________________ ___________________ ___________________
Weighted- Weighted- Weighted-Average Average AverageExercise Exercise Exercise
Shares Price Shares Price Shares Price_________ _______ _________ _______ _________ _______Fixed Options:
Outstanding at beginning of year . . . . . . . . . . . . . . . . . . . . . . . . . . . . . . . . . . . . . . . . . . . . 39,499,672 $ 51.38 38,721,364 $ 48.91 32,295,230 $ 47.34Granted to officers and key employees . . . . . . . . . . . . . . . . . . . . . . . . . . . . . . . . . . . . . . 8,890,733 $ 77.26 8,418,100 $ 54.29 8,050,864 $ 50.72Granted to outside directors. . . . . . . . . . . . . . . . . . . . . . . . . . . . . . . . . . . . . . . . . . . . . . . . . . 52,000 $ 81.27 56,000 $ 52.06 52,000 $ 58.87Exercised . . . . . . . . . . . . . . . . . . . . . . . . . . . . . . . . . . . . . . . . . . . . . . . . . . . . . . . . . . . . . . . . . . . . . . (6,825,920) $ 47.72 (7,629,020) $ 42.04 (1,580,754) $ 26.41Lapsed. . . . . . . . . . . . . . . . . . . . . . . . . . . . . . . . . . . . . . . . . . . . . . . . . . . . . . . . . . . . . . . . . . . . . . . . . (392,311) $ 51.19 (66,772) $ 50.18 (95,976) $ 50.28__________ ________ ________Outstanding at end of year. . . . . . . . . . . . . . . . . . . . . . . . . . . . . . . . . . . . . . . . . . . . . . . . . . . . 41,224,174 $ 57.61 39,499,672 $ 51.38 38,721,364 $ 48.91__________ ________ __________________ ________ ________Options exercisable at year-end. . . . . . . . . . . . . . . . . . . . . . . . . . . . . . . . . . . . . . . . . . . . . . 33,620,616 $ 58.57 23,650,987 $ 50.28 23,909,130 $ 48.23Weighted-average fair value of options granted during the year . . . . . . . . . . . $ 18.06 $ 12.82 $ 14.85
Stock options outstanding and exercisable:Options Outstanding Options Exercisable__________________________________________________ ________________________________Weighted-Average
Remaining# Outstanding Contractual Life Weighted-Average # Outstanding Weighted-Average
Exercise Prices at 12/31/04 (Years) Exercise Price at 12/31/04 Exercise Price_____________ _____________ _____________ _____________ _____________ _____________$27.91-$39.19 3,948,490 4.4 $36.88 3,948,490 $36.88$43.75-$62.34 28,332,951 6.5 $54.29 20,781,393 $54.69$77.26-$81.27 8,942,733 9.4 $77.28 8,890,733 $77.26_____________ _____________
41,224,174 $57.61 33,620,616 $58.57_____________ __________________________ _____________Weighted-average assumptions used in determining fair value of option grants: Grant Year________________________________________
2004(1) 2003(2) 2002(2)__________ __________ __________Dividend yield . . . . . . . . . . . . . . . . . . . . . . . . . . . . . . . . . . . . . . . . . . . . . . . . . . . . . . . . . . . . . . . . . . . . . . . . . . . . . . . . . . . . . . . . . . . . . . . . . . . . . 1.88-1.91% 2.75% 2.55%Expected volatility . . . . . . . . . . . . . . . . . . . . . . . . . . . . . . . . . . . . . . . . . . . . . . . . . . . . . . . . . . . . . . . . . . . . . . . . . . . . . . . . . . . . . . . . . . . . . . . . . 25.8-28.1% 29.6% 35.0%Risk-free interest rates . . . . . . . . . . . . . . . . . . . . . . . . . . . . . . . . . . . . . . . . . . . . . . . . . . . . . . . . . . . . . . . . . . . . . . . . . . . . . . . . . . . . . . . . . . . . 1.90-5.76% 2.52% 4.13%Expected lives . . . . . . . . . . . . . . . . . . . . . . . . . . . . . . . . . . . . . . . . . . . . . . . . . . . . . . . . . . . . . . . . . . . . . . . . . . . . . . . . . . . . . . . . . . . . . . . . . . . . . 6 years 6 years 5 years(1) Assumptions used in the binomial option-pricing model valuation.(2) Assumptions used in Black-Scholes valuation.

Caterpillar Inc.
A-27
TABLE III — Fair Values of Financial Instruments_______________________________________________________________________________________________________________
2004 2003 2002_________________ _________________ _________________Carrying Fair Carrying Fair Carrying Fair
(Millions of dollars) Amount Value Amount Value Amount Value Reference________ ________ ________ ________ ________ ________ _______Asset (Liability) at December 31
Cash and short-term investments . . . . . . . . . . . . . . . . . $ 445) $ 445) $ 342) $ 342) $ 309) $ 309) Statement 3Long-term investments . . . . . . . . . . . . . . . . . . . . . . . . . . . . 1,852) 1,852) 1,574) 1,574) 1,089) 1,089) Notes 13 and 21Foreign currency contracts . . . . . . . . . . . . . . . . . . . . . . . . 176) 176) 167) 167) 47) 47) Note 3Finance receivables — net
(excluding finance type leases(1)). . . . . . . . . . . . . . . . 13,457) 13,445) 11,439) 11,489) 10,098) 10,168) Note 8Wholesale inventory receivables — net
(excluding finance type leases(1)). . . . . . . . . . . . . . . . 882) 857) 681) 666) 637) 641) Note 7Short-term borrowings. . . . . . . . . . . . . . . . . . . . . . . . . . . . . (4,157) (4,157) (2,757) (2,757) (2,175) (2,175) Note 15Long-term debt
(including amounts due within one year)Machinery and Engines. . . . . . . . . . . . . . . . . . . . . . . . (3,669) (4,186) (3,635) (4,109) (3,839) (4,363) Note 16Financial Products . . . . . . . . . . . . . . . . . . . . . . . . . . . . . (15,699) (15,843) (13,892) (14,078) (11,847) (12,118) Note 16
Interest rate swapsFinancial Products —
in a net receivable position. . . . . . . . . . . . . . . . . . . . 75) 75) 87) 87) 84) 84) Note 3in a net payable position . . . . . . . . . . . . . . . . . . . . . . (69) (69) (59) (59) (85) (85) Note 3
Guarantees(2) . . . . . . . . . . . . . . . . . . . . . . . . . . . . . . . . . . . . . . . . (10) (10) (5) (9) —) (6) Note 23(1) Total excluded items have a net carrying value at December 31, 2004, 2003 and 2002 of $1,737 million, $1,546 million and $1,369 million, respectively.(2) The carrying amount provisions of FASB Interpretation No. 45 related to guarantees are effective for guarantees issued or modified subsequent to December 31, 2002 only, whereas the fair value amount
is for all guarantees.
Short-term and long-term investments are held with high qualityinstitutions and, by policy, the amount of credit exposure to any oneinstitution is limited. Long-term investments, included in “Otherassets” in Statement 3, are comprised primarily of investmentswhich collateralize capital lease obligations and deposit obliga-tions (see Note 16 on page A-24) and investments of Cat Insur-ance supporting insurance reserve requirements.
For derivatives contracts, collateral is not required of the coun-terparties or of our company. We do not anticipate nonperfor-mance by any of the counterparties. Our exposure to credit lossin the event of nonperformance by the counterparties is limitedto only those gains that we have recorded, but have not yetreceived cash payment. At December 31, 2004, 2003 and 2002,the exposure to credit loss was $312 million, $336 million and$176 million, respectively.
Please refer to Note 20 on pages A-25 to A-26 and Table IIIbelow for fair value information.
22. Operating leases
We lease certain computer and communications equipment, trans-portation equipment and other property through operating leases.Total rental expense for operating leases was $271 million, $242 mil-lion and $240 million for 2004, 2003 and 2002, respectively.
Minimum payments for operating leases having initial orremaining non-cancelable terms in excess of one year are:
Years ended December 31,(Millions of dollars)
After2005 2006 2007 2008 2009 2009 Total_____________________________________________________$163 $132 $90 $69 $59 $384 $897
23. Guarantees and product warranty
We have guaranteed to repurchase loans of certain Caterpillardealers from third party lenders in the event of default. Theseguarantees arose in conjunction with Cat Financial’s relation-ship with third party dealers who sell Caterpillar equipment.These guarantees have terms ranging from one to four years andare secured primarily by dealer assets.
In 2004, Cat Financial provided a limited indemnity to a thirdparty bank for $45 million resulting from the assignment of cer-tain leases to that bank. The indemnity is for the remote chancethat the insurers of these leases would become insolvent. Theindemnity/guarantee is for eight years and is unsecured.
No loss has been experienced or is anticipated under any ofthese guarantees. At December 31, 2004, 2003 and 2002, therelated book value was $10 million, $5 million and $0, respec-tively. The maximum potential amount of future payments(undiscounted and without reduction for any amounts that maypossibly be recovered under recourse or collateralized provi-sions) we could be required to make under the guarantees atDecember 31 are as follows:(Millions of dollars) 2004 2003 2002______ _____ _____Guarantees with Caterpillar dealers. . . . . . . . . . . . . . $ 364 $ 380 $ 290Guarantees — other . . . . . . . . . . . . . . . . . . . . . . . . . . . 62 37 34______ _____ _____Total guarantees . . . . . . . . . . . . . . . . . . . . . . . . . . . . . . . $ 426 $ 417 $ 324______ _____ ___________ _____ _____
Our product warranty liability is determined by applying his-torical claim rate experience to the current field population anddealer inventory. Historical claim rates are developed using a rollingaverage of actual warranty payments. Effective in the third quar-ter of 2004, we refined our process to utilize more detailed claimrates by product. This provides more comprehensive product

NOTES continued
A-28
warranty information for management. This change did not havea material impact on our financial statements.
(Millions of dollars) 2004 2003 2002______ _____ _____Warranty liability, January 1 . . . . . . . . . . . . . . . . . . . . $ 622 $ 693 $ 652Payments. . . . . . . . . . . . . . . . . . . . . . . . . . . . . . . . . . . . . . (535) (484) (494)Provision for warranty . . . . . . . . . . . . . . . . . . . . . . . . . . 695 413 535______ _____ _____Warranty liability, December 31 . . . . . . . . . . . . . . . . . $ 782 $ 622 $ 693______ _____ ___________ _____ _____
24. Environmental and legal matters
The company is regulated by federal, state and international envi-ronmental laws governing our use of substances and control ofemissions in all our operations. Compliance with these existinglaws has not had a material impact on our capital expendituresor earnings.
We are cleaning up hazardous waste at a number of locations,often with other companies, pursuant to federal and state laws.When it is likely we will pay clean-up costs at a site and thosecosts can be estimated, the costs are charged against our earnings.In formulating that estimate, we do not consider amounts expectedto be recovered from insurance companies and others.
The amount recorded for environmental clean-up is not mate-rial and is included in “Accrued expenses” in Statement 3. If arange of liability estimates is available on a particular site, weaccrue at the lower end of that range.
We cannot estimate costs on sites in the very early stages ofclean-up. Currently, we have several sites in the very early stagesof clean-up, and there is no more than a remote chance that amaterial amount for clean-up will be required.
Pursuant to a consent decree Caterpillar entered with the EPA,the company was required to meet certain emission standards byOctober 2002. The decree provides that if engine manufactur-ers were unable to meet the standards at that time, they would berequired to pay a Non-Conformance Penalty (NCP) on each enginesold that did not meet the standard. The amount of the NCP wouldbe based on how close to meeting the standard the engine came— the more out of compliance the higher the penalty. The com-pany began introduction of fully compliant ACERT engines in2003 and by the end of 2003 Caterpillar was only producing fullycompliant engine models. As a result, NCPs were not payablefor any engines built in 2004. NCPs of $153 million were paidin 2003.
In addition, the consent decree required Caterpillar to pay a fineof $25 million, which was expensed in 1998, and to make invest-ments totaling $35 million in environmental-related products byJuly 7, 2007. Total qualifying investments to date for these projectsare $34.9 million, of which $5.9 million was made during 2004.Caterpillar expects to reach the $35 million requirement duringthe first quarter of 2005. A future benefit is expected to be realizedfrom these environmental projects related to Caterpillar’s abilityto capitalize on the technologies it developed in complying withits environmental project obligations. In short, Caterpillar expectsto receive a positive net return on the environmental projects bybeing able to market the technology it developed.
We are a party to litigation matters and claims that are normalin the course of our operations, and, while the results of such lit-igation and claims cannot be predicted with certainty, manage-ment believes, based on the advice of counsel, the final outcome
of such matters will not have a materially adverse effect on ourfinancial statements.
On January 16, 2002, Caterpillar commenced an action in theCircuit Court of the Tenth Judicial Circuit of Illinois in Peoria,Illinois, against Navistar International Transportation Corporationand International Truck and Engine Corporation (collectivelyNavistar). The lawsuit arises out of a long-term purchase contractbetween Caterpillar and Navistar effective May 31, 1988, asamended from time to time (the Purchase Agreement). The pend-ing complaint alleges that Navistar breached its contractual obli-gations by: (i) paying Caterpillar $8.08 less per fuel injector thanthe agreed upon price for new unit injectors delivered by Caterpillar;(ii) refusing to pay contractually agreed upon surcharges owedas a result of Navistar ordering less than planned volumes ofreplacement unit injectors; and (iii) refusing to pay contractuallyagreed upon interest stemming from Navistar’s late payments. Asof December 31, 2004, the net past due receivable from Navistarregarding the foregoing and included in “Long-term receivables— trade and other” in Statement 3 totaled $139 million. The pend-ing complaint also has claims alleging that Franklin Power Products,Inc., Newstream Enterprises, and Navistar, collectively and indi-vidually, failed to pay the applicable price for shipments of unitinjectors to Franklin and Newstream. As of December 31, 2004,the net past due receivables for the foregoing, included in “Long-term receivables — trade and other” in Statement 3 totaled $13 mil-lion. The pending complaint further alleges that Sturman Industries,Inc., and Sturman Engine Systems, Inc., colluded with Navistarto utilize technology that Sturman Industries, Inc., misappropri-ated from Caterpillar to help Navistar develop its G2 fuel system,and tortiously interfered with the Purchase Agreement andCaterpillar’s prospective economic relationship with Navistar.The pending complaint further alleges that the two parties’ col-lusion led Navistar to select Sturman Engine Systems, Inc. andanother company, instead of Caterpillar, to develop and manu-facture the G2 fuel system.
On May 7, 2002, International Truck and Engine Corporation(International) commenced an action against Caterpillar in theCircuit Court of DuPage County, Illinois that alleges Caterpillarbreached various aspects of a long-term agreement term sheet.In its fifth amended complaint, International seeks a declara-tion from the court that the term sheet constitutes a legally bind-ing contract for the sale of heavy-duty engines at specified pricesthrough the end of 2006, alleges that Caterpillar breached theterm sheet by raising certain prices effective October 1, 2002, andalso alleges that Caterpillar breached an obligation to negotiatea comprehensive long-term agreement referenced in the term sheet.International has also asserted a claim for “unjust enrichment”related to certain revenues received by Caterpillar from anothercustomer. International seeks damages “in an amount to be deter-mined at trial” and injunctive relief. Caterpillar denies Interna-tional’s claims and has filed a counterclaim seeking a declarationthat the term sheet has been effectively terminated. Caterpillaralso asserts that International has released Caterpillar from cer-tain of its claims. On September 24, 2003, the Appellate Courtof Illinois, ruling on an interlocutory appeal, issued an order con-sistent with Caterpillar’s position that, even if the court subse-quently determines that the term sheet is a binding contract, it isindefinite in duration and was therefore terminable at will by

Caterpillar Inc.
A-29
Caterpillar after a reasonable period. Caterpillar anticipates thata trial currently scheduled to begin in June 2005 will address allremaining issues in this matter. This matter is not related to thebreach of contract action brought by Caterpillar against Navistarcurrently pending in the Circuit Court of Peoria County, Illinois.
In 2004, the European Union (EU) imposed retaliatory tariffson certain U.S. origin goods as a result of a WTO decision thatfound the extraterritorial income exclusion (ETI) provisions ofthe FSC Repeal and Extraterritorial Income Exclusion Act of2000 constituted a prohibited export subsidy. These tariffs, whichbegan in March of 2004 at 5 percent, increased 1 percentagepoint per month. Given the makeup of the final retaliation list,some Caterpillar parts and components were subject to these tar-iffs. However, these tariffs have not materially impacted ourfinancial results. In addition to the United States, the companyhas production facilities in the EU, Russia, Asia, and SouthAmerica. Products sold into the EU from these plants were notaffected by this retaliatory tariff. The American Jobs CreationAct of 2004 (Act), enacted on October 22, 2004, phases-out theETI provisions. As a result, the EU has lifted the sanctions effec-tive January 1, 2005 pending the outcome of a WTO review todetermine whether certain provisions of the Act are compliantwith the ruling against the FSC/ETI regime.
In a letter dated November 15, 2004, the United States Envi-ronmental Protection Agency (EPA), proposed a civil penaltyof $641,392 to Caterpillar for the alleged failure to comply withcertain requirements of the federal Clean Air Act. The EPAalleges that Caterpillar constructed a facility in Emporia, Kansasand failed to comply with Section 112(g)(2)(B) of the Clean AirAct. Caterpillar sold the Emporia facility in December 2002. Weare seeking a settlement of this matter with all concerned partiesand the company believes the outcome will not have a materialimpact on our financial statements.
25. Segment information
A. Basis for segment information
The company is organized based on a decentralized structurethat has established accountabilities to continually improve busi-ness focus and increase our ability to react quickly to changes inboth the global business cycle and competitors’ actions. Our cur-rent structure uses a product, geographic matrix organizationcomprised of multiple profit and service center divisions.
Caterpillar is a highly integrated company. The majority of ourprofit centers are product focused. They are primarily responsiblefor the design, manufacture and ongoing support of their products.However, some of these product-focused profit centers also havemarketing responsibilities. We also have geographically-basedprofit centers that are focused primarily on marketing. However,most of these profit centers also have some manufacturing respon-sibilities. One of our profit centers provides various financialservices to our customers and dealers. The service center divisionsperform corporate functions and provide centralized services.
We have developed an internal measurement system to eval-uate performance and to drive continuous improvement. Thismeasurement system, which is not based on generally acceptedaccounting principles (GAAP), is intended to motivate desiredbehavior of employees and drive performance. It is not intendedto measure a division’s contribution to enterprise results. The
sales and cost information used for internal purposes varies sig-nificantly from our consolidated, externally reported informa-tion resulting in substantial reconciling items. Each division hasspecific performance targets and is evaluated and compensatedbased on achieving those targets. Performance targets differ fromdivision to division; therefore, meaningful comparisons cannotbe made among the profit or service center divisions. It is the com-parison of actual results to budgeted results that makes our inter-nal reporting valuable to management. Consequently, we feelthat the financial information required by Statement of FinancialAccounting Standards No. 131 (SFAS 131), “Disclosures aboutSegments of an Enterprise and Related Information” has limitedvalue for our external readers.
Due to Caterpillar’s high level of integration and our concernthat segment disclosures based on SFAS 131 requirements havelimited value to external readers, we are continuing to disclosefinancial results for our three principal lines of business (Machin-ery, Engines and Financial Products) in our Management’sDiscussion and Analysis beginning on page A-36.
B. Description of segments
The profit center divisions meet the SFAS 131 definition of“operating segments;” however, the service center divisions donot. Several of the profit centers have similar characteristics andhave been aggregated. The following is a brief description of ourseven reportable segments and the business activities included inthe All Other category.
Primarily responsible for market-ing products through dealers in Australia, Asia (excluding Japan)and the Pacific Rim. Also includes the regional manufacturingof some products which are also produced by Construction &Mining Products.
Primarily responsible forthe design, manufacture and ongoing support of small, mediumand large machinery used in a variety of construction and min-ing applications. Also includes the design, manufacture, procure-ment and marketing of components and control systems that areconsumed primarily in the manufacturing of our machinery.
Primarily responsible for marketing prod-ucts (excluding Power Products) through dealers in Europe,Africa, the Middle East and the Commonwealth of IndependentStates. Also includes the regional manufacturing of some productswhich are also produced by Construction & Mining Products andPower Products.
Provides financing to cus-tomers and dealers for the purchase and lease of Caterpillar andother equipment, as well as some financing for Caterpillar salesto dealers. Financing plans include operating and finance leases,installment sale contracts, working capital loans and wholesalefinancing plans.The division also provides various forms ofinsurance to customers and dealers to help support the purchaseand lease of our equipment.
Primarily responsible for mar-keting products through dealers in Latin America. Also includesthe regional manufacturing of some products that are also pro-duced by Construction & Mining Products.
Latin America Marketing:
Financing & Insurance Services:
EAME Marketing:
Construction & Mining Products:
Asia/Pacific Marketing:
Primarily responsible for the design, man-ufacture, marketing and ongoing support of reciprocating andturbine engines along with related systems. These engines andrelated systems are used in products manufactured in other seg-ments, on-highway trucks and locomotives; and in a variety ofconstruction, electric power generation, marine, petroleum andindustrial applications.
Primarily responsible for mar-keting products (excluding Power Products) through dealers inthe United States and Canada.
Primarily includes activities such as: service supportand parts distribution to Caterpillar dealers worldwide; logisticsservices for other companies; service tools for Caterpillar dealers;and the remanufacture of Caterpillar engines and componentsand remanufacturing services for other companies.
C. Segment measurement and reconciliationsPlease refer to Table IV on pages A-31 to A-33 for financial infor-mation regarding our segments. There are several accountingdifferences between our segment reporting and our external report-ing. Our segments are measured on an accountable basis; there-fore, only those items for which divisional management is directlyresponsible are included in the determination of segment profit/(loss) and assets. We made several changes to our segment report-ing methodologies in the first quarter of 2004. Most notable area change in the current cost methodology used to value inventoryand cost of sales for segment reporting purposes, as well as achange in the manner that interest expense is charged to seg-ments. Amounts for 2003 and 2002 presented in Table IV of thisNote 25 have been restated to conform to the new methodology.
The following is a list of the more significant accounting dif-ferences:
● Generally, liabilities are managed at the corporate leveland are not included in segment operations. Segmentaccountable assets generally include inventories, receiv-ables, property, plant and equipment.
● We account for intersegment transfers using a system ofmarket-based prices. With minor exceptions, each of theprofit centers either sells or purchases virtually all of itsproducts to or from other profit centers within the com-pany. Our high level of integration results in our inter-nally reported sales being approximately double that ofour consolidated, externally reported sales.
● Segment inventories and cost of sales are valued using acurrent cost methodology.
● Postretirement benefit expenses are split; segments aregenerally responsible for service and prior services costs,with the remaining elements of net periodic benefit costincluded as a methodology difference.
● Interest expense is imputed (i.e., charged) to profit cen-ters based on their level of accountable assets.
● Accountable profit is determined on a pretax basis.
Reconciling items are created based on accounting differencesbetween segment reporting and our consolidated, external report-ing. Please refer to Table IV on pages A-31 to A-33 for financialinformation regarding significant reconciling items. Most of ourreconciling items are self-explanatory given the above explana-tions of accounting differences. However, for the reconciliationof profit, we have grouped the reconciling items as follows:
● Corporate costs: Certain corporate costs are not chargedto our segments. These costs are related to corporaterequirements and strategies that are considered to be forthe benefit of the entire organization.
● Timing: Timing differences in the recognition of costsbetween segment reporting and consolidated externalreporting.
● Methodology differences: See previous discussion ofsignificant accounting differences between segmentreporting and consolidated external reporting.
All Other:
North America Marketing:
Power Products:
NOTES continued
A-30
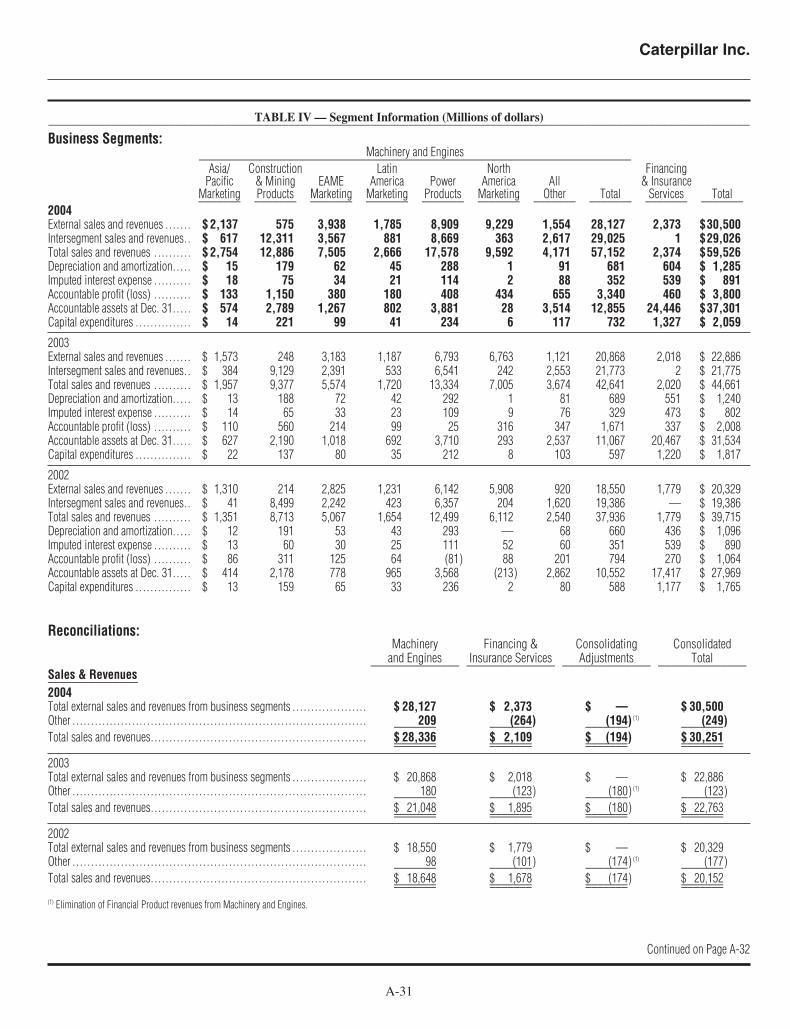
Caterpillar Inc.
A-31
TABLE IV — Segment Information (Millions of dollars)_______________________________________________________________________________________________________________
Business Segments:Machinery and Engines________________________________________________________________________
Asia/ Construction Latin North FinancingPacific & Mining EAME America Power America All & Insurance
Marketing Products Marketing Marketing Products Marketing Other Total Services Total_______ _______ _______ _______ _______ _______ _______ _______ _______ _______2004External sales and revenues . . . . . . . $ 2,137 575 3,938 1,785 8,909 9,229 1,554 28,127 2,373 $30,500Intersegment sales and revenues. . $ 617 12,311 3,567 881 8,669 363 2,617 29,025 1 $29,026Total sales and revenues . . . . . . . . . . $ 2,754 12,886 7,505 2,666 17,578 9,592 4,171 57,152 2,374 $59,526Depreciation and amortization. . . . . $ 15 179 62 45 288 1 91 681 604 $ 1,285Imputed interest expense . . . . . . . . . . $ 18 75 34 21 114 2 88 352 539 $ 891Accountable profit (loss) . . . . . . . . . . $ 133 1,150 380 180 408 434 655 3,340 460 $ 3,800Accountable assets at Dec. 31. . . . . $ 574 2,789 1,267 802 3,881 28 3,514 12,855 24,446 $37,301Capital expenditures . . . . . . . . . . . . . . . $ 14 221 99 41 234 6 117 732 1,327 $ 2,059
2003External sales and revenues . . . . . . . $ 1,573 248 3,183 1,187 6,793 6,763 1,121 20,868 2,018 $ 22,886Intersegment sales and revenues. . $ 384 9,129 2,391 533 6,541 242 2,553 21,773 2 $ 21,775Total sales and revenues . . . . . . . . . . $ 1,957 9,377 5,574 1,720 13,334 7,005 3,674 42,641 2,020 $ 44,661Depreciation and amortization. . . . . $ 13 188 72 42 292 1 81 689 551 $ 1,240Imputed interest expense . . . . . . . . . . $ 14 65 33 23 109 9 76 329 473 $ 802Accountable profit (loss) . . . . . . . . . . $ 110 560 214 99 25 316 347 1,671 337 $ 2,008Accountable assets at Dec. 31. . . . . $ 627 2,190 1,018 692 3,710 293 2,537 11,067 20,467 $ 31,534Capital expenditures . . . . . . . . . . . . . . . $ 22 137 80 35 212 8 103 597 1,220 $ 1,817
2002External sales and revenues . . . . . . . $ 1,310 214 2,825 1,231 6,142 5,908 920 18,550 1,779 $ 20,329Intersegment sales and revenues. . $ 41 8,499 2,242 423 6,357 204 1,620 19,386 — $ 19,386Total sales and revenues . . . . . . . . . . $ 1,351 8,713 5,067 1,654 12,499 6,112 2,540 37,936 1,779 $ 39,715Depreciation and amortization. . . . . $ 12 191 53 43 293 — 68 660 436 $ 1,096Imputed interest expense . . . . . . . . . . $ 13 60 30 25 111 52 60 351 539 $ 890Accountable profit (loss) . . . . . . . . . . $ 86 311 125 64 (81) 88 201 794 270 $ 1,064Accountable assets at Dec. 31. . . . . $ 414 2,178 778 965 3,568 (213) 2,862 10,552 17,417 $ 27,969Capital expenditures . . . . . . . . . . . . . . . $ 13 159 65 33 236 2 80 588 1,177 $ 1,765
Reconciliations:Machinery Financing & Consolidating Consolidated
and Engines Insurance Services Adjustments Total______________ ______________ ______________ ______________Sales & Revenues_______________2004Total external sales and revenues from business segments . . . . . . . . . . . . . . . . . . . . $ 28,127 $ 2,373 $ — $ 30,500Other . . . . . . . . . . . . . . . . . . . . . . . . . . . . . . . . . . . . . . . . . . . . . . . . . . . . . . . . . . . . . . . . . . . . . . . . . . . . . . . 209 (264) (194) (1) (249)_______ _______ _______ _______Total sales and revenues. . . . . . . . . . . . . . . . . . . . . . . . . . . . . . . . . . . . . . . . . . . . . . . . . . . . . . . . . . $ 28,336 $ 2,109 $ (194) $ 30,251_______ _______ _______ ______________ _______ _______ _______
2003Total external sales and revenues from business segments . . . . . . . . . . . . . . . . . . . . $ 20,868 $ 2,018 $ — $ 22,886Other . . . . . . . . . . . . . . . . . . . . . . . . . . . . . . . . . . . . . . . . . . . . . . . . . . . . . . . . . . . . . . . . . . . . . . . . . . . . . . . 180 (123) (180) (1) (123)_______ _______ _______ _______Total sales and revenues. . . . . . . . . . . . . . . . . . . . . . . . . . . . . . . . . . . . . . . . . . . . . . . . . . . . . . . . . . $ 21,048 $ 1,895 $ (180) $ 22,763_______ _______ _______ ______________ _______ _______ _______
2002Total external sales and revenues from business segments . . . . . . . . . . . . . . . . . . . . $ 18,550 $ 1,779 $ — $ 20,329Other . . . . . . . . . . . . . . . . . . . . . . . . . . . . . . . . . . . . . . . . . . . . . . . . . . . . . . . . . . . . . . . . . . . . . . . . . . . . . . . 98 (101) (174) (1) (177)_______ _______ _______ _______Total sales and revenues. . . . . . . . . . . . . . . . . . . . . . . . . . . . . . . . . . . . . . . . . . . . . . . . . . . . . . . . . . $ 18,648 $ 1,678 $ (174) $ 20,152_______ _______ _______ ______________ _______ _______ _______(1) Elimination of Financial Product revenues from Machinery and Engines.
Continued on Page A-32

NOTES continued
A-32
TABLE IV Continued — Segment Information (Millions of dollars)_______________________________________________________________________________________________________________
Reconciliations:Machinery Financing & Consolidated
and Engines Insurance Services Total______________ ______________ ______________Profit before taxes_______________2004Total accountable profit from business segments. . . . . . . . . . . . . . . . . . . . . . . . . . . . . . . $ 3,340 $ 460 $ 3,800Corporate costs . . . . . . . . . . . . . . . . . . . . . . . . . . . . . . . . . . . . . . . . . . . . . . . . . . . . . . . . . . . . . . . . . . . (601) — (601)Timing . . . . . . . . . . . . . . . . . . . . . . . . . . . . . . . . . . . . . . . . . . . . . . . . . . . . . . . . . . . . . . . . . . . . . . . . . . . . . (94) — (94)Methodology differences:
Inventory/cost of sales. . . . . . . . . . . . . . . . . . . . . . . . . . . . . . . . . . . . . . . . . . . . . . . . . . . . . . . . . . (62) — (62)Postretirement benefit expense. . . . . . . . . . . . . . . . . . . . . . . . . . . . . . . . . . . . . . . . . . . . . . . . . (270) — (270)Financing costs . . . . . . . . . . . . . . . . . . . . . . . . . . . . . . . . . . . . . . . . . . . . . . . . . . . . . . . . . . . . . . . . . 52 — 52Equity in profit of unconsolidated affiliated companies. . . . . . . . . . . . . . . . . . . . . . . (56) (3) (59)Currency. . . . . . . . . . . . . . . . . . . . . . . . . . . . . . . . . . . . . . . . . . . . . . . . . . . . . . . . . . . . . . . . . . . . . . . . . (37) — (37)Other methodology differences. . . . . . . . . . . . . . . . . . . . . . . . . . . . . . . . . . . . . . . . . . . . . . . . . (87) 48 (39)
Other . . . . . . . . . . . . . . . . . . . . . . . . . . . . . . . . . . . . . . . . . . . . . . . . . . . . . . . . . . . . . . . . . . . . . . . . . . . . . . . 17 — 17_______ _______ _______Total profit before taxes . . . . . . . . . . . . . . . . . . . . . . . . . . . . . . . . . . . . . . . . . . . . . . . . . . . . . . . . . . . $ 2,202 $ 505 $ 2,707_______ _______ ______________ _______ _______2003Total accountable profit from business segments. . . . . . . . . . . . . . . . . . . . . . . . . . . . . . . $ 1,671 $ 337 $ 2,008Corporate costs . . . . . . . . . . . . . . . . . . . . . . . . . . . . . . . . . . . . . . . . . . . . . . . . . . . . . . . . . . . . . . . . . . . (512) — (512)Timing . . . . . . . . . . . . . . . . . . . . . . . . . . . . . . . . . . . . . . . . . . . . . . . . . . . . . . . . . . . . . . . . . . . . . . . . . . . . . 54 — 54Methodology differences:
Inventory/cost of sales. . . . . . . . . . . . . . . . . . . . . . . . . . . . . . . . . . . . . . . . . . . . . . . . . . . . . . . . . . (30) — (30)Postretirement benefit expense. . . . . . . . . . . . . . . . . . . . . . . . . . . . . . . . . . . . . . . . . . . . . . . . . (162) — (162)Financing costs . . . . . . . . . . . . . . . . . . . . . . . . . . . . . . . . . . . . . . . . . . . . . . . . . . . . . . . . . . . . . . . . . 84 — 84Equity in profit of unconsolidated affiliated companies. . . . . . . . . . . . . . . . . . . . . . . (16) (4) (20)Currency. . . . . . . . . . . . . . . . . . . . . . . . . . . . . . . . . . . . . . . . . . . . . . . . . . . . . . . . . . . . . . . . . . . . . . . . . 3 — 3Other methodology differences. . . . . . . . . . . . . . . . . . . . . . . . . . . . . . . . . . . . . . . . . . . . . . . . . (32) 38 6
Other . . . . . . . . . . . . . . . . . . . . . . . . . . . . . . . . . . . . . . . . . . . . . . . . . . . . . . . . . . . . . . . . . . . . . . . . . . . . . . . 46 — 46_______ _______ _______Total profit before taxes . . . . . . . . . . . . . . . . . . . . . . . . . . . . . . . . . . . . . . . . . . . . . . . . . . . . . . . . . . . $ 1,106 $ 371 $ 1,477_______ _______ ______________ _______ _______2002Total accountable profit from business segments. . . . . . . . . . . . . . . . . . . . . . . . . . . . . . . $ 794 $ 270 $ 1,064Corporate costs . . . . . . . . . . . . . . . . . . . . . . . . . . . . . . . . . . . . . . . . . . . . . . . . . . . . . . . . . . . . . . . . . . . (236) — (236)Timing . . . . . . . . . . . . . . . . . . . . . . . . . . . . . . . . . . . . . . . . . . . . . . . . . . . . . . . . . . . . . . . . . . . . . . . . . . . . . (21) — (21)Methodology differences:
Inventory/cost of sales. . . . . . . . . . . . . . . . . . . . . . . . . . . . . . . . . . . . . . . . . . . . . . . . . . . . . . . . . . 33 — 33Postretirement benefit expense. . . . . . . . . . . . . . . . . . . . . . . . . . . . . . . . . . . . . . . . . . . . . . . . . 147 — 147Financing costs . . . . . . . . . . . . . . . . . . . . . . . . . . . . . . . . . . . . . . . . . . . . . . . . . . . . . . . . . . . . . . . . . (24) — (24)Equity in profit of unconsolidated affiliated companies. . . . . . . . . . . . . . . . . . . . . . . 12 (8) 4Currency. . . . . . . . . . . . . . . . . . . . . . . . . . . . . . . . . . . . . . . . . . . . . . . . . . . . . . . . . . . . . . . . . . . . . . . . . 14 — 14Other methodology differences. . . . . . . . . . . . . . . . . . . . . . . . . . . . . . . . . . . . . . . . . . . . . . . . . 61 25 86
Other . . . . . . . . . . . . . . . . . . . . . . . . . . . . . . . . . . . . . . . . . . . . . . . . . . . . . . . . . . . . . . . . . . . . . . . . . . . . . . . 47 — 47_______ _______ _______Total profit before taxes . . . . . . . . . . . . . . . . . . . . . . . . . . . . . . . . . . . . . . . . . . . . . . . . . . . . . . . . . . . $ 827 $ 287 $ 1,114_______ _______ ______________ _______ _______
Machinery Financing & Consolidating Consolidatedand Engines Insurance Services Adjustments Total______________ ______________ ______________ ______________
Assets______2004Total accountable assets from business segments. . . . . . . . . . . . . . . . . . . . . . . . . . . . . . $ 12,855 $ 24,446 $ — $ 37,301Items not included in segment assets:
Cash and short-term investments. . . . . . . . . . . . . . . . . . . . . . . . . . . . . . . . . . . . . . . . . . . . . . 270 175 — 445Intercompany trade receivables . . . . . . . . . . . . . . . . . . . . . . . . . . . . . . . . . . . . . . . . . . . . . . . . 443 18 (461) —Investments in unconsolidated affiliated companies. . . . . . . . . . . . . . . . . . . . . . . . . . 348 — (1) 347Investment in Financial Products . . . . . . . . . . . . . . . . . . . . . . . . . . . . . . . . . . . . . . . . . . . . . . 3,012 — (3,012) —Deferred income taxes and prepaids . . . . . . . . . . . . . . . . . . . . . . . . . . . . . . . . . . . . . . . . . . . 2,477 92 (317) 2,252Intangible assets and other assets . . . . . . . . . . . . . . . . . . . . . . . . . . . . . . . . . . . . . . . . . . . . . 2,177 — — 2,177Service center assets. . . . . . . . . . . . . . . . . . . . . . . . . . . . . . . . . . . . . . . . . . . . . . . . . . . . . . . . . . . . 945 — — 945
Liabilities included in segment assets . . . . . . . . . . . . . . . . . . . . . . . . . . . . . . . . . . . . . . . . . . . 1,346 — — 1,346Inventory methodology differences . . . . . . . . . . . . . . . . . . . . . . . . . . . . . . . . . . . . . . . . . . . . . . (2,235) — — (2,235)Other . . . . . . . . . . . . . . . . . . . . . . . . . . . . . . . . . . . . . . . . . . . . . . . . . . . . . . . . . . . . . . . . . . . . . . . . . . . . . . . 627 (119) 5 513_______ _______ _______ _______Total assets . . . . . . . . . . . . . . . . . . . . . . . . . . . . . . . . . . . . . . . . . . . . . . . . . . . . . . . . . . . . . . . . . . . . . . . . $ 22,265 $ 24,612 $ (3,786) $ 43,091_______ _______ _______ ______________ _______ _______ _______
Continued on Page A-33
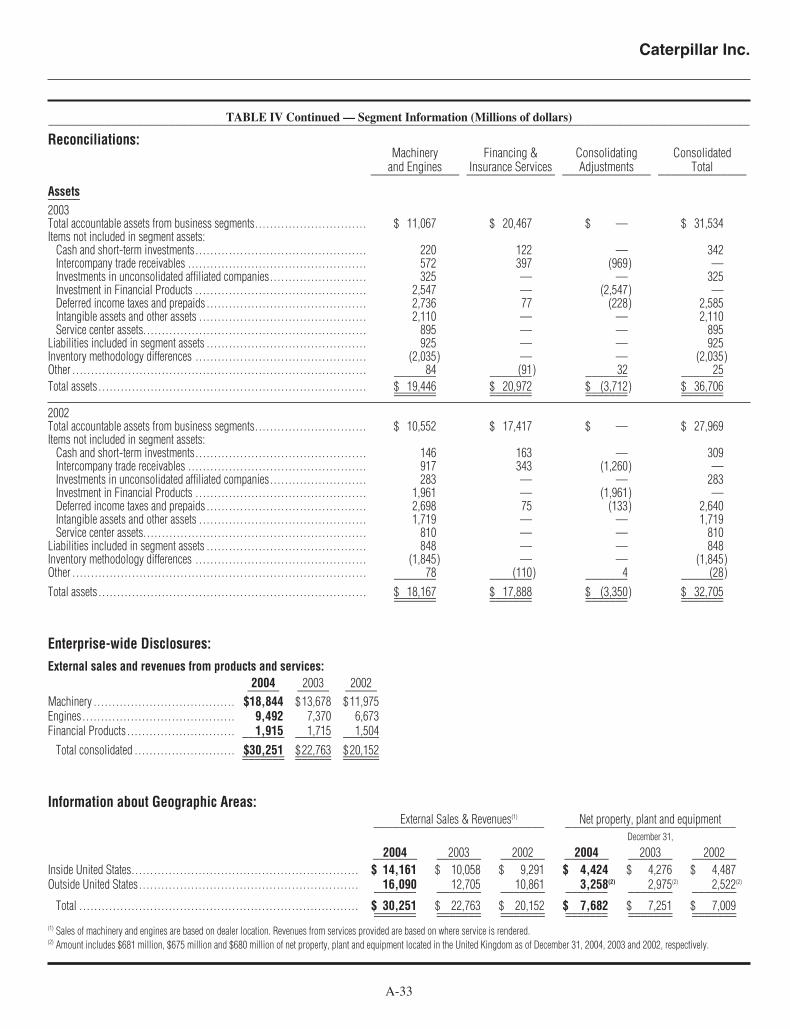
Caterpillar Inc.
A-33
TABLE IV Continued — Segment Information (Millions of dollars)_______________________________________________________________________________________________________________
Reconciliations:Machinery Financing & Consolidating Consolidated
and Engines Insurance Services Adjustments Total______________ ______________ ______________ ______________
Assets______2003Total accountable assets from business segments. . . . . . . . . . . . . . . . . . . . . . . . . . . . . . $ 11,067 $ 20,467 $ — $ 31,534Items not included in segment assets:
Cash and short-term investments. . . . . . . . . . . . . . . . . . . . . . . . . . . . . . . . . . . . . . . . . . . . . . 220 122 — 342Intercompany trade receivables . . . . . . . . . . . . . . . . . . . . . . . . . . . . . . . . . . . . . . . . . . . . . . . . 572 397 (969) —Investments in unconsolidated affiliated companies. . . . . . . . . . . . . . . . . . . . . . . . . . 325 — — 325Investment in Financial Products . . . . . . . . . . . . . . . . . . . . . . . . . . . . . . . . . . . . . . . . . . . . . . 2,547 — (2,547) —Deferred income taxes and prepaids . . . . . . . . . . . . . . . . . . . . . . . . . . . . . . . . . . . . . . . . . . . 2,736 77 (228) 2,585Intangible assets and other assets . . . . . . . . . . . . . . . . . . . . . . . . . . . . . . . . . . . . . . . . . . . . . 2,110 — — 2,110Service center assets. . . . . . . . . . . . . . . . . . . . . . . . . . . . . . . . . . . . . . . . . . . . . . . . . . . . . . . . . . . . 895 — — 895
Liabilities included in segment assets . . . . . . . . . . . . . . . . . . . . . . . . . . . . . . . . . . . . . . . . . . . 925 — — 925Inventory methodology differences . . . . . . . . . . . . . . . . . . . . . . . . . . . . . . . . . . . . . . . . . . . . . . (2,035) — — (2,035)Other . . . . . . . . . . . . . . . . . . . . . . . . . . . . . . . . . . . . . . . . . . . . . . . . . . . . . . . . . . . . . . . . . . . . . . . . . . . . . . . 84 (91) 32 25_______ _______ _______ _______Total assets . . . . . . . . . . . . . . . . . . . . . . . . . . . . . . . . . . . . . . . . . . . . . . . . . . . . . . . . . . . . . . . . . . . . . . . . $ 19,446 $ 20,972 $ (3,712) $ 36,706_______ _______ _______ ______________ _______ _______ _______
2002Total accountable assets from business segments. . . . . . . . . . . . . . . . . . . . . . . . . . . . . . $ 10,552 $ 17,417 $ — $ 27,969Items not included in segment assets:
Cash and short-term investments. . . . . . . . . . . . . . . . . . . . . . . . . . . . . . . . . . . . . . . . . . . . . . 146 163 — 309Intercompany trade receivables . . . . . . . . . . . . . . . . . . . . . . . . . . . . . . . . . . . . . . . . . . . . . . . . 917 343 (1,260) —Investments in unconsolidated affiliated companies. . . . . . . . . . . . . . . . . . . . . . . . . . 283 — — 283Investment in Financial Products . . . . . . . . . . . . . . . . . . . . . . . . . . . . . . . . . . . . . . . . . . . . . . 1,961 — (1,961) —Deferred income taxes and prepaids . . . . . . . . . . . . . . . . . . . . . . . . . . . . . . . . . . . . . . . . . . . 2,698 75 (133) 2,640Intangible assets and other assets . . . . . . . . . . . . . . . . . . . . . . . . . . . . . . . . . . . . . . . . . . . . . 1,719 — — 1,719Service center assets. . . . . . . . . . . . . . . . . . . . . . . . . . . . . . . . . . . . . . . . . . . . . . . . . . . . . . . . . . . . 810 — — 810
Liabilities included in segment assets . . . . . . . . . . . . . . . . . . . . . . . . . . . . . . . . . . . . . . . . . . . 848 — — 848Inventory methodology differences . . . . . . . . . . . . . . . . . . . . . . . . . . . . . . . . . . . . . . . . . . . . . . (1,845) — — (1,845)Other . . . . . . . . . . . . . . . . . . . . . . . . . . . . . . . . . . . . . . . . . . . . . . . . . . . . . . . . . . . . . . . . . . . . . . . . . . . . . . . 78 (110) 4 (28)_______ _______ _______ _______Total assets . . . . . . . . . . . . . . . . . . . . . . . . . . . . . . . . . . . . . . . . . . . . . . . . . . . . . . . . . . . . . . . . . . . . . . . . $ 18,167 $ 17,888 $ (3,350) $ 32,705_______ _______ _______ ______________ _______ _______ _______
Enterprise-wide Disclosures:External sales and revenues from products and services:
2004 2003 2002_____ _____ _____Machinery . . . . . . . . . . . . . . . . . . . . . . . . . . . . . . . . . . . . . . $18,844 $13,678 $11,975Engines . . . . . . . . . . . . . . . . . . . . . . . . . . . . . . . . . . . . . . . . . 9,492 7,370 6,673Financial Products . . . . . . . . . . . . . . . . . . . . . . . . . . . . . 1,915 1,715 1,504_______ ______ ______
Total consolidated . . . . . . . . . . . . . . . . . . . . . . . . . . . $30,251 $22,763 $20,152_______ ______ _____________ ______ ______
Information about Geographic Areas:External Sales & Revenues(1) Net property, plant and equipment___________________________ ___________________________
December 31,
2004 2003 2002 2004 2003 2002_______ _______ _______ _______ _______ _______Inside United States. . . . . . . . . . . . . . . . . . . . . . . . . . . . . . . . . . . . . . . . . . . . . . . . . . . . . . . . . . . . . $ 14,161 $ 10,058 $ 9,291 $ 4,424 $ 4,276 $ 4,487Outside United States . . . . . . . . . . . . . . . . . . . . . . . . . . . . . . . . . . . . . . . . . . . . . . . . . . . . . . . . . . . 16,090 12,705 10,861 3,258(2) 2,975(2) 2,522(2)_______ _______ _______ _______ _______ _______
Total . . . . . . . . . . . . . . . . . . . . . . . . . . . . . . . . . . . . . . . . . . . . . . . . . . . . . . . . . . . . . . . . . . . . . . . . . . . $ 30,251 $ 22,763 $ 20,152 $ 7,682 $ 7,251 $ 7,009_______ _______ _______ _______ _______ ______________ _______ _______ _______ _______ _______(1) Sales of machinery and engines are based on dealer location. Revenues from services provided are based on where service is rendered.(2) Amount includes $681 million, $675 million and $680 million of net property, plant and equipment located in the United Kingdom as of December 31, 2004, 2003 and 2002, respectively.

NOTES continued
A-34
26. Acquisitions
Turbomach S.A.
In June 2004, we acquired Turbomach S.A. from Borsig EnergyGmbh for $41 million, subject to certain post-closing adjustments.Turbomach S.A. is a Swiss corporation that has packaged, dis-tributed and provided aftermarket services for Solar brand gasturbine engines since 1985 for the industrial power generationmarket. Turbomach also provides integrated systems for powerprojects, including balance of plant design, procurement and siteconstruction. The acquisition expands our participation withinthe global power generation market, particularly in the expandingmarkets of Europe, Africa and Asia.
The transaction, which was financed with available cash andcommercial paper borrowings, was accounted for by the pur-chase method of accounting and, accordingly, the results of theacquired business for the period from the acquisition date areincluded in the accompanying consolidated financial statementsand reported in the “Power Products” segment. Net tangibleassets acquired and liabilities assumed of $41 million wererecorded at their fair values. No significant intangible assets wereacquired. Assuming this transaction had been made at January 1,2004, the consolidated pro forma results for the year would notbe materially different from reported results.
Parts and Accessories Distribution Business of MG Rover Ltd.
In August 2004, we acquired the global parts and accessoriesbusiness of U.K. auto manufacturer MG Rover, a wholly ownedsubsidiary of Phoenix Venture Holdings Limited, for $178 mil-lion, including $169 million at closing (subject to certain post-closing adjustments) and a $9 million promissory note to be paidin 2006. The business acquired includes the sourcing, market-ing, distribution and sale of automotive service parts and acces-sories to MG Rover dealers, distributors, importers and otherrelated customers worldwide.
The transaction, which was financed with available cash andcommercial paper borrowings, was accounted for by the pur-chase method of accounting and, accordingly, the results of theacquired business for the period from the acquisition date areincluded in the accompanying consolidated financial statementsand reported in the “All Other” segment. Net tangible assetsacquired and liabilities assumed of $73 million were recordedat their fair values. Finite-lived intangible assets acquired of $87 mil-lion relate primarily to technology and trademark rights, whichare being amortized on a straight-line basis over 15 and 20 years,respectively. Goodwill of $18 million represents the excess ofcost over the fair value of net tangible and finite-lived intangi-ble assets acquired. Assuming this transaction had been made atJanuary 1, 2004, the consolidated pro forma results for the yearwould not be materially different from reported results.
Williams Technologies, Inc.
In September 2004, we acquired Williams Technologies, Inc.,a wholly owned subsidiary of Remy International, Inc., for
$105 million, subject to certain post-closing adjustments. WilliamsTechnologies, Inc. is a leading remanufacturer of automatictransmissions, torque converters and engines for automotive andmedium and heavy-duty truck applications. This acquisition repre-sents an expansion of our remanufacturing operations into theautomotive powertrain remanufacturing business.
The transaction, which was financed with available cash andcommercial paper borrowings, was accounted for by the purchasemethod of accounting and, accordingly, the results of the acquiredbusiness for the period from the acquisition date are included inthe accompanying consolidated financial statements and reportedin the “All Other” segment. Net tangible assets acquired and lia-bilities assumed of $25 million were recorded at their fair values.Finite-lived intangible assets acquired of $43 million relate pri-marily to customer relationships, and are being amortized on astraight-line basis over 20 years. Goodwill of $37 million rep-resents the excess of cost over the fair value of net tangible andfinite-lived intangible assets acquired. Assuming this transactionhad been made at January 1, 2004, the consolidated pro forma resultsfor the year would not be materially different from reported results.
27. Selected quarterly financial results (unaudited)
2004 Quarter___________________________(Dollars in millions except per share data) 1st 2nd 3rd 4th______ ______ ______ ______Sales and revenues. . . . . . . . . . . . . . . . . . . $ 6,467 $ 7,564 $ 7,649 $ 8,571Less: Revenues . . . . . . . . . . . . . . . . . . . . . . . 465 464 474 512______ ______ ______ ______Sales . . . . . . . . . . . . . . . . . . . . . . . . . . . . . . . . . . 6,002 7,100 7,175 8,059Cost of goods sold . . . . . . . . . . . . . . . . . . . 4,683 5,541 5,728 6,468______ ______ ______ ______Gross margin . . . . . . . . . . . . . . . . . . . . . . . . . 1,319 1,559 1,447 1,591Profit . . . . . . . . . . . . . . . . . . . . . . . . . . . . . . . . . . 420 566 498 551Profit per common share . . . . . . . . . . . . $ 1.23 $ 1.65 $ 1.45 $ 1.61Profit per common share
— diluted . . . . . . . . . . . . . . . . . . . . . . . . . . $ 1.19 $ 1.59 $ 1.41 $ 1.55
2003 Quarter___________________________(Dollars in millions except per share data) 1st 2nd 3rd 4th______ ______ ______ ______Sales and revenues. . . . . . . . . . . . . . . . . . . $ 4,821 $ 5,932 $ 5,545 $ 6,465Less: Revenues . . . . . . . . . . . . . . . . . . . . . . . 397 431 433 454______ ______ ______ ______Sales . . . . . . . . . . . . . . . . . . . . . . . . . . . . . . . . . . 4,424 5,501 5,112 6,011Cost of goods sold . . . . . . . . . . . . . . . . . . . 3,630 4,329 4,143 4,843______ ______ ______ ______Gross margin . . . . . . . . . . . . . . . . . . . . . . . . . 794 1,172 969 1,168Profit . . . . . . . . . . . . . . . . . . . . . . . . . . . . . . . . . . 129 399 222 349Profit per common share . . . . . . . . . . . . $ .37 $ 1.16 $ .64 $ 1.01Profit per common share
— diluted . . . . . . . . . . . . . . . . . . . . . . . . . . $ .37 $ 1.15 $ .62 $ .97As discussed in Note 14E on page A-23, we recognized the
impact of Medicare Part D in the third quarter of 2004, retroac-tive to December 31, 2003. Previously issued amounts for thefirst and second quarters of 2004 were as follows:
2004 Quarter_____________(Dollars in millions except per share data) 1st 2nd______ ______Profit. . . . . . . . . . . . . . . . . . . . . . . . . . . . . . . . . . . . . . . . . . . . . . . . . . . . . . . . . . $ 412 $ 552Profit per common share . . . . . . . . . . . . . . . . . . . . . . . . . . . . . . . . . . . . $ 1.20 $ 1.61Profit per common share — diluted. . . . . . . . . . . . . . . . . . . . . . . . $ 1.16 $ 1.55

A-35
Five-year Financial Summary Caterpillar Inc.(Dollars in millions except per share data)
Years ended December 31, 2004 2003 2002 2001 2000______ ______ ______ ______ ______
Sales and revenues . . . . . . . . . . . . . . . . . . . . . . . . . . . . . . . . . . . . . . . . . . . . . . . . $30,251 22,763 20,152 20,450 20,175
Sales . . . . . . . . . . . . . . . . . . . . . . . . . . . . . . . . . . . . . . . . . . . . . . . . . . . . . . . . . . . $28,336 21,048 18,648 19,027 18,913
Percent inside the United States . . . . . . . . . . . . . . . . . . . . . . . . . . . 46% 44% 45% 49% 50%
Percent outside the United States. . . . . . . . . . . . . . . . . . . . . . . . . . 54% 56% 55% 51% 50%
Revenues . . . . . . . . . . . . . . . . . . . . . . . . . . . . . . . . . . . . . . . . . . . . . . . . . . . . . . . $ 1,915 1,715 1,504 1,423 1,262
Profit(1) . . . . . . . . . . . . . . . . . . . . . . . . . . . . . . . . . . . . . . . . . . . . . . . . . . . . . . . . . . . . . . $ 2,035 1,099 798 805 1,053
Profit per common share(1)(2) . . . . . . . . . . . . . . . . . . . . . . . . . . . . . . . . . . . . . . . $ 5.95 3.18 2.32 2.35 3.04
Profit per common share — diluted(1)(3) . . . . . . . . . . . . . . . . . . . . . . . . . . $ 5.75 3.13 2.30 2.32 3.02
Dividends declared per share of common stock . . . . . . . . . . . . . . . . . $ 1.600 1.440 1.400 1.390 1.345
Return on average common stockholders’ equity(4) . . . . . . . . . . . . . . 30.0% 19.0% 14.4% 14.4% 19.0%
Capital expenditures:
Property, plant and equipment. . . . . . . . . . . . . . . . . . . . . . . . . . . . . . . . . $ 926 682 728 1,100 928
Equipment leased to others . . . . . . . . . . . . . . . . . . . . . . . . . . . . . . . . . . . . $ 1,188 1,083 1,045 868 665
Depreciation and amortization . . . . . . . . . . . . . . . . . . . . . . . . . . . . . . . . . . . . $ 1,397 1,347 1,220 1,169 1,063
Research and development expenses. . . . . . . . . . . . . . . . . . . . . . . . . . . . . $ 928 669 656 696 649
As a percent of sales and revenues. . . . . . . . . . . . . . . . . . . . . . . . . . . . 3.1% 2.9% 3.3% 3.4% 3.2%
Wages, salaries and employee benefits. . . . . . . . . . . . . . . . . . . . . . . . . . . $ 6,001 4,980 4,360 4,272 4,029
Average number of employees . . . . . . . . . . . . . . . . . . . . . . . . . . . . . . . . . . . . 73,033 67,828 70,973 70,678 67,200
December 31,
Total assets. . . . . . . . . . . . . . . . . . . . . . . . . . . . . . . . . . . . . . . . . . . . . . . . . . . . . . . . . $43,091 36,706 32,705 30,489 28,246
Long-term debt due after one year:
Consolidated . . . . . . . . . . . . . . . . . . . . . . . . . . . . . . . . . . . . . . . . . . . . . . . . . . . $15,837 14,546 11,774 11,452 11,334
Machinery and Engines . . . . . . . . . . . . . . . . . . . . . . . . . . . . . . . . . . . . . . . . $ 3,663 3,603 3,581 3,653 2,854
Financial Products . . . . . . . . . . . . . . . . . . . . . . . . . . . . . . . . . . . . . . . . . . . . . $12,174 10,943 8,193 7,799 8,480
Total debt:
Consolidated . . . . . . . . . . . . . . . . . . . . . . . . . . . . . . . . . . . . . . . . . . . . . . . . . . . $23,525 20,284 17,861 16,763 15,067
Machinery and Engines . . . . . . . . . . . . . . . . . . . . . . . . . . . . . . . . . . . . . . . . $ 3,762 3,707 3,903 3,945 3,427
Financial Products . . . . . . . . . . . . . . . . . . . . . . . . . . . . . . . . . . . . . . . . . . . . . $19,763 16,577 13,958 12,818 11,640
(1) In 2002, we adopted Statement of Financial Accounting Standards No. 142, “Goodwill and Other Intangible Assets” and therefore no longer amortize goodwill.(2) Computed on weighted-average number of shares outstanding.(3) Computed on weighted-average number of shares outstanding diluted by assumed exercise of stock options, using the treasury stock method.(4) Represents profit divided by average stockholders’ equity (beginning of year stockholders’ equity plus end of year stockholders’ equity divided by two).

A-36
MANAGEMENT’S DISCUSSION AND ANALYSIS
OVERVIEWWithout question, 2004 was one of the most remarkable years inour proud history. In 1997, with sales and revenues less than $19 bil-lion, we set the goal of becoming a $30 billion company by themiddle of this decade. While many thought it was overly ambi-tious, at the close of 2004 we’re able to celebrate that tremendousaccomplishment ahead of schedule. Throughout the year, TeamCaterpillar — our employees, dealers and suppliers — effectivelyresponded to an unprecedented recovery in nearly every marketwe serve and enhanced our long-term strategic position by meet-ing record customer demand and building substantial field pop-ulation. We’re clearly pleased to have reached this important$30 billion milestone, but we have not yet delivered bottom lineperformance in line with our own expectations. While we remaincommitted to satisfying our customers, we’re disappointed withour cost structure, particularly steel related costs and supply chaininefficiencies due to lack of material availability. That, coupledwith a record order backlog which delayed price realization,*caused incremental margins to lag in 2004.
Also in 2004, we delivered solid improvement in cash flowand the company ended the year with an even stronger financialposition. After providing continued funding for growth oppor-tunities and new product development, the company was able tomake significant contributions to pension plans, increase divi-dends to shareholders and repurchase Caterpillar shares. Pensionplans remain well funded due to solid investment returns andover $600 million in contributions for the second year in a row.The company has increased its dividend in ten of the last elevenyears and repurchased almost seven million shares during 2004.This financial strength positions Caterpillar very well for the future.
In January 2005 the company and about 9,000 employees rep-resented by the United Auto Workers reached a new six-year laboragreement that will expire on March 1, 2011. Through thought-ful and professional negotiations, we’ve reached an agreementthat positions the company and all our employees for long-termcompetitiveness.
This year’s opportunities certainly presented us with significantchallenges. However, we are pleased we were still able to deliverrecord profits and increased return on sales. We will continue tomeet customer requirements and strengthen our long-term marketposition. While significant cost pressures are common duringperiods of explosive growth, we’re focusing the expertise of hun-dreds of 6 Sigma teams to aggressively address these issues andimprove our cost structure in 2005. We’ll continue to build on thevalue of 6 Sigma and the opportunities unleashed by an engagedglobal team to set new records this year, create long-term value forour customers and deliver exceptional returns to our shareholders.
It is our objective to provide the most meaningful disclosures inour Management’s Discussion and Analysis in order to explain sig-nificant changes in our company’s results of operations and liquid-ity and capital resources. As discussed in Note 25 on pages A-29to A-30, our segment financial information is not based on gener-ally accepted accounting principles and it is not intended to mea-sure contributions to enterprise results. Therefore, it is impracticalfor us to try to discuss our company’s results of operations and liq-uidity and capital resources solely based on segment information.Where practical, we have linked our discussions to segment infor-mation provided in Note 25 and Table IV on pages A-29 to A-33(see “Reconciliation of Machinery and Engines Sales by Geo-graphic Region to External Sales by Marketing Segment” onpage A-37). Our discussions will focus on consolidated resultsand our three principal lines of business as described below:
Consolidated — represents the consolidated data ofCaterpillar Inc. and all its consolidated subsidiaries.
Machinery — A principal line of business which includes thedesign, manufacture, marketing and sales of construction, min-ing and forestry machinery — track and wheel tractors, track andwheel loaders, pipelayers, motor graders, wheel tractor-scrapers,track and wheel excavators, backhoe loaders, log skidders, logloaders, off-highway trucks, articulated trucks, paving products,telescopic handlers, skid steer loaders and related parts. Alsoincludes logistics services for other companies.
Engines — A principal line of business including the design,manufacture, marketing and sales of engines for Caterpillarmachinery, electric power generation systems; on-highway vehi-cles and locomotives; marine, petroleum, construction, indus-trial, agricultural and other applications; and related parts.Reciprocating engines meet power needs ranging from 5 to over22,000 horsepower (4 to over 16 200 kilowatts). Turbines rangefrom 1,200 to 20,500 horsepower (900 to 15 000 kilowatts).
Financial Products — A principal line of business consist-ing primarily of Caterpillar Financial Services Corporation (CatFinancial), Caterpillar Insurance Holdings, Inc. (Cat Insurance),Caterpillar Power Ventures Corporation (Cat Power Ventures)and their subsidiaries. Cat Financial provides a wide range offinancing alternatives for Caterpillar machinery and engines,Solar gas turbines, as well as other equipment and marine ves-sels. Cat Financial also extends loans to customers and dealers.Cat Insurance provides various forms of insurance to customersand dealers to help support the purchase and lease of our equip-ment. Cat Power Ventures is an active investor in independentpower projects using Caterpillar power generation equipmentand services.
*Glossary of terms included on pages A-47 to A-48; first occurrence of terms shown in bold italics.
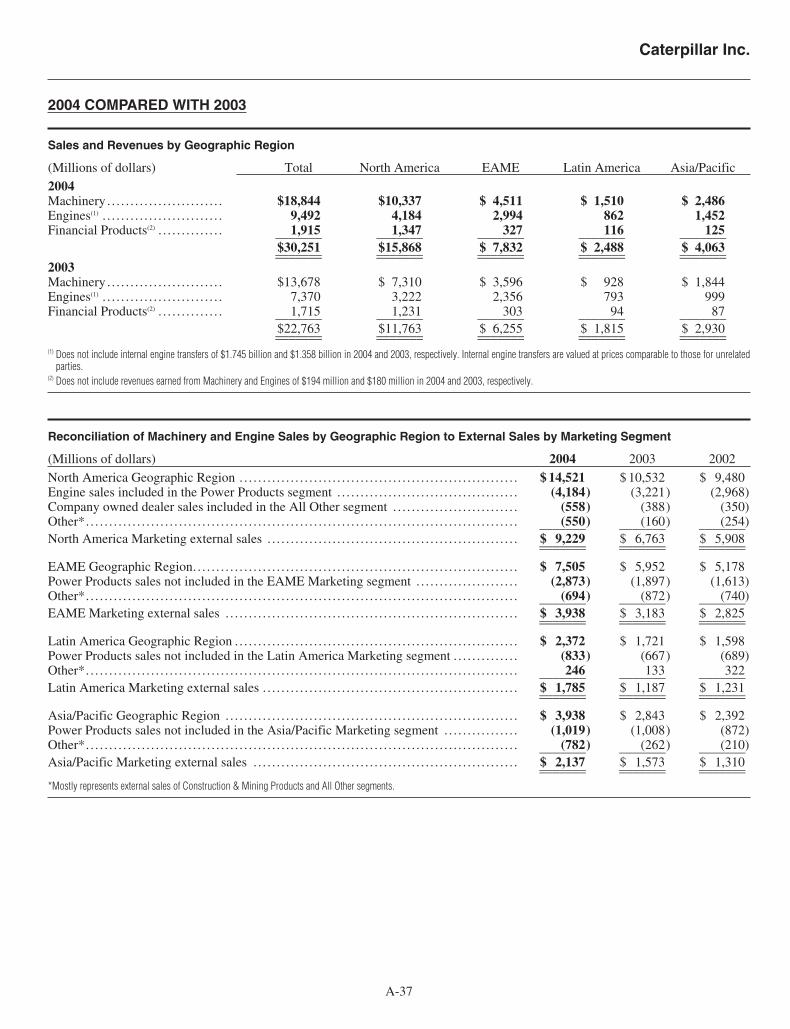
Caterpillar Inc.
A-37
Sales and Revenues by Geographic Region
(Millions of dollars) Total North America EAME Latin America Asia/Pacific
2004Machinery . . . . . . . . . . . . . . . . . . . . . . . . . $18,844 $10,337 $ 4,511 $ 1,510 $ 2,486Engines(1) . . . . . . . . . . . . . . . . . . . . . . . . . . 9,492 4,184 2,994 862 1,452Financial Products(2) . . . . . . . . . . . . . . 1,915 1,347 327 116 125_______ _______ _______ _______ _______
$30,251 $15,868 $ 7,832 $ 2,488 $ 4,063_______ _______ _______ _______ ______________ _______ _______ _______ _______2003Machinery . . . . . . . . . . . . . . . . . . . . . . . . . $13,678 $ 7,310 $ 3,596 $ 928 $ 1,844Engines(1) . . . . . . . . . . . . . . . . . . . . . . . . . . 7,370 3,222 2,356 793 999Financial Products(2) . . . . . . . . . . . . . . 1,715 1,231 303 94 87_______ _______ _______ _______ _______
$22,763 $11,763 $ 6,255 $ 1,815 $ 2,930_______ _______ _______ _______ ______________ _______ _______ _______ _______(1) Does not include internal engine transfers of $1.745 billion and $1.358 billion in 2004 and 2003, respectively. Internal engine transfers are valued at prices comparable to those for unrelated
parties.(2) Does not include revenues earned from Machinery and Engines of $194 million and $180 million in 2004 and 2003, respectively.
2004 COMPARED WITH 2003
Reconciliation of Machinery and Engine Sales by Geographic Region to External Sales by Marketing Segment
(Millions of dollars) 2004 2003 2002
North America Geographic Region . . . . . . . . . . . . . . . . . . . . . . . . . . . . . . . . . . . . . . . . . . . . . . . . . . . . . . . . . . . . $ 14,521 $ 10,532 $ 9,480Engine sales included in the Power Products segment . . . . . . . . . . . . . . . . . . . . . . . . . . . . . . . . . . . . . . . (4,184) (3,221) (2,968)Company owned dealer sales included in the All Other segment . . . . . . . . . . . . . . . . . . . . . . . . . . . (558) (388) (350)Other*. . . . . . . . . . . . . . . . . . . . . . . . . . . . . . . . . . . . . . . . . . . . . . . . . . . . . . . . . . . . . . . . . . . . . . . . . . . . . . . . . . . . . . . . . . . . . (550) (160) (254)_______ _______ _______North America Marketing external sales . . . . . . . . . . . . . . . . . . . . . . . . . . . . . . . . . . . . . . . . . . . . . . . . . . . . . . $ 9,229 $ 6,763 $ 5,908_______ _______ ______________ _______ _______
EAME Geographic Region. . . . . . . . . . . . . . . . . . . . . . . . . . . . . . . . . . . . . . . . . . . . . . . . . . . . . . . . . . . . . . . . . . . . . . $ 7,505 $ 5,952 $ 5,178Power Products sales not included in the EAME Marketing segment . . . . . . . . . . . . . . . . . . . . . . (2,873) (1,897) (1,613)Other*. . . . . . . . . . . . . . . . . . . . . . . . . . . . . . . . . . . . . . . . . . . . . . . . . . . . . . . . . . . . . . . . . . . . . . . . . . . . . . . . . . . . . . . . . . . . . (694) (872) (740)_______ _______ _______EAME Marketing external sales . . . . . . . . . . . . . . . . . . . . . . . . . . . . . . . . . . . . . . . . . . . . . . . . . . . . . . . . . . . . . . . $ 3,938 $ 3,183 $ 2,825_______ _______ ______________ _______ _______
Latin America Geographic Region . . . . . . . . . . . . . . . . . . . . . . . . . . . . . . . . . . . . . . . . . . . . . . . . . . . . . . . . . . . . . $ 2,372 $ 1,721 $ 1,598Power Products sales not included in the Latin America Marketing segment . . . . . . . . . . . . . . (833) (667) (689)Other*. . . . . . . . . . . . . . . . . . . . . . . . . . . . . . . . . . . . . . . . . . . . . . . . . . . . . . . . . . . . . . . . . . . . . . . . . . . . . . . . . . . . . . . . . . . . . 246 133 322_______ _______ _______Latin America Marketing external sales . . . . . . . . . . . . . . . . . . . . . . . . . . . . . . . . . . . . . . . . . . . . . . . . . . . . . . . $ 1,785 $ 1,187 $ 1,231_______ _______ ______________ _______ _______
Asia/Pacific Geographic Region . . . . . . . . . . . . . . . . . . . . . . . . . . . . . . . . . . . . . . . . . . . . . . . . . . . . . . . . . . . . . . . $ 3,938 $ 2,843 $ 2,392Power Products sales not included in the Asia/Pacific Marketing segment . . . . . . . . . . . . . . . . (1,019) (1,008) (872)Other*. . . . . . . . . . . . . . . . . . . . . . . . . . . . . . . . . . . . . . . . . . . . . . . . . . . . . . . . . . . . . . . . . . . . . . . . . . . . . . . . . . . . . . . . . . . . . (782) (262) (210)_______ _______ _______Asia/Pacific Marketing external sales . . . . . . . . . . . . . . . . . . . . . . . . . . . . . . . . . . . . . . . . . . . . . . . . . . . . . . . . . $ 2,137 $ 1,573 $ 1,310_______ _______ ______________ _______ _______*Mostly represents external sales of Construction & Mining Products and All Other segments.
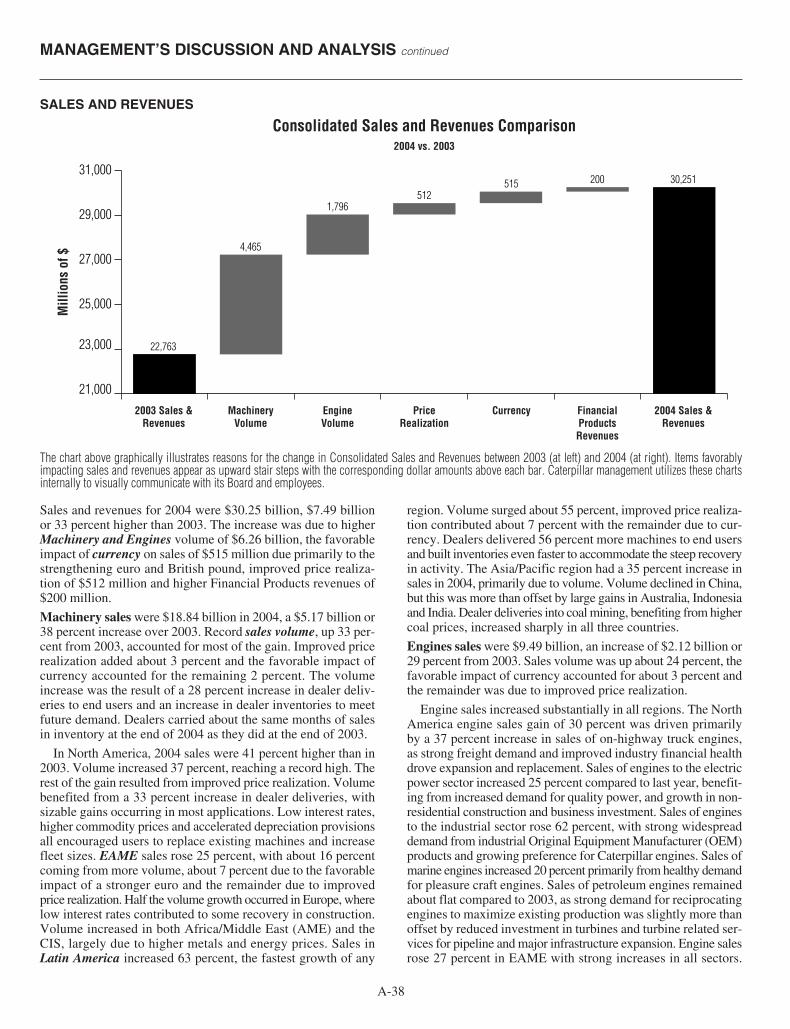
MANAGEMENT’S DISCUSSION AND ANALYSIS continued
A-38
Sales and revenues for 2004 were $30.25 billion, $7.49 billionor 33 percent higher than 2003. The increase was due to higherMachinery and Engines volume of $6.26 billion, the favorableimpact of currency on sales of $515 million due primarily to thestrengthening euro and British pound, improved price realiza-tion of $512 million and higher Financial Products revenues of$200 million.
Machinery sales were $18.84 billion in 2004, a $5.17 billion or38 percent increase over 2003. Record sales volume, up 33 per-cent from 2003, accounted for most of the gain. Improved pricerealization added about 3 percent and the favorable impact ofcurrency accounted for the remaining 2 percent. The volumeincrease was the result of a 28 percent increase in dealer deliv-eries to end users and an increase in dealer inventories to meetfuture demand. Dealers carried about the same months of salesin inventory at the end of 2004 as they did at the end of 2003.
In North America, 2004 sales were 41 percent higher than in2003. Volume increased 37 percent, reaching a record high. Therest of the gain resulted from improved price realization. Volumebenefited from a 33 percent increase in dealer deliveries, withsizable gains occurring in most applications. Low interest rates,higher commodity prices and accelerated depreciation provisionsall encouraged users to replace existing machines and increasefleet sizes. EAME sales rose 25 percent, with about 16 percentcoming from more volume, about 7 percent due to the favorableimpact of a stronger euro and the remainder due to improvedprice realization. Half the volume growth occurred in Europe, wherelow interest rates contributed to some recovery in construction.Volume increased in both Africa/Middle East (AME) and theCIS, largely due to higher metals and energy prices. Sales inLatin America increased 63 percent, the fastest growth of any
region. Volume surged about 55 percent, improved price realiza-tion contributed about 7 percent with the remainder due to cur-rency. Dealers delivered 56 percent more machines to end usersand built inventories even faster to accommodate the steep recoveryin activity. The Asia/Pacific region had a 35 percent increase insales in 2004, primarily due to volume. Volume declined in China,but this was more than offset by large gains in Australia, Indonesiaand India. Dealer deliveries into coal mining, benefiting from highercoal prices, increased sharply in all three countries.
Engines sales were $9.49 billion, an increase of $2.12 billion or29 percent from 2003. Sales volume was up about 24 percent, thefavorable impact of currency accounted for about 3 percent andthe remainder was due to improved price realization.
Engine sales increased substantially in all regions. The NorthAmerica engine sales gain of 30 percent was driven primarilyby a 37 percent increase in sales of on-highway truck engines,as strong freight demand and improved industry financial healthdrove expansion and replacement. Sales of engines to the electricpower sector increased 25 percent compared to last year, benefit-ing from increased demand for quality power, and growth in non-residential construction and business investment. Sales of enginesto the industrial sector rose 62 percent, with strong widespreaddemand from industrial Original Equipment Manufacturer (OEM)products and growing preference for Caterpillar engines. Sales ofmarine engines increased 20 percent primarily from healthy demandfor pleasure craft engines. Sales of petroleum engines remainedabout flat compared to 2003, as strong demand for reciprocatingengines to maximize existing production was slightly more thanoffset by reduced investment in turbines and turbine related ser-vices for pipeline and major infrastructure expansion. Engine salesrose 27 percent in EAME with strong increases in all sectors.
SALES AND REVENUES
The chart above graphically illustrates reasons for the change in Consolidated Sales and Revenues between 2003 (at left) and 2004 (at right). Items favorablyimpacting sales and revenues appear as upward stair steps with the corresponding dollar amounts above each bar. Caterpillar management utilizes these chartsinternally to visually communicate with its Board and employees.
21,000
23,000
25,000
27,000
29,000
31,000
Mill
ions
of $
2003 Sales &Revenues
MachineryVolume
4,465
EngineVolume
1,796
PriceRealization
512
Currency
515
FinancialProductsRevenues
200
2004 Sales &Revenues
30,251
Consolidated Sales and Revenues Comparison2004 vs. 2003
22,763

Caterpillar Inc.
A-39
OPERATING PROFIT
The chart above graphically illustrates reasons for the change in Consolidated Operating Profit between 2003 (at left) and 2004 (at right). Items favorably impactingoperating profit appear as upward stair steps with the corresponding dollar amounts above each bar, while items negatively impacting operating profit appear asdownward stair steps with dollar amounts reflected in parentheses above each bar. Caterpillar management utilizes these charts internally to visually communicatewith its Board and employees.
Mill
ions
of $
2003Operating
Profit
1,688
SalesVolume
1,808
PriceRealization
512
Currency
(232)
CoreOperating
Costs
(1,114)
NCPs
153
RetirementBenefits
(139)
FinancialProducts
92
ConsolidatingAdjustments
(35)
2004Operating
Profit
2,733
Consolidated Operating Profit Comparison2004 vs. 2003
1,000
1,500
2,000
2,500
3,000
3,500
4,000
Sales of engines into the electric power sector increased 54 percentdue to stronger demand for prime and cogeneration systems,Middle Eastern demand for large engines and power modules,and favorable currency versus euro-based competition. Sales ofengines to the petroleum sector increased 29 percent, with thevast majority of the increase coming from sales of turbines andturbine-related services to support increases in petroleum invest-ment. Sales of engines to the marine sector increased 27 percentdue to increased investment in oceangoing and workboat vessels,driven by higher demand for inland waterway transportation andstrengthening oceangoing vessel lease rates. Sales of engines intothe industrial sector increased 10 percent. Engine sales in LatinAmerica increased 9 percent with gains in most sectors from animproved business investment climate. Sales of petroleum enginesin Latin America increased 16 percent with increased demandfor turbines and turbine related services for pipeline applications.Sales of electric power engines in Latin America decreased 27 per-cent, primarily due to the absence of a large turbine electric powerproject that occurred during 2003. Widespread economic growth
in Asia/Pacific contributed to the 45 percent increase in enginesales. Sales of engines into the electric power sector nearly doubledas strong growth drove increased demand for commercial standbyand self-generation, as well as for generator sets to support ongoingdemand from transmission shortages in China. Sales of petroleumengines increased 30 percent as growth in exploration and pro-duction drove strong demand for turbines and turbine relatedservices. Sales of engines to the marine sector increased 48 per-cent due to increased demand for dredge equipment in supportof construction growth, as well as broad increases in demand foroffshore supply boats, pleasure craft and oceangoing vessels.
Financial Products revenues were $1.92 billion, an increase of$200 million or 12 percent from 2003. The increase was due pri-marily to a $228 million favorable impact at Cat Financial fromcontinued growth of earning assets, partially offset by a $60 mil-lion impact of lower interest rates on new and existing financereceivables. Also, there was a $19 million increase in earned pre-miums at Cat Insurance and a $14 million increase in electricplant revenue at Cat Power Ventures.
Higher sales volume in all regions resulted in a favorable operat-ing profit impact of $1.81 billion. Operating profit was alsofavorably impacted by improved price realization of $512 mil-lion, the absence of $153 million of Non-Conformance Penalties(NCPs) that were recorded in 2003 and improved profitability ofFinancial Products of $92 million.
Partially offsetting the favorable items were $1.11 billion inhigher core operating costs, a $232 million unfavorable impactof currency on operating profit due primarily to the weakeningof the dollar compared with the British pound and the Japaneseyen and $139 million of higher retirement benefits.
Our main focus throughout 2004 has been to satisfy unprece-dented customer demand despite incurring additional core operat-ing costs to respond to the steep market upturn. The additional coreoperating costs reflect increases in manufacturing costs and highergeneral support costs to meet demand. These additional manufac-turing costs included higher material costs resulting primarily fromsteel related and commodity price increases and higher freight andexpediting costs to ensure timely delivery of material. The remain-der of the core operating cost increase is largely attributable tohigher SG&A expense to support growth and development pro-grams, planned spending on product development, higher incentive

MANAGEMENT’S DISCUSSION AND ANALYSIS continued
A-40
compensation costs as well as increased warranty expense. Theseunfavorable items were partially offset by ongoing cost reduc-tions resulting from hundreds of 6 Sigma projects.
Operating Profit Table(Millions of dollars) 2004 2003
Machinery(1) . . . . . . . . . . . . . . . . . . . . . . . . . . . . . . . . . $1,825 $1,246Engines(1). . . . . . . . . . . . . . . . . . . . . . . . . . . . . . . . . . . . . 597 188Financial Products . . . . . . . . . . . . . . . . . . . . . . . . . . 437 345Consolidating Adjustments(2) . . . . . . . . . . . . . . (126) (91)______ ______
$2,733 $1,688______ ____________ ______(1) Caterpillar operations are highly integrated; therefore, the company uses a number of alloca-
tions to determine lines of business operating profit for Machinery and Engines.(2) Consolidating adjustments consist of eliminations of transactions between Machinery and
Engines and Financial Products.
Machinery operating profit of $1.83 billion was up $579 mil-lion, or 46 percent, from 2003. The favorable impact of highersales volume and improved price realization was partially offsetby higher core operating costs (as outlined above), the unfavor-able impact of currency and higher retirement benefits.Engines operating profit of $597 million was up $409 million,or 218 percent, from 2003. The favorable impact of higher salesvolume, the absence of NCPs and improved price realization werepartially offset by higher core operating costs (as outlined above),higher retirement benefits and the unfavorable impact of currency.Financial Products operating profit of $437 million was up$92 million, or 27 percent, from 2003. The increase was pri-marily due to a $105 million impact from the growth of earningassets and a $16 million improvement in gain/loss on sale ofused equipment at Cat Financial, and a $45 million increase inunderwriting income ($26 million due to favorable reserveadjustments resulting from better than anticipated claim experi-ence; remainder due to growth) at Cat Insurance. These favorableitems were partially offset by a $39 million increase in operat-ing expenses at Cat Financial primarily related to increased laborcosts to support growth in earning assets and a $34 million impactof lower interest spreads.
OTHER PROFIT/LOSS ITEMSInterest expense excluding Financial Products was $16 mil-lion lower compared to 2003 primarily due to lower average bor-rowing rates.
Other income/expense was income of $204 million comparedwith income of $35 million in 2003 for a favorable impact of$169 million. The change was primarily due to the favorableimpact of Machinery and Engines currency gains of $75 million,the absence of a $55 million non-recurring bond retirement chargerecorded in the third quarter 2003 and the absence of investmentimpairments at Cat Insurance of $27 million.
Caterpillar’s profit and cash flows are subject to fluctuation dueto changes in foreign exchange rates. The company uses currencyforward and option contracts to reduce the impact of exchangerate changes. As mentioned above, the result of this activity in2004 on Machinery and Engines other income/expense wasfavorable $75 million. This reduces the net unfavorable impactof currency on profit before tax to $157 million.
The provision for income taxes for both 2003 and 2004 reflectsan effective annual tax rate of 27 percent. A change in our
geographic mix of profits was offset by the change in retirementbenefits discussed on pages A-54 to A-55.
On October 22, 2004, the American Jobs Creation Act (theAct) was signed into law. Among other things, the Act providesfor the phase-out of Extraterritorial Income Exclusion (ETI) bene-fits over the next two years and creates a new deduction in 2005 of85 percent of certain non-U.S. earnings that are repatriated in excessof a base amount, as defined in the Act. We have started an evalua-tion of the effects of the repatriation provision. However, we do notexpect to be able to complete this evaluation until after Congressand the Treasury Department provide additional clarification onkey elements of the provision. We expect to complete our evalua-tion of the effects of the repatriation provision within a reasonableperiod of time following the publication of all relevant guidance.The range of possible amounts, including the base, which we areconsidering for repatriation under this provision, is between zeroand $1 billion. The related potential range of incremental pro-vision for income taxes is between zero and $75 million.The equity in profit/loss of unconsolidated affiliated companiesfavorably impacted profit by $39 million over 2003, primarilydriven by increased profitability at Shin Caterpillar MitsubishiLtd. (SCM). The increase in profitability at SCM was drivenlargely by increased exports.
Supplemental Information(Millions of dollars) 2004 2003 2002Identifiable Assets:
Machinery . . . . . . . . . . . . . . . . . . . . . $ 13,713 $ 11,801 $ 10,867Engines . . . . . . . . . . . . . . . . . . . . . . . . 8,552 7,645 7,300Financial Products . . . . . . . . . . . . 24,612 20,972 17,888Consolidating Adjustments. . . (3,786) (3,712) (3,350)_______ _______ _______
Total. . . . . . . . . . . . . . . . . . . . . . . . . . $ 43,091 $ 36,706 $ 32,705_______ _______ ______________ _______ _______Capital Expenditures:
Machinery . . . . . . . . . . . . . . . . . . . . . $ 546 $ 386 $ 393Engines . . . . . . . . . . . . . . . . . . . . . . . . 297 278 305Financial Products . . . . . . . . . . . . 1,271 1,101 1,075_______ _______ _______
Total. . . . . . . . . . . . . . . . . . . . . . . . . . $ 2,114 $ 1,765 $ 1,773_______ _______ ______________ _______ _______Depreciation and Amortization:
Machinery . . . . . . . . . . . . . . . . . . . . . $ 442 $ 453 $ 437Engines . . . . . . . . . . . . . . . . . . . . . . . . 353 345 348Financial Products . . . . . . . . . . . . 602 549 435_______ _______ _______
Total. . . . . . . . . . . . . . . . . . . . . . . . . . $ 1,397 $ 1,347 $ 1,220_______ _______ ______________ _______ _______Caterpillar operations are highly integrated; therefore, the company uses a number of alloca-tions to determine lines of business financial data.
UAW LABOR AGREEMENTIn January 2005 the company and about 9,000 employees rep-resented by the United Auto Workers reached a new six-year laboragreement that will expire on March 1, 2011. This agreementpositions the company and all our employees for long-term com-petitiveness. While the initial impact will be about a $100 millionincrease in retirement benefits in 2005, with the establishment ofa very competitive market-based new hire wage package, theintroduction of employee and retiree health care cost-sharing andother operational effectiveness improvements, we believe wehave a long-term cost structure that enables us to compete fromour traditional manufacturing and logistics locations.

Caterpillar Inc.
A-41
Sales and Revenues
(Millions of dollars) Total North America EAME Latin America Asia/Pacific
Fourth Quarter 2004Machinery . . . . . . . . . . . . . . . . . . . . . . . . . $ 5,157 $ 2,783 $ 1,279 $ 447 $ 648Engines(1) . . . . . . . . . . . . . . . . . . . . . . . . . . 2,902 1,213 955 276 458Financial Products(2) . . . . . . . . . . . . . . 512 361 84 31 36_______ _______ _______ _______ _______
$ 8,571 $ 4,357 $ 2,318 $ 754 $ 1,142_______ _______ _______ _______ ______________ _______ _______ _______ _______
Fourth Quarter 2003Machinery . . . . . . . . . . . . . . . . . . . . . . . . . $ 3,827 $ 2,088 $ 939 $ 291 $ 509Engines(1) . . . . . . . . . . . . . . . . . . . . . . . . . . 2,184 876 703 300 305Financial Products(2) . . . . . . . . . . . . . . 454 325 79 23 27_______ _______ _______ _______ _______
$ 6,465 $ 3,289 $ 1,721 $ 614 $ 841_______ _______ _______ _______ ______________ _______ _______ _______ _______(1) Does not include internal engine transfers of $484 million and $362 million in fourth quarter 2004 and fourth quarter 2003, respectively. Internal engine transfers are valued at prices com-
parable to those for unrelated parties.(2) Does not include revenues earned from Machinery and Engines of $56 million and $47 million in fourth quarter 2004 and fourth quarter 2003, respectively.
FOURTH QUARTER 2004 COMPARED WITH FOURTH QUARTER 2003
SALES AND REVENUES
The chart above graphically illustrates reasons for the change in Consolidated Sales and Revenues between fourth quarter 2003 (at left) and fourth quarter 2004(at right). Items favorably impacting sales and revenues appear as upward stair steps with the corresponding dollar amounts above each bar. Caterpillar manage-ment utilizes these charts internally to visually communicate with its Board and employees.
6,000
6,500
7,000
7,500
8,000
8,500
9,000
Mill
ions
of $
Fourth Quarter2003 Sales &
Revenues
MachineryVolume
1,139
EngineVolume
617
PriceRealization
171
Currency
121
FinancialProductsRevenues
58
Fourth Quarter2004 Sales &
Revenues
8,571
Consolidated Sales and Revenues ComparisonFourth Quarter 2004 vs. Fourth Quarter 2003
6,465
Machinery sales were a record $5.16 billion in fourth quarter2004, a $1.33 billion or 35 percent increase from fourth quarter2003. Sales volume, which accounted for most of the gain, wasup 30 percent from fourth quarter 2003. Improved price real-ization added 3 percent and the remainder was due to the favor-able impact of currency.
In North America, machinery sales increased 33 percent fromfourth quarter 2003. Volume increased about 31 percent and therest was improved price realization. Nearly all the volume growth
was the result of increased dealer deliveries to end users, pri-marily into mining and construction. Machinery sales in EAMEwere up 36 percent, with about 26 percent due to volume, about6 percent due to the favorable currency impact of a stronger euroand the remainder due to improved price realization. Volumewas a record for a fourth quarter, with good gains in Europe,AME and the CIS. Latin American machinery sales increased54 percent, with volume contributing about 43 percent of thechange and the remainder due to improved price realization.

MANAGEMENT’S DISCUSSION AND ANALYSIS continued
A-42
December machine shipments to dealers set a record, whichcaused a big increase in reported inventories since dealers didnot have enough time to convert all shipments into deliveries.In the Asia/Pacific region, machinery sales in fourth quarter 2004were 27 percent higher than a year earlier, with volume con-tributing about 23 percent, improved price realization account-ing for about 3 percent and the remainder due to currency. Asharp drop in volume in China was more than offset by gains inIndonesia, Australia and India. Deliveries into mining were upsharply in all three countries.
Engines sales were $2.90 billion, an increase of $718 million, or33 percent, compared to fourth quarter 2003. Sales volume wasup about 29 percent, the favorable impact of currency accountedfor about 2 percent and improved price realization added about2 percent.
Most regions experienced strong increases in engine sales com-pared to fourth quarter 2003. The North American engine salesgain of 38 percent was driven primarily by a 43 percent increase insales of on-highway truck engines. Sales of engines to the petro-leum sector increased 24 percent benefiting from strong demandfor reciprocating engines to expand and maximize production ofexisting gas and oil fields. Sales of engines to the industrial sec-tor increased 81 percent with widespread increases in demandfor nearly all types of industrial OEM equipment, as well asdemand for hurricane cleanup efforts in Florida and surroundingregions. Sales of engines to the electric power sector increased13 percent with continued demand from commercial constructionand business investment. Engine sales rose 36 percent in EAME
with increases in most sectors. Sales of engines into the electricpower sector increased 81 percent due to strong economics forcombined heat and power applications for turbines and reciprocat-ing generator sets, as well as increased sales opportunity via theacquisition of Turbomach. Middle Eastern demand for large enginesand power modules and favorable currency versus euro-basedcompetition also contributed to the gain. Sales of engines to themarine sector increased 36 percent with increased workboatdemand, while sales to the industrial sector increased 10 percent.Engine sales in Latin America decreased 8 percent compared tofourth quarter 2003. Increases in sales of engines occurred in allsectors, with the exception of a 54 percent reduction in sales ofengines to electric power. Electric power was impacted by a majorturbine project that occurred in fourth quarter 2003, as well asdecreased demand for large prime and standby generator sets.Widespread economic growth in Asia/Pacific contributed to the50 percent increase in engine sales, with strong increases in nearlyall sectors. Sales of engines to the petroleum sector increased67 percent driven primarily by increased demand for turbinesand turbine related services to support expansion in explorationand production. Sales of engines into the electric power sectorincreased 53 percent with increased demand for prime and standbygenerator sets. Sales of engines into the marine sector nearlydoubled with increased demand for workboat and oceangoingvessel engines.
Financial Products revenues were $512 million, an increase of$58 million or 13 percent from fourth quarter 2003. The increasewas due primarily to the favorable impact from continued growthof earning assets at Cat Financial.
OPERATING PROFIT
The chart above graphically illustrates reasons for the change in Consolidated Operating Profit between fourth quarter 2003 (at left) and fourth quarter 2004 (atright). Items favorably impacting operating profit appear as upward stair steps with the corresponding dollar amounts above each bar, while items negativelyimpacting operating profit appear as downward stair steps with dollar amounts reflected in parentheses above each bar. Caterpillar management utilizes thesecharts internally to visually communicate with its Board and employees.
Mill
ions
of $
FourthQuarter
2003Operating
Profit
499
SalesVolume
504
PriceRealization
171
Currency
(46)
CoreOperating
Costs
(412)
NCPs
21
RetirementBenefits
(45)
FinancialProducts
18
ConsolidatingAdjustments
(14)
FourthQuarter
2004Operating
Profit
696
Consolidated Operating Profit ComparisonFourth Quarter 2004 vs. Fourth Quarter 2003
300
500
700
900
1,100
1,300

Caterpillar Inc.
A-43
Higher sales volume in all regions and most industries favorablyimpacted operating profit by $504 million. Operating profit wasalso favorably impacted by improved price realization of $171 mil-lion, the absence of $21 million of NCPs that were recorded inthe fourth quarter 2003 and improved profitability of FinancialProducts of $18 million.
Partially offsetting the favorable items were $412 million inhigher core operating costs, a $46 million unfavorable impact ofcurrency on operating profit due primarily to the weakening ofthe dollar compared with the British pound and $45 million ofhigher retirement benefits.
We continued to meet unprecedented customer demand andsatisfy our customers in the fourth quarter, despite incurring addi-tional core operating costs to respond to record volumes. The addi-tional core operating costs reflect increases in manufacturing coststo satisfy customer requirements, higher SG&A expense to sup-port growth and development programs and planned spendingon product development programs. The additional manufactur-ing costs were due to higher material costs resulting primarilyfrom steel related price increases.
Operating Profit TableFourth Quarter
(Millions of dollars) 2004 2003
Machinery(1) . . . . . . . . . . . . . . . . . . . . . . . . . . . . . . . . . $1,384 $1,367Engines(1). . . . . . . . . . . . . . . . . . . . . . . . . . . . . . . . . . . . . 246 70Financial Products . . . . . . . . . . . . . . . . . . . . . . . . . . 105 87Consolidating Adjustments(2). . . . . . . . . . . . . . . (39) (25)______ ______
$1,696 $1,499______ ____________ ______(1) Caterpillar operations are highly integrated; therefore, the company uses a number of alloca-
tions to determine lines of business operating profit for Machinery and Engines.(2) Consolidating adjustments consist of eliminations of transactions between Machinery and
Engines and Financial Products.
Machinery operating profit of $384 million was up $17 million,or 5 percent, from fourth quarter 2003. The favorable impact ofhigher sales volume and improved price realization was mostlyoffset by higher core operating costs (as outlined above), theunfavorable impact of currency and higher retirement benefits.
Engines operating profit of $246 million was up $176 million,or 251 percent, from fourth quarter 2003. The favorable impactof higher sales volume, improved price realization and theabsence of NCPs were partially offset by higher core operatingcosts (as outlined above).
Financial Products operating profit of $105 million was up$18 million, or 21 percent, from fourth quarter 2003. The increasewas primarily due to a favorable impact from the growth of earn-ing assets, partially offset by the impact of lower interest spreadsat Cat Financial.
OTHER PROFIT/LOSS ITEMSOther income/expense was income of $69 million compared withincome of $20 million in fourth quarter 2003, a favorable impactof $49 million. The change was due mainly to the favorableimpact of Machinery and Engines currency gains of $27 millionand a $9 million favorable change in currency exchange gain/lossat Cat Power Ventures.
Also, Caterpillar’s profit and cash flows are subject to fluctua-tion due to changes in foreign exchange rates. The company usescurrency forward and option contracts to reduce the impact ofexchange rate changes. As mentioned above, the result of thisactivity in the fourth quarter on Machinery and Engines otherincome/expense was favorable $27 million. This reduced the netunfavorable impact of currency on profit before tax to $19 million.
The provision for income taxes for both 2003 and 2004 reflects aneffective annual tax rate of 27 percent. In addition, the fourth quar-ter 2004 provision includes a favorable adjustment of $10 mil-lion to recognize the impact of an effective tax rate change from27.5 percent used for the first nine months primarily due to achange in our geographic mix of profits.
The equity in profit/loss of unconsolidated affiliated companiesfavorably impacted profit by $13 million over fourth quarter ayear ago, primarily driven by increased profitability at ShinCaterpillar Mitsubishi Ltd. (SCM). The increase in profitabilityat SCM was driven largely by increased exports.
SUPPLEMENTAL INFORMATIONWe are providing supplemental information including deliveriesto users and dealer inventory levels. We sell the majority of ourmachines and engines to independently owned and operated dealersand OEMs to meet the demands of their customers, the end users.Due to time lags between our sales and the deliveries to end userswe believe this information will help readers better understandour business and the industries we serve. All information pro-vided in the supplemental section is calculated in constant dollars.
Dealer New Machine DeliveriesWorldwide dealer deliveries of new machines to end users increased28 percent in 2004, reaching record levels. Strength was wide-spread, with growth occurring in all regions and in all majorapplications. The worldwide recovery in manufacturing boosteddemand for most commodities. The resulting higher prices andincreased production caused increased deliveries into mining,energy development and forestry. Low interest rates and bettereconomic growth raised construction spending, benefiting deliv-eries into residential and commercial construction.
North American dealers had a record year, delivering 33 per-cent more new machines than in 2003. Deliveries increased intoall major applications as the result of increased activity, betteroutput prices and accelerated depreciation provisions. Dealersincreased deliveries to rental fleets by 40 percent to accommo-date an increased demand for rental machines and a higher rateof deliveries from existing rental fleets.
Deliveries into both North American coal mining and metalsmining more than doubled. Better coal prices and a weaker U.S.dollar caused a 4 percent increase in mine production, the bestyear for production growth since 1994. Metals price increasesranged from 10 to 70 percent and mine production increasedslightly, the first increase in output since 1997. Deliveries intogeneral construction were up 38 percent from 2003. Housingstarts increased to a 1.95 million-unit rate, the highest since 1978.Positives for housing construction were continued low mortgageinterest rates, higher home prices and a significant shift away frommobile homes. Nonresidential construction recovered from a

MANAGEMENT’S DISCUSSION AND ANALYSIS continued
A-44
three year downturn, the result of better profits, increased businesssales and better financing conditions. Dealers delivered 31 percentmore new machines into heavy construction in 2004. Deliveriesinto highway construction increased due to past increases inFederal highway funding, and energy development and explo-ration benefited from higher oil and natural gas prices. Deliveriesinto both sewer and water and site development increased due tomore residential and commercial construction. Increased con-struction raised the demand for quarry products and aggregatesand deliveries into that application increased 26 percent. Theincrease in housing starts drove lumber prices higher and deliv-eries into forestry increased 23 percent.
EAME dealers, benefiting from a strong fourth quarter, increaseddeliveries of new machines 11 percent in 2004. In Europe, wherethe economic recovery was sluggish, deliveries increased 4 per-cent. Positive factors included some recovery in housing in theEuro-zone economies, the result of low interest rates, and increaseddeliveries to rental fleets. Deliveries in AME rose 35 percent. Highercommodity prices led to increased investment in mining and signif-icantly boosted regional income, allowing governments to increaseinfrastructure investment. In the CIS, deliveries increased 2 percent.Better energy and metals prices, along with much higher pro-duction, caused increased investment.
Latin American dealers, enjoying their best year since 1998,delivered 56 percent more new machines than in 2003. Miningdeliveries rose 84 percent, due to higher coal and metals prices plussignificant increases in production. In addition, general economicrecoveries led to increased construction. Most of the increase indeliveries occurred in Chile, Colombia, Argentina and Mexico.
Dealer new machine deliveries in Asia/Pacific increased 26 per-cent. China, where deliveries more than doubled between 2001and 2003, had a 25 percent decline because the governmentimplemented measures to moderate development. Demand inthe rest of the region, however, was extremely strong, particu-larly in mining. Deliveries into Australia increased 41 percentand those into Indonesia more than doubled.
Dealer Inventories of New MachinesWorldwide dealer inventories at the end of 2004 were 38 per-cent higher than at the end of 2003. A good part of that increasewas the normal outcome of rapidly increasing dealer deliveriesto end users – more machines were in transit to dealers or inpreparation for customer delivery. In addition, plants shipped arecord volume of machines in the fourth quarter and dealers didnot always have time to convert late-quarter shipments into cus-tomer deliveries. Worldwide dealer inventories relative to deliv-eries were the same as a year earlier. Dealer inventories in bothNorth America and EAME were slightly lower relative to deliv-eries than at the end of 2003.
Engine Deliveries to End Users and OEMsIn North America, engine deliveries to end users and OEMs wereup 22 percent compared to 2003. Engine deliveries increased innearly all sectors, led by a 35 percent increase in engines deliveredto North American truck and bus manufacturers as higher freighttonnage and improved carrier financial health drove expansionand replacement purchases. Engine deliveries to end users andOEMs in the industrial sector increased 50 percent due to stronger
industry demand driven by near record levels of business invest-ment and increased preference for Caterpillar engines. Deliveriesof engines into the marine sector rose 10 percent from higherdemand for pleasure craft engines. Deliveries of engines into theelectric power and petroleum sectors remained about flat.
In EAME, overall engine deliveries to end users and OEMsrose 22 percent with increases in deliveries to all sectors. ElectricPower deliveries rose 47 percent benefiting from increased demandfor combined heat and power self generation, as well as demandfor Middle East infrastructure support. Petroleum deliveries rose26 percent, as higher energy prices drove increased investmentto expand production. Deliveries into the marine sector increased2 percent, while industrial deliveries declined 5 percent.
Deliveries to end users and OEMs in Latin America increased2 percent compared to 2003. An improved investment climatedrove increases in most sectors, led by a 14 percent increase inpetroleum deliveries resulting from investment in pipeline activ-ity. Electric power deliveries declined 33 percent driven by theabsence of a large turbine project that occurred during 2003.
Deliveries to end users and OEMs in Asia/Pacific were up47 percent compared to 2003. Engine deliveries into the electricpower sector increased 80 percent due to widespread increases indemand for prime power and standby products, primarily drivenby transmission constraints and increased business investmentfrom strong economic growth. Asia/Pacific deliveries of enginesinto the petroleum sector rose 28 percent driven primarily byincreased demand for turbines and turbine related services tosupport growth in exploration and production. Deliveries intothe marine sector increased 39 percent as competitive shipyardrates drove demand for oceangoing vessels, and deliveriesincreased for pleasure craft and offshore supply boats.
Dealer Inventories of EnginesWorldwide dealer engine inventories at the end of 2004 wereapproximately 32 percent above year-end 2003 levels, and wereabove selling rate increases primarily due to higher in-transitinventories awaiting delivery. Inventory increased in most regionsrelative to selling rates, while North America held flat with strongdeliveries in most sectors. Asia/Pacific dealer inventories contin-ued to increase slightly faster than selling rates, due to in-processdeliveries to support higher electric power and marine demand,as well as some continued delay in deliveries to electric poweropportunity in China. EAME dealer inventories increased aboveselling rates, driven by higher in-transit inventory and higherdelivery lead times associated with complex projects, as well assome addition of inventory by dealers to serve growing demandfor small standby and large prime generator sets.
2003 COMPARED WITH 2002
Caterpillar had an excellent year in 2003. We took full advantageof the recovering capital goods market to make real progress onour growth objectives while continuing to lower core operatingcosts. With a 13 percent sales and revenue increase this year, weare well on our way to achieving our growth target of $30 billionof sales and revenues in this decade. Our performance this yeardemonstrated to investors our commitment to deliver long-termprofitable growth. In addition, we made significant progress on
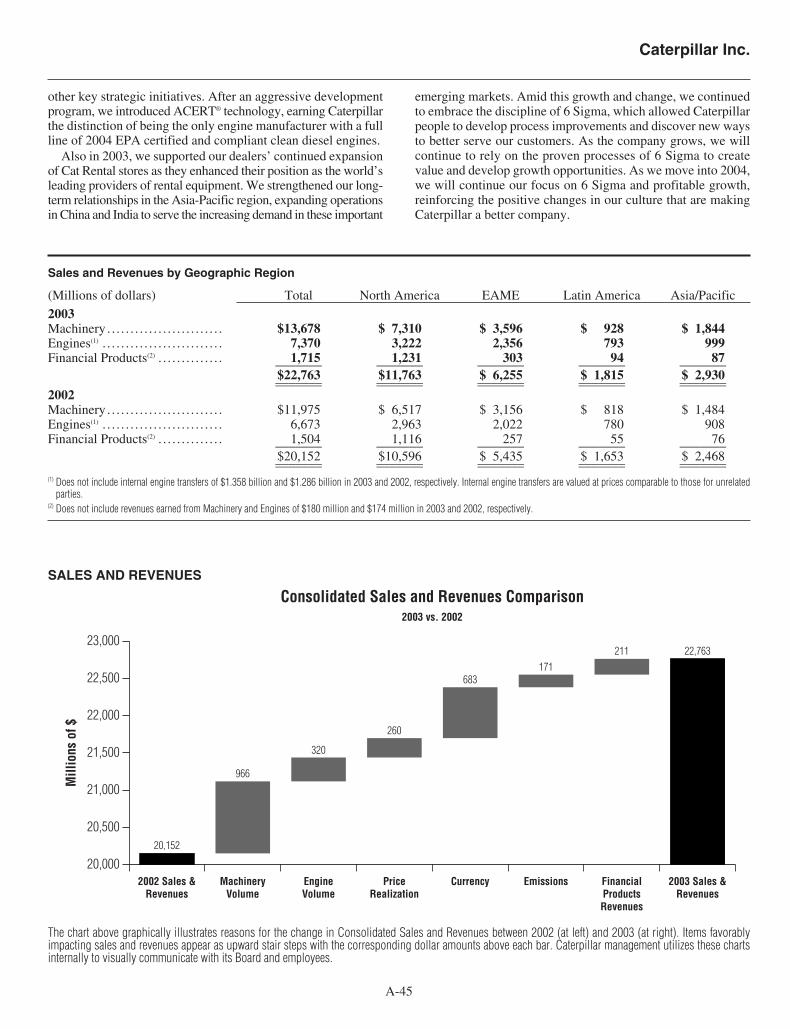
Caterpillar Inc.
A-45
Sales and Revenues by Geographic Region
(Millions of dollars) Total North America EAME Latin America Asia/Pacific
2003Machinery . . . . . . . . . . . . . . . . . . . . . . . . . $13,678 $ 7,310 $ 3,596 $ 928 $ 1,844Engines(1) . . . . . . . . . . . . . . . . . . . . . . . . . . 7,370 3,222 2,356 793 999Financial Products(2) . . . . . . . . . . . . . . 1,715 1,231 303 94 87_______ _______ _______ _______ _______
$22,763 $11,763 $ 6,255 $ 1,815 $ 2,930_______ _______ _______ _______ ______________ _______ _______ _______ _______2002Machinery . . . . . . . . . . . . . . . . . . . . . . . . . $11,975 $ 6,517 $ 3,156 $ 818 $ 1,484Engines(1) . . . . . . . . . . . . . . . . . . . . . . . . . . 6,673 2,963 2,022 780 908Financial Products(2) . . . . . . . . . . . . . . 1,504 1,116 257 55 76_______ _______ _______ _______ _______
$20,152 $10,596 $ 5,435 $ 1,653 $ 2,468_______ _______ _______ _______ ______________ _______ _______ _______ _______(1) Does not include internal engine transfers of $1.358 billion and $1.286 billion in 2003 and 2002, respectively. Internal engine transfers are valued at prices comparable to those for unrelated
parties.(2) Does not include revenues earned from Machinery and Engines of $180 million and $174 million in 2003 and 2002, respectively.
other key strategic initiatives. After an aggressive developmentprogram, we introduced ACERT® technology, earning Caterpillarthe distinction of being the only engine manufacturer with a fullline of 2004 EPA certified and compliant clean diesel engines.
Also in 2003, we supported our dealers’ continued expansionof Cat Rental stores as they enhanced their position as the world’sleading providers of rental equipment. We strengthened our long-term relationships in the Asia-Pacific region, expanding operationsin China and India to serve the increasing demand in these important
emerging markets. Amid this growth and change, we continuedto embrace the discipline of 6 Sigma, which allowed Caterpillarpeople to develop process improvements and discover new waysto better serve our customers. As the company grows, we willcontinue to rely on the proven processes of 6 Sigma to createvalue and develop growth opportunities. As we move into 2004,we will continue our focus on 6 Sigma and profitable growth,reinforcing the positive changes in our culture that are makingCaterpillar a better company.
SALES AND REVENUES
The chart above graphically illustrates reasons for the change in Consolidated Sales and Revenues between 2002 (at left) and 2003 (at right). Items favorablyimpacting sales and revenues appear as upward stair steps with the corresponding dollar amounts above each bar. Caterpillar management utilizes these chartsinternally to visually communicate with its Board and employees.
20,000
20,500
21,000
21,500
22,000
22,500
23,000
Mill
ions
of $
2002 Sales &Revenues
MachineryVolume
EngineVolume
PriceRealization
Currency Emissions FinancialProductsRevenues
2003 Sales &Revenues
20,152
966
320
260
683171
211 22,763
Consolidated Sales and Revenues Comparison2003 vs. 2002
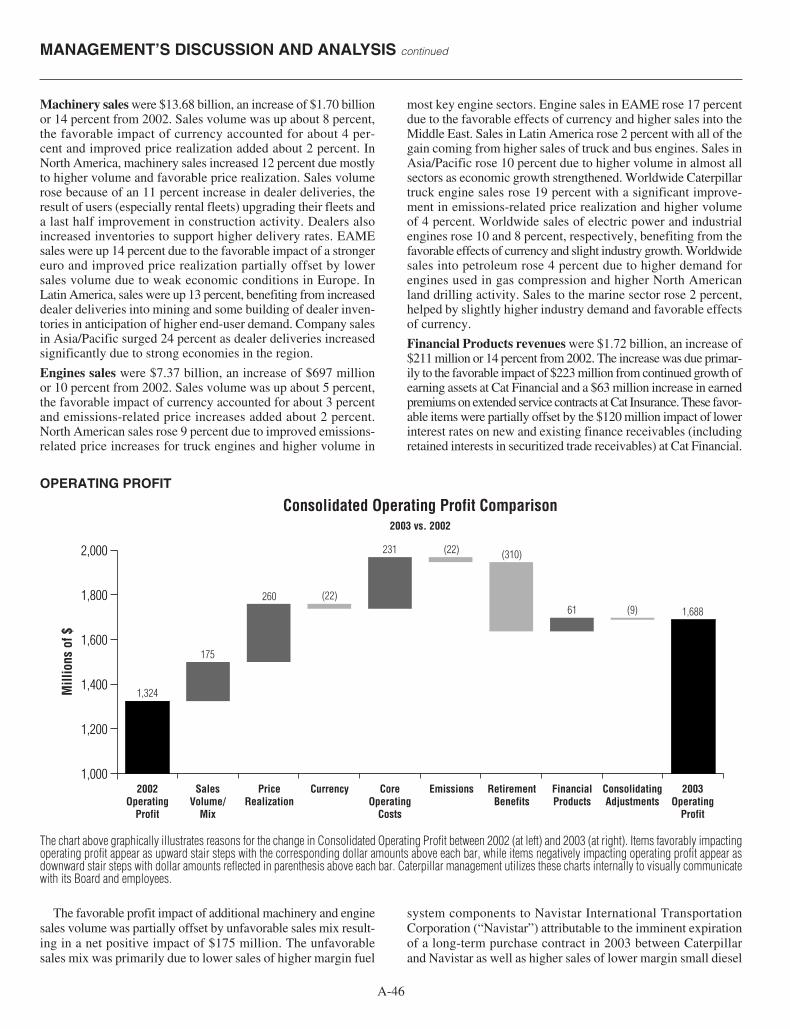
MANAGEMENT’S DISCUSSION AND ANALYSIS continued
A-46
Machinery sales were $13.68 billion, an increase of $1.70 billionor 14 percent from 2002. Sales volume was up about 8 percent,the favorable impact of currency accounted for about 4 per-cent and improved price realization added about 2 percent. InNorth America, machinery sales increased 12 percent due mostlyto higher volume and favorable price realization. Sales volumerose because of an 11 percent increase in dealer deliveries, theresult of users (especially rental fleets) upgrading their fleets anda last half improvement in construction activity. Dealers alsoincreased inventories to support higher delivery rates. EAMEsales were up 14 percent due to the favorable impact of a strongereuro and improved price realization partially offset by lowersales volume due to weak economic conditions in Europe. InLatin America, sales were up 13 percent, benefiting from increaseddealer deliveries into mining and some building of dealer inven-tories in anticipation of higher end-user demand. Company salesin Asia/Pacific surged 24 percent as dealer deliveries increasedsignificantly due to strong economies in the region.
Engines sales were $7.37 billion, an increase of $697 millionor 10 percent from 2002. Sales volume was up about 5 percent,the favorable impact of currency accounted for about 3 percentand emissions-related price increases added about 2 percent.North American sales rose 9 percent due to improved emissions-related price increases for truck engines and higher volume in
most key engine sectors. Engine sales in EAME rose 17 percentdue to the favorable effects of currency and higher sales into theMiddle East. Sales in Latin America rose 2 percent with all of thegain coming from higher sales of truck and bus engines. Sales inAsia/Pacific rose 10 percent due to higher volume in almost allsectors as economic growth strengthened. Worldwide Caterpillartruck engine sales rose 19 percent with a significant improve-ment in emissions-related price realization and higher volumeof 4 percent. Worldwide sales of electric power and industrialengines rose 10 and 8 percent, respectively, benefiting from thefavorable effects of currency and slight industry growth. Worldwidesales into petroleum rose 4 percent due to higher demand forengines used in gas compression and higher North Americanland drilling activity. Sales to the marine sector rose 2 percent,helped by slightly higher industry demand and favorable effectsof currency.
Financial Products revenues were $1.72 billion, an increase of$211 million or 14 percent from 2002. The increase was due primar-ily to the favorable impact of $223 million from continued growth ofearning assets at Cat Financial and a $63 million increase in earnedpremiums on extended service contracts at Cat Insurance. These favor-able items were partially offset by the $120 million impact of lowerinterest rates on new and existing finance receivables (includingretained interests in securitized trade receivables) at Cat Financial.
OPERATING PROFIT
The chart above graphically illustrates reasons for the change in Consolidated Operating Profit between 2002 (at left) and 2003 (at right). Items favorably impactingoperating profit appear as upward stair steps with the corresponding dollar amounts above each bar, while items negatively impacting operating profit appear asdownward stair steps with dollar amounts reflected in parenthesis above each bar. Caterpillar management utilizes these charts internally to visually communicatewith its Board and employees.
Mill
ions
of $
2002Operating
Profit
1,324
SalesVolume/
Mix
175
PriceRealization
260
Currency
(22)
CoreOperating
Costs
231
Emissions
(22)
RetirementBenefits
(310)
FinancialProducts
61
ConsolidatingAdjustments
(9)
2003Operating
Profit
1,688
Consolidated Operating Profit Comparison2003 vs. 2002
1,000
1,200
1,400
1,600
1,800
2,000
The favorable profit impact of additional machinery and enginesales volume was partially offset by unfavorable sales mix result-ing in a net positive impact of $175 million. The unfavorablesales mix was primarily due to lower sales of higher margin fuel
system components to Navistar International TransportationCorporation (“Navistar”) attributable to the imminent expirationof a long-term purchase contract in 2003 between Caterpillarand Navistar as well as higher sales of lower margin small diesel
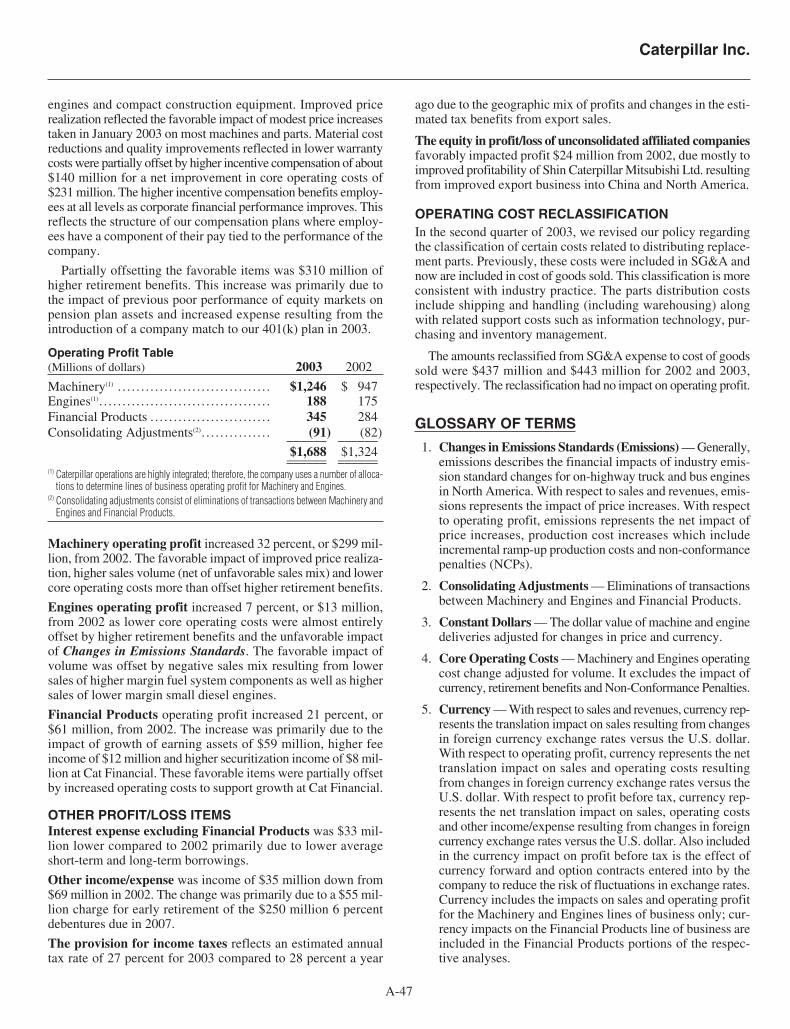
Caterpillar Inc.
A-47
engines and compact construction equipment. Improved pricerealization reflected the favorable impact of modest price increasestaken in January 2003 on most machines and parts. Material costreductions and quality improvements reflected in lower warrantycosts were partially offset by higher incentive compensation of about$140 million for a net improvement in core operating costs of$231 million. The higher incentive compensation benefits employ-ees at all levels as corporate financial performance improves. Thisreflects the structure of our compensation plans where employ-ees have a component of their pay tied to the performance of thecompany.
Partially offsetting the favorable items was $310 million ofhigher retirement benefits. This increase was primarily due tothe impact of previous poor performance of equity markets onpension plan assets and increased expense resulting from theintroduction of a company match to our 401(k) plan in 2003.
Operating Profit Table(Millions of dollars) 2003 2002
Machinery(1) . . . . . . . . . . . . . . . . . . . . . . . . . . . . . . . . . $1,246 $1,947Engines(1). . . . . . . . . . . . . . . . . . . . . . . . . . . . . . . . . . . . . 188 175Financial Products . . . . . . . . . . . . . . . . . . . . . . . . . . 345 284Consolidating Adjustments(2). . . . . . . . . . . . . . . (91) (82)______ ______
$1,688 $1,324______ ____________ ______(1) Caterpillar operations are highly integrated; therefore, the company uses a number of alloca-
tions to determine lines of business operating profit for Machinery and Engines.(2) Consolidating adjustments consist of eliminations of transactions between Machinery and
Engines and Financial Products.
Machinery operating profit increased 32 percent, or $299 mil-lion, from 2002. The favorable impact of improved price realiza-tion, higher sales volume (net of unfavorable sales mix) and lowercore operating costs more than offset higher retirement benefits.
Engines operating profit increased 7 percent, or $13 million,from 2002 as lower core operating costs were almost entirelyoffset by higher retirement benefits and the unfavorable impactof Changes in Emissions Standards. The favorable impact ofvolume was offset by negative sales mix resulting from lowersales of higher margin fuel system components as well as highersales of lower margin small diesel engines.
Financial Products operating profit increased 21 percent, or$61 million, from 2002. The increase was primarily due to theimpact of growth of earning assets of $59 million, higher feeincome of $12 million and higher securitization income of $8 mil-lion at Cat Financial. These favorable items were partially offsetby increased operating costs to support growth at Cat Financial.
OTHER PROFIT/LOSS ITEMSInterest expense excluding Financial Products was $33 mil-lion lower compared to 2002 primarily due to lower averageshort-term and long-term borrowings.
Other income/expense was income of $35 million down from$69 million in 2002. The change was primarily due to a $55 mil-lion charge for early retirement of the $250 million 6 percentdebentures due in 2007.
The provision for income taxes reflects an estimated annualtax rate of 27 percent for 2003 compared to 28 percent a year
ago due to the geographic mix of profits and changes in the esti-mated tax benefits from export sales.
The equity in profit/loss of unconsolidated affiliated companiesfavorably impacted profit $24 million from 2002, due mostly toimproved profitability of Shin Caterpillar Mitsubishi Ltd. resultingfrom improved export business into China and North America.
OPERATING COST RECLASSIFICATIONIn the second quarter of 2003, we revised our policy regardingthe classification of certain costs related to distributing replace-ment parts. Previously, these costs were included in SG&A andnow are included in cost of goods sold. This classification is moreconsistent with industry practice. The parts distribution costsinclude shipping and handling (including warehousing) alongwith related support costs such as information technology, pur-chasing and inventory management.
The amounts reclassified from SG&A expense to cost of goodssold were $437 million and $443 million for 2002 and 2003,respectively. The reclassification had no impact on operating profit.
GLOSSARY OF TERMS
1. Changes in Emissions Standards (Emissions) — Generally,emissions describes the financial impacts of industry emis-sion standard changes for on-highway truck and bus enginesin North America. With respect to sales and revenues, emis-sions represents the impact of price increases. With respectto operating profit, emissions represents the net impact ofprice increases, production cost increases which includeincremental ramp-up production costs and non-conformancepenalties (NCPs).
2. Consolidating Adjustments — Eliminations of transactionsbetween Machinery and Engines and Financial Products.
3. Constant Dollars — The dollar value of machine and enginedeliveries adjusted for changes in price and currency.
4. Core Operating Costs — Machinery and Engines operatingcost change adjusted for volume. It excludes the impact ofcurrency, retirement benefits and Non-Conformance Penalties.
5. Currency — With respect to sales and revenues, currency rep-resents the translation impact on sales resulting from changesin foreign currency exchange rates versus the U.S. dollar.With respect to operating profit, currency represents the nettranslation impact on sales and operating costs resultingfrom changes in foreign currency exchange rates versus theU.S. dollar. With respect to profit before tax, currency rep-resents the net translation impact on sales, operating costsand other income/expense resulting from changes in foreigncurrency exchange rates versus the U.S. dollar. Also includedin the currency impact on profit before tax is the effect ofcurrency forward and option contracts entered into by thecompany to reduce the risk of fluctuations in exchange rates.Currency includes the impacts on sales and operating profitfor the Machinery and Engines lines of business only; cur-rency impacts on the Financial Products line of business areincluded in the Financial Products portions of the respec-tive analyses.

MANAGEMENT’S DISCUSSION AND ANALYSIS continued
A-48
6. EAME — Geographic region including Europe, Africa, theMiddle East and the Commonwealth of Independent States(CIS).
7. Earning Assets — These assets consist primarily of total netfinance receivables plus retained interests in securitized tradereceivables, plus equipment on operating leases, less accu-mulated depreciation at Cat Financial. Net finance receiv-ables represent the gross receivables amount less unearnedincome and the allowance for credit losses.
8. Latin America — Geographic region including the Centraland South American countries and Mexico.
9. Machinery and Engines — Due to the highly integratednature of operations, represents the aggregate total of theMachinery and Engines lines of business and includes pri-marily our manufacturing, marketing and parts distributionoperations.
10. Non-Conformance Penalties (NCPs) — Pursuant to a con-sent decree Caterpillar and other engine manufacturers enteredinto with the United States Environmental Protection Agency(EPA), the company was required to meet certain emissionstandards by October 2002 for engines manufactured foron-highway use. Under the consent decree, an engine man-ufacturer was required to pay a non-conformance penalty(NCP) to the EPA for each engine manufactured afterOctober 1, 2002 that did not meet the standards. The amountof the NCP was based on how close to meeting the stan-dards the engine came — the more the engine was out ofcompliance, the higher the penalty per engine.
11. Price Realization — The impact of net price changes exclud-ing currency.
12. Retirement Benefits — Cost of defined benefit pensionplans, defined contribution plans and retirement health careand life insurance.
13. Sales Volume — With respect to sales and revenues, salesvolume represents the impact of changes in the quantitiessold for machines, engines and parts. With respect to oper-ating profit, sales volume represents the impact of changesin the quantities sold for machines, engines and parts com-bined with the net operating profit impact of changes in therelative weighting of machines, engines and parts sales withrespect to total sales.
14. Sales Volume/Mix — The net operating profit impact ofchanges in the quantities sold for machines, engines and partscombined with the net operating profit impact of changesin the relative weighting of machines, engines and parts saleswith respect to total sales.
15. 6 Sigma — On a technical level, 6 Sigma represents a measureof variation that achieves 3.4 defects per million opportunities.At Caterpillar, 6 Sigma represents a much broader culturalphilosophy to drive continuous improvement throughout thevalue chain. It is a fact-based, data-driven methodology thatwe are using to improve processes, enhance quality, cut costs,grow our business and deliver greater value to our customersthrough Black Belt-led project teams. At Caterpillar, 6 Sigmagoes beyond mere process improvement; it has become theway we work as teams to process business information,solve problems and manage our business successfully.
LIQUIDITY & CAPITAL RESOURCES
Reclassification of certain receivables and related cash flows
A. Consolidated financial position
Our Machinery and Engines operations generate trade receivablesfrom the sale of inventory to dealers and customers. Certain ofthese receivables are sold to Cat Financial. Cat Financial holdsthe receivables and periodically securitizes a portion of the dealerreceivables using a revolving securitization structure. Cat Financial’sportion of the securitized trade receivables is represented by cer-tificated retained interests. Cat Financial also generates whole-sale inventory receivables from its direct financing of inventorypurchases by dealers. Previously, the certificated retained inter-ests as well as the wholesale inventory receivables were classi-fied as Finance Receivables in our Consolidated FinancialPosition. In the fourth quarter of 2004, we reclassified the cer-tificated retained interests from Finance Receivables to RetainedInterests in Securitized Trade Receivables and the wholesaleinventory receivables from Finance Receivables to Trade andOther Receivables in our Consolidated Financial Position. Thesechanges were made to align the financial position with the cashflow changes discussed below.
B. Consolidated statement of cash flow
During the fourth quarter of 2004, the staff of the Securities andExchange Commission expressed concern regarding the classi-fications of certain cash flows by companies with captive financesubsidiaries. As a result of this concern, management decided tomake reclassifications to the 2002 and 2003 Consolidated State-ments of Cash Flow as described below.
Securitized trade receivables
Previously, we reported an increase in cash flow from operatingactivities in the Consolidated Statement of Cash Flow whenMachinery and Engines sold receivables to Cat Financial thatwere subsequently securitized. Concurrently, Cat Financial’sentire purchase of these receivables was included in Additionsto Finance Receivables (investing activity) in the ConsolidatedStatement of Cash Flow. The receivables were immediately secu-ritized and the portion sold to a third party was included in Proceedsfrom Sale of Finance Receivables (investing activity) in theConsolidated Statement of Cash Flow. Subsequently, collectionof the certificated retained interests was included in Collectionof Finance Receivables (investing activity) in the ConsolidatedStatement of Cash Flow. This cash flow treatment followed ourprincipal lines of business reporting, however, when we reportedan increase in cash flow from operating activities and a corre-sponding outflow from investing activities there was no increasein cash on a consolidated basis from the sale of inventory to ourdealers and customers.
In the fourth quarter of 2004, we made a reclassification toeliminate the offsetting non-cash intercompany transactions inthe Consolidated Statement of Cash Flow. In addition, we reclas-sified the proceeds from sale of trade receivables to operatingactivities. The reclassification properly classifies cash receiptsfrom the sale of inventory as operating activities and reflects thatthese cash flows, although held and managed by Cat Financial,arise from our sale of Machinery and Engines inventory.

The securitization structure mentioned above involves a secu-ritization trust. During 2003 and 2002, the trust was a qualify-ing special purpose entity (QSPE) and thus, in accordance withStatement of Financial Accounting Standards No. 140 (SFAS 140),“Accounting for Transfers and Servicing of Financial Assets andExtinguishment of Liabilities,” was not consolidated. Whenreceivables were placed into the trust, we received cash for theportion sold to third party purchasers and the portion retainedby Cat Financial was represented by certificated retained inter-ests. Placing receivables into a securitization trust changes theirnature and the receipt of certificated retained interests is con-sidered a non-cash transaction. We have noted this non-cash trans-action on the Consolidated Statement of Cash Flow and quantifiedthe receivables decrease resulting from this transaction and thusexcluded from operating activities. This reflects that certificatedretained interests, not cash, were received for these sales. The cer-tificated retained interests are considered held-to-maturity secu-rities as defined by Statement of Financial Accounting StandardsNo. 115 (SFAS 115), “Accounting for Certain Investments inDebt and Equity Securities.” SFAS 115 requires that collectionof held-to-maturity securities be classified as an investing activity.We have therefore reclassified the collection of the certificatedretained interests from Collection of Finance Receivables toCollections of Retained Interests in Securitized Trade Receivableswithin the investing activities section of the Consolidated State-ment of Cash Flow. The impact of these changes is a significantreduction to cash flow from operating activities and a signifi-cant increase in cash flow from investing activities. This reflectsthat although inventory was sold, the nature of the receivable
was changed to a security. The subsequent collection of thatsecurity is shown as an investing activity.
Wholesale inventory receivables
Previously, we reported an increase in cash flow from operatingactivities when a dealer remitted payment for a trade receivablethat was subsequently financed with the issuance of a wholesaleinventory receivable by Cat Financial. The issuance of a wholesaleinventory receivable by Cat Financial was reported as an Additionto Finance Receivables in the Consolidated Statement of CashFlow and the subsequent collection was reported as a Collectionof Finance Receivables. Similar to securitized receivables, thiscash flow treatment followed our principal lines of businessreporting, however, when we reported an increase in cash flowfrom operating activities and a corresponding outflow from invest-ing activities there was no increase in cash on a consolidatedbasis from the sale of inventory to our dealers and customers.We therefore eliminated the offsetting non-cash transaction inthe Consolidated Statement of Cash Flow. In addition, we reclas-sified the collection of wholesale inventory receivables to oper-ating activities. The reclassification properly classifies cashreceipts from the sale of inventory as operating activities andreflects that these cash flows, although held and managed by CatFinancial, arise from our sale of Machinery and Engines inventory.
These reclassifications had no impact on the Increase in Cashand Short-term Investments on the Statement of ConsolidatedCash Flow.
Prior amounts reported have been reclassified to conform tothis presentation as follows:
Caterpillar Inc.
A-49
2003 2002______________________________ ______________________________Previous As Previous As
(Millions of dollars) classification(1) Change Reclassified classification(1) Change Reclassified__________ _______ ________ __________ _______ ________Consolidated Financial Position — Statement 3
Receivables — trade and other . . . . . . . . . . . . . . . . . . . . . . . . . . . . . . . $ 3,666 $ 359 $ 4,025 $ 2,838 $ 354 $ 3,192Receivables — finance . . . . . . . . . . . . . . . . . . . . . . . . . . . . . . . . . . . . . . . . 7,417 (1,909) 5,508 6,565 (1,499) 5,066Retained interests in securitized trade receivables . . . . . . . . . . . — 1,550 1,550 — 1,145 1,145Long-term receivables — trade and other . . . . . . . . . . . . . . . . . . . 82 428 510 66 367 433Long-term receivables — finance . . . . . . . . . . . . . . . . . . . . . . . . . . . . 7,822 (428) 7,394 6,714 (367) 6,347
Consolidated Statement of Cash Flow — Statement 4Receivables — trade and other . . . . . . . . . . . . . . . . . . . . . . . . . . . . . . . $ (438) $ (7,677) $ (8,115) $ 5 $ (6,328) $ (6,323)Net cash provided by (used for)
operating activities ........ . . . . . . . . . . . . . . . . . . 2,066 (7,677) (5,611) 2,366 (6,328) (3,962)Additions to finance receivables . . . . . . . . . . . . . . . . . . . . . . . . . . . . . . (17,146) 10,278 (6,868) (15,338) 9,405 (5,933)Collections of finance receivables . . . . . . . . . . . . . . . . . . . . . . . . . . . . 13,882 (8,631) 5,251 11,866 (7,297) 4,569Proceeds from sale of finance receivables. . . . . . . . . . . . . . . . . . . . 1,760 (1,099) 661 2,310 (1,697) 613Collections of retained interests in securitized
trade receivables. . . . . . . . . . . . . . . . . . . . . . . . . . . . . . . . . . . . . . . . . . . — 7,129 7,129 — 5,917 5,917Net cash provided by (used for)
investing activities ........ . . . . . . . . . . . . . . . . . . (2,793) 7,677 4,884 (2,708) 6,328 3,620(1) Certain amounts do not agree to prior period reported amounts due to unrelated reclassifications.
Sources of fundsWe generate our capital resources primarily through operationsand collections of certificated retained interests in trade receivables(discussed above). Collections of certificated retained intereststake place when the securitization trust collects cash and distributesit to Cat Financial. In 2004, operating cash flow was negative$3.99 billion and collections of certificated retained interests intrade receivables were $5.72 billion totaling positive $1.73 bil-lion. In 2003, operating cash flow was negative $5.61 billion and
collections of certificated retained interests in trade receivableswere $7.13 billion totaling positive $1.52 billion. The increasein the total of these sources of funds from $1.52 billion in 2003 to$1.73 billion in 2004 is primarily the result of higher profitabilityin 2004 as compared to 2003, largely offset by an increase inworking capital requirements. The decrease in collections of cer-tificated retained interests from 2003 to 2004 of $1.41 billionreflects that the securitization trust was a QSPE (and thus notconsolidated) for all of 2003 compared with eight months of
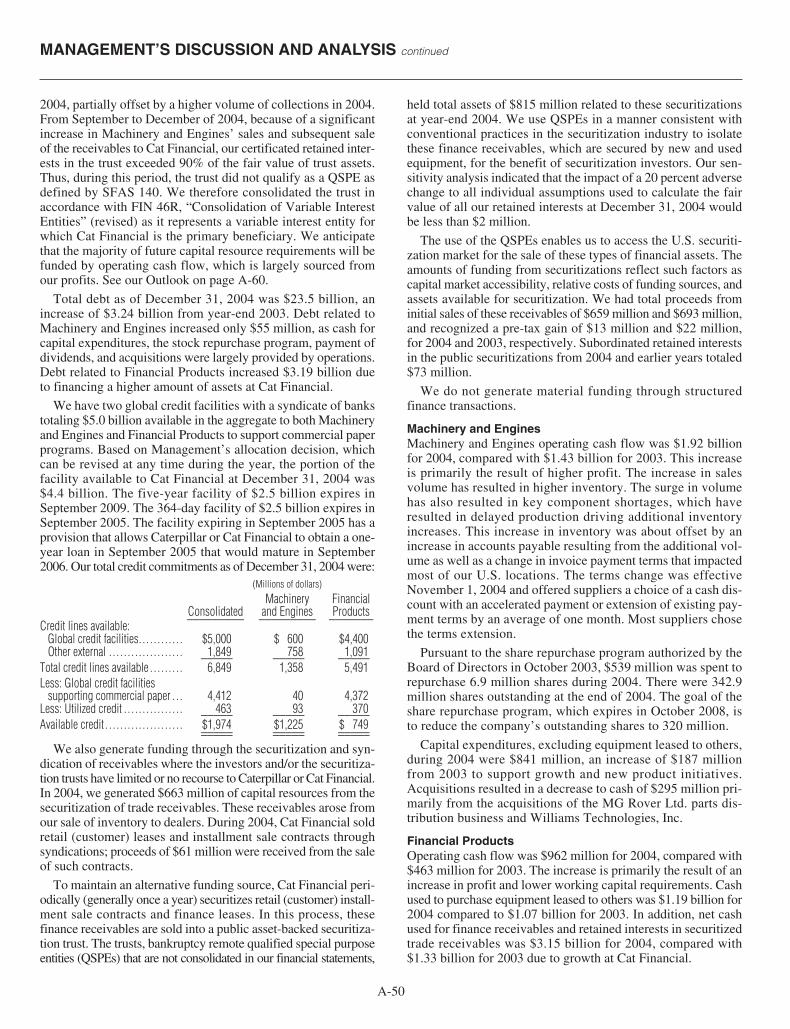
MANAGEMENT’S DISCUSSION AND ANALYSIS continued
A-50
2004, partially offset by a higher volume of collections in 2004.From September to December of 2004, because of a significantincrease in Machinery and Engines’ sales and subsequent saleof the receivables to Cat Financial, our certificated retained inter-ests in the trust exceeded 90% of the fair value of trust assets.Thus, during this period, the trust did not qualify as a QSPE asdefined by SFAS 140. We therefore consolidated the trust inaccordance with FIN 46R, “Consolidation of Variable InterestEntities” (revised) as it represents a variable interest entity forwhich Cat Financial is the primary beneficiary. We anticipatethat the majority of future capital resource requirements will befunded by operating cash flow, which is largely sourced fromour profits. See our Outlook on page A-60.
Total debt as of December 31, 2004 was $23.5 billion, anincrease of $3.24 billion from year-end 2003. Debt related toMachinery and Engines increased only $55 million, as cash forcapital expenditures, the stock repurchase program, payment ofdividends, and acquisitions were largely provided by operations.Debt related to Financial Products increased $3.19 billion dueto financing a higher amount of assets at Cat Financial.
We have two global credit facilities with a syndicate of bankstotaling $5.0 billion available in the aggregate to both Machineryand Engines and Financial Products to support commercial paperprograms. Based on Management’s allocation decision, whichcan be revised at any time during the year, the portion of thefacility available to Cat Financial at December 31, 2004 was$4.4 billion. The five-year facility of $2.5 billion expires inSeptember 2009. The 364-day facility of $2.5 billion expires inSeptember 2005. The facility expiring in September 2005 has aprovision that allows Caterpillar or Cat Financial to obtain a one-year loan in September 2005 that would mature in September2006. Our total credit commitments as of December 31, 2004 were:
(Millions of dollars)
Machinery FinancialConsolidated and Engines Products_________ _________ _______
Credit lines available:Global credit facilities. . . . . . . . . . . . $5,000 $ 600 $4,400Other external . . . . . . . . . . . . . . . . . . . . 1,849 758 1,091_____ _____ _____
Total credit lines available . . . . . . . . . 6,849 1,358 5,491Less: Global credit facilities
supporting commercial paper . . . 4,412 40 4,372Less: Utilized credit . . . . . . . . . . . . . . . . 463 93 370_____ _____ _____Available credit . . . . . . . . . . . . . . . . . . . . . $1,974 $1,225 $ 749_____ _____ __________ _____ _____
We also generate funding through the securitization and syn-dication of receivables where the investors and/or the securitiza-tion trusts have limited or no recourse to Caterpillar or Cat Financial.In 2004, we generated $663 million of capital resources from thesecuritization of trade receivables. These receivables arose fromour sale of inventory to dealers. During 2004, Cat Financial soldretail (customer) leases and installment sale contracts throughsyndications; proceeds of $61 million were received from the saleof such contracts.
To maintain an alternative funding source, Cat Financial peri-odically (generally once a year) securitizes retail (customer) install-ment sale contracts and finance leases. In this process, thesefinance receivables are sold into a public asset-backed securitiza-tion trust. The trusts, bankruptcy remote qualified special purposeentities (QSPEs) that are not consolidated in our financial statements,
held total assets of $815 million related to these securitizationsat year-end 2004. We use QSPEs in a manner consistent withconventional practices in the securitization industry to isolatethese finance receivables, which are secured by new and usedequipment, for the benefit of securitization investors. Our sen-sitivity analysis indicated that the impact of a 20 percent adversechange to all individual assumptions used to calculate the fairvalue of all our retained interests at December 31, 2004 wouldbe less than $2 million.
The use of the QSPEs enables us to access the U.S. securiti-zation market for the sale of these types of financial assets. Theamounts of funding from securitizations reflect such factors ascapital market accessibility, relative costs of funding sources, andassets available for securitization. We had total proceeds frominitial sales of these receivables of $659 million and $693 million,and recognized a pre-tax gain of $13 million and $22 million,for 2004 and 2003, respectively. Subordinated retained interestsin the public securitizations from 2004 and earlier years totaled$73 million.
We do not generate material funding through structuredfinance transactions.
Machinery and EnginesMachinery and Engines operating cash flow was $1.92 billionfor 2004, compared with $1.43 billion for 2003. This increaseis primarily the result of higher profit. The increase in salesvolume has resulted in higher inventory. The surge in volumehas also resulted in key component shortages, which haveresulted in delayed production driving additional inventoryincreases. This increase in inventory was about offset by anincrease in accounts payable resulting from the additional vol-ume as well as a change in invoice payment terms that impactedmost of our U.S. locations. The terms change was effectiveNovember 1, 2004 and offered suppliers a choice of a cash dis-count with an accelerated payment or extension of existing pay-ment terms by an average of one month. Most suppliers chosethe terms extension.
Pursuant to the share repurchase program authorized by theBoard of Directors in October 2003, $539 million was spent torepurchase 6.9 million shares during 2004. There were 342.9million shares outstanding at the end of 2004. The goal of theshare repurchase program, which expires in October 2008, isto reduce the company’s outstanding shares to 320 million.
Capital expenditures, excluding equipment leased to others,during 2004 were $841 million, an increase of $187 millionfrom 2003 to support growth and new product initiatives.Acquisitions resulted in a decrease to cash of $295 million pri-marily from the acquisitions of the MG Rover Ltd. parts dis-tribution business and Williams Technologies, Inc.
Financial ProductsOperating cash flow was $962 million for 2004, compared with$463 million for 2003. The increase is primarily the result of anincrease in profit and lower working capital requirements. Cashused to purchase equipment leased to others was $1.19 billion for2004 compared to $1.07 billion for 2003. In addition, net cashused for finance receivables and retained interests in securitizedtrade receivables was $3.15 billion for 2004, compared with$1.33 billion for 2003 due to growth at Cat Financial.

Caterpillar Inc.
A-51
Contractual obligationsThe company has committed cash outflow related to long-term debt, operating lease agreements, purchase obligations and other con-tractual obligations. Minimum payments for these long-term obligations are:
After(Millions of dollars) 2005 2006 2007 2008 2009 2009 Total_____ _____ _____ _____ _____ ______ ______Long-term debt:
Machinery and Engines . . . . . . . . . . . . . . . . . . . . . . . . . . . . . . . . . . . . . . . . . . . . . . . . . . . . . . . . . . . $ 6 $ 290 $ 297 $ 26 $ 363 $ 2,022 $ 3,004Financial Products . . . . . . . . . . . . . . . . . . . . . . . . . . . . . . . . . . . . . . . . . . . . . . . . . . . . . . . . . . . . . . . . 3,525 4,137 2,567 1,134 3,103 1,233 15,699______ _____ _____ _____ _____ ______ ______
Total long-term debt . . . . . . . . . . . . . . . . . . . . . . . . . . . . . . . . . . . . . . . . . . . . . . . . . . . . . . . . . . . . 3,531 4,427 2,864 1,160 3,466 3,255 18,703Capital leases. . . . . . . . . . . . . . . . . . . . . . . . . . . . . . . . . . . . . . . . . . . . . . . . . . . . . . . . . . . . . . . . . . . . . . . . 32 31 30 30 31 918 1,072Operating leases. . . . . . . . . . . . . . . . . . . . . . . . . . . . . . . . . . . . . . . . . . . . . . . . . . . . . . . . . . . . . . . . . . . . . 163 132 90 69 59 384 897Postretirement obligations(1) . . . . . . . . . . . . . . . . . . . . . . . . . . . . . . . . . . . . . . . . . . . . . . . . . . . . . . . . 530 510 770 530 540 2,550 5,430Purchase obligations:
Accounts payable(2) . . . . . . . . . . . . . . . . . . . . . . . . . . . . . . . . . . . . . . . . . . . . . . . . . . . . . . . . . . . . . . . . 3,990 — — — — — 3,990Purchase orders(3) . . . . . . . . . . . . . . . . . . . . . . . . . . . . . . . . . . . . . . . . . . . . . . . . . . . . . . . . . . . . . . . . . 3,954 — — — — — 3,954Other contractual obligations(4) . . . . . . . . . . . . . . . . . . . . . . . . . . . . . . . . . . . . . . . . . . . . . . . . . . . 121 121 101 3 1 468 815______ _____ _____ _____ _____ ______ ______
Total purchase obligations . . . . . . . . . . . . . . . . . . . . . . . . . . . . . . . . . . . . . . . . . . . . . . . . . . . . . 8,065 121 101 3 1 468 8,759Other long-term liabilities(5) . . . . . . . . . . . . . . . . . . . . . . . . . . . . . . . . . . . . . . . . . . . . . . . . . . . . . . . . . 156 134 87 62 37 73 549Interest on long-term debt(6). . . . . . . . . . . . . . . . . . . . . . . . . . . . . . . . . . . . . . . . . . . . . . . . . . . . . . . . . 599 471 366 303 245 4,140 6,124______ _____ _____ _____ _____ _____ ______Total contractual obligations . . . . . . . . . . . . . . . . . . . . . . . . . . . . . . . . . . . . . . . . . . . . . . . . . . . . . . . $13,076 $ 5,826 $ 4,308 $2,157 $ 4,379 $11,788 $41,534______ _____ _____ _____ _____ ______ ____________ _____ _____ _____ _____ ______ ______(1) Amounts represent expected contributions to our pension and other postretirement benefit plans through 2014, offset by expected Medicare Part D subsidy receipts.(2) Amount represents invoices received and recorded as liabilities in 2004, but scheduled for payment in 2005. These represent short-term obligations made in the ordinary course of business.(3) Amount represents contractual obligations for material and services on order at December 31, 2004 but not yet delivered. These represent short-term obligations made in the ordinary course
of business.(4) Amounts represent long-term commitments entered into with key suppliers for minimum purchases quantities.(5) Amounts represent contractual obligations related to software license contracts, IT consulting contracts and outsourcing contracts for benefit plan administration and software system support.(6) Amounts represent estimated contractual interest payments on long-term debt.
Financial Products total borrowings were $19.76 billion atDecember 31, 2004, an increase of $3.19 billion from December 31,2003 due to financing a higher amount of assets. Debt repaymentin Financial Products depends primarily on timely repaymentand collectibility of the receivables portfolio. At December 31,2004, finance receivables past due over 30 days were 1.6%, com-pared with 2.5% at December 31, 2003. The allowance for creditlosses was 1.38% of finance receivables, net of unearned income,at December 31, 2004, compared to 1.49% at December 31, 2003.Receivables written off due to uncollectibility, net of recoverieson receivables previously written off, were $72 million and $82 mil-lion for 2004 and 2003, respectively.
Financial Products was in compliance with all debt covenantsat December 31, 2004 except Cat Financial’s debt-to-equity ratio,as defined under the global credit facilities, which was 8.23 to 1 atDecember 31, 2004. By covenant, this is not to exceed 8.00 to 1at year-end (8.5 to 1 moving six-month average at other than year-end). At December 31, 2004, there were no borrowings under thesefacilities. The higher year-end ratio was primarily the result ofunexpected record levels of financing activity in the fourth quarter.Cat Financial received a waiver from its banks for said failureand expects to be in compliance with all credit facility agreementcovenants throughout 2005.
Dividends paid per common shareQuarter 2004 2003 2002First . . . . . . . . . . . . . . . . . . . . . . . . . . . . . . . $ .370 $ .350 $ .350Second. . . . . . . . . . . . . . . . . . . . . . . . . . . . .370 .350 .350Third. . . . . . . . . . . . . . . . . . . . . . . . . . . . . . .410 .350 .350Fourth . . . . . . . . . . . . . . . . . . . . . . . . . . . . .410 .370 .350______ ______ ______
$1.560 $1.420 $1.400______ ______ ____________ ______ ______
CRITICAL ACCOUNTING POLICIESThe preparation of financial statements in conformity with gen-erally accepted accounting principles requires management tomake estimates and assumptions that affect reported amounts.The more significant estimates include: residual values for leasedassets, fair market values for goodwill impairment tests, and reservesfor warranty, product liability and insurance losses, postretire-ment benefits, post-sale discounts, credit losses and income taxes.We have incorporated many years of data into the determinationof each of these estimates and we have not historically experiencedsignificant adjustments. These assumptions are reviewed at leastannually with the Audit Committee of the Board of Directors.Following are the methods and assumptions used in determiningour estimates and an indication of the risks inherent in each.
Residual values for leased assets — Determined based on theproduct, specifications, application and hours of usage. Eachproduct has its own model for evaluation that includes marketvalue cycles and forecasts. Consideration is also given to theamount of assets that will be returned from lease during a giventime frame. Residual values could decline due to economic fac-tors, obsolescence or other adverse circumstances.
Fair market values for goodwill impairment tests — Determinedfor each reporting unit by discounting projected cash flow forfive years and adding a year-five residual value based upon a mar-ket Earnings Before Interest, Taxes, Depreciation and Amortization(EBITDA) multiple. The estimated fair value could be impactedby changes in interest rates, growth rates, costs, capital expen-ditures and market conditions.
Warranty reserve — Determined by applying historical claimrate experience to the current field population and dealer inventory.

MANAGEMENT’S DISCUSSION AND ANALYSIS continued
A-52
Historical claim rates are developed using a rolling average ofactual warranty payments. Effective in the third quarter of 2004,we refined our process to utilize more detailed claim rates byproduct. This provides more comprehensive product warrantyinformation for management. This change did not have a mate-rial impact on our financial statements. Warranty payments maydiffer from those estimated if actual claim rates are higher orlower than our historical rates.
Product liability and insurance loss reserve — Determinedbased upon reported claims in process of settlement and actuar-ial estimates for losses incurred but not reported. Loss reserves,including incurred but not reported reserves, are based on esti-mates and ultimate settlements may vary significantly from suchestimates due to increased claims frequency or severity over his-torical levels.
Postretirement benefits — Primary actuarial assumptions weredetermined as follows: (See Tables on pages A-55 to A-56 forSensitivity information for these assumptions.)
● The U.S. expected long-term rate of return on plan assetsis based on our estimate of long-term passive returns forequities and fixed income securities weighted by the allo-cation of our plan assets. Based on historical performance,we increase the passive returns due to our active manage-ment of the plan assets. A similar process is used to deter-mine the rate for our non-U.S. pension plans. This rate isimpacted by changes in general market conditions, butbecause it represents a long-term rate, it is not significantlyimpacted by short-term market swings. Changes in our allo-cation of plan assets would also impact this rate. For exam-ple, a shift to more fixed income securities would lowerthe rate. A decrease in the rate would increase our expense.
● The assumed discount rate is used to discount future ben-efit obligations back to today’s dollars. The U.S. discountrate is based on the Moody’s Aa bond yield as of ourmeasurement date, November 30, and represents the rateat which our benefit obligations could effectively be set-tled. A similar process is used to determine the assumeddiscount rate for our non-U.S. plans. This rate is sensitiveto changes in interest rates. A decrease in the discountrate would increase our obligation and expense.
● The expected rate of compensation increase is used todevelop benefit obligations using projected pay at retire-ment. It represents average long-term salary increases.This rate is influenced by our long-term compensationpolicies. An increase in the rate would increase our obli-gation and expense.
● The assumed health care trend rate represents the rate atwhich health care costs are assumed to increase and isbased on historical and expected experience. Changes inour projections of future health care costs due to generaleconomic conditions and those specific to health care(e.g. technology driven cost changes) will impact thistrend rate. An increase in the trend rate would increaseour obligation and expense.
Post-sale discount reserve — The company extends numerousmerchandising programs that provide discounts to dealers asproducts are sold to end users. The reserve is determined based
on historical data adjusted for known changes in merchandisingprograms. Discounts paid may differ from those estimated ifactual program usage is higher or lower than our historical orexpected rates.
Credit loss reserve — The allowance for credit losses is eval-uated on a regular basis and adjusted based upon management’sbest estimate of probable losses inherent in our finance receivables.In estimating probable losses, we review accounts that are past due,non-performing, or in bankruptcy. We also review accounts thatmay be at risk using information available about the customer,such as financial statements, news reports, and published creditratings. We also use general information regarding industry trendsand the general economic environment. Using an estimate of cur-rent fair market value of collateral and factoring in credit enhance-ments, such as additional collateral and third party guarantees,we arrive at an estimated loss for specific accounts and estimatean additional amount for the remainder of the finance receivablesbased upon historical trends. Adverse economic conditions orother factors that might cause deterioration of the financial healthof our customers could change the timing and level of paymentsreceived and thus necessitate a change in our estimated losses.
Income tax reserve — Despite our belief that our tax returnpositions are consistent with applicable tax laws, we believe thatcertain positions are likely to be challenged by taxing authorities.Settlement of any challenge can result in no change, a completedisallowance, or some partial adjustment reached through nego-tiations or litigation. Significant judgment is required in evaluat-ing our tax reserves. Our reserves are adjusted in light of changingfacts and circumstances, such as the progress of our tax audits.Our income tax expense includes the impact of reserve provi-sions and changes to reserves that we consider appropriate, aswell as related interest and penalties. Unfavorable settlement ofany particular issue would require use of our cash. Favorableresolution would be recognized as a reduction to income taxexpense at the time of resolution.
EMPLOYMENT
At December 31, 2004, Caterpillar’s worldwide employment was76,920 compared with 69,169 one year ago. The increase is pri-marily due to hourly labor additions to support increased vol-ume and the addition of approximately 2,500 employees fromacquisitions and growing Caterpillar Logistics operations.
Full-Time Employees at Year End2004 2003 2002
Inside U.S. . . . . . . . . . . . . . . . . . . . . . . . . 38,128 35,260 36,463Outside U.S. . . . . . . . . . . . . . . . . . . . . . . 38,792 33,909 32,527______ ______ ______
Total. . . . . . . . . . . . . . . . . . . . . . . . . . . . 76,920 69,169 68,990______ ______ ____________ ______ ______By Region:
North America. . . . . . . . . . . . . . . . . 38,396 35,486 36,667EAME.. . . . . . . . . . . . . . . . . . . . . . . . . 22,169 20,547 21,302Latin America . . . . . . . . . . . . . . . . . 10,733 8,533 7,143Asia/Pacific . . . . . . . . . . . . . . . . . . . . 5,622 4,603 3,878______ ______ ______
Total . . . . . . . . . . . . . . . . . . . . . . . . 76,920 69,169 68,990______ ______ ____________ ______ ______
Caterpillar Inc.
A-53
OTHER MATTERS
ENVIRONMENTAL AND LEGAL MATTERSThe company is regulated by federal, state, and internationalenvironmental laws governing our use of substances and controlof emissions in all our operations. Compliance with these existinglaws has not had a material impact on our capital expendituresor earnings. We believe that our Advanced Combustion EmissionReduction Technology (ACERT) developed to comply with EPAemissions regulations provides Caterpillar a competitive advan-tage now and in the future to meet emission requirements.
We are cleaning up hazardous waste at a number of locations,often with other companies, pursuant to federal and state laws.When it is likely we will pay clean-up costs at a site and thosecosts can be estimated, the costs are charged against our earnings.In doing that estimate, we do not consider amounts expected tobe recovered from insurance companies and others.
The amount recorded for environmental clean-up is not mate-rial and is included in “Accrued expenses” in Statement 3. If arange of liability estimates is available on a particular site, weaccrue at the lower end of that range.
We cannot estimate costs on sites in the very early stages ofclean-up. Currently, we have several sites in the very early stagesof clean-up, and there is no more than a remote chance that amaterial amount for clean-up will be required.
Pursuant to a consent decree Caterpillar entered with the EPA,the company was required to meet certain emission standards byOctober 2002. The decree provides that if engine manufactur-ers were unable to meet the standards at that time, they would berequired to pay a Non-Conformance Penalty (NCP) on each enginesold that did not meet the standard. The amount of the NCP wouldbe based on how close to meeting the standard the engine came— the more out of compliance the higher the penalty. The com-pany began introduction of fully compliant ACERT engines in2003 and by the end of 2003 Caterpillar was only producing fullycompliant engine models. As a result, NCPs were not payablefor any engines built in 2004. NCPs of $153 million were paidin 2003.
In addition, the consent decree required Caterpillar to pay a fineof $25 million, which was expensed in 1998, and to make invest-ments totaling $35 million in environmental-related products byJuly 7, 2007. Total qualifying investments to date for these projectsare $34.9 million, of which $5.9 million was made during 2004.Caterpillar expects to reach the $35 million requirement duringthe first quarter of 2005. A future benefit is expected to be realizedfrom these environmental projects related to Caterpillar’s abilityto capitalize on the technologies it developed in complying withits environmental project obligations. In short, Caterpillar expectsto receive a positive net return on the environmental projects bybeing able to market the technology it developed.
We are a party to litigation matters and claims that are normalin the course of our operations, and, while the results of such lit-igation and claims cannot be predicted with certainty, manage-ment believes, based on the advice of counsel, the final outcomeof such matters will not have a materially adverse effect on ourfinancial statements.
On January 16, 2002, Caterpillar commenced an action in theCircuit Court of the Tenth Judicial Circuit of Illinois in Peoria,Illinois, against Navistar International Transportation Corporationand International Truck and Engine Corporation (collectivelyNavistar). The lawsuit arises out of a long-term purchase contractbetween Caterpillar and Navistar effective May 31, 1988, asamended from time to time (the Purchase Agreement). The pend-ing complaint alleges that Navistar breached its contractual obli-gations by: (i) paying Caterpillar $8.08 less per fuel injector thanthe agreed upon price for new unit injectors delivered by Caterpillar;(ii) refusing to pay contractually agreed upon surcharges owedas a result of Navistar ordering less than planned volumes ofreplacement unit injectors; and (iii) refusing to pay contractuallyagreed upon interest stemming from Navistar’s late payments. Asof December 31, 2004, the net past due receivable from Navistarregarding the foregoing and included in “Long-term receivables— trade and other” in Statement 3 totaled $139 million. The pendingcomplaint also has claims alleging that Franklin Power Products, Inc.,Newstream Enterprises, and Navistar, collectively and individually,failed to pay the applicable price for shipments of unit injectorsto Franklin and Newstream. As of December 31, 2004, the netpast due receivables for the foregoing, included in “Long-termreceivables — trade and other” in Statement 3 totaled $13 million.The pending complaint further alleges that Sturman Industries,Inc., and Sturman Engine Systems, Inc., colluded with Navistar toutilize technology that Sturman Industries, Inc., misappropriatedfrom Caterpillar to help Navistar develop its G2 fuel system, andtortiously interfered with the Purchase Agreement and Caterpillar’sprospective economic relationship with Navistar. The pending com-plaint further alleges that the two parties’ collusion led Navistar toselect Sturman Engine Systems, Inc. and another company, insteadof Caterpillar, to develop and manufacture the G2 fuel system.
On May 7, 2002, International Truck and Engine Corporation(International) commenced an action against Caterpillar in theCircuit Court of DuPage County, Illinois that alleges Caterpillarbreached various aspects of a long-term agreement term sheet.In its fifth amended complaint, International seeks a declara-tion from the court that the term sheet constitutes a legally bind-ing contract for the sale of heavy-duty engines at specified pricesthrough the end of 2006, alleges that Caterpillar breached theterm sheet by raising certain prices effective October 1, 2002, andalso alleges that Caterpillar breached an obligation to negotiatea comprehensive long-term agreement referenced in the term sheet.International has also asserted a claim for “unjust enrichment”related to certain revenues received by Caterpillar from anothercustomer. International seeks damages “in an amount to be deter-mined at trial” and injunctive relief. Caterpillar denies Interna-tional’s claims and has filed a counterclaim seeking a declarationthat the term sheet has been effectively terminated. Caterpillaralso asserts that International has released Caterpillar from cer-tain of its claims. On September 24, 2003, the Appellate Courtof Illinois, ruling on an interlocutory appeal, issued an order con-sistent with Caterpillar’s position that, even if the court subse-quently determines that the term sheet is a binding contract, it isindefinite in duration and was therefore terminable at will byCaterpillar after a reasonable period. Caterpillar anticipates thata trial currently scheduled to begin in June 2005 will address allremaining issues in this matter. This matter is not related to the

MANAGEMENT’S DISCUSSION AND ANALYSIS continued
A-54
breach of contract action brought by Caterpillar against Navistarcurrently pending in the Circuit Court of Peoria County, Illinois.
In 2004, the European Union (EU) imposed retaliatory tariffson certain U.S. origin goods as a result of a WTO decision thatfound the extraterritorial income exclusion (ETI) provisions ofthe FSC Repeal and Extraterritorial Income Exclusion Act of2000 constituted a prohibited export subsidy. These tariffs, whichbegan in March of 2004 at 5 percent, increased 1 percentagepoint per month. Given the makeup of the final retaliation list,some Caterpillar parts and components were subject to these tar-iffs. However, these tariffs have not materially impacted ourfinancial results. In addition to the United States, the companyhas production facilities in the EU, Russia, Asia, and SouthAmerica. Products sold into the EU from these plants were notaffected by this retaliatory tariff. The American Jobs CreationAct of 2004 (Act), enacted on October 22, 2004, phases-out theETI provisions. As a result, the EU has lifted the sanctions effec-tive January 1, 2005 pending the outcome of a WTO review todetermine whether certain provisions of the Act are compliantwith the ruling against the FSC/ETI regime.
In a letter dated November 15, 2004, the United States Envi-ronmental Protection Agency (EPA), proposed a civil penaltyof $641,392 to Caterpillar Inc. (Caterpillar) for the alleged fail-ure to comply with certain requirements of the federal Clean AirAct. The EPA alleges that Caterpillar constructed a facility inEmporia, Kansas and failed to comply with Section 112(g)(2)(B)of the Clean Air Act. Caterpillar sold the Emporia facility inDecember 2002. We are seeking a settlement of this matter withall concerned parties and the company believes the outcome willnot have a material impact on our financial statements.
RETIREMENT BENEFITSWe recognized pension expense of $274 million in 2004 as com-pared to $126 million in 2003. The increase in expense wasprimarily a result of the amortization of actuarial losses resultingfrom a declining discount rate and poor performance of the equitymarkets in 2002 and 2001. Statement of Financial AccountingStandards No. 87 (SFAS 87), “Employers’ Accounting for Pensions”requires companies to discount future benefit obligations back totoday’s dollars using a discount rate that is based on high-qualityfixed-income investments. A decrease in the discount rate increasesthe pension benefit obligation. This increase is amortized intoearnings as an actuarial loss. SFAS 87 also requires companies touse an expected long-term rate of return on plan assets for com-puting current year pension expense. Differences between theactual and expected asset returns are also amortized into earningsas actuarial gains and losses. At the end of 2004, total unrecognizedactuarial losses were $3.28 billion, as compared to $3.20 billionfor 2003. The majority of the unrecognized losses are due todeclining discount rates in recent years. The $80 million increasein unrecognized losses during 2004 was the result of a lower dis-count rate, largely offset by better than expected asset returns.
In 2004, we recognized other postretirement benefit expenseof $256 million compared to $269 million in 2003. The decreaseis the result of the recognition of anticipated benefits from theMedicare Prescription Drug, Improvement and ModernizationAct of 2003 (see further discussion below), largely offset by anincrease in expense due to the amortization of actuarial losses
resulting from a declining discount rate, higher than expectedbenefit costs and an increase in expected health care inflation.Unrecognized actuarial losses for other postretirement benefitplans were $1.23 billion at the end of 2004. These losses reflecta declining discount rate, an increase in expected health careinflation and higher than expected benefit costs. The unrecog-nized losses were $132 million lower than at the end of 2003 asthe benefit from anticipated Medicare Part D subsidies, lowerthan expected health care costs and higher than planned assetreturns more than offset the unfavorable impact of an increase inexpected health care inflation and a lower discount rate.
The unrecognized actuarial losses for both pensions and otherpostretirement benefits will be impacted in future periods by actualasset returns, actual health care inflation, discount rate changesand other factors that impact these expenses. These losses willbe amortized on a straight-line basis over the average remainingservice period of active employees expected to receive benefitsunder the benefit plans. At the end of 2004, the average remainingservice period of active employees was 13 years for our U.S. pen-sion plans, 12 years for our non-U.S. pension plans and eight yearsfor other postretirement benefit plans. We expect our amortiza-tion of net actuarial losses to increase approximately $100 mil-lion in 2005 as compared to 2004, primarily because of a decreasein the discount rate.
For our U.S. pension plans, our current asset allocation is 74 per-cent equity securities and 26 percent debt securities, and our targetallocation for 2005 is 70 percent equity securities and 30 percentdebt securities. The current asset allocation for our non-U.S. pensionplans is 54 percent equity securities, 38 percent debt securities,6 percent real estate and 2 percent other. The target allocationfor 2005 for our non-U.S. pension plans is 55 percent equitysecurities, 38 percent debt securities and 7 percent real estate.Our target asset allocations reflect our investment strategy ofmaximizing the rate of return on plan assets and the resultingfunded status, within an appropriate level of risk. The U.S. plansare rebalanced to plus or minus five percentage points of the tar-get asset allocation ranges on a monthly basis. The frequency ofrebalancing for the non-U.S. plans varies depending on the plan.
Our U.S. postretirement health care plans provide for pre-scription drug benefits. On December 8, 2003, the MedicarePrescription Drug, Improvement and Modernization Act of 2003(the Act) was signed into law. The Act introduces a prescriptiondrug benefit under Medicare (Medicare Part D) as well as a fed-eral subsidy to sponsors of retiree health care benefit plans thatprovide a benefit that is at least actuarially equivalent to MedicarePart D. In January 2004, the FASB issued FASB Staff PositionNo. 106-1 (FSP 106-1), “Accounting and Disclosure Require-ments Related to the Medicare Prescription Drug, Improvementand Modernization Act of 2003.” As permitted by FSP 106-1,we made a one-time election to defer accounting for the effectsof the Act pending further guidance from the FASB.
In May 2004, the FASB issued FASB Staff Position No. 106-2(FSP 106-2), which superseded FSP 106-1. FSP 106-2 providesaccounting guidance to employers that have determined that pre-scription drug benefits available under their retiree health carebenefit plans are at least actuarially equivalent to Medicare Part D.The FSP requires that the benefit attributable to past service be
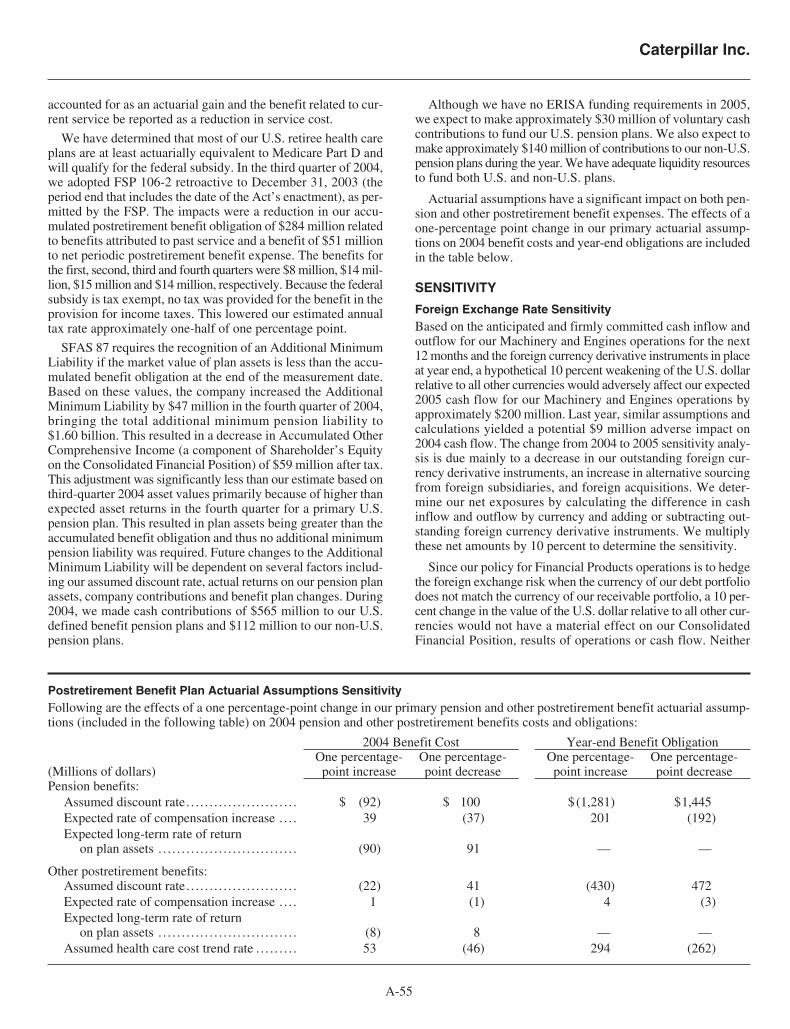
Caterpillar Inc.
A-55
Postretirement Benefit Plan Actuarial Assumptions SensitivityFollowing are the effects of a one percentage-point change in our primary pension and other postretirement benefit actuarial assump-tions (included in the following table) on 2004 pension and other postretirement benefits costs and obligations:
2004 Benefit Cost Year-end Benefit ObligationOne percentage- One percentage- One percentage- One percentage-
(Millions of dollars) point increase point decrease point increase point decreasePension benefits:
Assumed discount rate. . . . . . . . . . . . . . . . . . . . . . . . $ (92) $ 100 $(1,281) $1,445Expected rate of compensation increase . . . . 39 (37) 201 (192)Expected long-term rate of return
on plan assets . . . . . . . . . . . . . . . . . . . . . . . . . . . . . . (90) 91 — —
Other postretirement benefits:Assumed discount rate. . . . . . . . . . . . . . . . . . . . . . . . (22) 41 (430) 472Expected rate of compensation increase . . . . 1 (1) 4 (3)Expected long-term rate of return
on plan assets . . . . . . . . . . . . . . . . . . . . . . . . . . . . . . (8) 8 — —Assumed health care cost trend rate . . . . . . . . . 53 (46) 294 (262)
accounted for as an actuarial gain and the benefit related to cur-rent service be reported as a reduction in service cost.
We have determined that most of our U.S. retiree health careplans are at least actuarially equivalent to Medicare Part D andwill qualify for the federal subsidy. In the third quarter of 2004,we adopted FSP 106-2 retroactive to December 31, 2003 (theperiod end that includes the date of the Act’s enactment), as per-mitted by the FSP. The impacts were a reduction in our accu-mulated postretirement benefit obligation of $284 million relatedto benefits attributed to past service and a benefit of $51 millionto net periodic postretirement benefit expense. The benefits forthe first, second, third and fourth quarters were $8 million, $14 mil-lion, $15 million and $14 million, respectively. Because the federalsubsidy is tax exempt, no tax was provided for the benefit in theprovision for income taxes. This lowered our estimated annualtax rate approximately one-half of one percentage point.
SFAS 87 requires the recognition of an Additional MinimumLiability if the market value of plan assets is less than the accu-mulated benefit obligation at the end of the measurement date.Based on these values, the company increased the AdditionalMinimum Liability by $47 million in the fourth quarter of 2004,bringing the total additional minimum pension liability to$1.60 billion. This resulted in a decrease in Accumulated OtherComprehensive Income (a component of Shareholder’s Equityon the Consolidated Financial Position) of $59 million after tax.This adjustment was significantly less than our estimate based onthird-quarter 2004 asset values primarily because of higher thanexpected asset returns in the fourth quarter for a primary U.S.pension plan. This resulted in plan assets being greater than theaccumulated benefit obligation and thus no additional minimumpension liability was required. Future changes to the AdditionalMinimum Liability will be dependent on several factors includ-ing our assumed discount rate, actual returns on our pension planassets, company contributions and benefit plan changes. During2004, we made cash contributions of $565 million to our U.S.defined benefit pension plans and $112 million to our non-U.S.pension plans.
Although we have no ERISA funding requirements in 2005,we expect to make approximately $30 million of voluntary cashcontributions to fund our U.S. pension plans. We also expect tomake approximately $140 million of contributions to our non-U.S.pension plans during the year. We have adequate liquidity resourcesto fund both U.S. and non-U.S. plans.
Actuarial assumptions have a significant impact on both pen-sion and other postretirement benefit expenses. The effects of aone-percentage point change in our primary actuarial assump-tions on 2004 benefit costs and year-end obligations are includedin the table below.
SENSITIVITY
Foreign Exchange Rate SensitivityBased on the anticipated and firmly committed cash inflow andoutflow for our Machinery and Engines operations for the next12 months and the foreign currency derivative instruments in placeat year end, a hypothetical 10 percent weakening of the U.S. dollarrelative to all other currencies would adversely affect our expected2005 cash flow for our Machinery and Engines operations byapproximately $200 million. Last year, similar assumptions andcalculations yielded a potential $9 million adverse impact on2004 cash flow. The change from 2004 to 2005 sensitivity analy-sis is due mainly to a decrease in our outstanding foreign cur-rency derivative instruments, an increase in alternative sourcingfrom foreign subsidiaries, and foreign acquisitions. We deter-mine our net exposures by calculating the difference in cashinflow and outflow by currency and adding or subtracting out-standing foreign currency derivative instruments. We multiplythese net amounts by 10 percent to determine the sensitivity.
Since our policy for Financial Products operations is to hedgethe foreign exchange risk when the currency of our debt portfoliodoes not match the currency of our receivable portfolio, a 10 per-cent change in the value of the U.S. dollar relative to all other cur-rencies would not have a material effect on our ConsolidatedFinancial Position, results of operations or cash flow. Neither
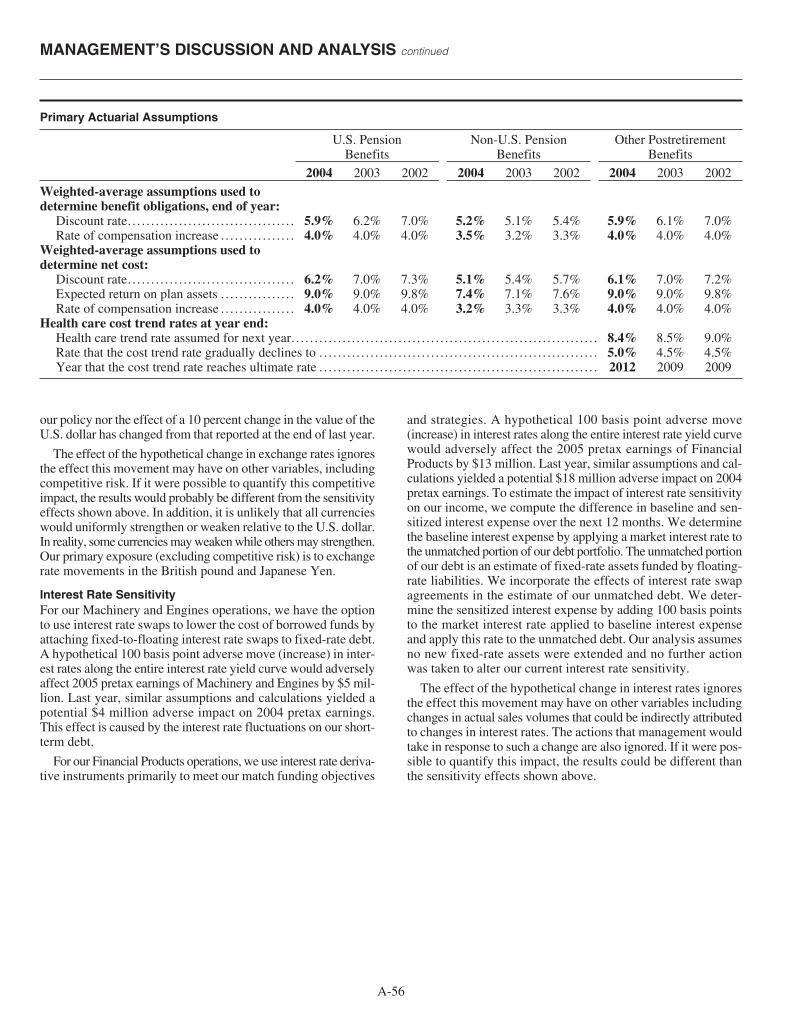
our policy nor the effect of a 10 percent change in the value of theU.S. dollar has changed from that reported at the end of last year.
The effect of the hypothetical change in exchange rates ignoresthe effect this movement may have on other variables, includingcompetitive risk. If it were possible to quantify this competitiveimpact, the results would probably be different from the sensitivityeffects shown above. In addition, it is unlikely that all currencieswould uniformly strengthen or weaken relative to the U.S. dollar.In reality, some currencies may weaken while others may strengthen.Our primary exposure (excluding competitive risk) is to exchangerate movements in the British pound and Japanese Yen.
Interest Rate SensitivityFor our Machinery and Engines operations, we have the optionto use interest rate swaps to lower the cost of borrowed funds byattaching fixed-to-floating interest rate swaps to fixed-rate debt.A hypothetical 100 basis point adverse move (increase) in inter-est rates along the entire interest rate yield curve would adverselyaffect 2005 pretax earnings of Machinery and Engines by $5 mil-lion. Last year, similar assumptions and calculations yielded apotential $4 million adverse impact on 2004 pretax earnings.This effect is caused by the interest rate fluctuations on our short-term debt.
For our Financial Products operations, we use interest rate deriva-tive instruments primarily to meet our match funding objectives
and strategies. A hypothetical 100 basis point adverse move(increase) in interest rates along the entire interest rate yield curvewould adversely affect the 2005 pretax earnings of FinancialProducts by $13 million. Last year, similar assumptions and cal-culations yielded a potential $18 million adverse impact on 2004pretax earnings. To estimate the impact of interest rate sensitivityon our income, we compute the difference in baseline and sen-sitized interest expense over the next 12 months. We determinethe baseline interest expense by applying a market interest rate tothe unmatched portion of our debt portfolio. The unmatched portionof our debt is an estimate of fixed-rate assets funded by floating-rate liabilities. We incorporate the effects of interest rate swapagreements in the estimate of our unmatched debt. We deter-mine the sensitized interest expense by adding 100 basis pointsto the market interest rate applied to baseline interest expenseand apply this rate to the unmatched debt. Our analysis assumesno new fixed-rate assets were extended and no further actionwas taken to alter our current interest rate sensitivity.
The effect of the hypothetical change in interest rates ignoresthe effect this movement may have on other variables includingchanges in actual sales volumes that could be indirectly attributedto changes in interest rates. The actions that management wouldtake in response to such a change are also ignored. If it were pos-sible to quantify this impact, the results could be different thanthe sensitivity effects shown above.
A-56
MANAGEMENT’S DISCUSSION AND ANALYSIS continued
Primary Actuarial Assumptions
U.S. Pension Non-U.S. Pension Other PostretirementBenefits Benefits Benefits
2004 2003 2002 2004 2003 2002 2004 2003 2002
Weighted-average assumptions used todetermine benefit obligations, end of year:
Discount rate. . . . . . . . . . . . . . . . . . . . . . . . . . . . . . . . . . . . 5.9% 6.2% 7.0% 5.2% 5.1% 5.4% 5.9% 6.1% 7.0%Rate of compensation increase . . . . . . . . . . . . . . . . 4.0% 4.0% 4.0% 3.5% 3.2% 3.3% 4.0% 4.0% 4.0%
Weighted-average assumptions used todetermine net cost:
Discount rate. . . . . . . . . . . . . . . . . . . . . . . . . . . . . . . . . . . . 6.2% 7.0% 7.3% 5.1% 5.4% 5.7% 6.1% 7.0% 7.2%Expected return on plan assets . . . . . . . . . . . . . . . . 9.0% 9.0% 9.8% 7.4% 7.1% 7.6% 9.0% 9.0% 9.8%Rate of compensation increase . . . . . . . . . . . . . . . . 4.0% 4.0% 4.0% 3.2% 3.3% 3.3% 4.0% 4.0% 4.0%
Health care cost trend rates at year end:Health care trend rate assumed for next year. . . . . . . . . . . . . . . . . . . . . . . . . . . . . . . . . . . . . . . . . . . . . . . . . . . . . . . . . . . . . . . . . . 8.4% 8.5% 9.0%Rate that the cost trend rate gradually declines to . . . . . . . . . . . . . . . . . . . . . . . . . . . . . . . . . . . . . . . . . . . . . . . . . . . . . . . . . . . . 5.0% 4.5% 4.5%Year that the cost trend rate reaches ultimate rate . . . . . . . . . . . . . . . . . . . . . . . . . . . . . . . . . . . . . . . . . . . . . . . . . . . . . . . . . . . . 2012 2009 2009

Caterpillar Inc.
A-57
SUPPLEMENTAL CONSOLIDATING DATAWe are providing supplemental consolidating data for the purposeof additional analysis. The data has been grouped as follows:
Consolidated — Caterpillar Inc. and its subsidiaries.Machinery and Engines — The Machinery and Engines data
contained in the schedules on pages A-57 to A-59 are “non-GAAPfinancial measures” as defined by the Securities and ExchangeCommission in Regulation G. These non-GAAP financial mea-sures have no standardized meaning prescribed by U.S. GAAP,and therefore, are unlikely to be comparable with the calcula-tion of similar measures for other companies. Management doesnot intend these items to be considered in isolation or as a substi-tute for the related GAAP measures. Caterpillar defines Machineryand Engines as it is presented in the supplemental data asCaterpillar Inc. and its subsidiaries with Financial Productsaccounted for on the equity basis. Machinery and Engines infor-mation relates to our design, manufacturing, marketing and parts
distribution operations. Financial Products information relatesto the financing to customers and dealers for the purchase andlease of Caterpillar and other equipment. The nature of thesebusinesses is different especially with regard to the financialposition and cash flow items. Caterpillar management utilizesthis presentation internally to highlight these differences. Wealso believe this presentation will assist readers in understand-ing our business.
Financial Products — our finance and insurance subsidiaries,primarily Cat Financial and Cat Insurance.
Consolidating Adjustments — eliminations of transactionsbetween Machinery and Engines and Financial Products.
Pages A-57 to A-59 reconcile Machinery and Engines withFinancial Products on the Equity Basis to Caterpillar Inc. Consol-idated financial information.
Supplemental Data for Results of OperationsFor The Years Ended December 31(Millions of dollars)
Supplemental consolidating data___________________________________________________________________________Machinery Consolidating
Consolidated and Engines(1) Financial Products Adjustments_________________________ _________________________ _________________________ _________________________2004 2003 2002 2004 2003 2002 2004 2003 2002 2004 2003 2002_______ ______ ______ _______ ______ ______ _______ ______ ______ _______ ______ ______
Sales and revenues:Sales of Machinery and Engines. . . . . . . . . . . $ 28,336 $ 21,048 $ 18,648 $ 28,336 $ 21,048 $ 18,648 $ — $ — $ — $ — $ — $ —Revenues of Financial Products . . . . . . . . . . . 1,915 1,715 1,504 — — — 2,109 1,895 1,678 (194)(2) (180)(2) (174)(2)
_______ ______ ______ _______ ______ ______ _______ ______ ______ _______ ______ ______Total sales and revenues . . . . . . . . . . . . . . 30,251 22,763 20,152 28,336 21,048 18,648 2,109 1,895 1,678 (194) (180) (174)
Operating costs:Cost of goods sold . . . . . . . . . . . . . . . . . . . . . . . . . 22,420 16,945 15,146 22,420 16,945 15,146 — — — — — —Selling, general and administrative
expenses . . . . . . . . . . . . . . . . . . . . . . . . . . . . . . . 3,072 2,470 2,094 2,548 2,009 1,739 580 538 430 (56)(3) (77)(3) (75)(3)
Research and development expenses . . . . . 928 669 656 928 669 656 — — — — — —Interest expense of Financial Products . . . . 520 470 521 — — — 532 482 538 (12)(4) (12)(4) (17)(4)
Other operating expenses . . . . . . . . . . . . . . . . . . 578 521 411 18 (9) (15) 560 530 426 — — —_______ ______ ______ _______ ______ ______ _______ ______ ______ _______ ______ ______Total operating costs . . . . . . . . . . . . . . . . . . 27,518 21,075 18,828 25,914 19,614 17,526 1,672 1,550 1,394 (68) (89) (92)_______ ______ ______ _______ ______ ______ _______ ______ ______ _______ ______ ______
Operating profit . . . . . . . . . . . . . . . . . . . . . . . . . . . . . . . 2,733 1,688 1,324 2,422 1,434 1,122 437 345 284 (126) (91) (82)
Interest expense excludingFinancial Products. . . . . . . . . . . . . . . . . . . . . 230 246 279 235 259 279 — — — (5)(4) (13)(4) —
Other income (expense) . . . . . . . . . . . . . . . . . . . . 204 35 69 15 (69) (16) 68 26 3 121)(5) 78)(5) 82(5)_______ ______ ______ _______ ______ ______ _______ ______ ______ _______ ______ ______
Consolidated profit before taxes. . . . . . . . . . 2,707 1,477 1,114 2,202 1,106 827 505 371 287 — — —Provision for income taxes. . . . . . . . . . . . . . . . . 731 398 312 566 286 204 165 112 108 — — —_______ ______ ______ _______ ______ ______ _______ ______ ______ _______ ______ ______Profit of consolidated companies. . . . . . . . . . 1,976 1,079 802 1,636 820 623 340 259 179 — — —
Equity in profit (loss) of unconsolidatedaffiliated companies . . . . . . . . . . . . . . . . . . . 59 20 (4) 56 16 (12) 3 4 8 — — —
Equity in profit of Financial Products’subsidiaries . . . . . . . . . . . . . . . . . . . . . . . . . . . . — — — 343 263 187 — — — (343)(6) (263)(6) (187)(6)
_______ ______ ______ _______ ______ ______ _______ ______ ______ _______ ______ ______Profit . . . . . . . . . . . . . . . . . . . . . . . . . . . . . . . . . . . . . . . . . . . . $ 2,035 $ 1,099 $ 798 $ 2,035 $ 1,099 $ 798 $ 343 $ 263 $ 187 $ (343) $ (263) $ (187)_______ ______ ______ _______ ______ ______ _______ ______ ______ _______ ______ _____________ ______ ______ _______ ______ ______ _______ ______ ______ _______ ______ ______
(1) Represents Caterpillar Inc. and its subsidiaries with Financial Products accounted for on the equity basis.(2) Elimination of Financial Products revenues earned from Machinery and Engines.(3) Elimination of expenses recorded by Machinery and Engines paid to Financial Products.(4) Elimination of interest expense recorded between Financial Products and Machinery and Engines.(5) Elimination of discount recorded by Machinery and Engines on receivables sold to Financial Products and of interest earned between Machinery and Engines and Financial Products.(6) Elimination of Financial Products profit due to equity method of accounting.

MANAGEMENT’S DISCUSSION AND ANALYSIS continued
A-58
Supplemental Data for Financial PositionAt December 31(Millions of dollars)
Supplemental consolidating data__________________________________________________Machinery Consolidating
Consolidated and Engines(1) Financial Products Adjustments________________ ________________ ________________ ________________2004 2003 2004 2003 2004 2003 2004 2003_______ ______ _______ ______ _______ ______ _______ ______
AssetsCurrent assets:
Cash and short-term investments . . . . . . . . . . . . . . . . . . . . . . . . . . . . . . . . . . . . . . . . . . . . . . . . . . . . . . . . . . . . $ 445 $ 342 $ 270 $ 220 $ 175 $ 122 $ — $ —Receivables — trade and other . . . . . . . . . . . . . . . . . . . . . . . . . . . . . . . . . . . . . . . . . . . . . . . . . . . . . . . . . . . . . . . 7,459 4,025 3,272 2,993 465 875 3,722)(2)(3) 157)(2)(3)
Receivables — finance . . . . . . . . . . . . . . . . . . . . . . . . . . . . . . . . . . . . . . . . . . . . . . . . . . . . . . . . . . . . . . . . . . . . . . . 6,510 5,508 — — 10,653 6,602 (4,143)(3) (1,094)(3)
Retained interests in securitized trade receivables . . . . . . . . . . . . . . . . . . . . . . . . . . . . . . . . . . . . . . . . . . — 1,550 — — — 1,550 — —Deferred and refundable income taxes . . . . . . . . . . . . . . . . . . . . . . . . . . . . . . . . . . . . . . . . . . . . . . . . . . . . . . . 398 707 333 645 65 62 — —Prepaid expenses. . . . . . . . . . . . . . . . . . . . . . . . . . . . . . . . . . . . . . . . . . . . . . . . . . . . . . . . . . . . . . . . . . . . . . . . . . . . . . 1,369 1,424 1,367 1,403 16 27 (14)(4) (6)(4)
Inventories . . . . . . . . . . . . . . . . . . . . . . . . . . . . . . . . . . . . . . . . . . . . . . . . . . . . . . . . . . . . . . . . . . . . . . . . . . . . . . . . . . . . . 4,675 3,047 4,675 3,047 — — — —_______ ______ _______ ______ _______ ______ _______ ______Total current assets . . . . . . . . . . . . . . . . . . . . . . . . . . . . . . . . . . . . . . . . . . . . . . . . . . . . . . . . . . . . . . . . . . . . . . . . . . . . . . . . . 20,856 16,603 9,917 8,308 11,374 9,238 (435) (943)
Property, plant and equipment — net. . . . . . . . . . . . . . . . . . . . . . . . . . . . . . . . . . . . . . . . . . . . . . . . . . . . . . . . . . . . . 7,682 7,251 4,820 4,682 2,862 2,569 — —Long-term receivables — trade and other . . . . . . . . . . . . . . . . . . . . . . . . . . . . . . . . . . . . . . . . . . . . . . . . . . . . . . . . 764 510 255 81 37 1 472)(3) 428)(3)
Long-term receivables — finance. . . . . . . . . . . . . . . . . . . . . . . . . . . . . . . . . . . . . . . . . . . . . . . . . . . . . . . . . . . . . . . . . 8,575 7,394 — — 9,082 7,822 (507)(3) (428)(3)
Investments in unconsolidated affiliated companies . . . . . . . . . . . . . . . . . . . . . . . . . . . . . . . . . . . . . . . . . . . . . 517 800 479 426 39 374 (1)(5) —Investments in Financial Products subsidiaries . . . . . . . . . . . . . . . . . . . . . . . . . . . . . . . . . . . . . . . . . . . . . . . . . . — — 3,012 2,547 — — (3,012)(6) (2,547)(6)
Deferred income taxes. . . . . . . . . . . . . . . . . . . . . . . . . . . . . . . . . . . . . . . . . . . . . . . . . . . . . . . . . . . . . . . . . . . . . . . . . . . . . . 674 616 950 819 27 19 (303)(7) (222)(7)
Intangible assets. . . . . . . . . . . . . . . . . . . . . . . . . . . . . . . . . . . . . . . . . . . . . . . . . . . . . . . . . . . . . . . . . . . . . . . . . . . . . . . . . . . . 315 239 307 230 8 9 — —Goodwill . . . . . . . . . . . . . . . . . . . . . . . . . . . . . . . . . . . . . . . . . . . . . . . . . . . . . . . . . . . . . . . . . . . . . . . . . . . . . . . . . . . . . . . . . . . . 1,450 1,398 1,450 1,398 — — — —Other assets. . . . . . . . . . . . . . . . . . . . . . . . . . . . . . . . . . . . . . . . . . . . . . . . . . . . . . . . . . . . . . . . . . . . . . . . . . . . . . . . . . . . . . . . . 2,258 1,895 1,075 955 1,183 940 — —_______ ______ _______ ______ _______ ______ _______ ______
Total assets. . . . . . . . . . . . . . . . . . . . . . . . . . . . . . . . . . . . . . . . . . . . . . . . . . . . . . . . . . . . . . . . . . . . . . . . . . . . . . . . . . . . . . . . . . . . $ 43,091 $ 36,706 $ 22,265 $ 19,446 $ 24,612 $ 20,972 $ (3,786) $(3,712)_______ ______ _______ ______ _______ ______ _______ _____________ ______ _______ ______ _______ ______ _______ ______
LiabilitiesCurrent liabilities:
Short-term borrowings. . . . . . . . . . . . . . . . . . . . . . . . . . . . . . . . . . . . . . . . . . . . . . . . . . . . . . . . . . . . . . . . . . . . . . . . $ 4,157 $ 2,757 $ 93 $ 72 $ 4,396 $ 3,160 $ (332)(8) $ (475)(8)
Accounts payable. . . . . . . . . . . . . . . . . . . . . . . . . . . . . . . . . . . . . . . . . . . . . . . . . . . . . . . . . . . . . . . . . . . . . . . . . . . . . . 3,990 2,568 3,869 2,773 205 243 (84)(9) (448)(9)
Accrued expenses . . . . . . . . . . . . . . . . . . . . . . . . . . . . . . . . . . . . . . . . . . . . . . . . . . . . . . . . . . . . . . . . . . . . . . . . . . . . . 1,847 1,638 1,012 857 855 802 (20)(10) (21)(10)
Accrued wages, salaries and employee benefits . . . . . . . . . . . . . . . . . . . . . . . . . . . . . . . . . . . . . . . . . . . . . 1,730 1,802 1,716 1,788 14 14 — —Customer advances . . . . . . . . . . . . . . . . . . . . . . . . . . . . . . . . . . . . . . . . . . . . . . . . . . . . . . . . . . . . . . . . . . . . . . . . . . . 555 305 555 305 — — — —Dividends payable. . . . . . . . . . . . . . . . . . . . . . . . . . . . . . . . . . . . . . . . . . . . . . . . . . . . . . . . . . . . . . . . . . . . . . . . . . . . . 141 127 141 127 — — — —Deferred and current income taxes payable . . . . . . . . . . . . . . . . . . . . . . . . . . . . . . . . . . . . . . . . . . . . . . . . . . 259 216 212 166 47 50 — —Long-term debt due within one year . . . . . . . . . . . . . . . . . . . . . . . . . . . . . . . . . . . . . . . . . . . . . . . . . . . . . . . . . 3,531 2,981 6 32 3,525 2,949 — —_______ ______ _______ ______ _______ ______ _______ ______
Total current liabilities. . . . . . . . . . . . . . . . . . . . . . . . . . . . . . . . . . . . . . . . . . . . . . . . . . . . . . . . . . . . . . . . . . . . . . . . . . . . . . 16,210 12,394 7,604 6,120 9,042 7,218 (436) (944)
Long-term debt due after one year. . . . . . . . . . . . . . . . . . . . . . . . . . . . . . . . . . . . . . . . . . . . . . . . . . . . . . . . . . . . . . . . . 15,837 14,546 3,697 3,603 12,175 10,943 (35)(8) —Liability for postemployment benefits . . . . . . . . . . . . . . . . . . . . . . . . . . . . . . . . . . . . . . . . . . . . . . . . . . . . . . . . . . . . . 2,986 3,172 2,986 3,172 — — — —Deferred income taxes and other liabilities . . . . . . . . . . . . . . . . . . . . . . . . . . . . . . . . . . . . . . . . . . . . . . . . . . . . . . . . 591 516 511 473 383 264 (303)(7) (221)(7)
_______ ______ _______ ______ _______ ______ _______ ______Total liabilities. . . . . . . . . . . . . . . . . . . . . . . . . . . . . . . . . . . . . . . . . . . . . . . . . . . . . . . . . . . . . . . . . . . . . . . . . . . . . . . . . . . . . . . . 35,624 30,628 14,798 13,368 21,600 18,425 (774) (1,165)_______ ______ _______ ______ _______ ______ _______ ______
Stockholders’ equityCommon stock . . . . . . . . . . . . . . . . . . . . . . . . . . . . . . . . . . . . . . . . . . . . . . . . . . . . . . . . . . . . . . . . . . . . . . . . . . . . . . . . . . . . . 1,231 1,059 1,231 1,059 888 890 (888)(6) (890)(6)
Treasury stock . . . . . . . . . . . . . . . . . . . . . . . . . . . . . . . . . . . . . . . . . . . . . . . . . . . . . . . . . . . . . . . . . . . . . . . . . . . . . . . . . . . . . . (3,277) (2,914) (3,277) (2,914) — — — —Profit employed in the business . . . . . . . . . . . . . . . . . . . . . . . . . . . . . . . . . . . . . . . . . . . . . . . . . . . . . . . . . . . . . . . . . . . 9,937 8,450 9,937 8,450 1,824 1,495 (1,824)(6) (1,495)(6)
Accumulated other comprehensive income . . . . . . . . . . . . . . . . . . . . . . . . . . . . . . . . . . . . . . . . . . . . . . . . . . . . . . . (424) (517) (424) (517) 300 162 (300)(6) (162)(6)_______ ______ _______ ______ _______ ______ _______ ______
Total stockholders’ equity. . . . . . . . . . . . . . . . . . . . . . . . . . . . . . . . . . . . . . . . . . . . . . . . . . . . . . . . . . . . . . . . . . . . . . . . . . 7,467 6,078 7,467 6,078 3,012 2,547 (3,012) (2,547)_______ ______ _______ ______ _______ ______ _______ ______
Total liabilities and stockholders’ equity . . . . . . . . . . . . . . . . . . . . . . . . . . . . . . . . . . . . . . . . . . . . . . . . . . . . . . . $ 43,091 $ 36,706 $ 22,265 $ 19,446 $ 24,612 $ 20,972 $ (3,786) $ (3,712)_______ ______ _______ ______ _______ ______ _______ _____________ ______ _______ ______ _______ ______ _______ ______
(1) Represents Caterpillar Inc. and its subsidiaries with Financial Products accounted for on the equity basis.(2) Elimination of receivables between Machinery and Engines and Financial Products.(3) Reclassification of Machinery and Engines trade receivables purchased by Cat Financial and Cat Financial’s wholesale inventory receivables.(4) Elimination of Machinery and Engines insurance premiums which are prepaid to Financial Products.(5) Elimination of Machinery and Engines investment in Financial Products subsidiary.(6) Elimination of Financial Products equity which is accounted for on Machinery and Engines on the equity basis.(7) Reclassification of Financial Products deferred tax liability to a deferred tax asset on a consolidated basis.(8) Elimination of debt between Machinery and Engines and Financial Products.(9) Elimination of payables between Machinery and Engines and Financial Products.
(10) Elimination of prepaid insurance in Financial Products’ accrued expenses.

Caterpillar Inc.
A-59
Supplemental Data for Statement of Cash FlowFor The Years Ended December 31(Millions of dollars)
Supplemental consolidating data__________________________________________________Machinery Consolidating
Consolidated and Engines(1) Financial Products Adjustments________________ ________________ ________________ ________________2004 2003 2004 2003 2004 2003 2004 2003_______ ______ _______ ______ _______ ______ _______ ______
Cash flow from operating activities:Profit . . . . . . . . . . . . . . . . . . . . . . . . . . . . . . . . . . . . . . . . . . . . . . . . . . . . . . . . . . . . . . . . . . . . . . . . . . . . . . . . . . . . . . . . . . . . . . . . $ 2,035 $ 1,099 $ 2,035 $ 1,099 $ 343 $ 263 $ (343)(2) $ (263)(2)
Adjustments for non-cash items:Depreciation and amortization . . . . . . . . . . . . . . . . . . . . . . . . . . . . . . . . . . . . . . . . . . . . . . . . . . . . . . . . . . . . . . . . 1,397 1,347 795 798 602 549 — —Undistributed profit of Financial Products . . . . . . . . . . . . . . . . . . . . . . . . . . . . . . . . . . . . . . . . . . . . . . . . . . . — — (328) (263) — — 328)(3) 263)(3)
Other . . . . . . . . . . . . . . . . . . . . . . . . . . . . . . . . . . . . . . . . . . . . . . . . . . . . . . . . . . . . . . . . . . . . . . . . . . . . . . . . . . . . . . . . . . . (113) (69) (111) (12) (145) (146) 143)(4) 89)(4)
Changes in assets and liabilities:Receivables — trade and other . . . . . . . . . . . . . . . . . . . . . . . . . . . . . . . . . . . . . . . . . . . . . . . . . . . . . . . . . . . . . . . (7,616) (8,115) (531) (376) 43 (238) (7,128)(4)(5) (7,501)(4)(5)
Inventories . . . . . . . . . . . . . . . . . . . . . . . . . . . . . . . . . . . . . . . . . . . . . . . . . . . . . . . . . . . . . . . . . . . . . . . . . . . . . . . . . . . . . (1,391) (286) (1,391) (286) — — — —Accounts payable and accrued expenses . . . . . . . . . . . . . . . . . . . . . . . . . . . . . . . . . . . . . . . . . . . . . . . . . . . . 1,457 542 1,325 628 11 (26) 121)(4) (60)(4)
Other — net . . . . . . . . . . . . . . . . . . . . . . . . . . . . . . . . . . . . . . . . . . . . . . . . . . . . . . . . . . . . . . . . . . . . . . . . . . . . . . . . . . . 240 (129) 124 (161) 108 61 8)(4) (29)(4)_______ ______ _______ ______ _______ ______ _______ ______
Net cash provided by (used for) operating activities . . . . . . . . . . . . . . . . . . . . . . . . . . . . . . . . . . . . . . . . . . . . . . . . . . (3,991) (5,611) 1,918 1,427 962 463 (6,871) (7,501)_______ ______ _______ ______ _______ ______ _______ ______
Cash flow from investing activities:Capital expenditures — excluding equipment leased to others . . . . . . . . . . . . . . . . . . . . . . . . . . . . . . . . . (926) (682) (841) (654) (85) (28) — —Expenditures for equipment leased to others . . . . . . . . . . . . . . . . . . . . . . . . . . . . . . . . . . . . . . . . . . . . . . . . . . . . . (1,188) (1,083) (2) (10) (1,186) (1,073) — —Proceeds from disposals of property, plant and equipment. . . . . . . . . . . . . . . . . . . . . . . . . . . . . . . . . . . . . . 673 761 27 133 646 628 — —Additions to finance receivables . . . . . . . . . . . . . . . . . . . . . . . . . . . . . . . . . . . . . . . . . . . . . . . . . . . . . . . . . . . . . . . . . . . (8,930) (6,868) — — (20,515) (12,572) 11,585)(5) 5,704)(5)
Collections of finance receivables . . . . . . . . . . . . . . . . . . . . . . . . . . . . . . . . . . . . . . . . . . . . . . . . . . . . . . . . . . . . . . . . . 6,216 5,251 — — 16,963 9,802 (10,747)(5) (4,551)(5)
Proceeds from sale of finance receivables . . . . . . . . . . . . . . . . . . . . . . . . . . . . . . . . . . . . . . . . . . . . . . . . . . . . . . . . 700 661 — — 1,363 1,760 (663)(5) (1,099)(5)
Additions to retained interests in securitized trade receivables . . . . . . . . . . . . . . . . . . . . . . . . . . . . . . . . . . — — — — (6,686) (7,447) 6,686)(6) 7,447)(6)
Collections of retained interests in securitized trade receivables . . . . . . . . . . . . . . . . . . . . . . . . . . . . . . . . 5,722 7,129 — — 5,722 7,129 — —Net intercompany borrowings . . . . . . . . . . . . . . . . . . . . . . . . . . . . . . . . . . . . . . . . . . . . . . . . . . . . . . . . . . . . . . . . . . . . . — — 159 376 209 53 (368)(7) (429)(7)
Investments and acquisitions (net of cash acquired) . . . . . . . . . . . . . . . . . . . . . . . . . . . . . . . . . . . . . . . . . . . . . (290) (268) (295) (18) — (250) 5 —Proceeds from sale of partnership investment . . . . . . . . . . . . . . . . . . . . . . . . . . . . . . . . . . . . . . . . . . . . . . . . . . . . 290 — — — 290 — — —Other — net . . . . . . . . . . . . . . . . . . . . . . . . . . . . . . . . . . . . . . . . . . . . . . . . . . . . . . . . . . . . . . . . . . . . . . . . . . . . . . . . . . . . . . . . (190) (17) (82) (23) (102) (47) (6)(8) 53)(8)
_______ ______ _______ ______ _______ ______ _______ ______Net cash provided by (used for) investing activities . . . . . . . . . . . . . . . . . . . . . . . . . . . . . . . . . . . . . . . . . . . . . . . . . . . 2,077 4,884 (1,034) (196) (3,381) (2,045) 6,492 7,125_______ ______ _______ ______ _______ ______ _______ ______
Cash flow from financing activities:Dividends paid. . . . . . . . . . . . . . . . . . . . . . . . . . . . . . . . . . . . . . . . . . . . . . . . . . . . . . . . . . . . . . . . . . . . . . . . . . . . . . . . . . . . . . (534) (491) (534) (491) (15) — 15)(9) —Common stock issued, including treasury shares reissued. . . . . . . . . . . . . . . . . . . . . . . . . . . . . . . . . . . . . . 317 157 317 157 (2) 53 2)(8) (53)(8)
Treasury shares purchased . . . . . . . . . . . . . . . . . . . . . . . . . . . . . . . . . . . . . . . . . . . . . . . . . . . . . . . . . . . . . . . . . . . . . . . . (539) (405) (539) (405) — — — —Net intercompany borrowings . . . . . . . . . . . . . . . . . . . . . . . . . . . . . . . . . . . . . . . . . . . . . . . . . . . . . . . . . . . . . . . . . . . . . — — (209) (53) (159) (376) 368)(7) 429)(7)
Proceeds from long-term debt issued. . . . . . . . . . . . . . . . . . . . . . . . . . . . . . . . . . . . . . . . . . . . . . . . . . . . . . . . . . . . . 5,088 5,634 9 128 5,079 5,506 — —Payments on long-term debt . . . . . . . . . . . . . . . . . . . . . . . . . . . . . . . . . . . . . . . . . . . . . . . . . . . . . . . . . . . . . . . . . . . . . . . (3,008) (4,237) (35) (463) (2,973) (3,774) — —Short-term borrowings — net . . . . . . . . . . . . . . . . . . . . . . . . . . . . . . . . . . . . . . . . . . . . . . . . . . . . . . . . . . . . . . . . . . . . . 550 87 21 (37) 529 124 — —_______ ______ _______ ______ _______ ______ _______ ______
Net cash provided by (used for) financing activities. . . . . . . . . . . . . . . . . . . . . . . . . . . . . . . . . . . . . . . . . . . . . . . . . . . 1,874 745 (970) (1,164) 2,459 1,533 385 376_______ ______ _______ ______ _______ ______ _______ ______Effect of exchange rate changes on cash . . . . . . . . . . . . . . . . . . . . . . . . . . . . . . . . . . . . . . . . . . . . . . . . . . . . . . . . . . . . . . . 143 15 136 7 13 8 (6)(10) —_______ ______ _______ ______ _______ ______ _______ ______Increase (decrease) in cash and short-term investments . . . . . . . . . . . . . . . . . . . . . . . . . . . . . . . . . . 103 33 50 74 53 (41) — —
Cash and short-term investments at beginning of period . . . . . . . . . . . . . . . . . . . . . . . . . . . . . . . . . . . . . . . . . . . . . 342 309 220 146 122 163 — —_______ ______ _______ ______ _______ ______ _______ ______
Cash and short-term investments at end of period . . . . . . . . . . . . . . . . . . . . . . . . . . . . . . . . . . . . . . . . . . . . . . . . . . . . $ 445 $ 342 $ 270 $ 220 $ 175 $ 122 $ — $ —_______ ______ _______ ______ _______ ______ _______ _____________ ______ _______ ______ _______ ______ _______ ______
(1) Represents Caterpillar Inc. and its subsidiaries with Financial Products accounted for on the equity basis.(2) Elimination of Financial Products profit after tax due to equity method of accounting.(3) Non-cash adjustment for the undistributed earnings from Financial Products.(4) Elimination of non-cash adjustments and changes in assets and liabilities related to consolidated reporting. Receivables amounts include adjustment for consolidated non-cash receipt of
retained interests in securitized trade receivables. Please refer to Liquidity and Capital Resources on pages A-48 to A-51 for further discussion.(5) Reclassification of Cat Financial’s cash flow activity from investing to operating for receivables that arise from the sale of inventory.(6) Elimination of Cat Financial’s additions to retained interests in securitized trade receivables that arose from an intercompany purchase of receivables.(7) Net proceeds and payments to/from Machinery and Engines and Financial Products.(8) Change in investment and common stock related to Financial Products.(9) Elimination of dividend from Financial Products to Machinery and Engines.
(10) Elimination of the effect of exchange on intercompany balances.

MANAGEMENT’S DISCUSSION AND ANALYSIS continued
A-60
OUTLOOK
SALES AND REVENUES OUTLOOKWe project another record year in 2005. Company sales and rev-enues should increase 12 to 15 percent, with machinery andengines volume increasing about 8 percent. Improved price real-ization should add about 3 percent and the rest will come fromthe favorable impact of currency on sales and Financial Productsrevenues.
Many central banks raised short-term interest rates in 2004and are expected to raise rates further in 2005. However, weexpect short-term rates at the end of the year will still be favorableto continued economic growth and investment. In most countries,inflation rates are near targets, economic growth is close to trendand labor markets have excess capacity. Continued low interestrates should prolong construction recoveries, particularly in thedeveloped economies.
Sizable increases in energy and metals prices boosted someinflation measures in 2004 but increases in 2005 likely will bemuch lower. In most commodities, prices are already well abovethe minimums needed to make new investments attractive. Increasedproduction, along with somewhat slower growth in demand, shouldmoderate commodity price pressures.
Past commodity price increases reduced consumer incomesin the developed countries but did not halt recoveries or invest-ment. As an offset, higher prices boosted incomes in the develop-ing countries, which led to much-needed increases in investment.Overall, the world economy gained since commodity produc-tion increased.
We expect similar trends to continue in 2005 and both miningand energy development should further benefit sales. Developingcountries should allocate more of the income gains from highercommodity prices and production to construction.
North America (United States and Canada)The U. S. economy is growing at more than a 3 percent rate,employment is increasing only slightly faster than the labor forceand core inflation measures are rising at near 2 percent rates.These conditions do not yet reflect much of the impact of the Fed’srate increases in last half of 2004. Consequently, we believe theFed will be able to prevent any long-term inflation problemswith fairly modest rate hikes, raising the Fed funds target toaround 3.5 percent by the end of 2005.
Long-term rates, which barely moved in response to short-termrate hikes last year, likely will increase this year, although some-what less than short-term rates. Overall, interest rates shouldcontinue to support growth, particularly in business investment,and the economy should grow more than 3.5 percent in 2005.
Both mining and nonresidential construction started recoveriesfrom multi-year declines last year and output is below previouspeaks. We expect activity in these sectors to increase rapidly thisyear, which along with favorable output prices, will support fur-ther sales growth. Housing construction, which has increased forthe past four years, likely will decline slightly this year. We expectthe large backlog of unused housing permits and higher homeprices will offset much of the negative impact of higher mortgageinterest rates.
The Canadian economy, benefiting from low interest rates andhigh commodity prices, should grow about 3 percent in 2005. Weestimate that favorable investment climates in the North Americaneconomies will result in about a 17 percent increase in Machineryand Engines sales.
EAMEThe Euro-zone economy appeared to improve at the end of 2004and the European Central Bank is expected to hold interest ratessteady through the middle of the year. We believe any subsequentrate increases will be cautious in order to allow a recovery in domes-tic spending to offset the impact of a stronger euro. The U. K.economy likely will slow but robust recoveries should continuein Central Europe. Overall European growth is expected to exceed2 percent in 2005, somewhat better than in 2004. Constructionspending should continue to recover.
We anticipate that both AME and the CIS will benefit furtherfrom favorable commodity prices and increased production ofmetals and energy. Higher revenues will be used to fund capacityexpansions as well as infrastructure development. The AMEeconomy should grow about 4.5 percent and the CIS economymore than 6 percent, both marginally slower than in 2004. Weforecast that Machinery and Engines sales in EAME will increaseabout 10 percent this year.
Latin AmericaLatin American economies should grow more than 3.5 percentin 2005, the result of favorable metals and energy prices, increasedcapital inflows and a more favorable foreign debt profile. Bothmining output and construction spending should increase again.We project that sales of Machinery and Engines will increaseabout 13 percent in 2005.
Asia/PacificWe expect regional growth will average about 6 percent thisyear, with most countries slowing some from last year’s pace.Low interest rates should prolong recoveries in consumer spend-ing and business investment while competitive exchange rateslikely will continue to boost exports.
Early indications are that contract prices for coal, particularlycoking coal, will increase substantially this year. Coal miningshould again be a major contributor to sales. Fast growth in theregion, which has taxed infrastructure capacity, should promptgovernments to increase infrastructure spending. Also, recon-struction in areas hit by the tsunami likely will require additionalmachines and engines. In China, government administrative mea-sures are expected to continue, causing sales into that countryto decline. Overall, we expect sales of Machinery and Enginesto increase about 10 percent in 2005.
Financial ProductsWe expect continued growth in Financial Products for 2005, withrevenues expected to increase approximately 16 percent versus2004 primarily due to higher average earning assets in 2005.
PROFIT OUTLOOKWe expect profit per share to be up about 25 percent from 2004.The year will benefit from improved price realization, increasedvolume, manufacturing efficiencies and an intensified focus onour cost structure. We expect material cost pressures to continuefor the first half of 2005, with some relief in the last six months.

Caterpillar Inc.
A-61
As a result, we expect the last half of 2005 to be stronger than thefirst half. Our plan is to more than offset material cost increaseswith price realization in 2005, as evidenced by the price increasealready announced on January 1, 2005. We are continually mon-itoring material costs and their impact on our results, and we arealso reviewing possible further price actions, which we will takeif necessary to meet our goals.
We expect our effective tax rate for 2005 to increase approx-imately two percentage points due to the phase-out of the Extra-territorial Income Exclusion (ETI) as provided in the American
Jobs Creation Act of 2004 along with our expected geographicmix of profits.
* * *
The information included in the Outlook section is forward lookingand involves risks and uncertainties that could significantly affectexpected results. A discussion of these risks and uncertainties iscontained in Form 8-K filed with the Securities & Exchange Com-mission (SEC) on January 27, 2005.
MANAGEMENT’S DISCUSSION AND ANALYSIS ■

A-62
SUPPLEMENTAL STOCKHOLDER INFORMATION
Shareholder Services:
Stock Transfer AgentMellon Investor ServicesP.O. Box 3315South Hackensack, NJ 07606-3315phone: (866) 203-6622 (U.S. and Canada)
(201) 329-8660 (Outside U.S. and Canada)hearing impaired:
(800) 231-5469 (U.S. and Canada)(201) 329-8354 (Outside U.S. and Canada)
Internet home page: www.melloninvestor.com
Caterpillar Assistant SecretaryLaurie J. HuxtableAssistant SecretaryCaterpillar Inc.100 N.E. Adams StreetPeoria, IL 61629-7310phone: (309) 675-4619fax: (309) 675-6620e-mail: [email protected]
Stock Purchase Plan:
Current shareholders and other interested investors may purchaseCaterpillar Inc. common stock directly through the Investor Ser-vices Program sponsored and administered by our Stock TransferAgent. Current shareholders can get more information on theprogram from our Transfer Agent using the contact informationprovided above. Non-shareholders can request program materialsby calling: (800) 842-7629 (U.S. and Canada) or (201) 329-8660(outside the U.S. and Canada). The Investor Services Programmaterials are available on-line from Mellon’s website or linkedfrom www.cat.com/dspp.
Investor Relations:
Institutional analysts, portfolio managers, and representatives offinancial institutions seeking additional information about theCompany should contact:
Director of Investor RelationsNancy L. SnowdenCaterpillar Inc.100 N.E. Adams Street, Peoria, IL 61629-5310phone: (309) 675-4549fax: (309) 675-4457e-mail: [email protected] website: www.cat.com/investor
Common Stock (NYSE: CAT)
Listing Information: Caterpillar common stock is listed on theNew York, Pacific and Chicago stock exchanges in the United States,
and on stock exchanges in Belgium, France, Germany, Great Britainand Switzerland.
Compliance: In compliance with New York Stock Exchangerules, Caterpillar filed an Annual CEO Certification with theExchange in May 2004. The certification will be included as onexhibit to our 2004 Form 10-K.
Price Ranges: Quarterly price ranges of Caterpillar commonstock on the New York Stock Exchange, the principal market inwhich the stock is traded, were:
2004 2003_______________ _______________Quarter High Low High Low______ ____ ____ ____ ____First . . . . . . . . . . . . . . . . . $85.70 $72.51 $53.30 $41.24Second . . . . . . . . . . . . . . $84.76 $72.01 $58.25 $48.98Third . . . . . . . . . . . . . . . . $81.30 $68.50 $73.97 $53.10Fourth . . . . . . . . . . . . . . . $98.72 $76.75 $84.95 $68.90
Number of Stockholders: Stockholders of record at year endtotaled 37,639, compared with 38,440 at the end of 2003.Approximately 69.71% of our issued shares are held by institu-tions and banks, 23.65% by individuals, and 6.64% by employ-ees through company investment plans.
Caterpillar qualified investment plans held 20,387,316 sharesat year-end, including 2,169,522 shares acquired during 2004.Non-U.S. employee stock purchase plans held an additional2,395,759 shares at year-end, including 1,001,689 shares acquiredduring 2004.
Company Information:Current information:
● phone our Information Hotline — (800) 228-7717 (U.S.and Canada) or (858) 244-2080 (outside U.S. and Canada)to request company publications by mail, listen to a sum-mary of Caterpillar’s latest financial results and currentoutlook, or to request a copy of results by fax or mail
● request, view, or download materials on-line or register foremail alerts by visiting www.cat.com/materialsrequest
Historical information:
● view/download on-line at www.cat.com/historical
Annual Meeting:On Wednesday, April 13, 2005, at 1:30 p.m., Central Time, theannual meeting of stockholders will be held at the Northern TrustCorporation Building in Chicago, Illinois. Proxy materials are beingsent to stockholders with this report on or about March 3, 2005.
Internet:Visit us on the Internet at www.cat.com.Information contained on our website is not incorporated by ref-erence into this document.

A-63
Note: All director/officer information is as of December 31, 2004, except as noted.1Will retire effective March 1, 2005.2Retired effective February 1, 2005.3Effective February 1, 2005.
OFFICERSJames W. Owens Chairman and CEOStuart L. Levenick Group PresidentDouglas R. Oberhelman Group PresidentGerald L. Shaheen Group PresidentGérard R. Vittecoq Group PresidentSteven H. Wunning Group PresidentKent M. Adams3 Vice PresidentAli M. Bahaj Vice PresidentSidney C. Banwart Vice PresidentMichael J. Baunton Vice PresidentJames S. Beard1 Vice PresidentRodney C. Beeler Vice PresidentMary H. Bell Vice PresidentRichard A. Benson2 Vice PresidentJames B. Buda Vice President,
General Counsel and SecretaryDavid B. Burritt Vice President,
Chief Financial OfficerRodney L. Bussell Vice PresidentChristopher C. Curfman Vice PresidentPaolo Fellin Vice PresidentThomas A. Gales Vice PresidentStephen A. Gosselin Vice President
Hans A. Haefeli Vice PresidentJohn S. Heller Vice PresidentRichard P. Lavin Vice PresidentRobert R. Macier Vice PresidentF. Lynn McPheeters2 Vice President,
Chief Financial OfficerDaniel M. Murphy Vice PresidentGerald Palmer Vice PresidentJames J. Parker Vice PresidentMark R. Pflederer Vice PresidentEdward J. Rapp Vice PresidentWilliam J. Rohner Vice PresidentChristiano V. Schena Vice PresidentWilliam F. Springer Vice PresidentGary A. Stroup Vice PresidentDonald G. Western Vice PresidentRobert T. Williams Vice PresidentBradley M. Halverson ControllerKevin E. Colgan TreasurerRobin D. Beran Assistant TreasurerTinkie E. Demmin Assistant SecretaryLaurie J. Huxtable Assistant Secretary
Directors/Committee Membership(as of December 31, 2004)
Audit Compensation Governance Public PolicyW. Frank Blount ✔ ✔
John R. Brazil ✔ *✔*John T. Dillon ✔ *✔*Eugene V. Fife *✔*Gail D. Fosler ✔ ✔
Juan Gallardo ✔ ✔
David R. Goode ✔ ✔
Peter A. Magowan ✔ ✔
William A. Osborn *✔*Gordon R. Parker ✔ ✔
Charles D. Powell ✔ ✔
Edward B. Rust, Jr. ✔ ✔
Joshua I. Smith ✔ ✔
* Chairman of Committee
DIRECTORS AND OFFICERS

®
YELA0695


![[This page is intentionally left blank.]s21.q4cdn.com/483767183/files/doc_downloads/proxy statement/Pr… · 2004 Proxy Statement Contents Page 2 The Proxy Process 4 Proposal One](https://img.pdfslide.us/doc/110x75/6002732c44012542b95e94b6/this-page-is-intentionally-left-blanks21q4cdncom483767183filesdocdownloadsproxy.jpg)