ZAMBIA
Factsheets of Health Statistics2016

Population
2010 2011 2012 2013
Population proportion (%)
Aged over 60 %
Aged 15-59 %
Aged under 15% 47
50
4
47
49
4
47
48
5
46
49
5
Population( Source:WHO 2015)
Introduction
Population
Population (in thousands) total
2000
2001
2002
2003
2004
2005
2006
2007
2008
2009
2010
2011
2012
2015 16,212
14,075
13,475
13,089
12,724
12,380
12,055
11,750
11,462
11,192
10,938
10,693
10,450
10,202
Population( Source:UN 2015)
Health status and trends
1990
Both sexes Female Male
2013
Both sexes Female Male
Healthy Life expectancy at birth (years)
Life expectancy at age 60 (years)
Life expectancy at birth (years) 40
14
47
16
43
15
57
16
49
60
18
51
58
17
50
Life expectancy( Source:WHO 2015)
1990
Both sexes Female Male
2013
Both sexes Female Male
Adult mortality rate (probability of dying between 15 and 60 yearsper 1000 population) 634452550 356303330
Adult mortality( Source:WHO 2015)
1990 1995 2000 2005 2013 2015
Maternal mortality ratio (per 100 000 live births) 224280430610630580
Maternal mortality( Source:WHO 2015)
2000 2012
Age-standardized mortality rate by cause (per 100 000 population)
All Causes
Communicable
Noncommunicable diseases
Injuries
Malignant neoplasms (CANCER)
Cardiovascular diseases
Chronic Respiratory diseases
Diabetes mellitus 39.3
23.8
271.7
105.0
156.4
587.4
764.3
1,508.1
215.3
712.0
1,808.4
2,735.7
Age standardized deaths( Source:WHO 2015)
1990 2000 2015
Under-five mortality rate (deaths per 1,000 live births)
Infant mortality rate (probability of dying between birth andage 1 per 1000 live births) 43
64
100
169
115
577
Child mortality( Source:WHO 2015)
2000 2012
Distribution of years of life lost by major cause group (%)
Communicable
Noncommunicable diseases
Injuries 11
14
75
8
10
83
Burden of disease( Source:WHO 2015)
ZAMBIAHealth status and trends

Health MDGs
MDG - 4: Reduce child mortalityTarget 4.A: Reduce by two thirds, between 1990 and 2015, the under-five mortality rate
(Source: WHO, 2015)
1990 2015 MDG Target 2015 Reduction (%)
Under-five mortality rate (deaths per 1,000 live births)
Measles (MCV) immunization coverage among 1-year-olds (%) -6
66
100
67
85
64
90
193
Progress on the MDGs
Not achieved
Achieved
MDG - 5: Improve maternal healthTarget 5.A: Reduce by three quarters, between 1990 and 2015, the maternal mortality ratio
(Source: WHO, 2015)
1990 2015 MDG Target 2015 Reduction (%)
Maternal mortality ratio (per 100 000 live births) 6175224577
Progress on the MDGs
Not achieved
2007-2014 MDG Target 2015Antenatal care coverage at least one visitBirths attended par skilled health personnel (%)Unmet need for family planning (%) 0.00
90.00100.00
27.0064.0096.00
Progress on the MDGs
Not achievedNot achievedNot achieved
Target 5.B: Achieve, by 2015, universal access to reproductive health (Source: WHO, 2015)
MDG - 6: Combat HIV/AIDS, malaria and other diseasesTarget 6.A: Have halted by 2015 and begun to reverse the spread of HIV/AIDS
Target 6.B: Achieve, by 2010, universal access to treatment for HIV/AIDS for all those who need itTarget 6.C: Have halted by 2015 and begun to incidence of malaria and other major diseases
(Source: WHO, 2015)
1990 2000 2007 2014 MDG Target 2015 Reduction (%)
Incidence of HIV (%)Antiretroviral therapy coverage (%)Malaria incidence (%)Tuberculosis mortality rate (per 100 000 population per year) 70.59
70.00
54.82
50.0075.0080.000.00
25.0025.1557.000.75
46.001.66
63.00
Health-Related MDGs
MDG - 7: Ensure environment sustainabilityTarget 7.C: Halve,by the proportion of people without sustainable access to safe drinking water and basic sanitation
(Source: WHO, 2015)
1990 2015 MDG Target 2015 Reduction (%)
Population using improved drinking-water sources (%)Population using improved Sanitation (%) 5.56
31.8950.0050.00
43.9065.40
40.6049.20
Progress on the MDGs
Not achieved Not achieved
MDG - 1: Eradicate extreme poverty and hungerTarget 1.C: Halve,between 1990 and 2015, the proportion of people who suffer from hunger
(Source: WHO, 2015)
1990-1995 2007-2014 MDG Target 2015 Reduction (%)
Children aged <5 years underweight (%) 29.750.014.921.2
Progress on the MDGs
Not achieved
Other MDGs
MDG - 2: Achieve Universal Primary EducationTarget 2.A: Ensure that, by 2015, children everywhere, boys and girls alike, will be able to complete a full course of primary schooling
(Source: UNICEF, 2015)
2007-2014 MDG Target 2015
Percentage of net enrolment ratio in primary education 100.091.0
Progress on the MDGs
Not on track
MDG - 3: Promote Gender Equality and Empower WomenTarget 3.A: Eliminate gender disparity in primary and secondary education, preferably by, 2005, and in all levels of education no later than 2015
(Source: UNICEF, 2015)
2007-2014 MDG Target 2015
The gender parity index in percentage of net enrolment ratio inprimary education 1.000.99
Progress on the MDGs
On track
MDG - 8: Develop a global partnership for developmentTarget 8.A: Develop further an open, rule-based, non discrimanatory trading and financial system
Target 8.D: In cooperation with pharmaceutical companies, provide access to affordable essential drugs(Source: World Bank, 2015)
1990 2005 2011 2013
Official development assistance (ODA) received as percentage of GDP 4.505.8013.0014.40
Private Public
Median availability of selected generic medicines, 2007-2013
Median consumer price ratio of selected generic medicines, 2007-2013
74.0
4.7
81.3
Progress on the MDGs
Not achievedNot achieved
Achieved
Achieved
ZAMBIAProgress on the MDGs

1995 1996 1997 1998 1999 2000 2001 2002 2003 2004 2005 2006 2007 2008 2009 2010 2011 2012 2013External resources for health as a percentage of totalexpenditure on health
General government expenditure on health as % of GDP
General government expenditure on health as a percentage oftotal expenditure on healthGeneral government expenditure on health as a percentage oftotal government expenditureOut-of-pocket expenditure as a percentage of total expenditureon health
Per capita government expenditure on health (PPP int. $)
Per capita government expenditure on health at averageexchange rate (US$)
Per capita total expenditure on health (PPP int. $)
Per capita total expenditure on health at average exchange rate(US$)Private prepaid plans as a percentage of private expenditure onhealthSocial security expenditure on health as a percentage of generalgovernment expenditure on health
Total expenditure on health as a percentage of gross domesticproduct 5.0
0.0
3.5
93.0
192.0
54.0
112.0
27.8
12.6
58.3
2.9
34.2
4.8
0.0
3.5
84.0
175.0
45.0
94.0
30.9
12.6
53.9
2.6
37.5
4.4
0.0
3.4
77.0
158.0
42.0
87.0
29.8
12.6
55.1
2.4
31.7
4.1
0.0
3.4
63.0
140.0
35.0
78.0
29.3
12.6
55.4
2.3
53.2
4.7
0.0
3.5
56.0
146.0
27.0
70.0
35.3
11.7
48.0
2.3
42.3
4.8
0.0
3.5
69.0
146.0
31.0
67.0
37.1
11.2
45.5
2.2
38.3
4.3
0.0
3.5
50.0
124.0
22.0
54.0
38.2
9.5
43.7
1.9
34.2
5.4
0.0
2.3
58.0
143.0
22.0
54.0
27.2
10.5
37.8
2.0
43.5
6.2
0.0
1.6
45.0
150.0
19.0
63.0
26.6
11.6
41.9
2.6
46.7
7.3
0.0
0.4
41.0
165.0
20.0
83.0
24.1
15.7
49.9
3.7
27.0
6.8
0.0
0.5
30.0
143.0
13.0
59.0
25.2
10.2
41.1
2.8
33.6
5.9
0.0
0.7
23.0
119.0
12.0
60.0
28.2
10.6
50.4
3.0
31.1
6.1
0.0
0.7
24.0
120.0
12.0
59.0
28.6
10.6
49.2
3.0
11.5
6.5
0.0
0.6
23.0
121.0
11.0
57.0
29.2
11.1
47.4
3.1
13.9
7.0
0.0
0.5
24.0
123.0
10.0
53.0
29.4
11.6
43.5
3.0
6.7
5.7
0.0
0.5
21.0
101.0
7.0
32.0
31.9
6.4
31.4
1.8
25.1
5.5
0.0
0.5
25.0
101.0
8.0
33.0
31.9
7.1
33.0
1.8
23.4
5.3
0.0
0.5
21.0
95.0
7.0
32.0
33.0
9.0
33.7
1.8
18.8
4.8
0.0
0.6
21.0
80.0
8.0
33.0
32.3
8.6
40.7
1.9
12.3
Health financingSource: WHO 2015
1994-2014 2007-2013
Percentage of civil registrationcoverage for births
Percentage of civil registrationcoverage for Deaths
14
10
Health information, evidence and knowledgeSource: WHO 2015
2010 2013 2014 2007-2013
Median availability of selected generic medicines (%)
Median consumer price ratio of selected genericmedicines
Psychiatric beds (per 100 000 population)
Total density per 100 000 population: District/ruralhospitals
Total density per 100 000 population: Health centres
Total density per 100 000 population: Health posts
Total density per 100 000 population: Hospitals
Total density per 100 000 population: ProvincialhospitalsTotal density per 100 000 population: SpecializedhospitalsTotal density per million females aged from 50 to 69years old: Mammography unitsTotal density per million population: Computedtomography unitsTotal density per million population: Gamma camera orNuclear medicine
Total density per million population: Linear Accelerator
Total density per million population: MagneticResonance ImagingTotal density per million population: Positron Emissiontomography
Total density per million population: Radiotherapy units
Total density per million population: Telecobalt Unit
4.70
155.30
4.30
0.07
0.14
0.00
0.07
0.07
0.07
0.21
0.03
0.12
0.45
1.18
8.33
0.30
0.08
0.15
0.00
0.08
0.08
0.08
0.23
4.09
0.04
0.14
1.31
9.25
0.33
Medical products, vaccines, intrastructures and equipementSource: WHO 2015
1995 1999 2000 2001 2002 2003 2004 2005 2006 2007 2008 2009 2010 2011
Smear-positive tuberculosistreatment-success rate (%)
Treatment success rate for newpulmonary smear-negative andextrapulmonary tuberculosis cases
Treatment success rate forretreatment tuberculosis cases
8889
86
90
90
80
83
88
81
83
85
81
84
85
83
87
84
78
83
78
75
76
80
90
74
67
67
72
6970
Service deliverySource: WHO 2015
2004 2005 2006 2008 2009 2010 2011 2012
Dentistry personnel density (per 1000 population)
Environmental and public health workers density (per1000 population)
Health management & support workers density (per1000 population)
Laboratory health workers density (per 1000population)
Nursing and midwifery personnel density (per 1000population)
Other health workers density (per 1000 population)
Pharmaceutical personnel density (per 1000population)
Physicians density (per 1000 population) 0.173
0.088
0.354
0.049
0.041
0.029
0.172
0.080
0.343
0.044
0.037
0.028
0.066
0.025
1.125
0.784
0.043
0.036
0.089
0.019
0.064
0.025
1.181
0.762
0.071
0.089
0.019
0.065
0.128
0.742
0.077
0.055
0.138
0.706
0.047
0.928
0.068
0.055
1.062
0.717
0.036
0.033
0.069
0.137
0.074
2.015
0.994
0.045
Health workforceSource: WHO 2015
2000 2009 2010 2011 2012 2013
Expenditures for health as a proportion of total per person expenditure
Out-of-pocket expenditure as a percentage of private expenditure on health
Persons protected from out-of-pocket expenditures through a prepayment scheme
Private expenditure on health as a percentage of total expenditure on health
Proportion of births attended by skilled personnel
Satisfied need for family planning 63.80
64.20
41.70
2.70
66.70
46.10
67.10
44.90
66.40
44.60
65.70
52.00
67.80
0.93
52.40
55.60
Universal coverageSource: WHO 2015
National health policies
National Health StrategicPlans
20202011
20152011
Availability of national standards orrecommended lists of medical devices
2010
2013
Health technology (medical device)national policy
2010
2013
Types of lists recommending healthtechnology for high burden diseases
2010
2013
Unit in the Ministry of Healthresponsible for the management ofmedical devices
2010
2013
For different healthcare facilities and specificproceduresFor different healthcare facilities and specificprocedures
No
No
No list available
No list available
Yes
Yes
Comprehensive monitoring and evaluation plan 2012
Health financing strategy 2013
Status of national health accounts (NHA) 2013
No
Ongoing
Conducted NHA at least 3 times
Leadership and governanceSource: WHO 2015
Distribution of censuses carried out in the lastthree census round (1985-1994, 1995-2004,2005-2015)
Plan of census data, 2005-2015 Censusconducted
3 Censuses
Source: UNSD, 2015
ZAMBIAThe health system

2001 2012 2013 2014Deaths due to HIV/AIDS (per 100 000 population)
Prevalence (%) of HIV/AIDS among adults 15-45 years
HIV/AIDS incidence rate (per 100 000 population)
Antiretroviral therapy coverage among people eligible for treatment (%)
984.0
745.0
9.1
396.0
215.0
79.0
7.9
373.0
186.0
57.0
12.4
HIV/AIDS( Source:WHO 2015)
2007-2013Female Male
Population aged 15-24 years with comprehensive correctknowledge of HIV/AIDS (%)
Prevalence (%) of condom use by adults aged 15-49years during higher-risk sex
3734
33 28
HIV/AIDS( Source:WHO 2015)
2000 2011 2012 2014
Deaths due to tuberculosis (per 100 000 population) among HIV-negative people
Prevalence of tuberculosis (per 100 000 population)
Tuberculosis incidence rate (per 100 000 population per year)
Case-detection rate for all forms of tuberculosis (%)
Smear-positive tuberculosis treatment-success rate (%)
713
524
69
67
31
88
427
388
68
28
436
406
59
32
Tuberculosis( Source:WHO 2015)
2012 2013 2007-2013
Malaria mortality rate (per 100 000 population)
Malaria incidence rate (per 100 000 population)
Children aged < 5 years (%) with fever whoreceived treatment with any antimalarial
Children aged < 5years (%) sleeping underinsecticide-treated nets
26087
78 78
57
37
Malaria( Source:WHO 2015)
ZAMBIADiseases control
2000 2001 2002 2003 2004 2005 2006 2007 2008 2009 2010 2011 2012 2013 2014
Number of new cases of leprosy
Annual incidence of dracunculiasis cases
764764396 376374334316316314314 192192
000
Neglected tropical diseases( Source:WHO 2015)
Dracunculiasis certification status of countries at the beginning of the year 2007
Status of endemicity for blinding trachoma 2012
Certified free of dracunculiasis
Endemic
Neglected tropical diseasesCertification
( Source:WHO 2014)
2012
Distribution of causes of intentional andnon-intentional injuries (% of total DALYs)
Falls
Fire, heat and hot substances
Intentional injuries
Other unintentional injuries
Poisonings
Road injury
Unintentional injuries
Distribution of causes of neuropsychiatricburden of diseases (% of total DALYs)
Alcohol use disorders
Bipolar disorder
Drug use disorders
Epilepsy
Migraine
Multiple sclerosis
Neurological conditions
Other neurological conditions
Parkinson's disease
Schizophrenia
Unipolar depressive disorders
Distribution of causes ofnon-communicable burden of diseases(% of total DALYs)
Cardiovascular diseases
Congenital anomalies
Diabetes mellitus
Digestive diseases
Endocrine, blood, immune disorders
Genitourinary diseases
Malignant neoplasms
Musculoskeletal diseases
Oral conditions
Other neoplasms
Respiratory diseases
Sense organ diseases
Skin diseases
7.9
2.0
1.7
1.6
1.3
1.2
0.7
1.7
1.4
1.2
0.4
0.4
0.2
0.2
0.1
0.1
0.0
0.0
3.3
1.9
1.8
1.5
1.4
1.3
1.0
0.9
0.6
0.6
0.5
0.2
0.1
Noncommunicable diseases and conditions( Source:WHO 2014)
2012Female Male
noncommunicables diseases
Cardiovascular diseases
Malignant neoplasms (cancer)
Chronic respiratory diseases
Diabetes mellitus 35
22
99
299
620
43
25
114
246
558
Noncommunicable diseases and conditionsAge-standardized mortality rate by cause (per 100 000 population)
( Source:WHO 2014)
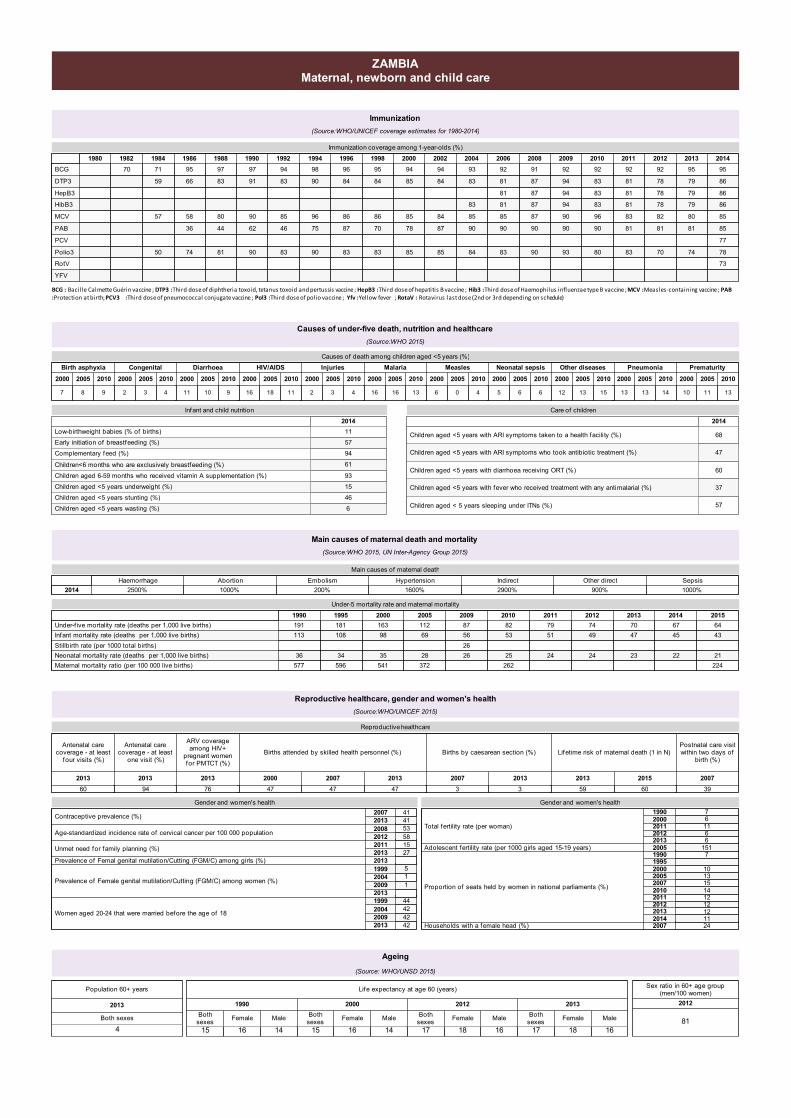
Causes of under-five death, nutrition and healthcare(Source:WHO 2015)
Immunization(Source:WHO/UNICEF coverage estimates for 1980-2014)
ZAMBIAMaternal, newborn and child care
Main causes of maternal death and mortality(Source:WHO 2015, UN Inter-Agency Group 2015)
Reproductive healthcare, gender and women's health(Source:WHO/UNICEF 2015)
Ageing(Source: WHO/UNSD 2015)
1980 1982 1984 1986 1988 1990 1992 1994 1996 1998 2000 2002 2004 2006 2008 2009 2010 2011 2012 2013 2014BCGDTP3HepB3HibB3MCVPABPCVPolio3RotVYFV 737877858586868695
74818079797995
70818278787892
83818381818192
80909683838392
93909094949492
90908787878791
83908581818192
849085838393
8587848494
8578858594
8370868495
8387868496
9075969098
8346858394
9062909197
8144808397
7436586695
5057597170
Immunization coverage among 1-year-olds (%)
BCG :Bacille Calmette Guérin vaccine ;DTP3 :Third dose of diphtheria toxoid, tetanus toxoid and pertussis vaccine ;HepB3 :Third dose of hepatitis B vaccine ; Hib3 :Third dose of Haemophilus influenzae type B vaccine ; MCV :Measles-containing vaccine ;PAB:Protection at birth; PCV3 :Third dose of pneumococcal conjugate vaccine ; Pol3 :Third dose of polio vaccine ; Yfv :Yellow fever ;RotaV :Rotavirus last dose (2nd or 3rd depending on schedule)
Birth asphyxia2000 2005 2010 Congenital2000 2005 2010 Diarrhoea2000 2005 2010 HIV/AIDS2000 2005 2010 Injuries2000 2005 2010 Malaria2000 2005 2010 Measles2000 2005 2010 Neonatal sepsis2000 2005 2010 Other diseases2000 2005 2010 Pneumonia2000 2005 2010 Prematurity2000 2005 2010987 432 91011 111816 432 131616 406 665 151312 141313 131110Causes of death among children aged <5 years (%)
2014Low-birthweight babies (% of births)Early initiation of breastfeeding (%)Complementary feed (%)Children<6 months who are exclusively breastfeeding (%)Children aged 6-59 months who received vitamin A supplementation (%)Children aged <5 years underweight (%)Children aged <5 years stunting (%)Children aged <5 years wasting (%) 646159361945711
Infant and child nutrition 2014Children aged <5 years with ARI symptoms taken to a health facility (%)Children aged <5 years with ARI symptoms who took antibiotic treatment (%)Children aged <5 years with diarrhoea receiving ORT (%)Children aged <5 years with fever who received treatment with any antimalarial (%)Children aged < 5 years sleeping under ITNs (%) 5737604768
Care of children
Population 60+ years2013Both sexes4
Haemorrhage Abortion Embolism Hypertension Indirect Other direct Sepsis2014 1000%900%2900%1600%200%1000%2500%Main causes of maternal death
1990 1995 2000 2005 2009 2010 2011 2012 2013 2014 2015Under-five mortality rate (deaths per 1,000 live births)Infant mortality rate (deaths per 1,000 live births)Stillbirth rate (per 1000 total births)Neonatal mortality rate (deaths per 1,000 live births)Maternal mortality ratio (per 100 000 live births) 224214364
224567
234770
244974
245179
262255382
26265687
3722869112
5413598163
59634108181
57736113191
Under-5 mortality rate and maternal mortality
Antenatal carecoverage - at leastfour visits (%)2013Antenatal carecoverage - at leastone visit (%)2013
ARV coverageamong HIV+pregnant womenfor PMTCT (%)2013Births attended by skilled health personnel (%)2000 2007 2013
Births by caesarean section (%)2007 2013
Lifetime risk of maternal death (1 in N)2013 2015
Postnatal care visitwithin two days of birth (%)200760 94 76 474747 33 6059 39
Reproductive healthcare
Contraceptive prevalence (%) 20072013Age-standardized incidence rate of cervical cancer per 100 000 population 20082012Unmet need for family planning (%) 20112013Prevalence of Femal genital mutilation/Cutting (FGM/C) among girls (%) 2013Prevalence of Female genital mutilation/Cutting (FGM/C) among women (%) 1999200420092013Women aged 20-24 that were married before the age of 18 1999200420092013
414158532715115
42424244
Gender and women's healthTotal fertility rate (per woman) 19902000201120122013Adolescent fertility rate (per 1000 girls aged 15-19 years) 2005Proportion of seats held by women in national parliaments (%)
1990199520002005200720102011201220132014Households with a female head (%) 2007
661167151
11121212141513107
24
Gender and women's health
Sex ratio in 60+ age group(men/100 women)201281Life expectancy at age 60 (years)1990Bothsexes Female Male 2000Bothsexes Female Male 2012Bothsexes Female Male 2013Bothsexes Female Male141615 141615 161817 161817

Risk factors for health(Source : WHO, 2015)
2013
Prevalence of smoking any tobacco product among adultsaged 15 years of age or older (%)
Both sexes
Female
Male 27.1
4.7
15.9
2010Alcohol consumption among adults aged 15 years of ageor older (litres per person) Boths sexes 4.0
2014
Prevalence of raised fasting blood glucose* among adultsaged 18 years or older (%)
Both sexes
Female
Male 8.0
8.5
8.3
2014
Prevalence of raised blood pressure* among adults aged18 years or older (%)
Both sexes
Female
Male 30.0
28.1
29.1
2008
Prevalence of raised total cholesterol* among adults aged25 years or older (%)
Female
Male
Both sexes 27.7
26.5
28.5
2010
Prevalence of insufficient physical* activity among adultsaged 18 years of age or older (%)
Female
Male
Both sexes 20.5
17.3
23.7
The physical environment(Source : WHO, 2015)
1990 2000 2012
Population using improved drinking-water sources (%)
Population using improved sanitation (%)
635349
434141
Food and nutrition(Source : WHO, 2015)
2007-2014
Children aged under 5 years underweight* (%)
Children aged under 5 years stunted** (%)
Children aged <5 years wasted*** (%)
Children aged under 5 years overweight**** (%)
14.9
45.8
5.6
8.4
Social determinants
Demography(Source : WHO, 2015)
2013
Age distribution of thepopulation (%)
Aged under 15
Aged 15-59
Aged over 60 4
49
47
Ressources and infrastructure(Source : WHO, 2015)
2013
Gross national income* per capita (PPP** int. $) 3,070
Poverty and income inequality(Source : WHO, 2015)
2007-2013
Population living under $1 (PPP* int. $) a day (i.e in absolute poverty) (%) 74.3
Gender equity
2007-2012
Net primary school enrolment ratio (%) Boys
Girls 98
96
Global partnerships and financial flows(Source : World Bank, 2015)
2013
Per capita official development assistance (ODA) received (US$)
Official development assistance received as percentage of GNI
Total debt service as percentage of GNI
Total external debt stocks (in current US$)
79
4
1
5,596,199,000
Science and technology(Source : ITU, 2015)
2014
Percentage of population who are cellular or mobile subscribers
Percentage of population who are telephone (fixed and mobile) subscribers
Percentage of the population who are Internet users
67.3
0.8
17.3
Emergencies and disasters(Source : UNHCR, 2015)
2015
Total number of refugees by country of asylum
Total number of refugees by country of origin
25,737
318
Education
2007-2012
Adult literacy rate (aged 15 and older) (%) 71
ZAMBIAKey determinants
2013
Total fertility rate (average number of children) per woman 5.7
2003-2013
Annual growth rate of population (%) 2.9
*Percent of defined population with fasting glucose ≥126 mg/dl (7.0 mmol/l) or on medication for raised bloodglucose.
**Systolic Blood Pressure (SBP)≥140 or Diastolic Blood Pressure (DBP)≥90
***Percentage of defined population with total cholesterol ≥ 240 mg/dl (6.2 mmol/l).
*Underweight is the prevalence of weight-for-age less than -2 standard deviations (using the WHO ChildGrowth Standards median).**Stunting is the prevalence of height-for-age less than -2 standard deviations (using the WHO Child GrowthStandards median)***Wasted is calculated as the prevalence of low weight-for-height less than -2 standard deviations (using theWHO Child Growth Standards median).****Overweight is the prevalence of weight-for-height above +2 standard deviations (using the WHO ChildGrowth Standards median).
*Gross national income (GNI) is the sum of value added by all resident producers plus any product taxes (lesssubsidies) not included in the valuation of output plus net receipts of primary income (compensation ofemployees and property income) from abroad. GNI per capita is GNI divided by mid-year population.** Purchasing Power Parity
*Number of students enrolled in primary, secondary and tertiary levels of education, regardless of age, as per-centage of the population of official school age for the three levels. The gross enrolment ratio can be greaterthan 100% as a result of grade repetition and entry at ages younger or older than the typical age at that gradelevel (UNDP definition).Source : WHO, 2015
2015
Percentage of seats** held by women in national parliaments 12.7
*Number of seats held by women expressed as a percentage of all occupied seats. Women’s representation inparliaments is one aspect of women’s opportunities in political and public life, and it is therefore linked towomen’s empowerment.Source: USI, 2015.
2005-2011
Population aged 15-24 years who can both read and write (i.eyouth literacy rate*) (%)
Female
Male 70
58
*The youth literacy rate reflects the outcomes of primary education over the previous 10 years or so. As ameasure of the effectiveness of the primary education system, it is often seen as a proxy measure of socialprogress and economic achievement. The literacy rate for this analysis is simply the complement of theilliteracy rate.Source: UNSD, 2013.
2014
Adults aged ≥ 18 years who are obese (%) Female
Male 12.3
14.3
2013
Population living in urban areas (%)
Population using solid fuels (%)
40
82
Recommended