Youth Smoking Behavior andExposure to Television Anti-
Smoking AdvertisingSherry EmeryGlen Sczcypka
Yvonne Terry-McElrath
Funded by:
State and Community Tobacco Control Initiative National Cancer Institute
andThe National Institute on Drug Abuse
Youth Smoking and the MediaResearch Team
Co-PI’s:
Melanie Wakefield (Cancer Council Victoria/ UIC), FrankChaloupka (UIC)
Research Team:
UIC: Brian Flay, George Balch, Sherry Emery, GlenSzczypka, Erin Ruel, Kate Clegg-Smith, Sandy Slater
U of M: Lloyd Johnston, Yvonne Terry-McElrath
NBER: Henry Saffer
Goals of Presentation
• Describe unique dataset that measures exposure to anti-smoking media
• Explain model of smoking behavior and exposure to anti-smoking media
• Discuss implications and future directions

Background
Some evidence that anti-smoking advertising canreduce youth smoking
Most studies involve research demonstrationprojects, effects of tobacco control advertising atthe state level (eg. CA, MA, FL) or national level(Fairness Doctrine; ALF)
Wakefield, Flay, Nichter & Giovino. Effects of anti-smokingadvertising on youth smoking: a review. Journal of HealthCommunication (in press)
Background (cont’d)
Natural Experiment in US: Huge variation inexposures over time and between communities inexposure to anti-smoking advertising
Few analyses of effects of tobacco companyadvertising (undermining effects?)
Little attention to effect of pharmaceuticalcompany advertising for NRT and Zyban on youthsmoking (incr. youth optimism about quitting?)
Research Aims
• Describe the amount and type of televisedanti-smoking advertising to which youth indifferent communities are exposed
• Examine the relationship betweenamount and type of anti-smokingadvertising and youth smoking

Research Hypotheses
Exposure to anti-smoking media messages onTV is associated with:
+ Increased recall of anti-smoking ads
+ Increased anti-smoking attitudes and beliefs
- Reduced adolescent smoking
Research Strategy
Map anti-smoking advertising data(measures of exposure) to individual-levelsurvey data (outcomes) from a national
sample of youth
Study design: outcome measures
• Monitoring the Future (funded by the National Institute
on Drug Abuse) survey data from 50,000 youtheach year from 1994-2002
• School-based sampling frame
• Smoking attitudes and behaviors of 8th, 10th and12th graders
• Individual level records for each youth

Basic Descriptive Statistics
47.47% watch 3+ hrs TV/day
19.7% Current smoker
55.3% recall seeing ads > 1x/week
49.4% Minority
15.4Mean age
8th
10th
12th
Total
18 media markets: 14 with state campaigns; 4 without
20,070 (37.6%)16,299 (30.5%)17,072 (32.0%)53,411 (100%)
Study design: exposure measures
• Archival records of televised anti-smokingadvertising from Nielsen Media Research
• 1994-2002
• Top 75 Designated Market Areas (DMAs)covering 80% of US population
•Early analyses examining 18 of 75 DMAs
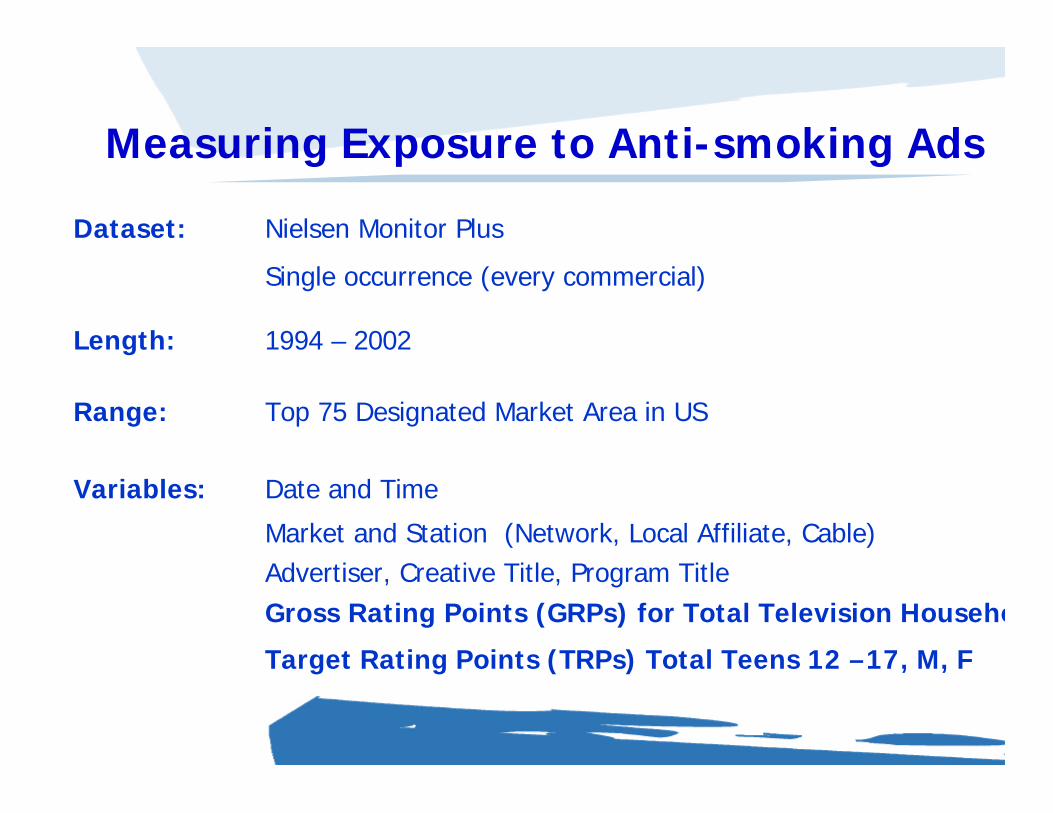
Dataset: Nielsen Monitor Plus
Single occurrence (every commercial)
Length: 1994 – 2002
Range: Top 75 Designated Market Area in US
Variables: Date and Time
Market and Station (Network, Local Affiliate, Cable)Advertiser, Creative Title, Program TitleGross Rating Points (GRPs) for Total Television Households
Target Rating Points (TRPs) Total Teens 12 –17, M, F
Measuring Exposure to Anti-smoking Ads

Rating Points
• Customary unit for measuring exposure to ads
• Audience Exposure
GRPs = Gross Rating Points for Total TV Households
TRPs = Targeted Rating Points for Teens (12 – 17 year olds)
• Aggregated weekly/monthly to estimate the average number of times an ad is exposed to an audience
100 GRPs/TRPs = 1 exposure
250 GRPs/TRPs = 2.5 exposure
• Nielsen Monitor Plus dataset contains ratings data on all television advertising
• Nielsen narrows advertising through string searches (tobacco, smoking, lung, cancer) and and a provided list of advertisers with tobacco control media campaigns
• Creates a large pool of anti-tobacco advertising (seven million +)
• Identify counter advertising by networking with CDC; establishing contacts with media directors at state tobacco control agencies; and viewing ads to match creative titles
Data Cleaning

Advertisers
State Health Dept The Big Four and other newcomersCalifornia, Massachusetts, Florida, Arizona
American Legacy Funded by Master Settlement AgreementBegan advertising in 2000 with the Truth Campaign
Pharmaceutical Corp Nicotine Replacement Therapies and Zyban
Non Profits Local and National Orgs (e.g. ACS, ALA)
Tobacco Industry Philip Morris – Counter and Corporate PR AdvertisingLorillard – Counter Advertising

Final Exposure Measures
After extensive cleaning, we have a record of:
• Nearly all anti-smoking advertisements that appearedin US (top 75 DMAs = 80% of US population) 1994-2002, sorted by DMA
• Identification of advertiser (State campaign, ALF,tobacco industry, NRT) for each ad
• Measurement of exposure (GRP/TRP) for each ad
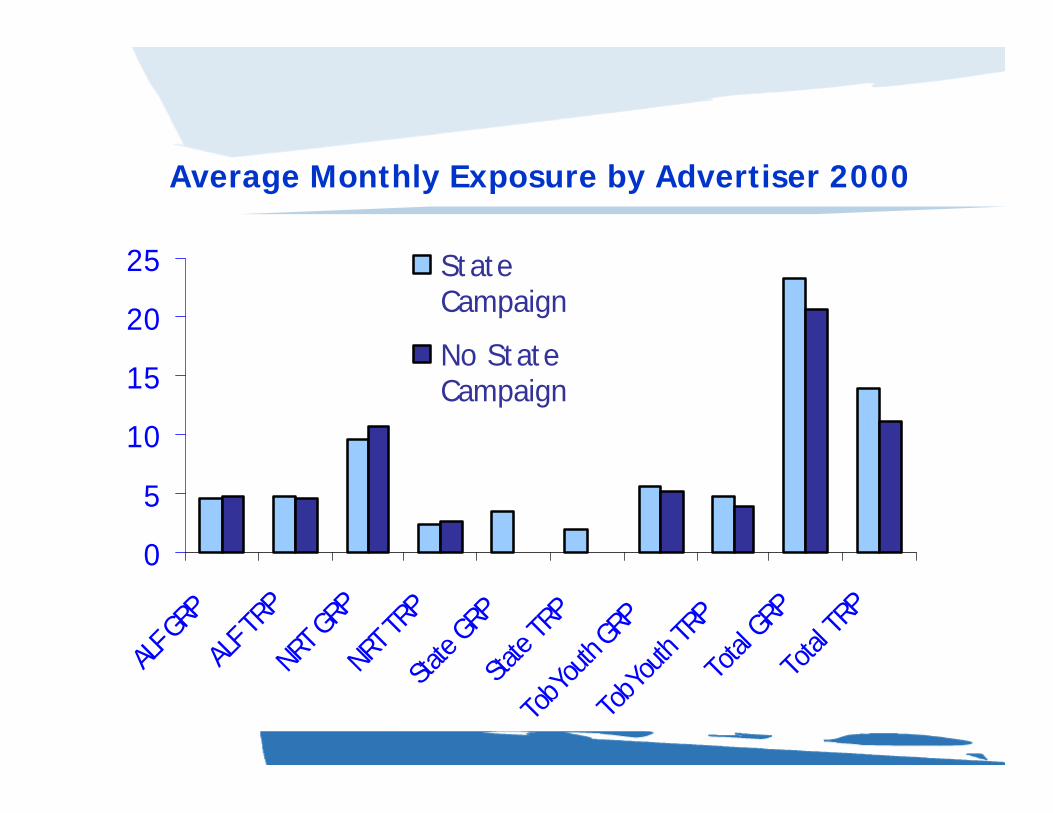
Average Monthly Exposure by Advertiser 2000
0
5
10
15
20
25
ALF G
RP
ALF T
RP
NRT G
RP
NRT T
RP
State
GRP
State
TRP
TobY
outh
GRP
TobY
outh
TRP
Total
GRP
Total
TRP
StateCampaign
No StateCampaign
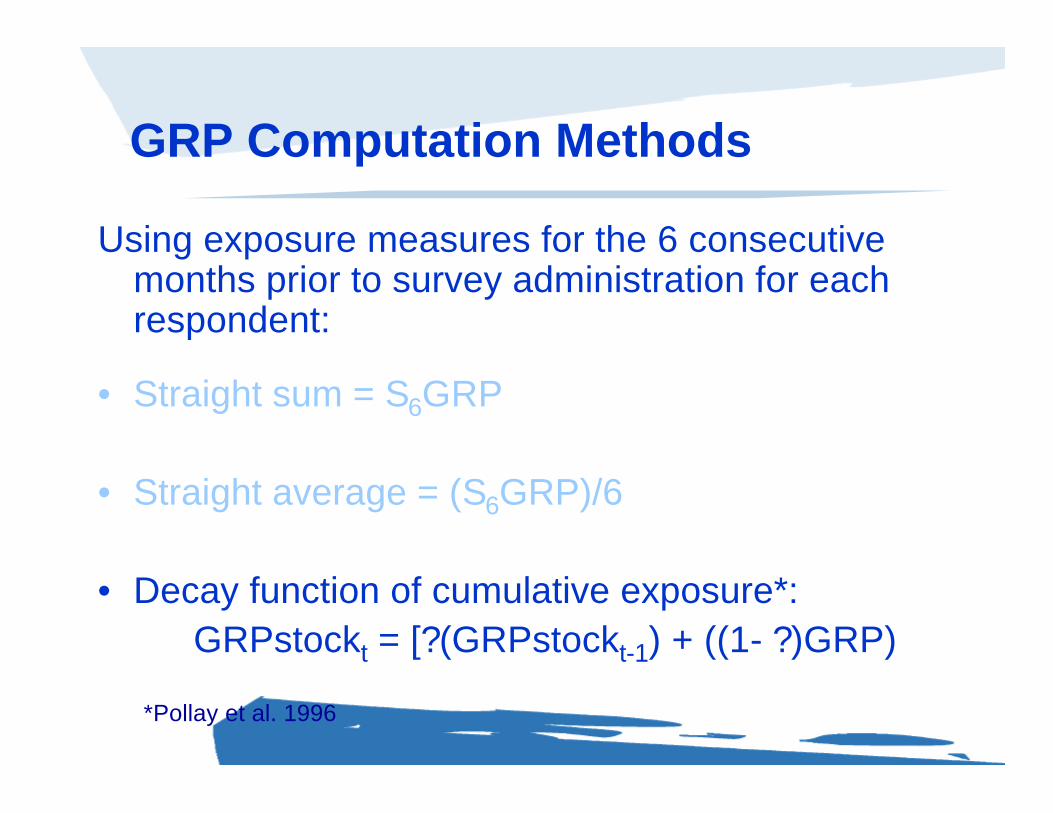
GRP Computation Methods
Using exposure measures for the 6 consecutivemonths prior to survey administration for eachrespondent:
• Straight sum = S6GRP
• Straight average = (S6GRP)/6
• Decay function of cumulative exposure*:GRPstockt = [?(GRPstockt-1) + ((1- ?)GRP)
*Pollay et al. 1996
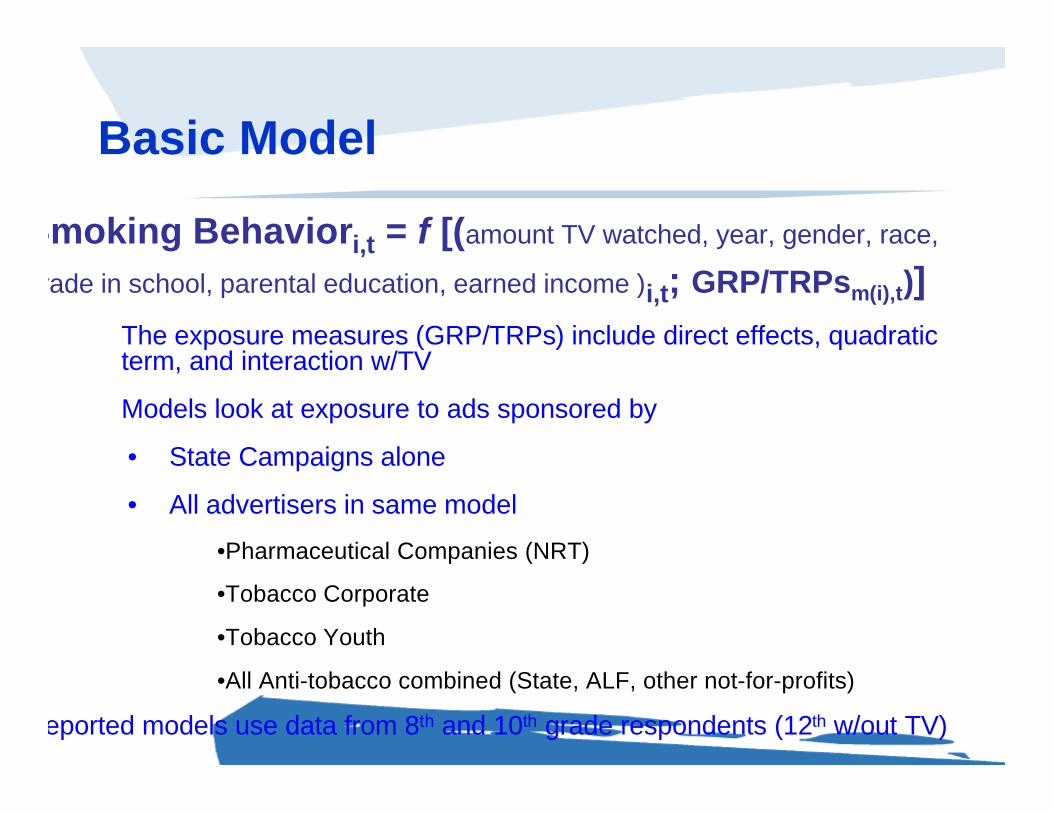
Basic Model
Smoking Behaviori,t = f [(amount TV watched, year, gender, race,
grade in school, parental education, earned income )i,t; GRP/TRPsm(i),t)]The exposure measures (GRP/TRPs) include direct effects, quadraticterm, and interaction w/TV
Models look at exposure to ads sponsored by
• State Campaigns alone
• All advertisers in same model
•Pharmaceutical Companies (NRT)
•Tobacco Corporate
•Tobacco Youth
•All Anti-tobacco combined (State, ALF, other not-for-profits)
Reported models use data from 8th and 10th grade respondents (12th w/out TV)
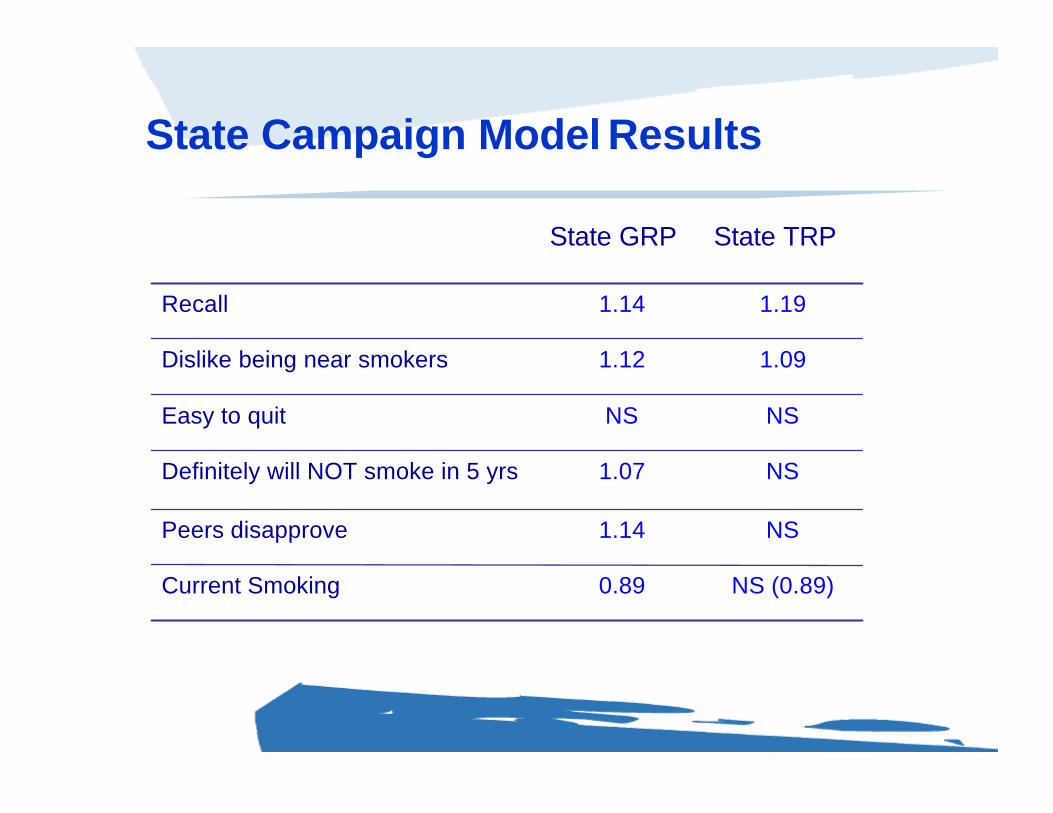
State Campaign Model Results
NS (0.89)0.89Current Smoking
NS1.14Peers disapprove
NS1.07Definitely will NOT smoke in 5 yrs
NSNSEasy to quit
1.091.12Dislike being near smokers
1.191.14Recall
State TRPState GRP
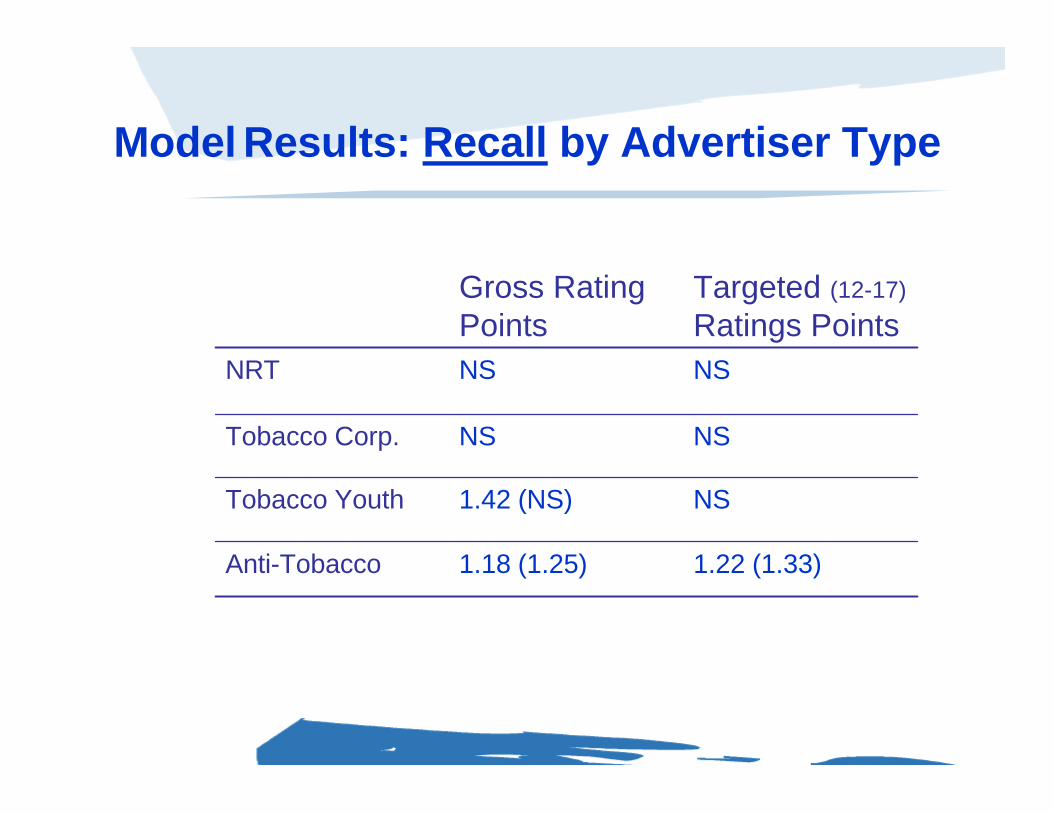
Model Results: Recall by Advertiser Type
NSNSNRT
1.22 (1.33)1.18 (1.25)Anti-Tobacco
NS1.42 (NS)Tobacco Youth
NSNSTobacco Corp.
Targeted (12-17)
Ratings PointsGross RatingPoints
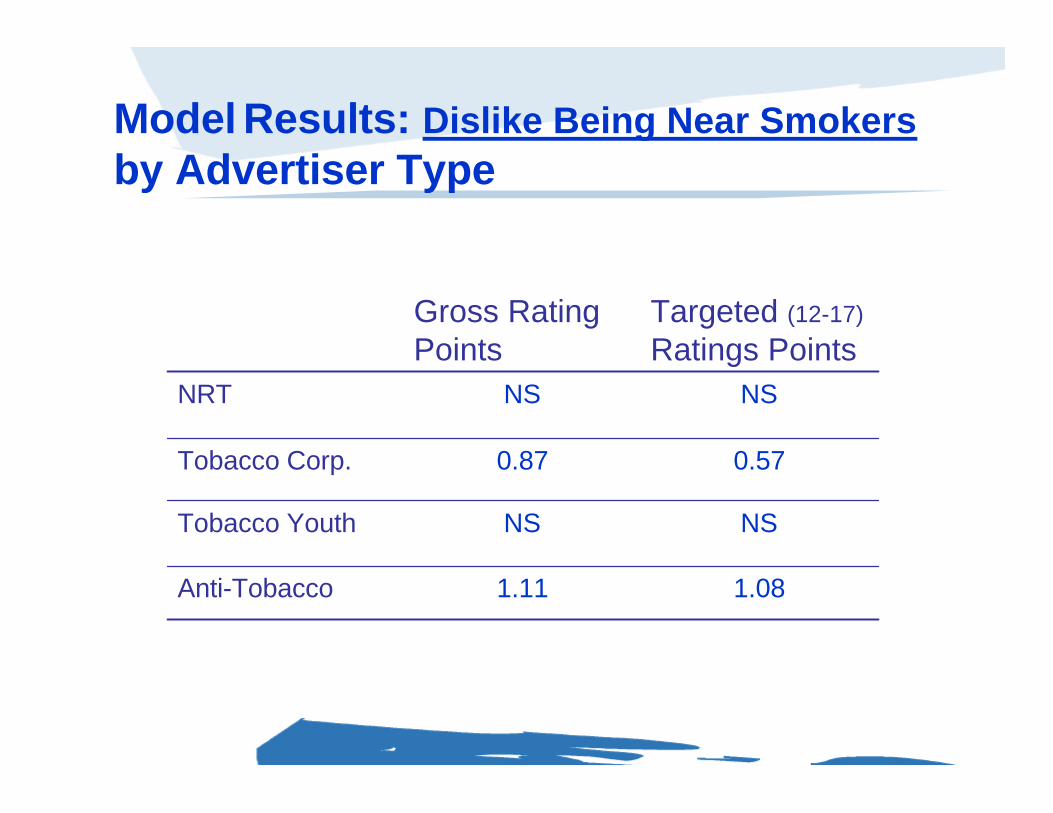
Model Results: Dislike Being Near Smokersby Advertiser Type
NSNSNRT
1.081.11Anti-Tobacco
NSNSTobacco Youth
0.570.87Tobacco Corp.
Targeted (12-17)
Ratings PointsGross RatingPoints
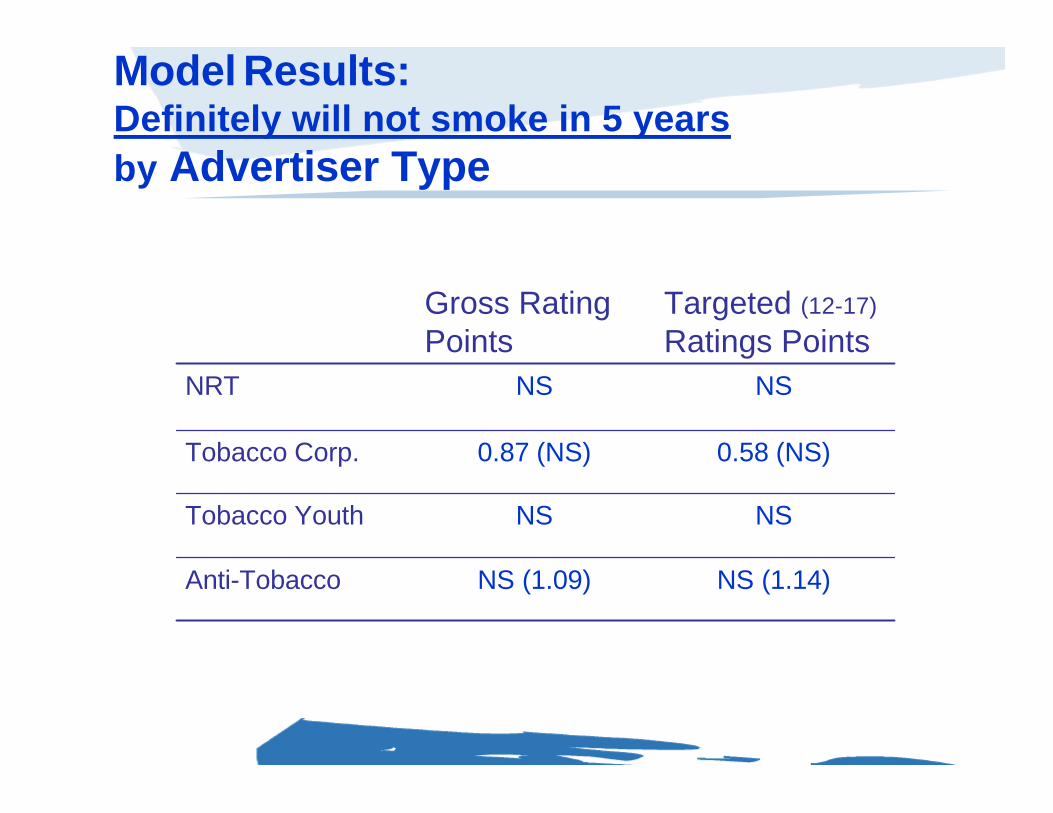
Model Results:Definitely will not smoke in 5 yearsby Advertiser Type
NRT
NS (1.14)NS (1.09)Anti-Tobacco
NSNSTobacco Youth
0.58 (NS)0.87 (NS)Tobacco Corp.
NSNS
Targeted (12-17)
Ratings PointsGross RatingPoints
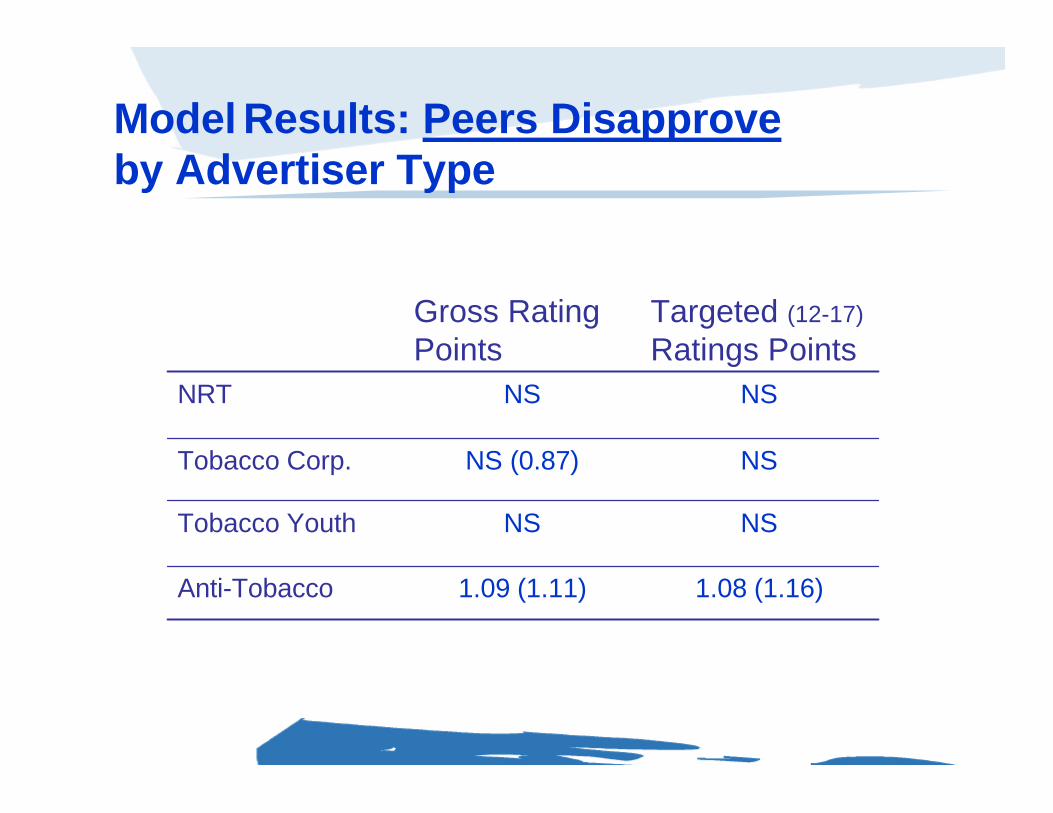
Model Results: Peers Disapproveby Advertiser Type
NSNSNRT
1.08 (1.16)1.09 (1.11)Anti-Tobacco
NSNSTobacco Youth
NSNS (0.87)Tobacco Corp.
Targeted (12-17)
Ratings PointsGross RatingPoints
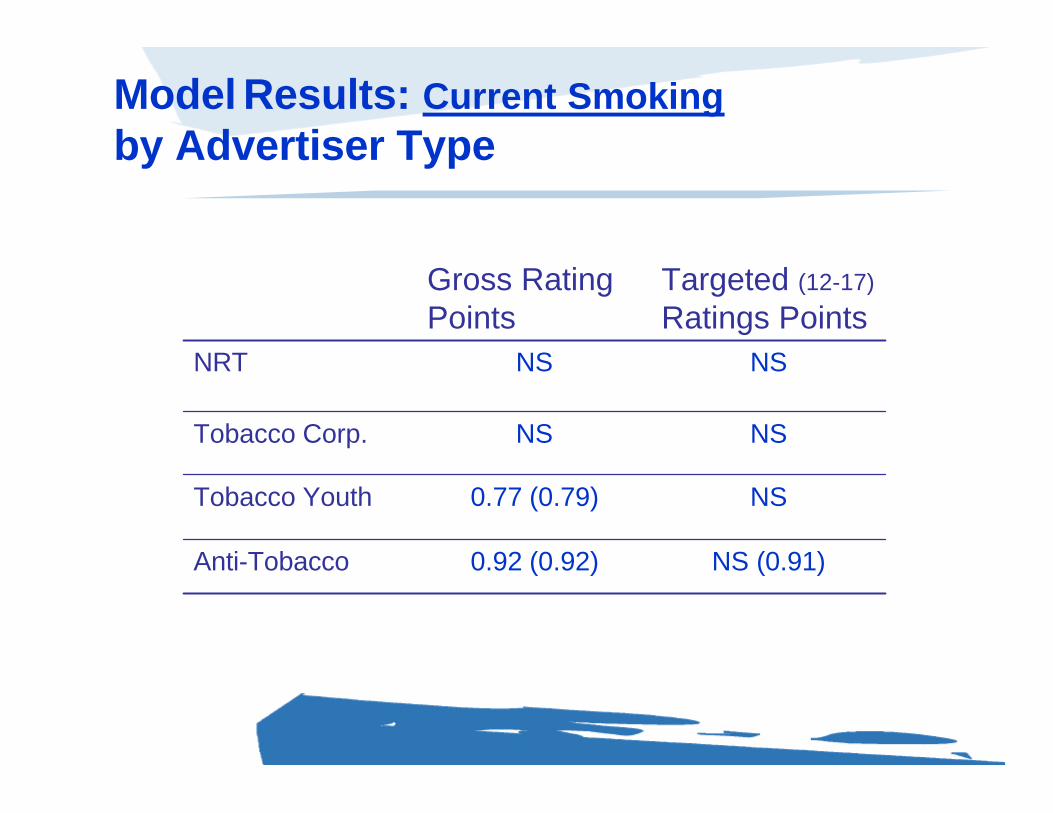
Model Results: Current Smokingby Advertiser Type
NSNSNRT
NS (0.91)0.92 (0.92)Anti-Tobacco
NS0.77 (0.79)Tobacco Youth
NSNSTobacco Corp.
Targeted (12-17)
Ratings PointsGross RatingPoints
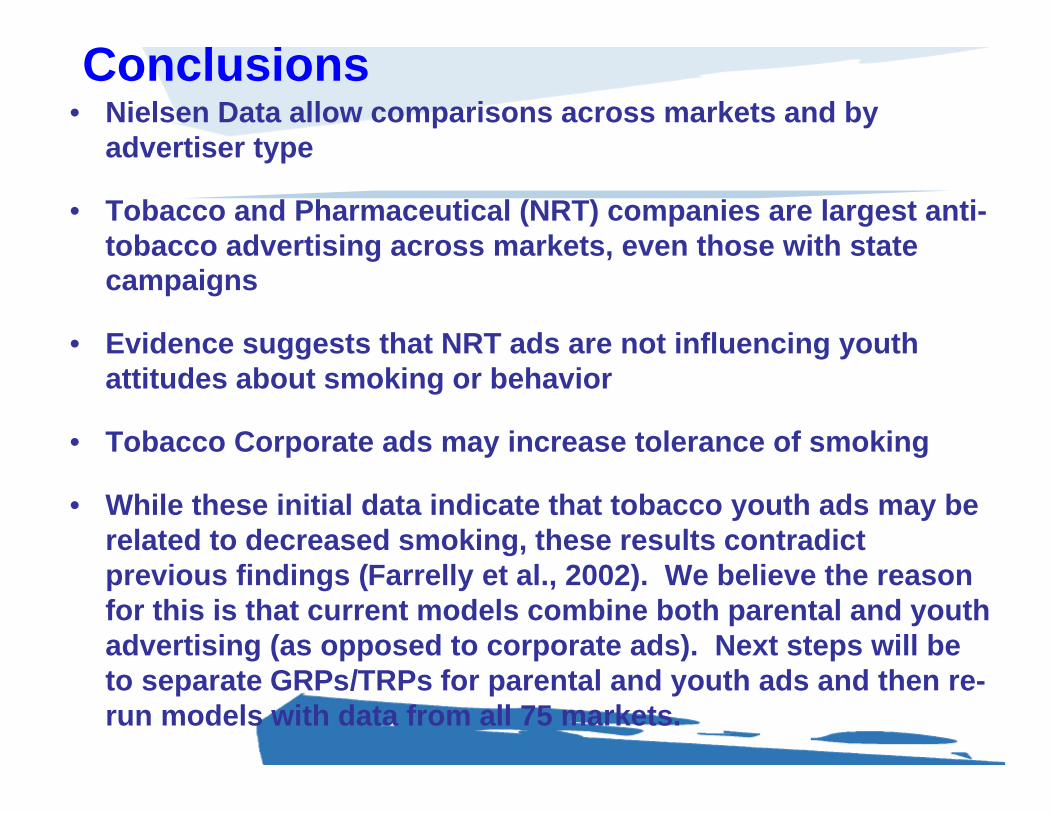
Conclusions• Nielsen Data allow comparisons across markets and by
advertiser type
• Tobacco and Pharmaceutical (NRT) companies are largest anti-tobacco advertising across markets, even those with statecampaigns
• Evidence suggests that NRT ads are not influencing youthattitudes about smoking or behavior
• Tobacco Corporate ads may increase tolerance of smoking
• While these initial data indicate that tobacco youth ads may berelated to decreased smoking, these results contradictprevious findings (Farrelly et al., 2002). We believe the reasonfor this is that current models combine both parental and youthadvertising (as opposed to corporate ads). Next steps will beto separate GRPs/TRPs for parental and youth ads and then re-run models with data from all 75 markets.
Conclusions, cont.
Higher exposure to state and other anti-smoking advertisers appears to beassociated with:
• Higher recall of anti-smoking ads
• Higher likelihood of reporting anti-smoking attitudes
• Reduced smoking
Recommended