Click to edit Master title style
TREC
Your Specialty Chemical Partner
May 30, 2018
Singular Research Spring Select Webcall

2
Safe Harbor
Statements in this presentation that are not historical facts are forwardlooking statements as defined in the Private Securities Litigation Reform Actof 1995. Forward looking statements are based upon Management's belief, aswell as, assumptions made by and information currently available toManagement. Because such statements are based upon expectations as tofuture economic performance and are not statements of fact, actual resultsmay differ from those projected. These risks, as well as others, are discussedin greater detail in Trecora Resources' filings with the Securities and ExchangeCommission, including Trecora Resources' Annual Report on Form 10-K for theyear ended December 31, 2017, and the Company‘s subsequent QuarterlyReports on Form 10-Q. All forward-looking statements included in thispresentation are based upon information available to the Company as of thedate of this presentation. The Company undertakes no obligation to publiclyupdate or revise any forward-looking statements after the date they aremade, whether as a result of new information, future events or otherwise.

3
Why Invest in Trecora?
Strong Base Business
Recent Capital Projects
Leading Positions in Key Markets
EBITDA Expected To Double By 2022
AMAK Monetization Opportunity
Focused Management Team
Focus on Operational Excellence to Drive Performance
4
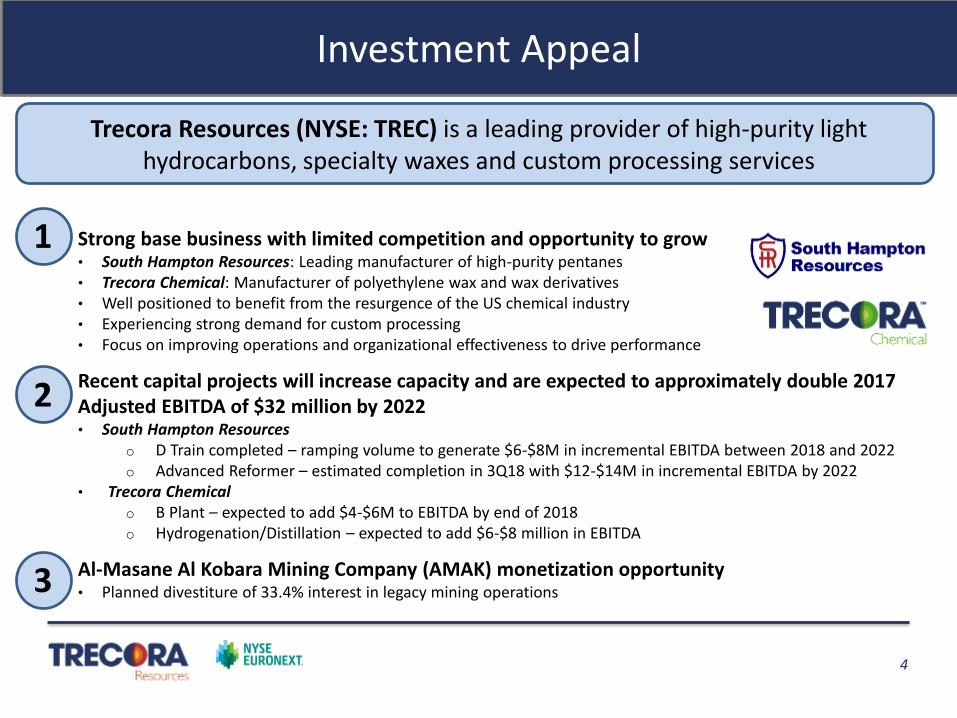
Investment Appeal
Trecora Resources (NYSE: TREC) is a leading provider of high-purity light hydrocarbons, specialty waxes and custom processing services
1. Strong base business with limited competition and opportunity to grow• South Hampton Resources: Leading manufacturer of high-purity pentanes• Trecora Chemical: Manufacturer of polyethylene wax and wax derivatives• Well positioned to benefit from the resurgence of the US chemical industry• Experiencing strong demand for custom processing• Focus on improving operations and organizational effectiveness to drive performance
2. Recent capital projects will increase capacity and are expected to approximately double 2017 Adjusted EBITDA of $32 million by 2022• South Hampton Resources
o D Train completed – ramping volume to generate $6-$8M in incremental EBITDA between 2018 and 2022o Advanced Reformer – estimated completion in 3Q18 with $12-$14M in incremental EBITDA by 2022
• Trecora Chemicalo B Plant – expected to add $4-$6M to EBITDA by end of 2018o Hydrogenation/Distillation – expected to add $6-$8 million in EBITDA
3. Al-Masane Al Kobara Mining Company (AMAK) monetization opportunity• Planned divestiture of 33.4% interest in legacy mining operations
1
2
3

5
Company Evolution
Transformation from an origin in mining … to a leading provider of specialty petrochemicals
1967 1987 2014
Company incorporated as Arabian Shield Development Company
Acquired Sinclair Oil Refinery – now operating as SHR
Acquired TC & changed name to TrecoraResources
Company executes $100 million in capital projects
2015 - 2018 2018 - 2022
• 2015 – D Train complete
• 2016 – B Plant Acquired
• 2017 – Hydrogenation/ Distillation unit complete
• 3Q18 – Advanced reformer to be completed
• Estimated incremental EBITDA from capital projects of $28 to $36 million by 2022
• Potential monetization of AMAK ownership
Well positioned for future growth

6
2018 Key Initiatives
~ 81.5% Revenues
~ 9.6% Revenues
~ 8.9% Revenues
Leading Manufacturer of High-Purity Pentanes
Manufacturer of Polyethylene Wax and Wax Derivatives
Start-up of Advanced Reformer unit expected in 3Q18
Custom processing growth at TC Solid production increase in 1Q18
B Plant and D Train ramping volumes
AMAK contributed positive equity in earnings in 1Q18 for a second consecutive quarter
Organizational changes announced in 1Q18 designed to focus on operational excellence

7
Financial Summary
$25.0
$33.0
$47.3
$31.0 $31.7
$-
$10.0
$20.0
$30.0
$40.0
$50.0
2013 2014 2015 2016 2017
$13.2
$80.4 $81.2 $83.3
$99.1
$-
$20.0
$40.0
$60.0
$80.0
$100.0
$120.0
2013 2014 2015 2016 2017
$13.2
$23.2
$39.6
$28.5 $30.8
$-
$10.0
$20.0
$30.0
$40.0
$50.0
$60.0
2013 2014 2015 2016 2017Cash Flow from Operations Cap Ex
Adjusted EBITDA ($mm)
Cash Flow from Operations and Capex ($mm) Total Debt ($mm)
2017 Total Revenues $245.2 Million
7.3%9.7%
83%
TC & SHR CustomProcessing
TC SpecialtySynthetic Waxes
SHR High PurityLightHydrocarbons

8
South Hampton Resources Specialty Petrochemical Segment
Leading manufacturer of high-purity light hydrocarbons• First quarter 2018 prime product volume
increased 27.1% from first quarter 2017
• Blue Chip customer base
Market leader with approximately 60% market share and only 1 competitor in high-purity pentanes
Easy access to major transportation networks

9
SHR: Blue Chip Customers

10
SHR: Growth Drivers
Total Product Sold
New polyethylene plants in North America• Adding 8.0 million metric tons/year of
manufacturing capacity by 2020
• 40% increase over current capacity
• Cost advantage driving polyethylene exports
Second Canadian oil sands customer up and running; expect volumes second half of 2018
Global growth (including Asia)
New product volumes increasing
Major capital projects complete• D Train: Three production trains provide
significantly more flexibility and reliability
• Capacity allows for new product development
0
10
20
30
40
50
60
70
2011 2012 2013 2014 2015 2016 2017
(Mill
ion
s o
f ga
ls)
Prime Products By Products
2017 EBITDA of $36.7 million up 15.1% year-over-year; 1Q18 EBITDA of $8.4 million up 4.4% from 1Q17

11
SHR: Advanced Reformer UpdateCatalyst to EBITDA Growth
At $58 million, our largest capital project designed to produce a significantly higher value-added byproduct stream
At current prices, upgraded byproduct increases value by approximately 40 cents per gallon Commissioning expected by third quarter 2018 Repairs after February 14, 2018 fire on schedule Insurance claims process is proceeding well
March 2, 2018 April 30, 2018

12
Trecora Chemical Specialty Waxes Segment
Manufactures polyethylene wax and wax derivatives
• 2017 Revenues: $34.8 million; 1Q18 Revenues: $6.4 million
Wax Markets
• Hot Melt Adhesives & PVC Lubricants • Volumes in these markets in 1Q18 up 34% from
4Q17
Strong feedstock supply network
Organizational changes implemented in 1Q18; catalyst for driving operational excellence
• 1Q18 shows improvement in B-plant and Hydrogen unit throughputs
Revenues Volumes
-
2,000
4,000
6,000
8,000
10,000
12,000
$-
$1,000
$2,000
$3,000
$4,000
$5,000
$6,000
$7,000
2Q16 3Q16 4Q16 1Q17 2Q17 3Q17 4Q17 1Q18
Wax Revenues($) Wax Volume (Lbs)
Wax Volume and Revenue Overview

13
TC: Hydrogenation/Distillation Project Completed
Hydrogenation/Distillation Unit
• Leverage existing relationships with petrochemical customers and generate new custom processing business
• Hydrogenation/Distillation Unit generated revenue of $300K in 1Q18 as production ramps
Catalyst to EBITDA Growth
• $25 million investment
• Expect additional $6-$8 M/year in EBITDA run date by end of 2018

14
Custom Processing Overview
Convert feedstock into value-added products based upon customer specifications• Customers supply and maintain title to
feedstock
Contractual take or pay agreements with high operating margins• Significant operating leverage above
break-even
Adding process capabilities that are in short supply in the region• Will benefit from the resurgence in
U.S. Chemicals
In Thousands
Custom Processing Revenues
$-
$500
$1,000
$1,500
$2,000
$2,500
$3,000
$3,500
2Q16 3Q16 4Q16 1Q17 2Q17 3Q17 4Q17 1Q18
TC SHR

15
Total Potential Incremental Annual
EBITDA Estimate:
$28 million - $36 million by 2022
Significant Capital Projects Nearly Complete
D TrainAdd: $6-8M as vol. ramps up 2018 - 2022
Advanced Reformer
Add: $12-14M 2018 - 2022
B Plant
Add: $4-6M 2018
Hydrogenation/DistillationAdd: $6-8M 2018 - 2019
South Hampton
TrecoraChemical
Completed: Sept 2015 Estimated: 3Q18
Completed: 2Q17Completed: June 2016
Capex: $30M Capex: $58M
Capex: $25MCapex: $2M
• Capital projects funded from operating cash flow and revolver borrowings• Total liquidity of $13M (3/31/18)
16
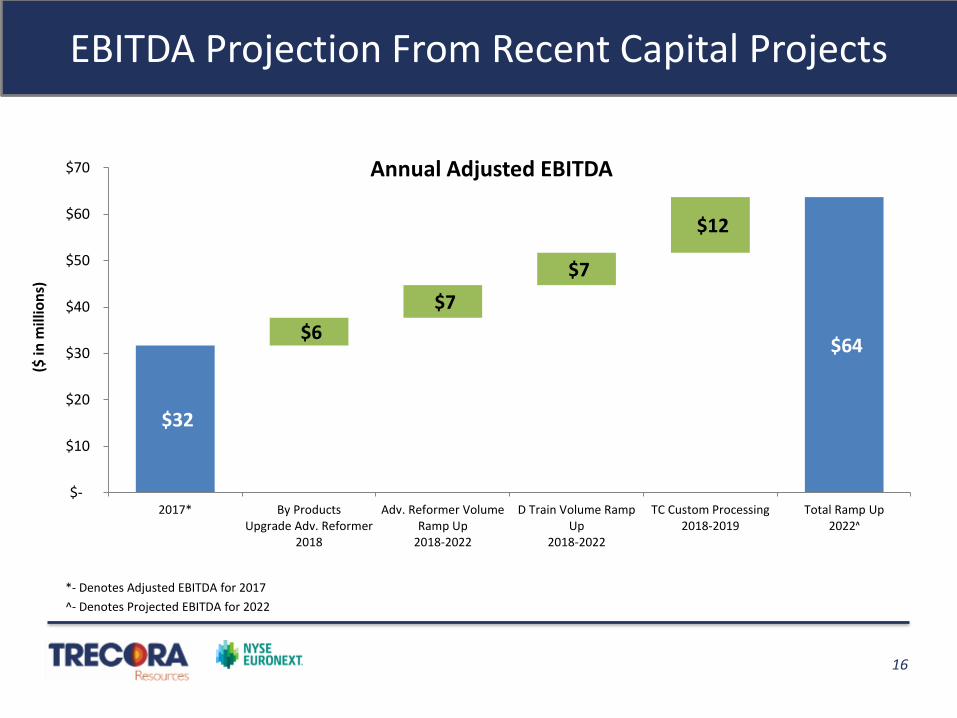
EBITDA Projection From Recent Capital Projects
*- Denotes Adjusted EBITDA for 2017
^- Denotes Projected EBITDA for 2022
($ in
mill
ion
s)
$32 $32 $38
$45 $52
$64 $6
$7
$7
$12
$-
$10
$20
$30
$40
$50
$60
$70
2017* By ProductsUpgrade Adv. Reformer
2018
Adv. Reformer VolumeRamp Up
2018-2022
D Train Volume RampUp
2018-2022
TC Custom Processing2018-2019
Total Ramp Up2022ᶺ
Annual Adjusted EBITDA

17
AMAK Mine Update
Operations
• 10,000 dmt sold in 1Q18 (vs. 20,000 dmt during 4Q17 – sequential decline due to timing of stockpile delivery to market)
• Equally split between copper concentrate and zinc concentrate
• Concentrate quality, throughput rates and recoveries continued steady progress
• Equity in earnings of $0.2 million in 1Q18
Exploration
• Drilling continues in Guyan and surrounding areas with a similar geological profile
• Guyan gold project developing as scheduled
• Procurement and Construction Starts 3Q18
• Commission Guyan Gold Project in 1H19
• Drilling continues for Al Masane copper and zinc
• Reserves update in the 10-K. 8 years for Life of Mine, with expectation to extend significantly by year-end

18
Investment Summary
Opportunity to double 2017 Adjusted EBITDA by 2022 by leveraging recent capital projects
Strong core specialty chemical company addressing expanding profitable market opportunities Investing in higher margin businesses
Internationally competitive in high-growth developed and emerging markets
• Footprint in Canada, Middle East and Asia, and expanding into additional markets
Organizationally aligned to transition culture into one of operational excellence to drive growth and EBITDA contribution Hydrogenation revenue beginning to ramp
AMAK monetization opportunity Objective is financial exit which could generate significant cash
Equity earnings contribution in 1Q18 for the second consecutive quarter

19
Q&A
Please visit our websites:
www.trecora.com
www.southhamptonr.com
www.TrecChem.com
www.amak.com.sa
Thank You

20
TREC 1Q 2018 Income Statement
THREE MONTHS
ENDED
MARCH 31, 2018 2017
(thousands of dollars)
REVENUES
Petrochemical and Product Sales $ 66,699 $ 50,899
Processing Fees 5,042 4,643
71,741 55,542
OPERATING COSTS AND EXPENSES
Cost of Sales and Processing
(including depreciation and amortization of $2,830 and $2,383, respectively) 61,601 44,924
GROSS PROFIT 10,140 10,618
GENERAL AND ADMINISTRATIVE EXPENSES
General and Administrative 6,335 6,221
Depreciation 196 205
6,531 6,426
OPERATING INCOME 3,609 4,192
OTHER INCOME (EXPENSE)
Interest Income 7 2
Interest Expense (878) (636)
Equity in Earnings (Losses) of AMAK 230 (966)
Miscellaneous Expense (26) (44)
(667) (1,644)
INCOME BEFORE INCOME TAXES 2,942 2,548
INCOME TAXES 590 1,061
NET INCOME 2,352 1,487
NET LOSS ATTRIBUTABLE TO NONCONTROLLING INTEREST -- --
NET INCOME ATTRIBUTABLE TO TRECORA RESOURCES $ 2,352 $ 1,487
Basic Earnings per Common Share
Net Income Attributable to Trecora Resources (dollars) $ 0.10 $ 0.06
Basic Weighted Average Number of Common Shares Outstanding 24,343 24,240
Diluted Earnings per Common Share
Net Income Attributable to Trecora Resources (dollars) $ 0.09 $ 0.06
Diluted Weighted Average Number of Common Shares Outstanding 25,231 25,054

21
TREC Adjusted EBITDA Calculation
3/31/2018 12/31/2017 9/30/2017 6/30/2017 3/31/2017 12/31/2017 12/31/2016
NET INCOME (LOSS) 2,352$ 13,972$ 1,718$ 832$ 1,487$ 18,009$ 19,428$
Interest 878 822 795 678 636 2,931 1,985
Taxes 590 (9,129) 577 332 1,061 (7,159) 10,504
Depreciation and amortization 196 217 246 205 204 872 761
Depreciation and amortization in cost of sales 2,829 2,778 2,564 2,363 2,384 10,089 9,016
EBITDA 6,846 8,660 5,900 4,410 5,772 24,742 41,694
Share based compensation 592 702 716 656 633 2,707 2,552
Bargain purchase gain - - - - - - (11,549)
Gain from additional equity issuance by AMAK - - - - - - (3,168)
Equity in losses of AMAK (230) (900) 897 3,298 966 4,261 1,479
Adjusted EBITDA 7,208$ 8,462$ 7,513$ 8,364$ 7,371$ 31,710$ 31,008$
Revenue 71,741 65,978 61,508 62,115 55,542 245,143 212,399
Adjusted EBITDA Margin (adjusted EBITDA/revenue) 10.0% 12.8% 12.2% 13.5% 13.3% 12.9% 14.6%
Twelve months endedThree months ended(In Thousands)

22
TREC Balance Sheet as of 1Q 2018
MARCH 31, DECEMBER 31, MARCH 31, DECEMBER 31,
2018 2017 2018 2017
(unaudited) (unaudited)
ASSETS LIABILITIES
Current Assets Current Liabilities
Cash $2,568 $3,028 Accounts payable $14,888 $18,347
Trade receivables, net 27,421 25,779 Accrued liabilities 4,229 3,961
Insurance receivable 742 -- Current portion of post-retirement benefit 302 305
Inventories 15,691 18,450 Current portion of long-term debt 8,061 8,061
Prepaid expenses and other assets 5,131 4,424 Current portion of other liabilities 889 870
Taxes receivable 5,481 5,584 Total current liabilities 28,369 31,544
Total current assets 57,034 57,265
Long-term debt, net of current portion 99,031 91,021
Plant, pipeline and equipment, net 190,139 181,742 Post-retirement benefit, net of current portion 897 897
Other liabilities, net of current portion 1,374 1,611
Goodwill 21,798 21,798 Deferred income taxes 17,670 17,242
Intangible assets, net 20,343 20,808 Total liabilities 147,341 142,315
Investment in AMAK 45,224 45,125
Mineral properties in the United States 588 588 EQUITY
Common stock‑authorized 40 million shares of $.10 par value; issued 24.5
TOTAL ASSETS $335,126 $327,326 million in 2018 and 2017 and outstanding 24.3 million shares in 2018 and 2017
Additional paid-in capital 56,422 56,012
Common stock in treasury, at cost -184 -196
Retained earnings 128,807 126,455
Total Trecora Resources Stockholders’ Equity 187,496 184,722
Noncontrolling Interest 289 289
Total equity 187,785 185,011
TOTAL LIABILITIES AND EQUITY $335,126 $327,326
(thousands of dollars)
2,451 2,451
(thousands of dollars)
Recommended


![[Customer Name Here] Specialty Tool Partner](https://img.pdfslide.us/doc/110x75/56812e93550346895d9434a1/customer-name-here-specialty-tool-partner.jpg)