1
Process Mapping
“You cannot improve a process until everyone agrees on what the process
is.”
2
Topics
I. What is a Process Map?
II. Types of Process MapsA. Process Flow Chart B. SIPOC DiagramC. Value Stream Map
III. Value-Add (VA) and Non-Value Add (NVA)
IV. Current State and Future State Maps
V. Process Mapping Case Study“Construction Equipment Rental Center”

3
I. Process Mapping
Process map (type of flow chart) – is a visual representation of process work-flow. Either:
High level system flow, orDetailed work flow within a system
Process maps help facilitate a greater understanding of a process by identifying:
Bottlenecks.Redundancies.WasteKey process inputs and outputs.Key decision points and criteria.Roles and responsibilities.

4
Creating EffectiveProcess Maps
Provide Details!! – organizations often create flow charts of process steps, but effective maps support analysis by including useful data.
Useful Data Examples: Setup time, wait time, processing time, travel distance between tasks, method of information travel, # staff, decision criteria, key input variables.
Note: Lean / Six Sigma both require effective process mapping.

5
How Complicated?
Toughest challenge in process mapping is determining the level of detail.
Unfortunately, the answer is:“As detailed as necessary for people to understand the process.”
6
Paper and Pencil Vs. Computer Software
Several six sigma and lean specialists recommend drawing process maps on paper with a pencil and an eraser.
Drawing by hand:Is faster.Demonstrates that you can create the map yourself.Gets you closer to the process to better understand what is happening.Emphasizes the “process map”, not computer skills.

7
II. Types of Process Maps
A. Process Flow Chart
B. SIPOC Diagram
C. Value Stream Map
8
A. Process Flow Chart
A diagrammatic picture showing all steps or stages in a process.
Flow charts help facilitate a greater understanding of the entire process by identifying where problems have occurred or may occur.
9
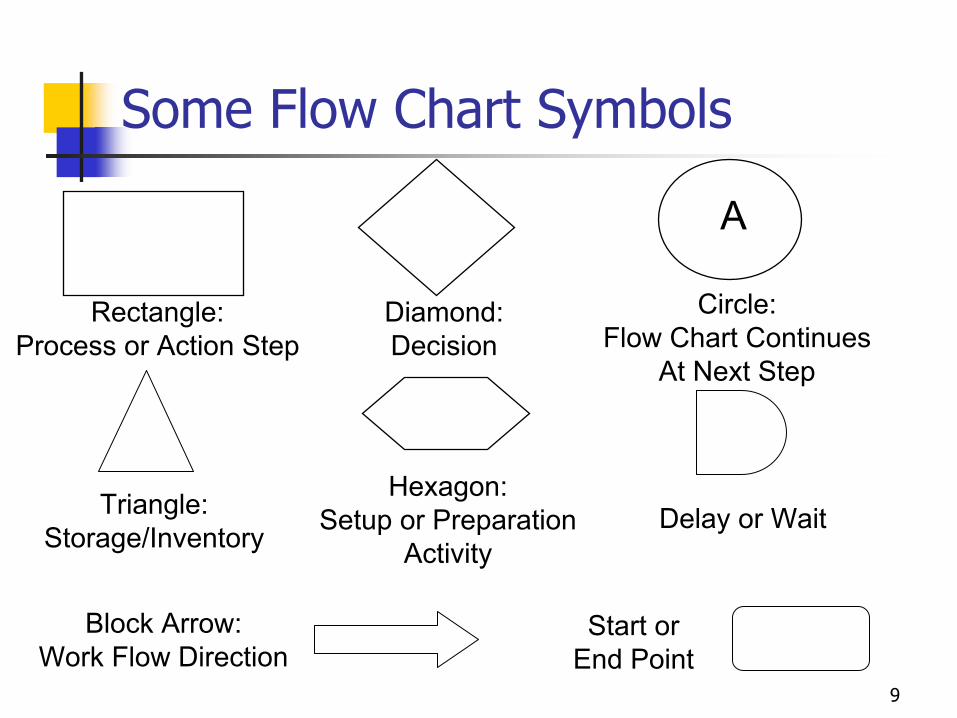
Some Flow Chart Symbols
Rectangle:Process or Action Step
Diamond:Decision
Circle:Flow Chart Continues
At Next Step
A
Hexagon:Setup or Preparation
ActivityDelay or WaitTriangle:
Storage/Inventory
Block Arrow:Work Flow Direction
Start orEnd Point
10
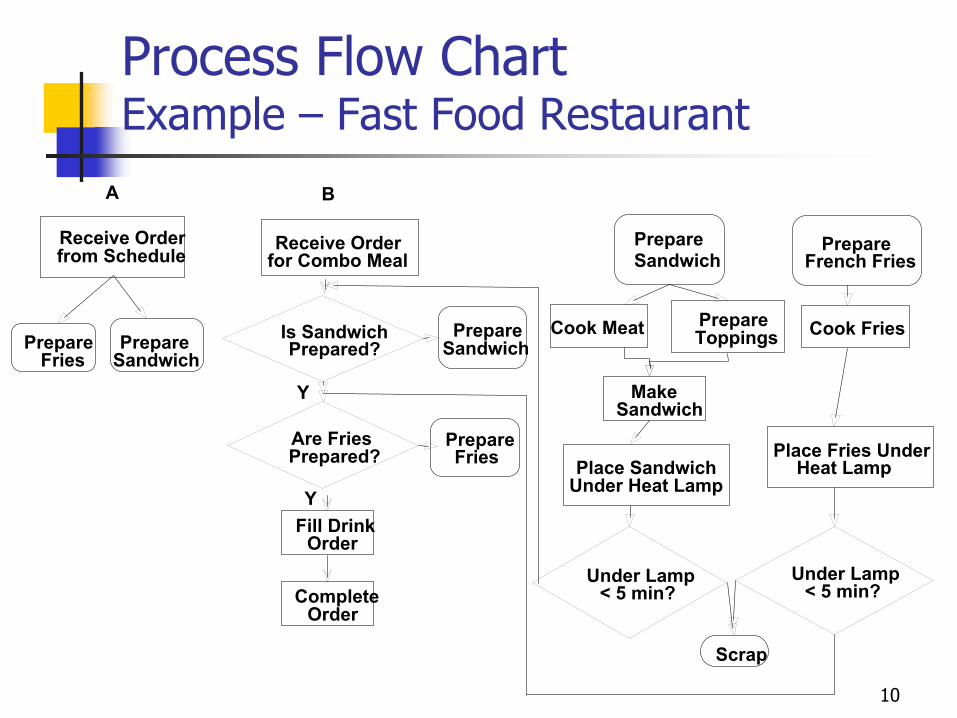
Process Flow Chart Example – Fast Food Restaurant
Receive Orderfor Combo Meal
Is SandwichPrepared?
Are FriesPrepared?
Fill DrinkOrder
Y
Cook Meat Cook FriesPrepareToppings
CompleteOrder
MakeSandwich
PrepareSandwich
Place SandwichUnder Heat Lamp
Under Lamp< 5 min?
Under Lamp< 5 min?
Place Fries UnderHeat Lamp
Scrap
PrepareFrench Fries
PrepareSandwich
PrepareFries
B
Y
Receive Orderfrom Schedule
PrepareSandwich
PrepareFries
A
11
B. SIPOC Diagram
Supplier, Inputs, Process, Outputs, Customer
Process for Creating SIPOC DiagramMap process into critical steps (4 – 5 main functions).Identify Customers that Receive Outputs Identify Process Outputs (Metrics)
Work with customer to develop requirements --separate key requirements from others.
Identify Inputs that affect this process.Identify Suppliers of the process inputs.

12
SIPOC Diagram
Suppliers Inputs Process Outputs Customer
• ..• ..• ..
• ..• ..• ..
• ..• ..• ..
• ..• ..• ..
Step 1 Step 2 Step 4Step 3
13
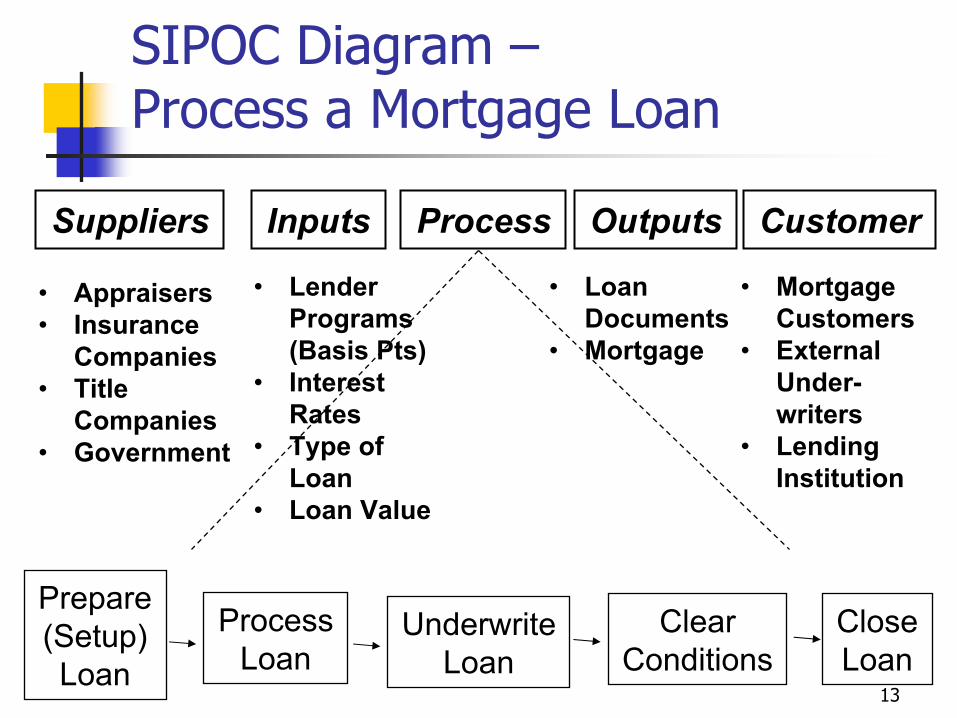
SIPOC Diagram –Process a Mortgage Loan
Suppliers Inputs Process Outputs Customer
• Appraisers• Insurance
Companies• Title
Companies• Government
• Lender Programs (Basis Pts)
• Interest Rates
• Type of Loan
• Loan Value
• Loan Documents
• Mortgage
• Mortgage Customers
• ExternalUnder-writers
• Lending Institution
Prepare(Setup)Loan
ProcessLoan
UnderwriteLoan
CloseLoan
ClearConditions

14
C. Value Stream Map (VSM)Value stream – all of the actions (value and non-value added) required to get a product to the customer or complete a service.
Service flow ~ from order to delivery. Design flow ~ from concept to launch.Production flow ~ from raw material to finished goods.
Value stream maps typically focus on entire system flow or major subsystems – not just an individual process or operation.
15
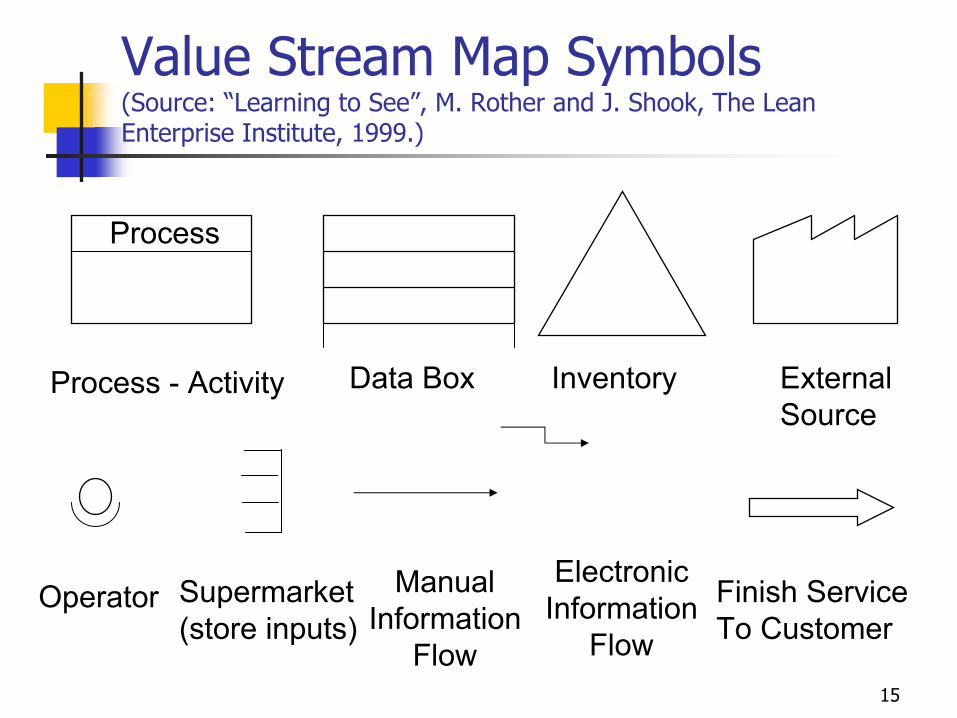
Value Stream Map Symbols(Source: “Learning to See”, M. Rother and J. Shook, The Lean Enterprise Institute, 1999.)
Process
Process - Activity Data Box Inventory
Operator ManualInformation
Flow
ElectronicInformation
Flow
Finish ServiceTo Customer
ExternalSource
Supermarket(store inputs)

16
Value Stream Map“Data/Inventory Box Examples”
Data Box – Internal Loan Processing
Inventory
C/T: 20-30 min2 Operators5% Errors
I30 loans
Inventory
I0-20 calls
C/T – time to complete task
17
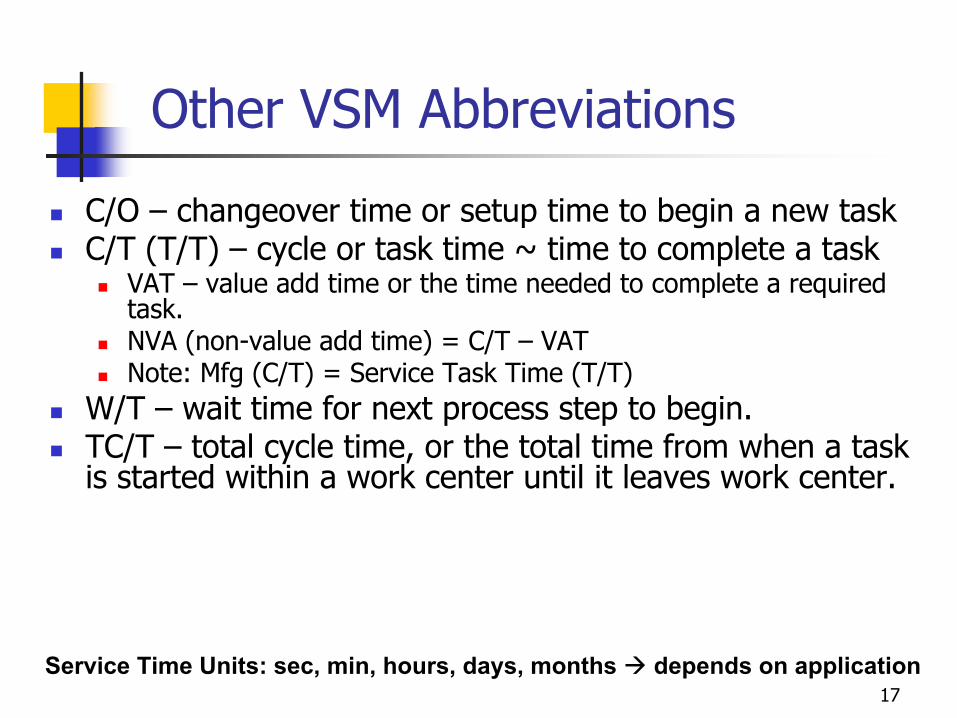
Other VSM Abbreviations
C/O – changeover time or setup time to begin a new taskC/T (T/T) – cycle or task time ~ time to complete a task
VAT – value add time or the time needed to complete a required task.NVA (non-value add time) = C/T – VATNote: Mfg (C/T) = Service Task Time (T/T)
W/T – wait time for next process step to begin. TC/T – total cycle time, or the total time from when a task is started within a work center until it leaves work center.
Service Time Units: sec, min, hours, days, months depends on application
18
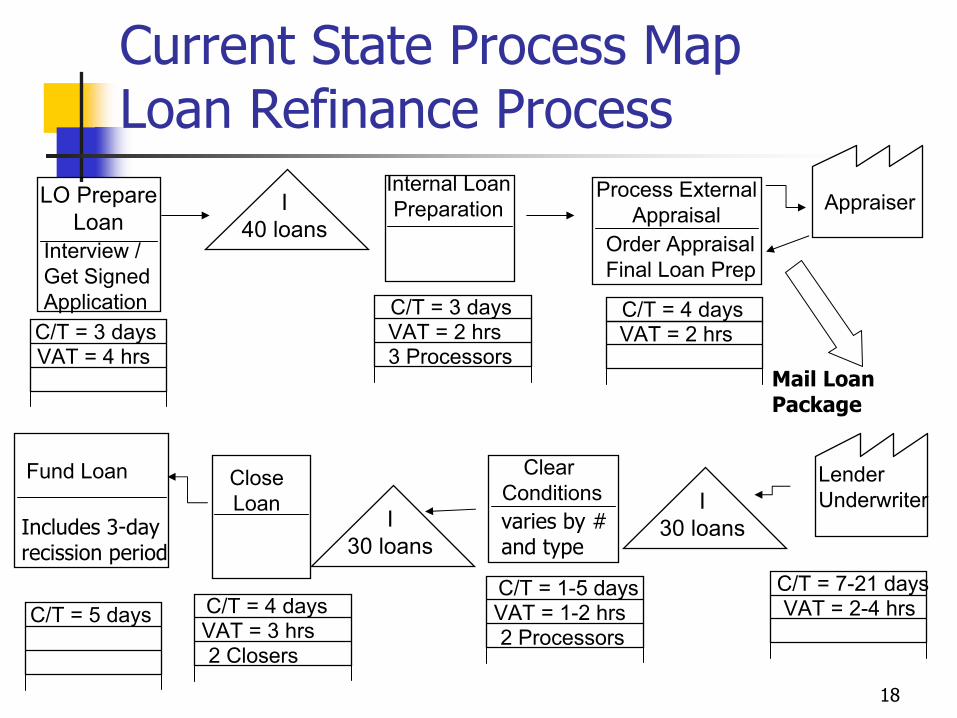
Current State Process Map Loan Refinance Process
LO PrepareLoan
Internal LoanPreparation
C/T = 3 days
Process ExternalAppraisal
Order AppraisalFinal Loan Prep
Clear Conditions
CloseLoan
Fund Loan
Includes 3-day recission period
Mail LoanPackage
varies by # and type
I40 loans
VAT = 2 hrs
Appraiser
LenderUnderwriter
3 Processors
C/T = 4 daysVAT = 2 hrsC/T = 3 days
Interview /Get SignedApplication
VAT = 4 hrs
C/T = 7-21 daysVAT = 2-4 hrs
C/T = 1-5 daysVAT = 1-2 hrs2 Processors
I30 loans
C/T = 5 days
I30 loans
C/T = 4 daysVAT = 3 hrs2 Closers

19
III. Value Add Vs. Non-Value Add Time
Identify the value add time (VAT) to meet customer expectations.
Non-Value Add Time (NVA) = Cycle Time (C/T) – Value Add Time (VAT)
In the prior example, identify some non-value add times.
20
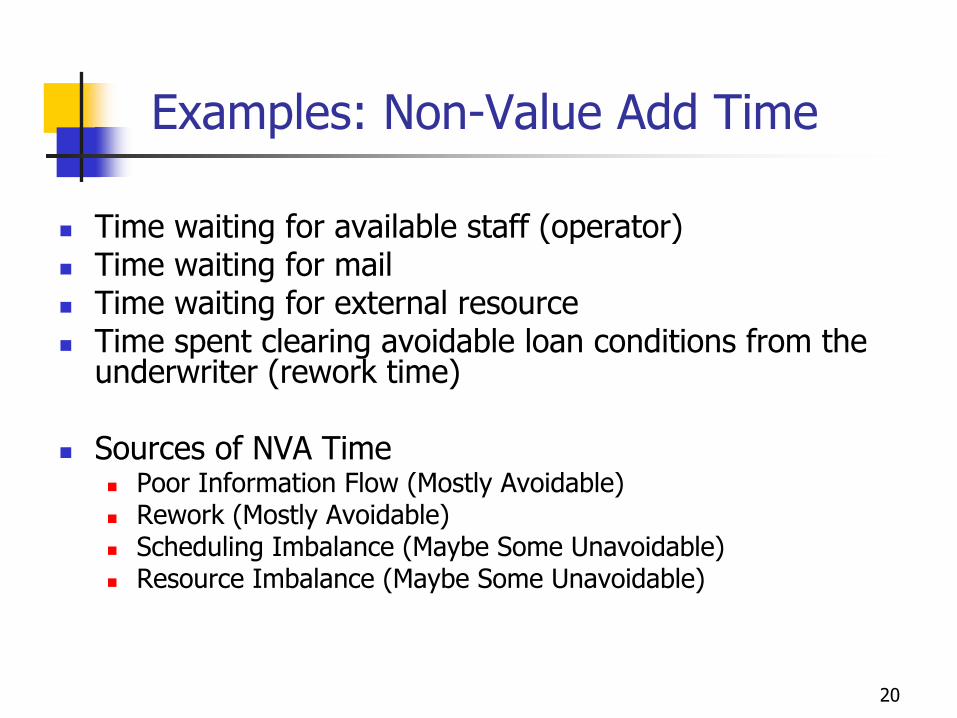
Examples: Non-Value Add Time
Time waiting for available staff (operator)Time waiting for mailTime waiting for external resourceTime spent clearing avoidable loan conditions from the underwriter (rework time)
Sources of NVA Time Poor Information Flow (Mostly Avoidable)Rework (Mostly Avoidable)Scheduling Imbalance (Maybe Some Unavoidable)Resource Imbalance (Maybe Some Unavoidable)

21
Total Cycle Time (Value and Non-Value Add)
TC/T is the total time from start to finish.
(time in system)How much time is VA?
Hint: refer to VSM
Task* VAT/NVA Time (hrs) Time (days)Loan Prep - Wait Customer Information NVA 20 2.5Loan Prep - Prepare Documents VAT 4 0.5Wait for Processor to be Available NVA 16 2Internal Processing (Prepare Package/ Order Appraisal)
VAT 2 0.25Internal Processing (Get Missing Info) NVA 6 0.75Wait for Appraisal NVA 22 2.75Update Loan Package with Appraisal VAT 2 0.25Mail Loan Package to Underwriter NVA 8 1Wait for Underwriter Resource NVA 142 17.75Underwrite (Approve) Loan VAT 2 0.25Clear Conditions (Avoidable Errors) NVA 20 2.5Clear Conditions (Unavoidable Issues) VAT 4 0.5Wait for Closing Date NVA 29 3.625Close Loan VAT 3 0.375Submit Loan for Funding NVA 8 1Funding (regulation) VAT 40 5
Total Time in System 328 41% VAT 17%
* Assumes 1 day = 8 hours
220% 10% 20% 30% 40% 50% 60% 70% 80% 90% 100%
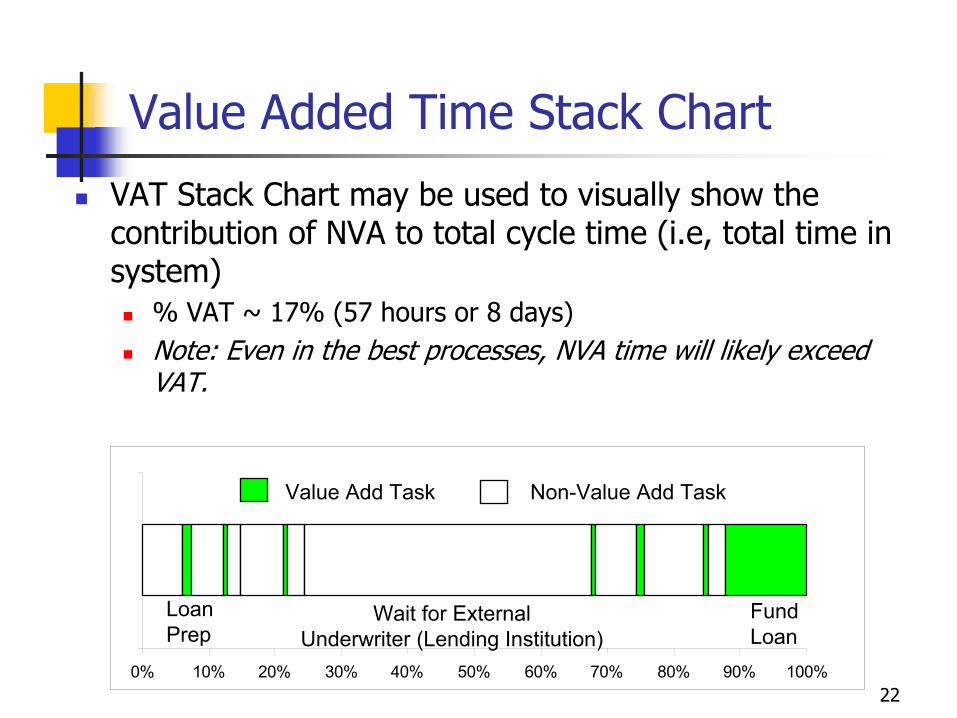
Value Added Time Stack Chart
VAT Stack Chart may be used to visually show the contribution of NVA to total cycle time (i.e, total time in system)
% VAT ~ 17% (57 hours or 8 days)Note: Even in the best processes, NVA time will likely exceed VAT.
Value Add Task Non-Value Add Task
LoanPrep
Wait for ExternalUnderwriter (Lending Institution)
FundLoan

23
Takt Time Vs. Cycle (Task) Time
Cycle (Task) Time often is related to resource availability and efficiency (e.g., equipment or staff availability)
Note: This differs from Takt Time (Lean Term)!
Takt time –Time needed to match the Next Process Customer demand rate for a product or service (takt – German Origin for orchestra baton used to regulate musical beat ~ “beat time”)
Example: # Loan Applicants per Day may be used to determine how many resources are needed. Thus, this demand rate will affect the wait time elements within the Total Task Time.
See Module on Service Throughput ModelingLoan Example: Takt time = 25 days (200 hours)
Since demand will likely fluctuate, we often normalize takt time by month or quarter to create a planned time to maintain quasi “level scheduling”Note: Takt time is not equal to VAT (i.e, you may plan some inventory queues to better utilize resources due to scheduling imbalances.)

24
IV. Current & Future State Maps
In creating process maps, one should draw both a current ANDfuture state map.
Future state maps provide:Vision of what the process flow should look like (recommended process flow).May need goals for current process evaluation metrics.
Examples: less than 1 defect per million OR 2 days of inventory,process order in 2 weeks, etc.)
Note: future state maps are not static -- they may change based on new customer demand rate / new technology availability, ...

25
Improvement Never Ends
Drawing your future state map is not the end of the process – you must implement it!
Review of Value Stream Mapping Process:Draw the Current State Map.Draw the Future State Map.Implement the New Process Flow / Business Rules.Re-Draw Current State Map and begin again.

26
V. Process Mapping Exercise“Construction Equipment Rental Center”
Case Study:A large construction equipment rental company maintains a national network of sales and distribution centers for equipment rental (e.g., excavators, cranes, dozers, lifts, .)Main Customers: Small ContractorsBasic Rental Order Process:
Sales Coordinator receives an order and issues a job card. Various equipment are then obtained either from local branch center, another distribution center or repair center. The order is then gathered at the desired customer delivery center.
To perform this task, you need several inputs including:List of Company Rental Equipment, Equipment Availability Schedule of Local Center, Access to Other Center’s Equipment Availability, Distance Between Centers.
Current Performance: 20% of orders take longer than 1 week to process. (Goal: 95% orders filled < 1 week).Main Customer Complaints: time to fill order, equipment that is not working properly (poorly maintained)

27
Exercises
Based on the case study information provided, create the following:1. SIPOC Diagram2. Current State Process Flow Chart
Identify VA and NVA activities3. Future State Process Flow Chart

28
1. SIPOC Diagram
• • •
Find Source for Equipment
Deliver Order to Customer
ReceiveOrder
•
Suppliers Inputs Process Outputs Customer
Gather Equipment at Delivery
Center

29
SIPOC Diagram
Suppliers Inputs Process Outputs Customer• Small
Contractors (Preferred List)
• Builders• Do-it-
yourselfer
Find Source for Equipment
Deliver Order to Customer
ReceiveOrder
Gather Equipment at Delivery
Center
30
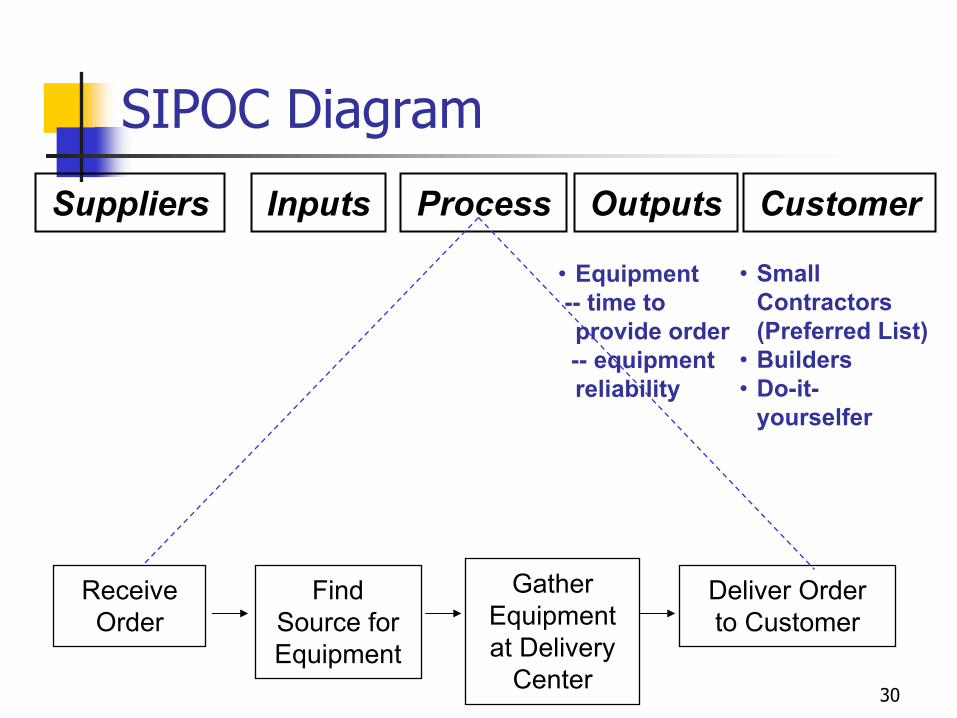
SIPOC Diagram
Suppliers Inputs Process Outputs Customer
• Small Contractors (Preferred List)
• Builders• Do-it-
yourselfer
• Equipment-- time to provide order-- equipment reliability
Find Source for Equipment
Deliver Order to Customer
ReceiveOrder
Gather Equipment at Delivery
Center

31
SIPOC Diagram
Suppliers Inputs Process Outputs Customer
• Small Contractors (Preferred List)
• Builders• Do-it-
yourselfer
• Equipment-- time to provide order-- equipment reliability
• Rental Equip List• Sales Training in
Equipment Use• Equipment
Availability• Shipping Costs
between Centers• Repair Records• Maintenance Records
Find Source for Equipment
Deliver Order to Customer
ReceiveOrder
Gather Equipment at Delivery
Center
32
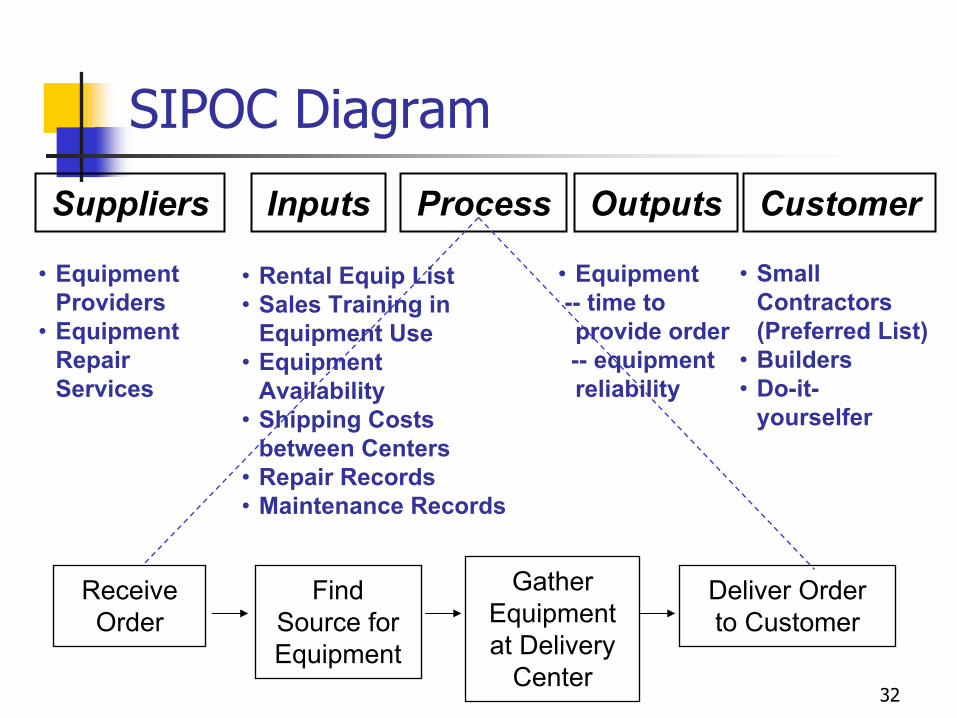
SIPOC Diagram
Suppliers Inputs Process Outputs Customer
• Small Contractors (Preferred List)
• Builders• Do-it-
yourselfer
• Equipment-- time to provide order-- equipment reliability
• Equipment Providers
• Equipment Repair Services
Find Source for Equipment
Deliver Order to Customer
Gather Equipment at Delivery
Center
ReceiveOrder
• Rental Equip List• Sales Training in
Equipment Use• Equipment
Availability• Shipping Costs
between Centers• Repair Records• Maintenance Records
33
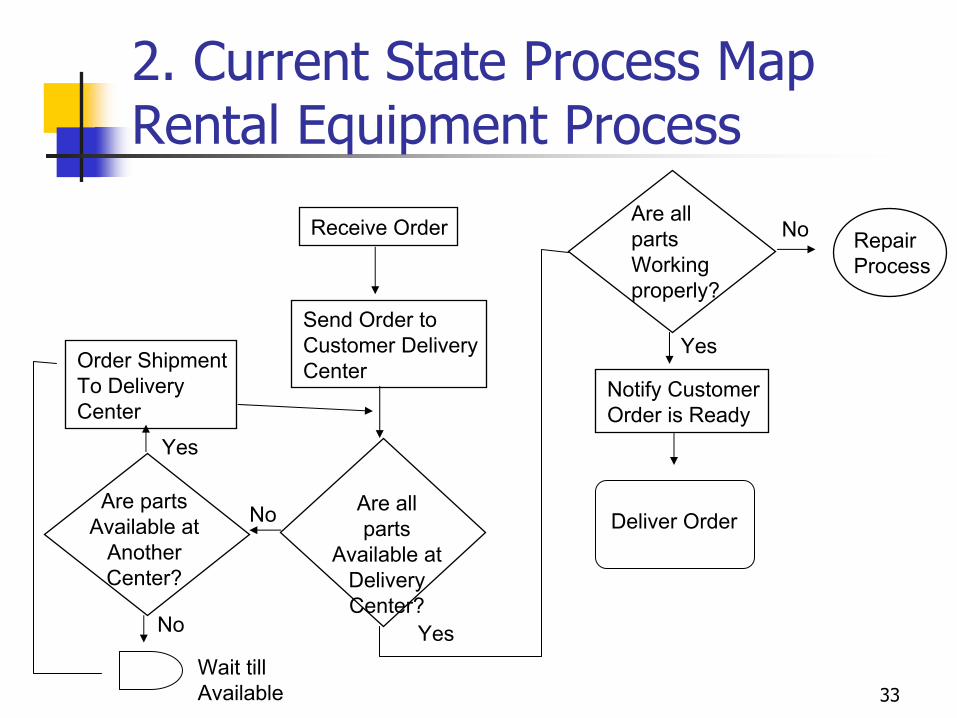
2. Current State Process Map Rental Equipment Process
Receive Order
Send Order toCustomer DeliveryCenter
Are all parts
Available at Delivery Center?
Are all partsWorking properly?
Notify CustomerOrder is Ready
Deliver Order
Order ShipmentTo DeliveryCenter
Are partsAvailable at
Another Center?
Wait tillAvailable
Yes
Yes
Yes
No
No
No RepairProcess
34
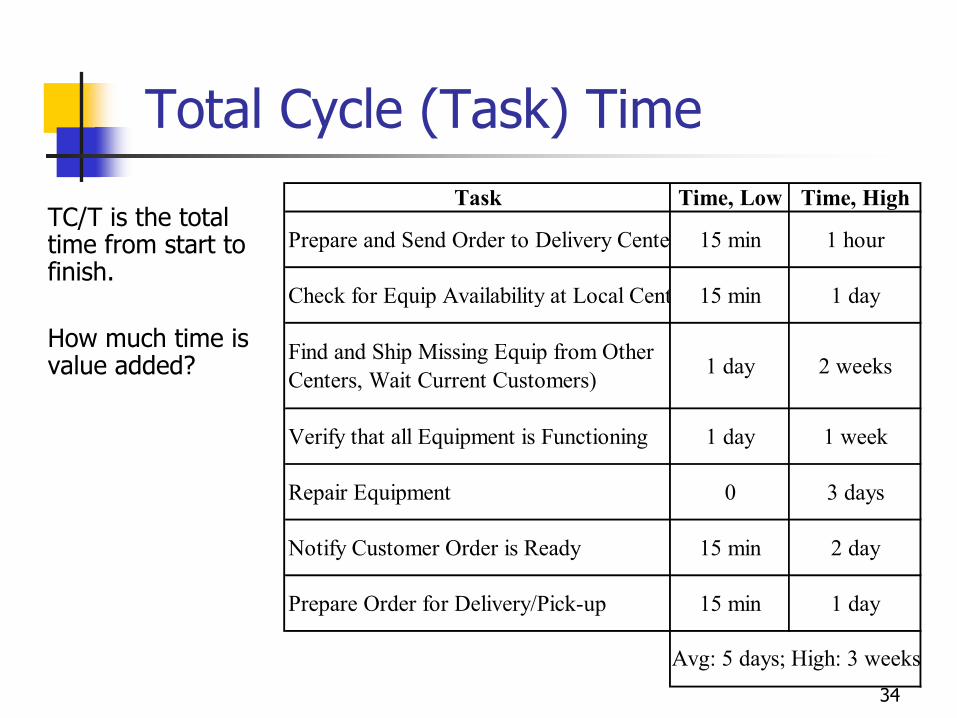
Total Cycle (Task) Time
TC/T is the total time from start to finish.
How much time is value added?
Task Time, Low Time, High
Prepare and Send Order to Delivery Cente 15 min 1 hour
Check for Equip Availability at Local Cent 15 min 1 day
Find and Ship Missing Equip from Other Centers, Wait Current Customers) 1 day 2 weeks
Verify that all Equipment is Functioning 1 day 1 week
Repair Equipment 0 3 days
Notify Customer Order is Ready 15 min 2 day
Prepare Order for Delivery/Pick-up 15 min 1 day
Avg: 5 days; High: 3 weeks
35
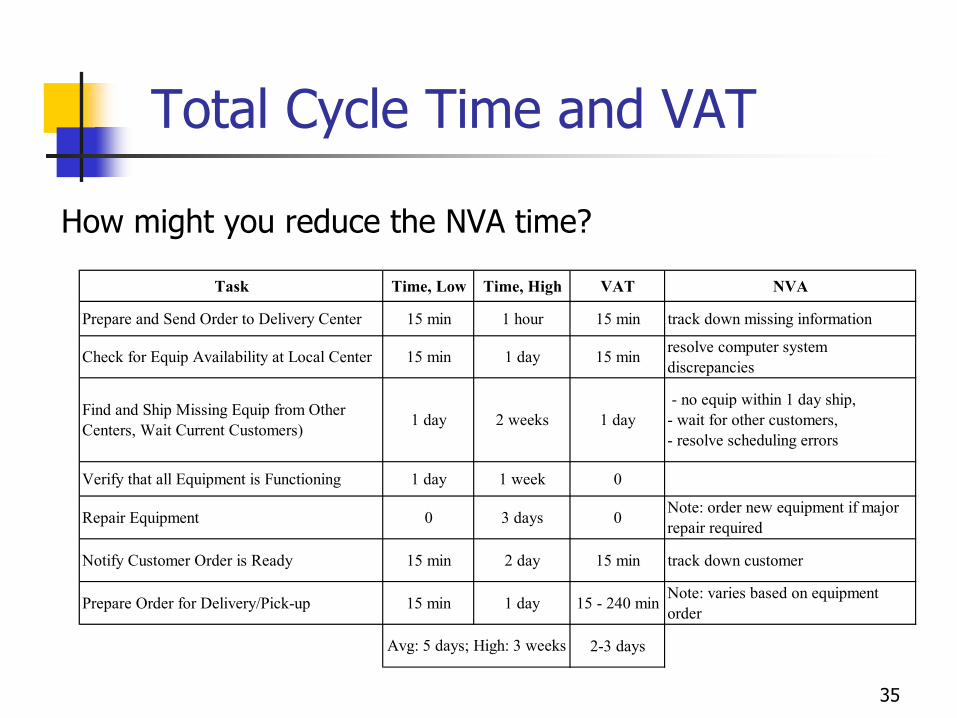
Total Cycle Time and VAT
How might you reduce the NVA time?
Task Time, Low Time, High VAT NVA
Prepare and Send Order to Delivery Center 15 min 1 hour 15 min track down missing information
Check for Equip Availability at Local Center 15 min 1 day 15 min resolve computer system discrepancies
Find and Ship Missing Equip from Other Centers, Wait Current Customers) 1 day 2 weeks 1 day
- no equip within 1 day ship, - wait for other customers, - resolve scheduling errors
Verify that all Equipment is Functioning 1 day 1 week 0
Repair Equipment 0 3 days 0 Note: order new equipment if major repair required
Notify Customer Order is Ready 15 min 2 day 15 min track down customer
Prepare Order for Delivery/Pick-up 15 min 1 day 15 - 240 min Note: varies based on equipment order
2-3 daysAvg: 5 days; High: 3 weeks

36
3. Future State Process Map Rental Equipment Process
Receive Order
Notify Customerof Order Availability
Are all parts
Available?
Notify CustomerOrder is Ready
Deliver Order
Send Job Order Request toAppropriate Center(s)
Determine BestLocation to Obtain Equip
Does Customer
Accept Schedule?
Ship/ Gather EquipAt Delivery Center
Find Missing EquipmentProcess
Y
Y
Issue LostCustomer Report
N
37
Eliminating NVA Activities
Some examples of possible improvements in this case are:
Creation of equipment readiness process to insure only functioning equipment is sent to a delivery center.Early customer notification process (automated).Software system to find best equipment source for order.Setting up lost customer database to allow for better resource allocation in future.

38
Final Case Study Comments
• This future state map got closer to the customer’s goal (order < 1 week), but we are not done yet? We must seek continuous improvement!
• Improvement of chronic problems often will require a closer look at many issues including:
resource allocation, reasons for defective equipment, preventative maintenance schedules, IT systems …
• Again, the real value in process maps (flow charts) often is to get everyone to agree on:
key process steps, resources, decision criteria, waste!!
Recommended