Fagron
Berenberg Discovery Conference US
New York, 26 October 2017
Constantijn van Rietschoten
Chief Communications Officer
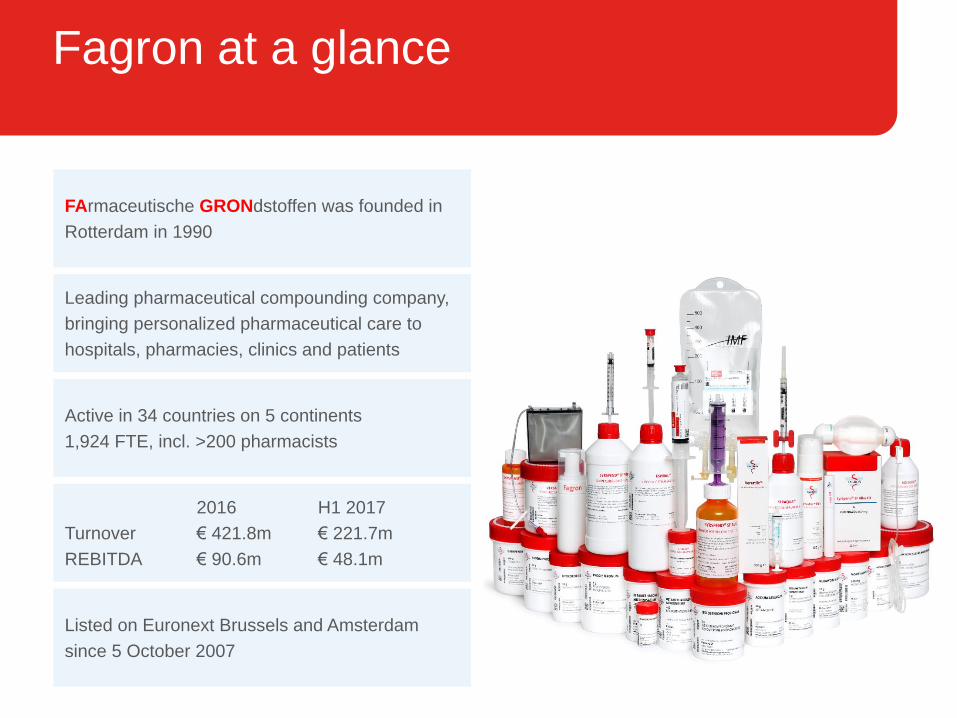
Fagron at a glance
FArmaceutische GRONdstoffen was founded in
Rotterdam in 1990
2016 H1 2017
Turnover € 421.8m € 221.7m
REBITDA € 90.6m € 48.1m
Active in 34 countries on 5 continents
1,924 FTE, incl. >200 pharmacists
Leading pharmaceutical compounding company,
bringing personalized pharmaceutical care to
hospitals, pharmacies, clinics and patients
Listed on Euronext Brussels and Amsterdam
since 5 October 2007
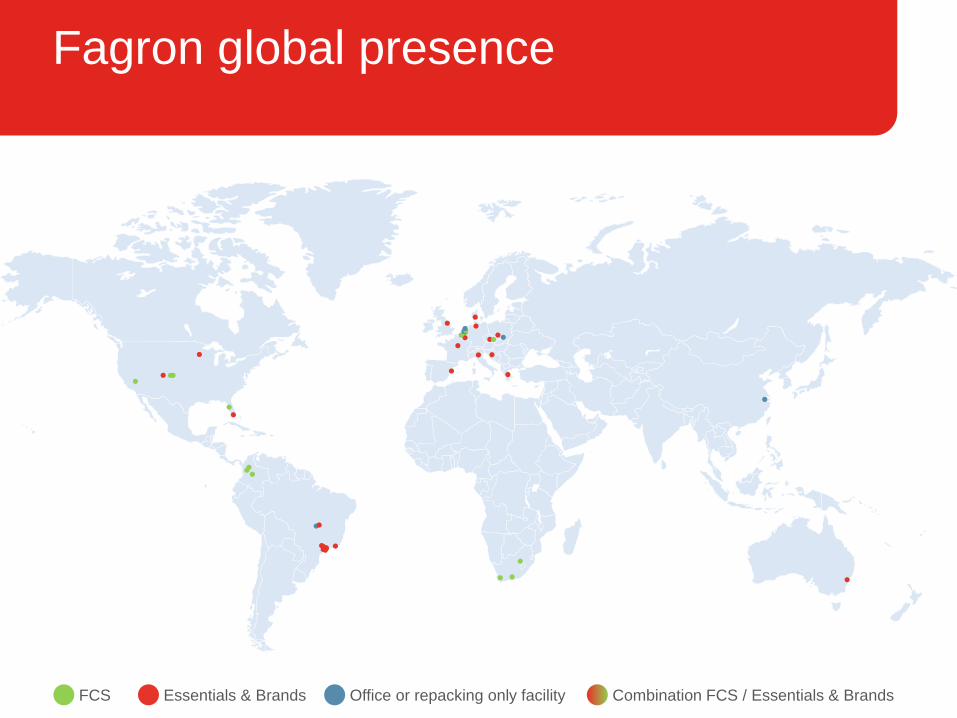
Fagron global presence
FCS Essentials & Brands Office or repacking only facility Combination FCS / Essentials & Brands

Strategy
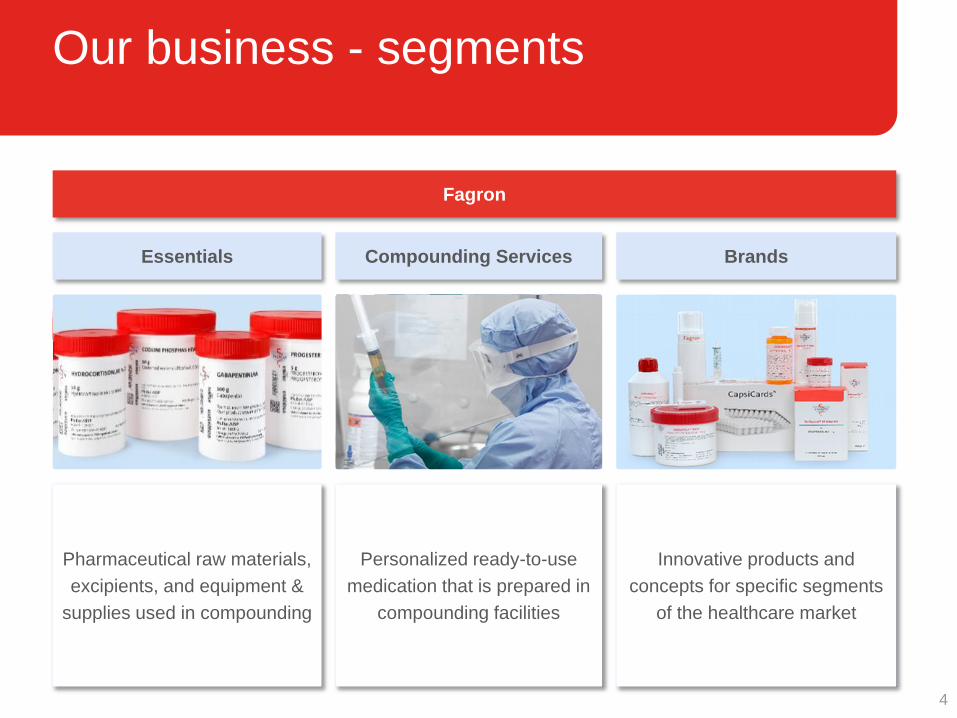
Pharmaceutical raw materials,
excipients, and equipment &
supplies used in compounding
Personalized ready-to-use
medication that is prepared in
compounding facilities
Innovative products and
concepts for specific segments
of the healthcare market
Our business - segments
Fagron
Essentials BrandsCompounding Services
4
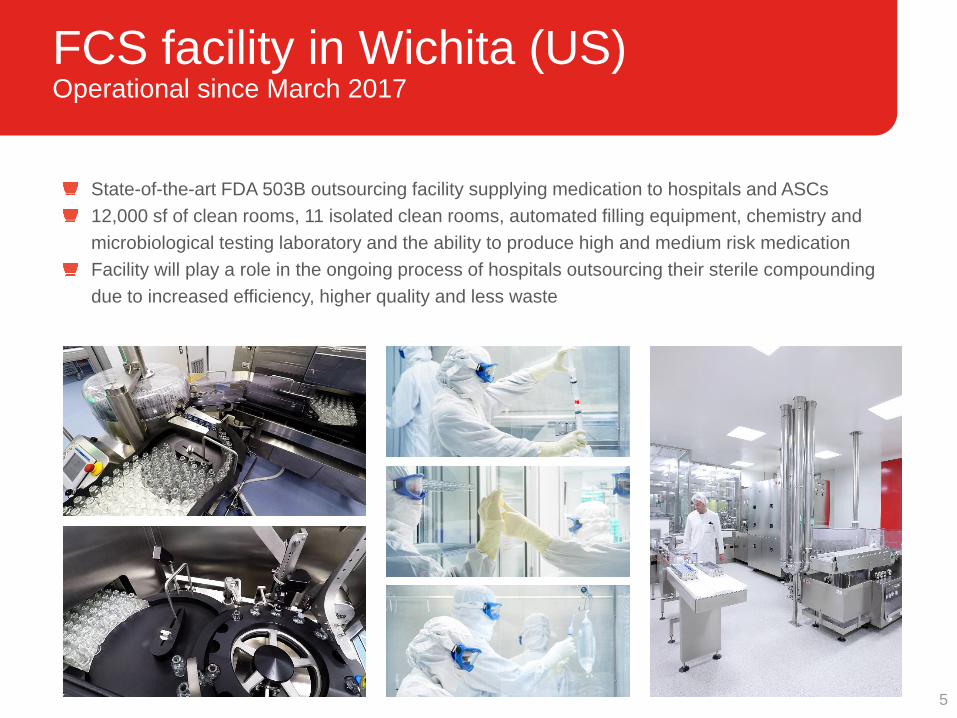
FCS facility in Wichita (US)Operational since March 2017
5
State-of-the-art FDA 503B outsourcing facility supplying medication to hospitals and ASCs
12,000 sf of clean rooms, 11 isolated clean rooms, automated filling equipment, chemistry and
microbiological testing laboratory and the ability to produce high and medium risk medication
Facility will play a role in the ongoing process of hospitals outsourcing their sterile compounding
due to increased efficiency, higher quality and less waste
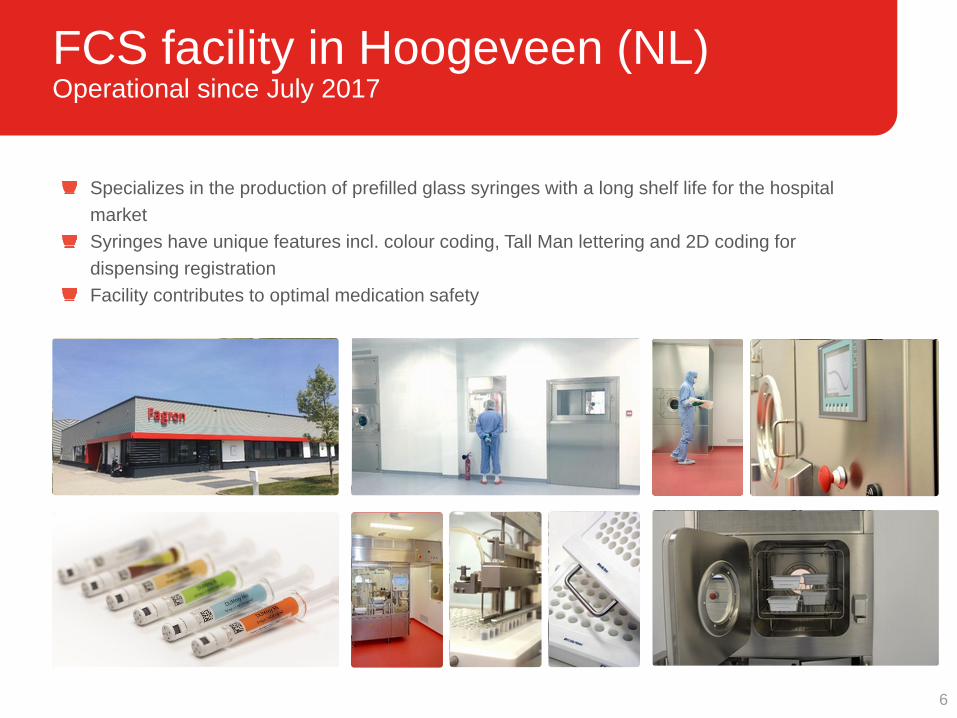
FCS facility in Hoogeveen (NL)Operational since July 2017
6
Specializes in the production of prefilled glass syringes with a long shelf life for the hospital
market
Syringes have unique features incl. colour coding, Tall Man lettering and 2D coding for
dispensing registration
Facility contributes to optimal medication safety
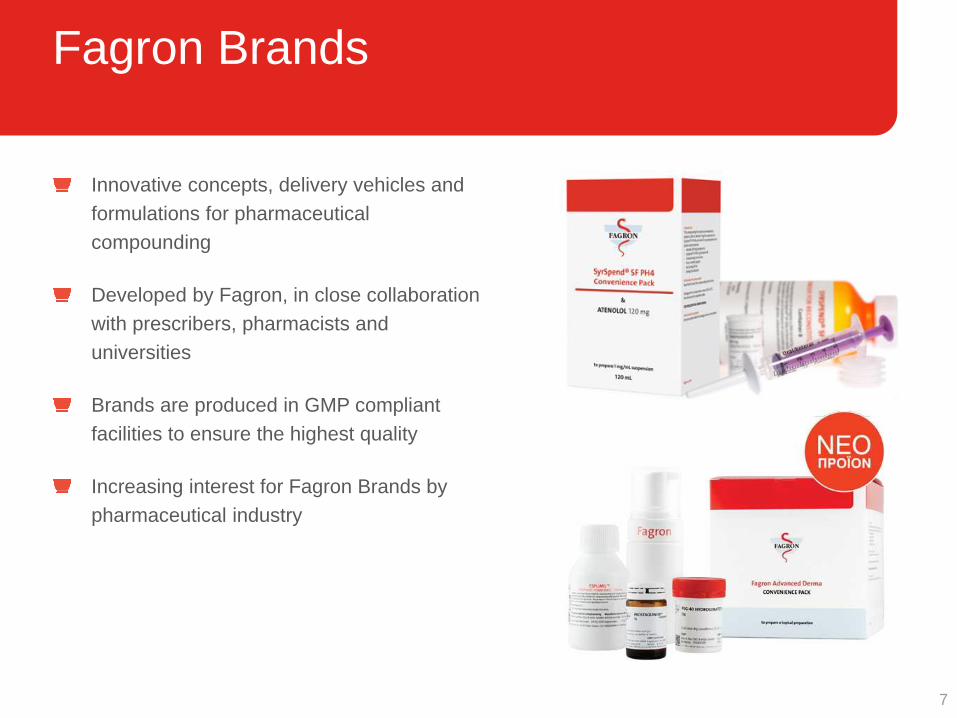
Fagron Brands
7
Innovative concepts, delivery vehicles and
formulations for pharmaceutical
compounding
Developed by Fagron, in close collaboration
with prescribers, pharmacists and
universities
Brands are produced in GMP compliant
facilities to ensure the highest quality
Increasing interest for Fagron Brands by
pharmaceutical industry
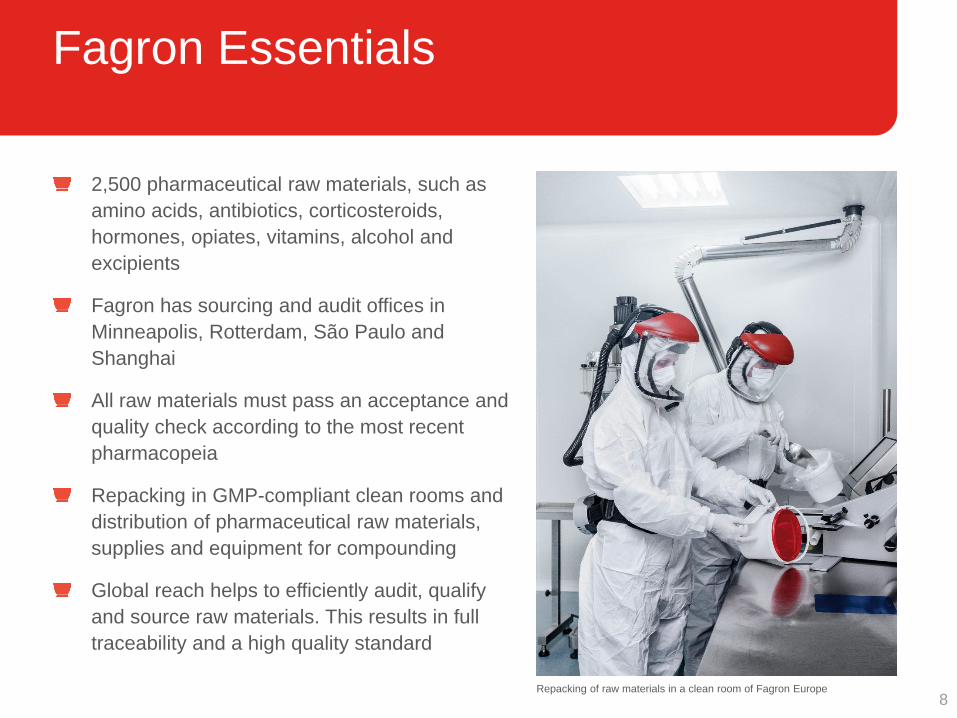
Fagron Essentials
8
2,500 pharmaceutical raw materials, such as
amino acids, antibiotics, corticosteroids,
hormones, opiates, vitamins, alcohol and
excipients
Fagron has sourcing and audit offices in
Minneapolis, Rotterdam, São Paulo and
Shanghai
All raw materials must pass an acceptance and
quality check according to the most recent
pharmacopeia
Repacking in GMP-compliant clean rooms and
distribution of pharmaceutical raw materials,
supplies and equipment for compounding
Global reach helps to efficiently audit, qualify
and source raw materials. This results in full
traceability and a high quality standard
Repacking of raw materials in a clean room of Fagron Europe
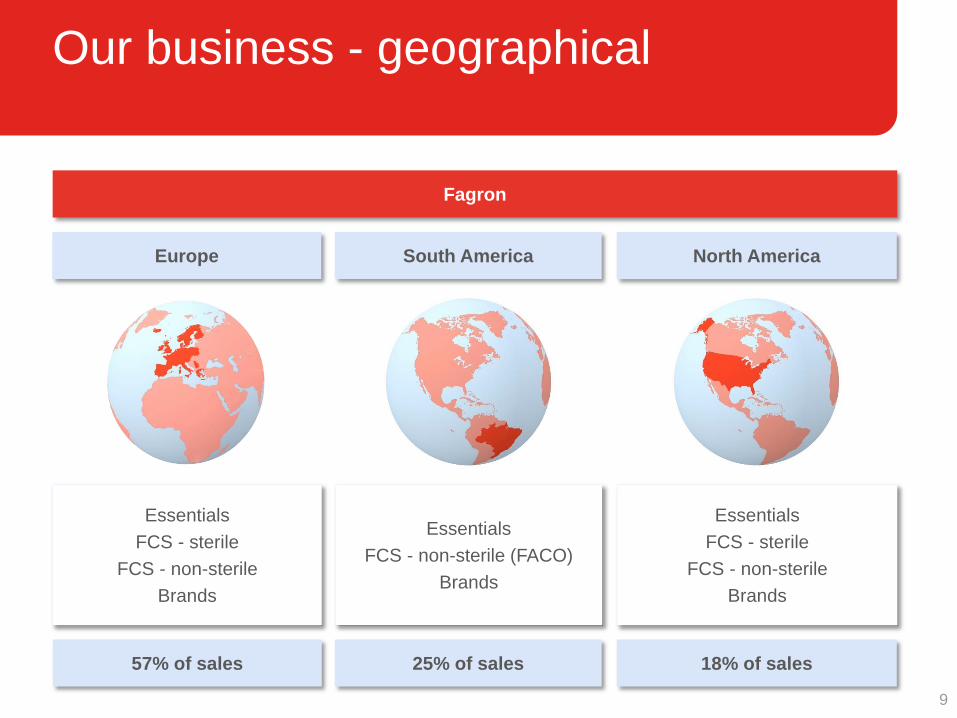
Our business - geographical
Europe North AmericaSouth America
57% of sales 18% of sales25% of sales
Essentials
FCS - sterile
FCS - non-sterile
Brands
Essentials
FCS - sterile
FCS - non-sterile
Brands
Essentials
FCS - non-sterile (FACO)
Brands
Fagron
9
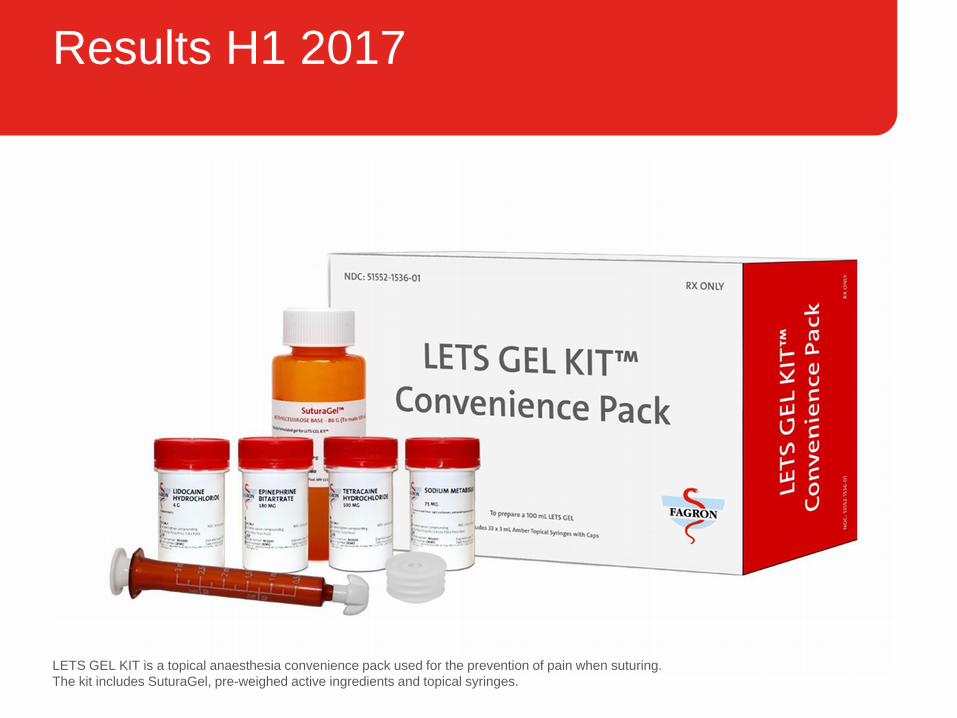
Results H1 2017
LETS GEL KIT is a topical anaesthesia convenience pack used for the prevention of pain when suturing.
The kit includes SuturaGel, pre-weighed active ingredients and topical syringes.
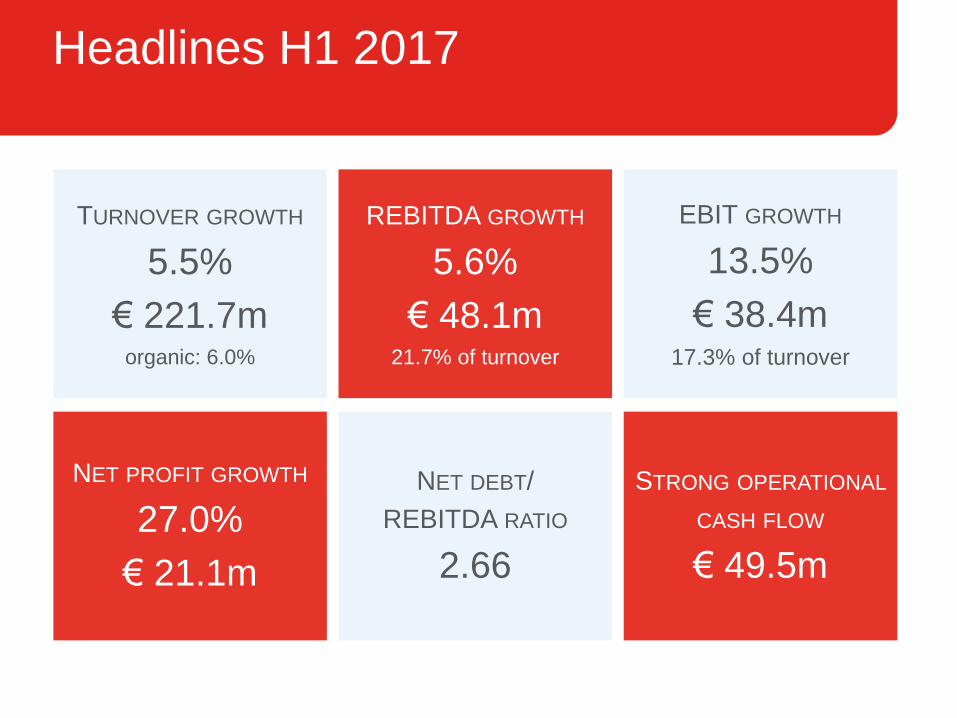
Headlines H1 2017
TURNOVER GROWTH
5.5%
€ 221.7morganic: 6.0%
REBITDA GROWTH
5.6%
€ 48.1m21.7% of turnover
EBIT GROWTH
13.5%
€ 38.4m17.3% of turnover
NET PROFIT GROWTH
27.0%
€ 21.1m
NET DEBT/
REBITDA RATIO
2.66
STRONG OPERATIONAL
CASH FLOW
€ 49.5m
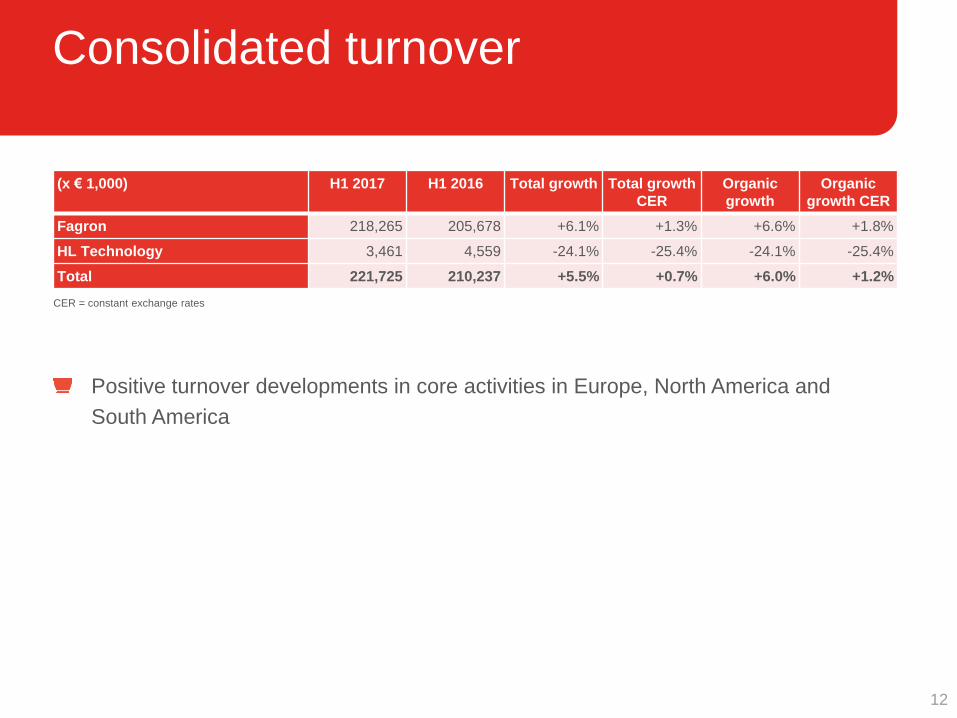
Consolidated turnover
12
(x € 1,000) H1 2017 H1 2016 Total growth Total growth
CER
Organic
growth
Organic
growth CER
Fagron 218,265 205,678 +6.1% +1.3% +6.6% +1.8%
HL Technology 3,461 4,559 -24.1% -25.4% -24.1% -25.4%
Total 221,725 210,237 +5.5% +0.7% +6.0% +1.2%
CER = constant exchange rates
Positive turnover developments in core activities in Europe, North America and
South America
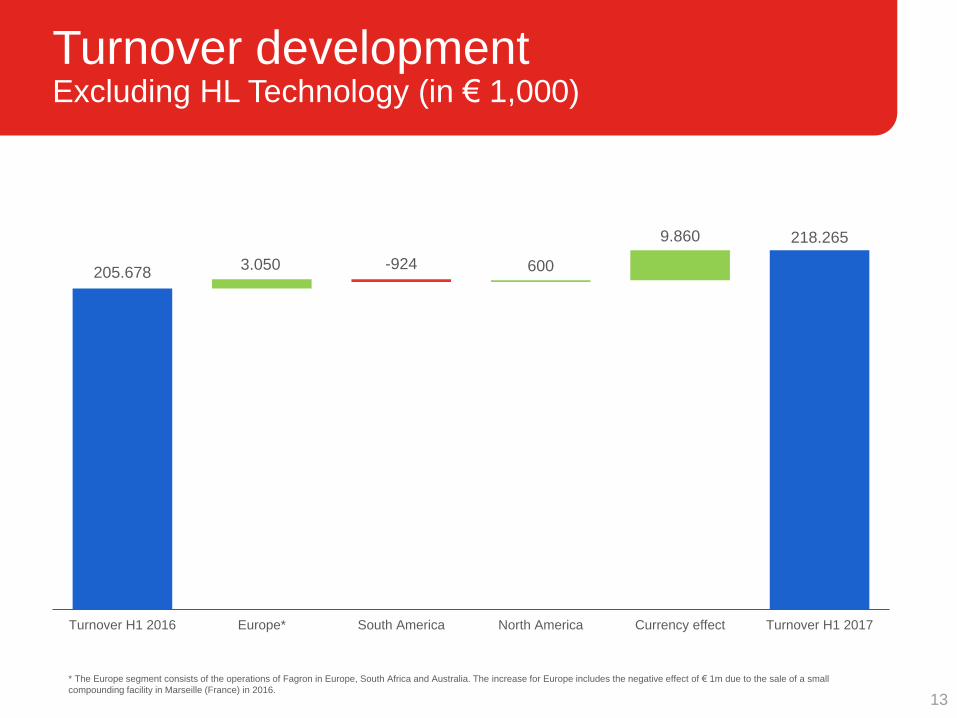
Turnover developmentExcluding HL Technology (in € 1,000)
13
205.678
218.265
3.050 600
9.860
-924
Turnover H1 2016 Europe* South America North America Currency effect Turnover H1 2017
* The Europe segment consists of the operations of Fagron in Europe, South Africa and Australia. The increase for Europe includes the negative effect of € 1m due to the sale of a small
compounding facility in Marseille (France) in 2016.
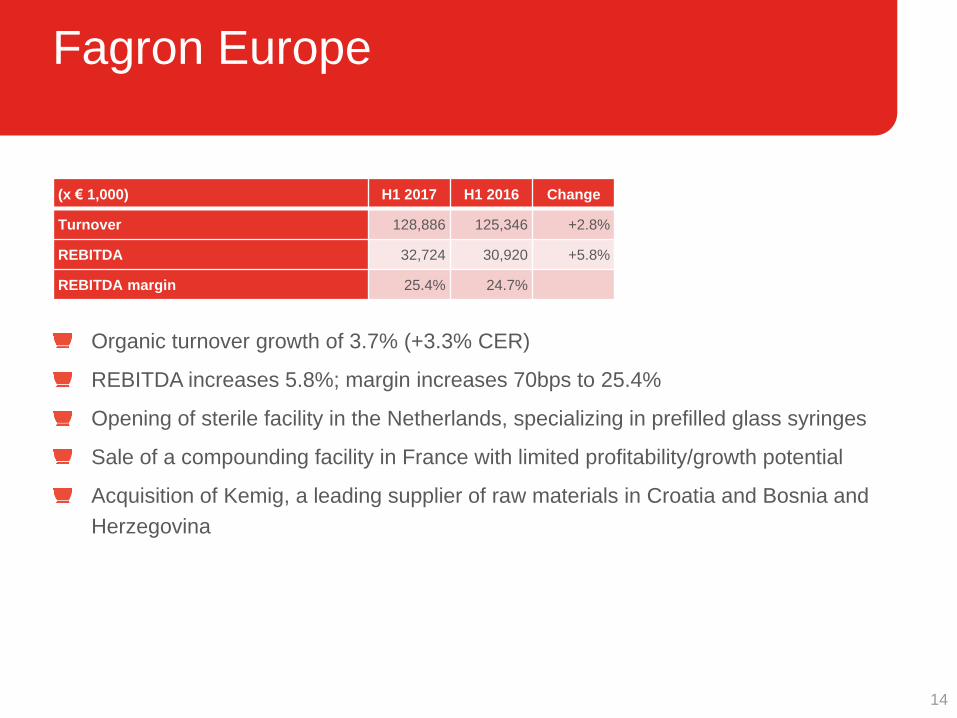
Fagron Europe
14
(x € 1,000) H1 2017 H1 2016 Change
Turnover 128,886 125,346 +2.8%
REBITDA 32,724 30,920 +5.8%
REBITDA margin 25.4% 24.7%
Organic turnover growth of 3.7% (+3.3% CER)
REBITDA increases 5.8%; margin increases 70bps to 25.4%
Opening of sterile facility in the Netherlands, specializing in prefilled glass syringes
Sale of a compounding facility in France with limited profitability/growth potential
Acquisition of Kemig, a leading supplier of raw materials in Croatia and Bosnia and
Herzegovina
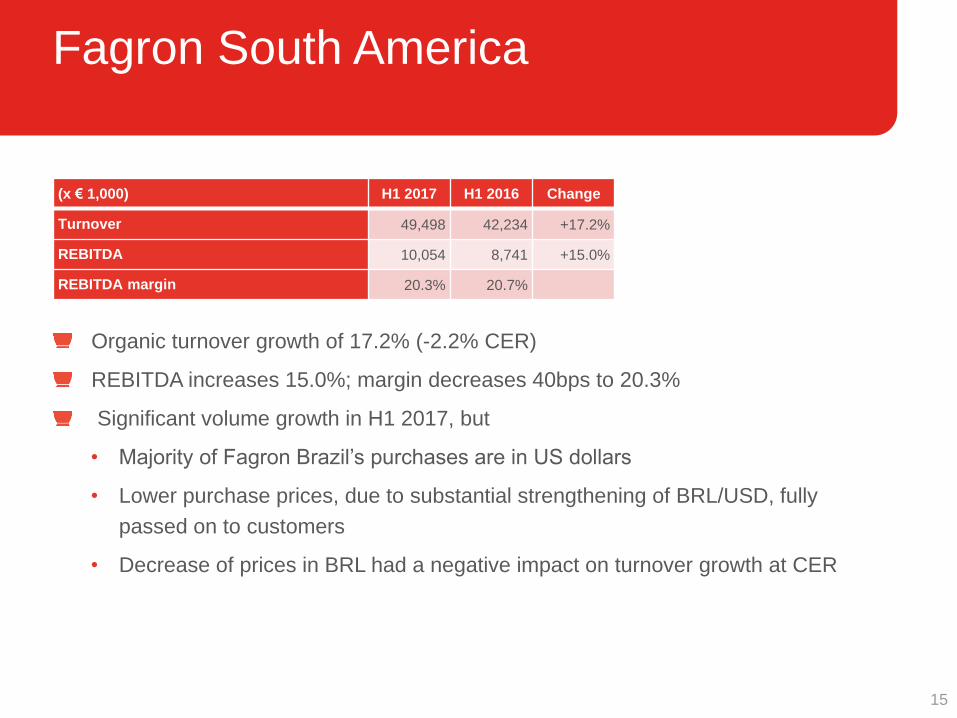
Fagron South America
15
(x € 1,000) H1 2017 H1 2016 Change
Turnover 49,498 42,234 +17.2%
REBITDA 10,054 8,741 +15.0%
REBITDA margin 20.3% 20.7%
Organic turnover growth of 17.2% (-2.2% CER)
REBITDA increases 15.0%; margin decreases 40bps to 20.3%
Significant volume growth in H1 2017, but
• Majority of Fagron Brazil’s purchases are in US dollars
• Lower purchase prices, due to substantial strengthening of BRL/USD, fully
passed on to customers
• Decrease of prices in BRL had a negative impact on turnover growth at CER
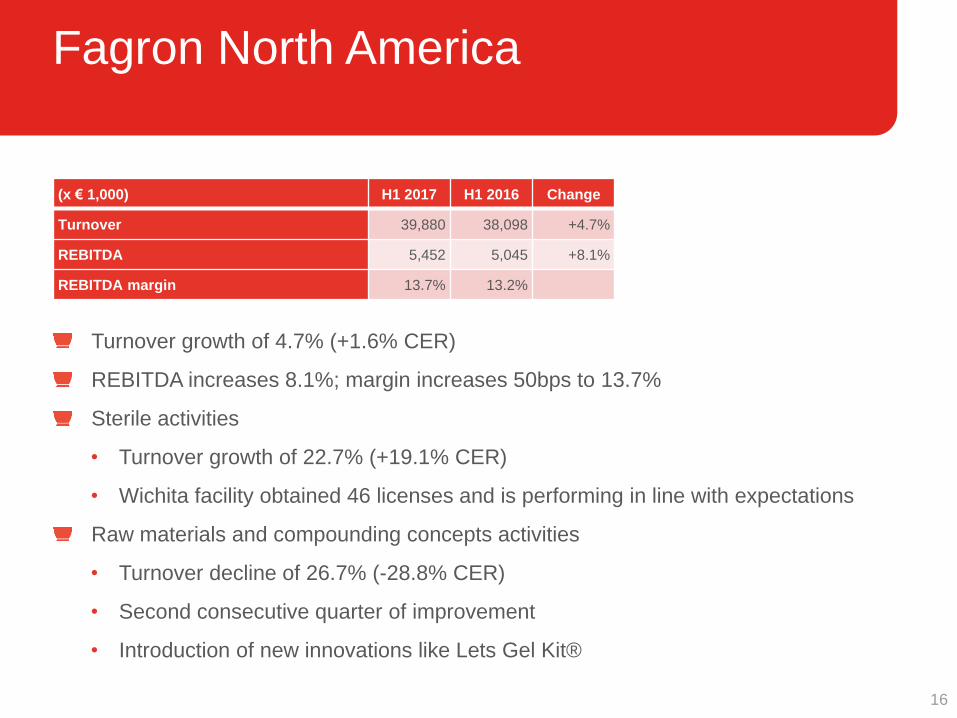
Fagron North America
16
(x € 1,000) H1 2017 H1 2016 Change
Turnover 39,880 38,098 +4.7%
REBITDA 5,452 5,045 +8.1%
REBITDA margin 13.7% 13.2%
Turnover growth of 4.7% (+1.6% CER)
REBITDA increases 8.1%; margin increases 50bps to 13.7%
Sterile activities
• Turnover growth of 22.7% (+19.1% CER)
• Wichita facility obtained 46 licenses and is performing in line with expectations
Raw materials and compounding concepts activities
• Turnover decline of 26.7% (-28.8% CER)
• Second consecutive quarter of improvement
• Introduction of new innovations like Lets Gel Kit®
Financial review H1 2017
Pigmerise® MD is a medical devise class 1 indicated as coadjuvant of the skin dyschromia treatment, especially in cases such as
hyperpigmentation caused by vitiligo.
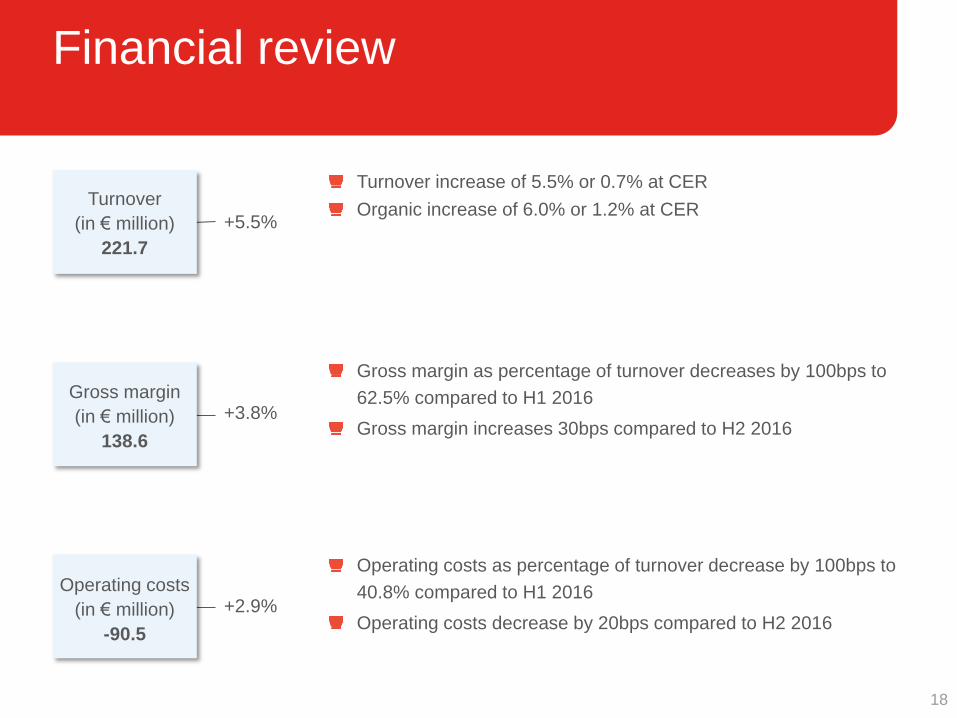
Financial review
Turnover
(in € million)
221.7
+5.5%
Gross margin
(in € million)
138.6
+3.8%
Operating costs
(in € million)
-90.5
+2.9%
Turnover increase of 5.5% or 0.7% at CER
Organic increase of 6.0% or 1.2% at CER
Gross margin as percentage of turnover decreases by 100bps to
62.5% compared to H1 2016
Gross margin increases 30bps compared to H2 2016
Operating costs as percentage of turnover decrease by 100bps to
40.8% compared to H1 2016
Operating costs decrease by 20bps compared to H2 2016
18
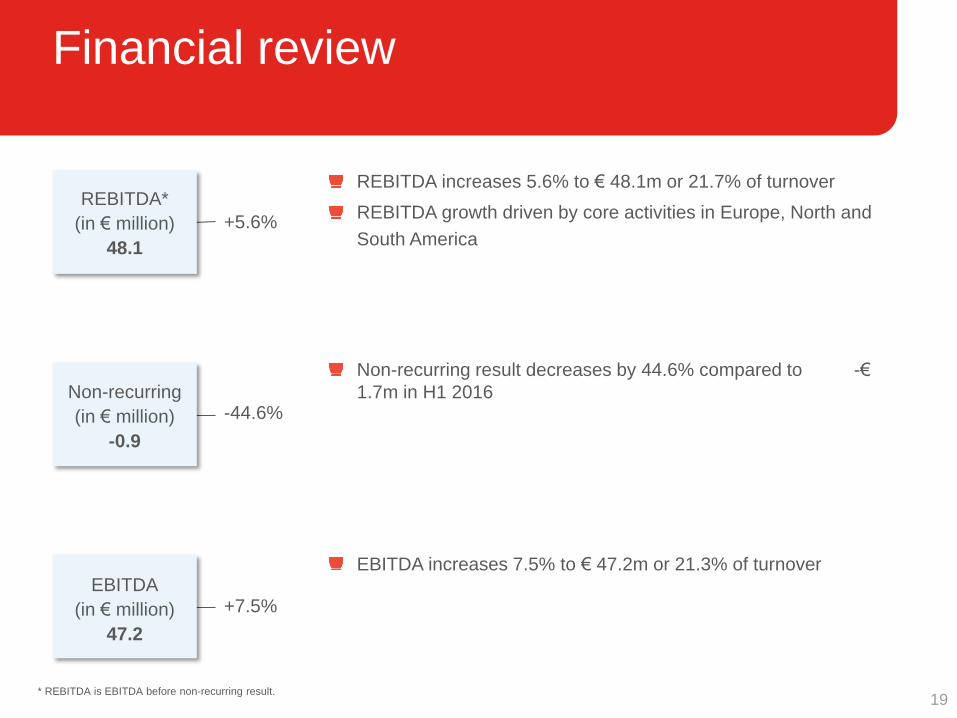
Financial review
REBITDA*
(in € million)
48.1
+5.6%
Non-recurring
(in € million)
-0.9
-44.6%
EBITDA
(in € million)
47.2
+7.5%
REBITDA increases 5.6% to € 48.1m or 21.7% of turnover
REBITDA growth driven by core activities in Europe, North and
South America
Non-recurring result decreases by 44.6% compared to -€
1.7m in H1 2016
EBITDA increases 7.5% to € 47.2m or 21.3% of turnover
* REBITDA is EBITDA before non-recurring result.19
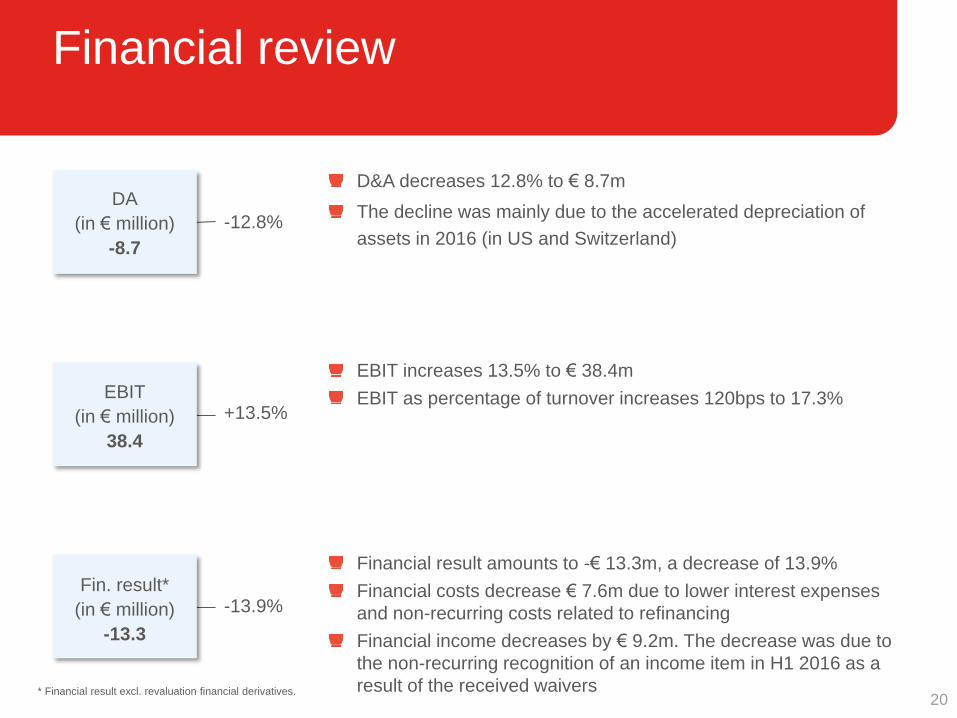
Financial review
DA
(in € million)
-8.7
-12.8%
EBIT
(in € million)
38.4
+13.5%
Fin. result*
(in € million)
-13.3
-13.9%
D&A decreases 12.8% to € 8.7m
The decline was mainly due to the accelerated depreciation of
assets in 2016 (in US and Switzerland)
EBIT increases 13.5% to € 38.4m
EBIT as percentage of turnover increases 120bps to 17.3%
Financial result amounts to -€ 13.3m, a decrease of 13.9%
Financial costs decrease € 7.6m due to lower interest expenses
and non-recurring costs related to refinancing
Financial income decreases by € 9.2m. The decrease was due to
the non-recurring recognition of an income item in H1 2016 as a
result of the received waivers* Financial result excl. revaluation financial derivatives.20
Financial review
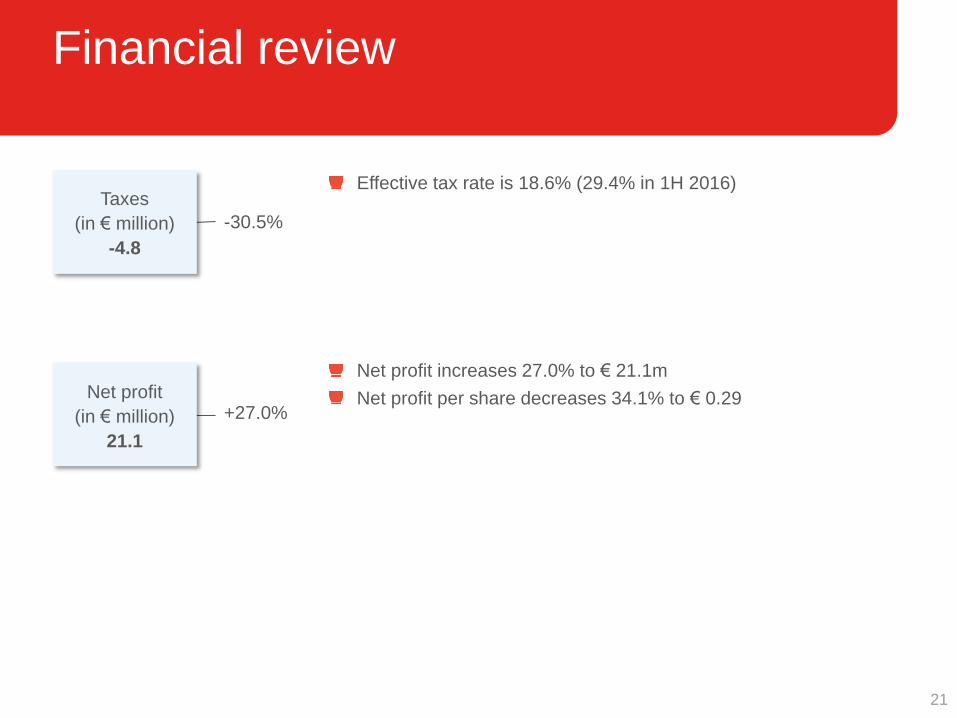
Taxes
(in € million)
-4.8
-30.5%
Net profit
(in € million)
21.1
+27.0%
Effective tax rate is 18.6% (29.4% in 1H 2016)
Net profit increases 27.0% to € 21.1m
Net profit per share decreases 34.1% to € 0.29
21
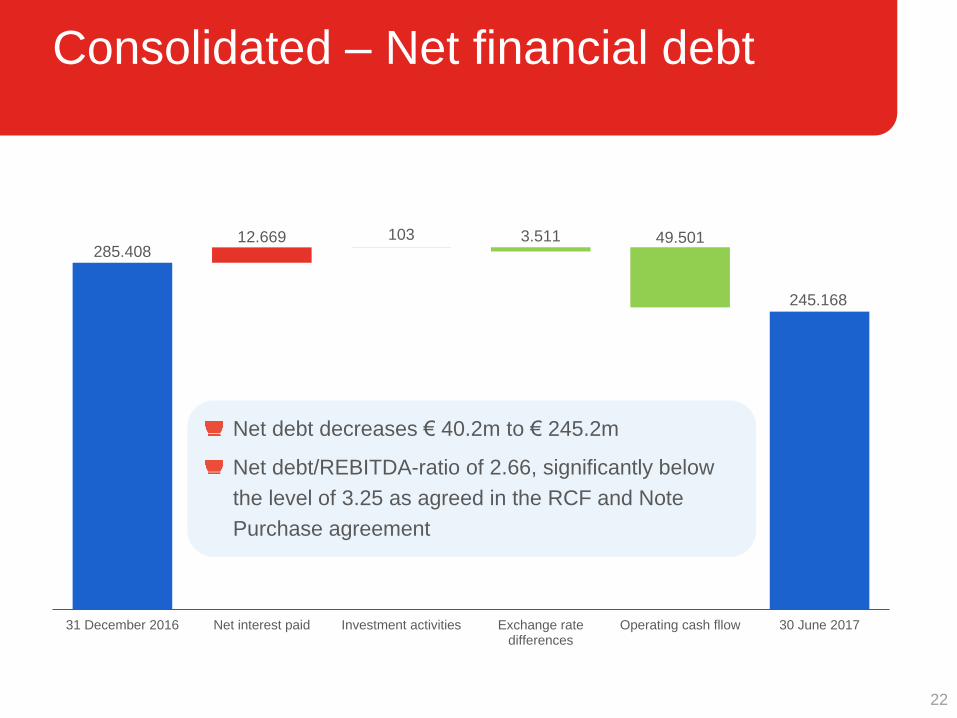
Consolidated – Net financial debt
22
285.408
245.168
3.511 49.50112.669 103
31 December 2016 Net interest paid Investment activities Exchange ratedifferences
Operating cash fllow 30 June 2017
Net debt decreases € 40.2m to € 245.2m
Net debt/REBITDA-ratio of 2.66, significantly below
the level of 3.25 as agreed in the RCF and Note
Purchase agreement
Summary H1 2017
Solid results with positive turnover
developments in core activities
Operating costs well under control
Profitability increasing faster than
turnover
Financial position significantly
strengthened
Portfolio:
• Facility in Wichita licensed in 46 states
• Opening of a sterile facility in NL
• Acquisition of Kemig (Croatia)
• Sale of non-sterile facility in France
23
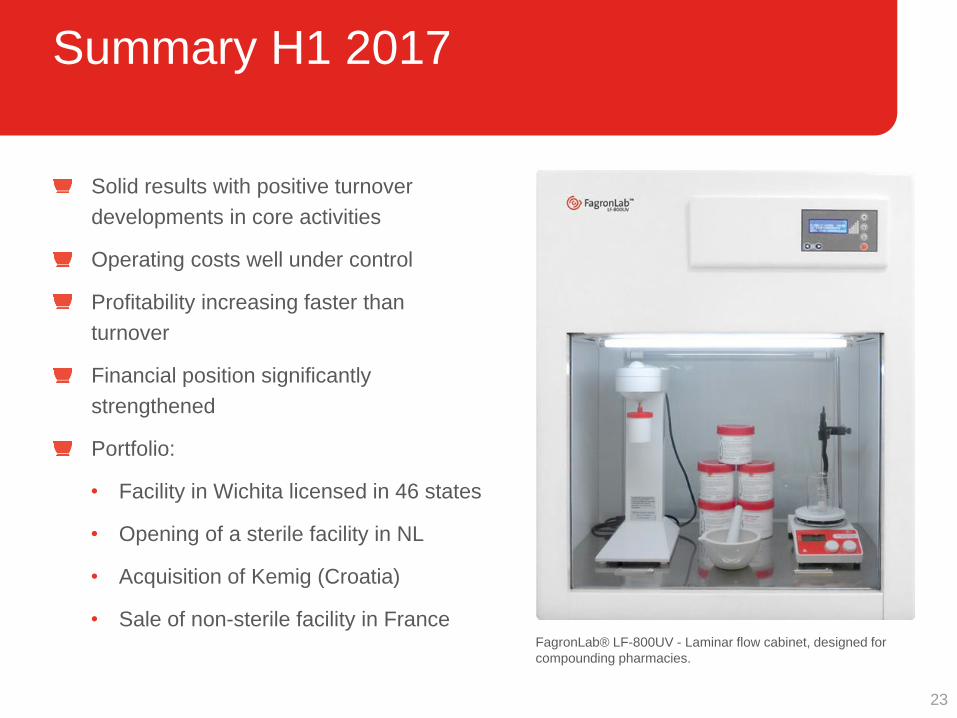
FagronLab® LF-800UV - Laminar flow cabinet, designed for
compounding pharmacies.
Results Q3 2017
24
Headlines Q3 2017
25
Financial highlights
• Turnover increases to € 103.6 million
• Organic turnover growth at CER of 2.4%
• Organic growth in all key regions
Strategic highlights
• Acquisition of Croatian Kemig in August
• Acquisition of Brazilian All Chemistry in
October
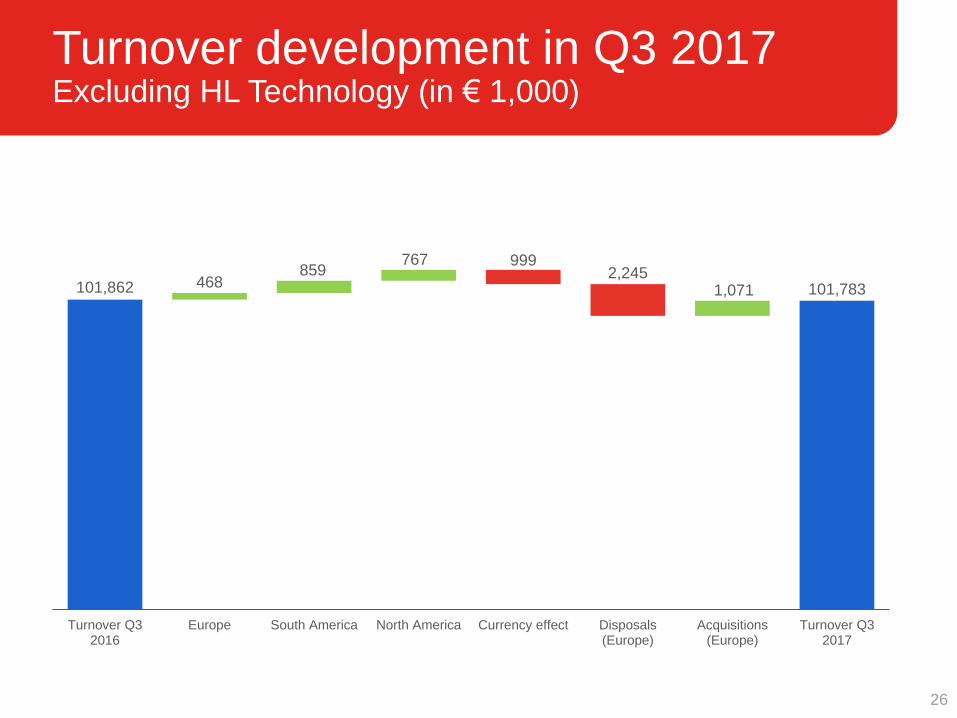
Turnover development in Q3 2017Excluding HL Technology (in € 1,000)
26
101,862 101,783468859
767
1,071
9992,245
Turnover Q32016
Europe South America North America Currency effect Disposals(Europe)
Acquisitions(Europe)
Turnover Q32017
Fagron Europe1
27
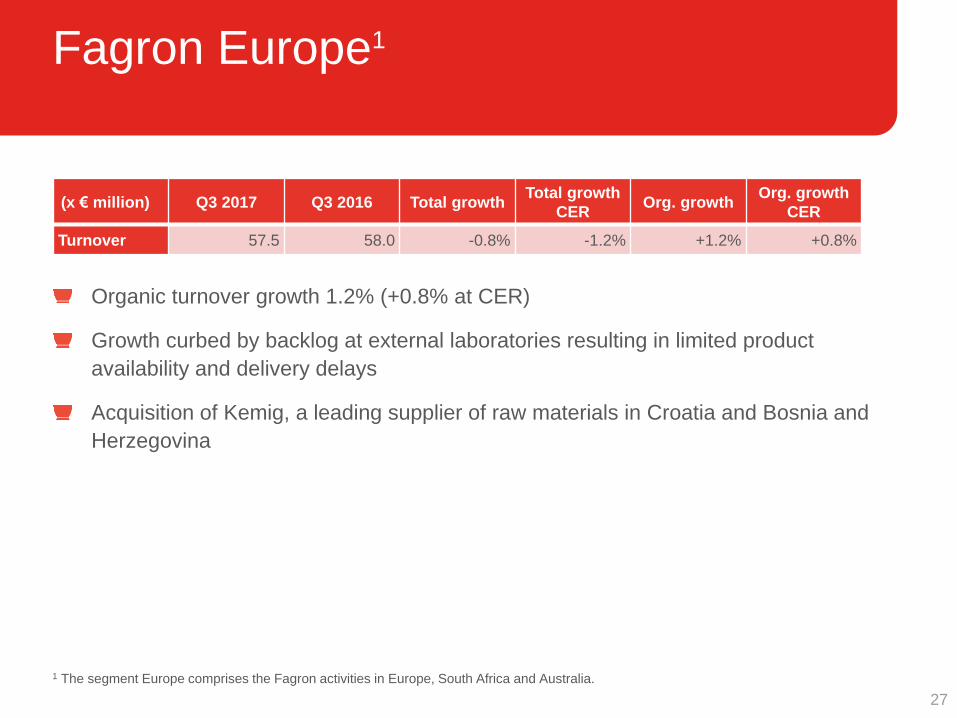
Organic turnover growth 1.2% (+0.8% at CER)
Growth curbed by backlog at external laboratories resulting in limited product
availability and delivery delays
Acquisition of Kemig, a leading supplier of raw materials in Croatia and Bosnia and
Herzegovina
(x € million) Q3 2017 Q3 2016 Total growthTotal growth
CEROrg. growth
Org. growth
CER
Turnover 57.5 58.0 -0.8% -1.2% +1.2% +0.8%
1 The segment Europe comprises the Fagron activities in Europe, South Africa and Australia.
Fagron South America
28
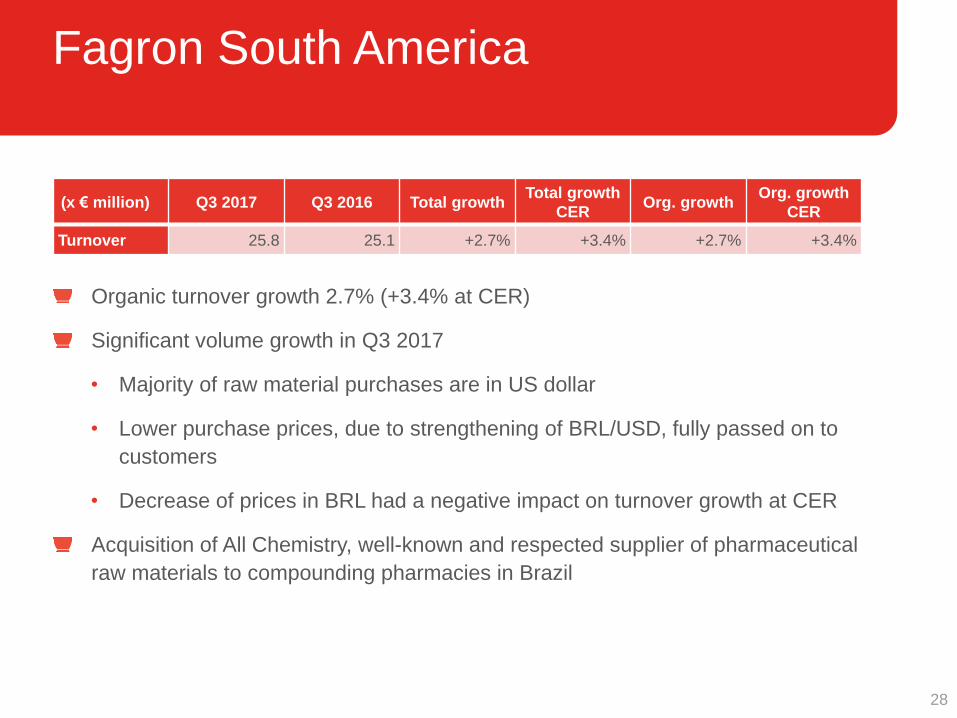
Organic turnover growth 2.7% (+3.4% at CER)
Significant volume growth in Q3 2017
• Majority of raw material purchases are in US dollar
• Lower purchase prices, due to strengthening of BRL/USD, fully passed on to
customers
• Decrease of prices in BRL had a negative impact on turnover growth at CER
Acquisition of All Chemistry, well-known and respected supplier of pharmaceutical
raw materials to compounding pharmacies in Brazil
(x € million) Q3 2017 Q3 2016 Total growthTotal growth
CEROrg. growth
Org. growth
CER
Turnover 25.8 25.1 +2.7% +3.4% +2.7% +3.4%
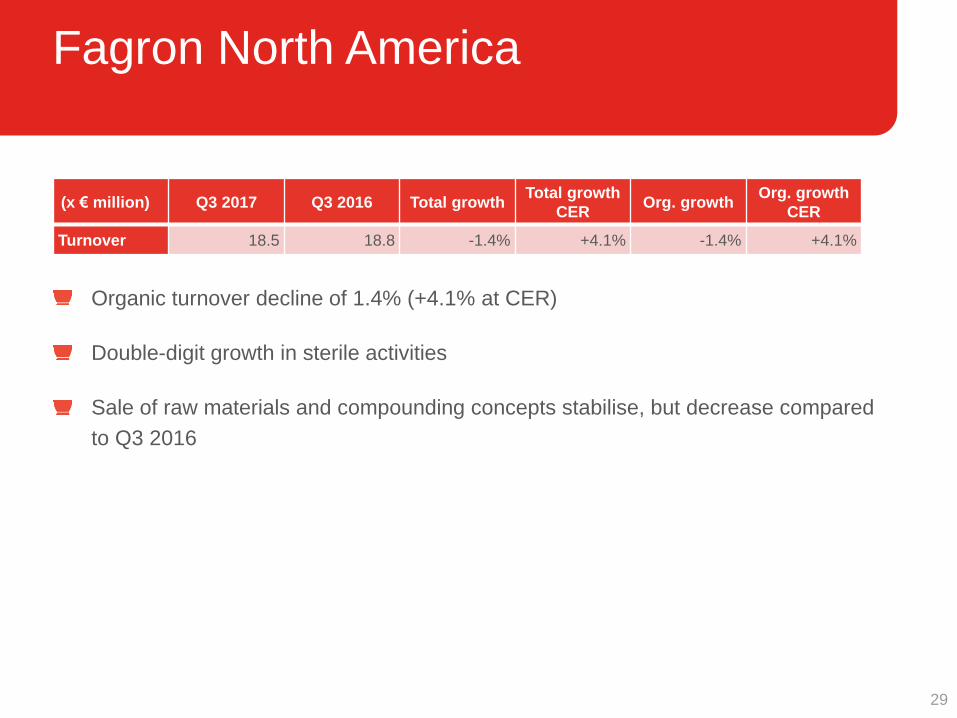
Fagron North America
29
Organic turnover decline of 1.4% (+4.1% at CER)
Double-digit growth in sterile activities
Sale of raw materials and compounding concepts stabilise, but decrease compared
to Q3 2016
(x € million) Q3 2017 Q3 2016 Total growthTotal growth
CEROrg. growth
Org. growth
CER
Turnover 18.5 18.8 -1.4% +4.1% -1.4% +4.1%
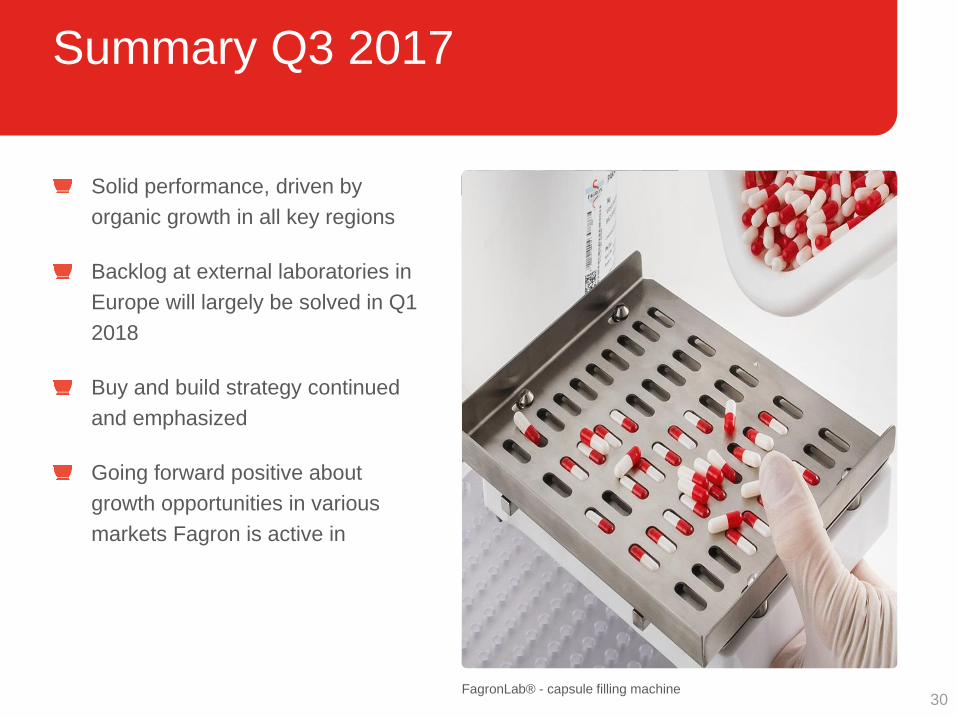
Summary Q3 2017
Solid performance, driven by
organic growth in all key regions
Backlog at external laboratories in
Europe will largely be solved in Q1
2018
Buy and build strategy continued
and emphasized
Going forward positive about
growth opportunities in various
markets Fagron is active in
30FagronLab® - capsule filling machine
Q&A
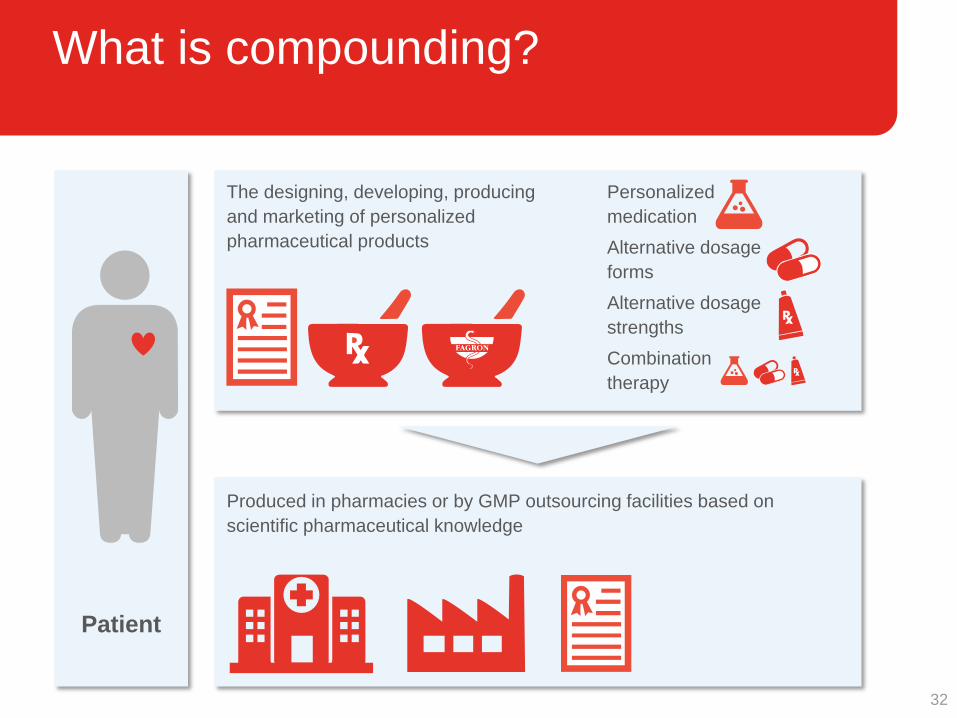
What is compounding?
Patient
Personalized
medication
Produced in pharmacies or by GMP outsourcing facilities based on
scientific pharmaceutical knowledge
The designing, developing, producing
and marketing of personalized
pharmaceutical products Alternative dosage
forms
Alternative dosage
strengths
Combination
therapy
32
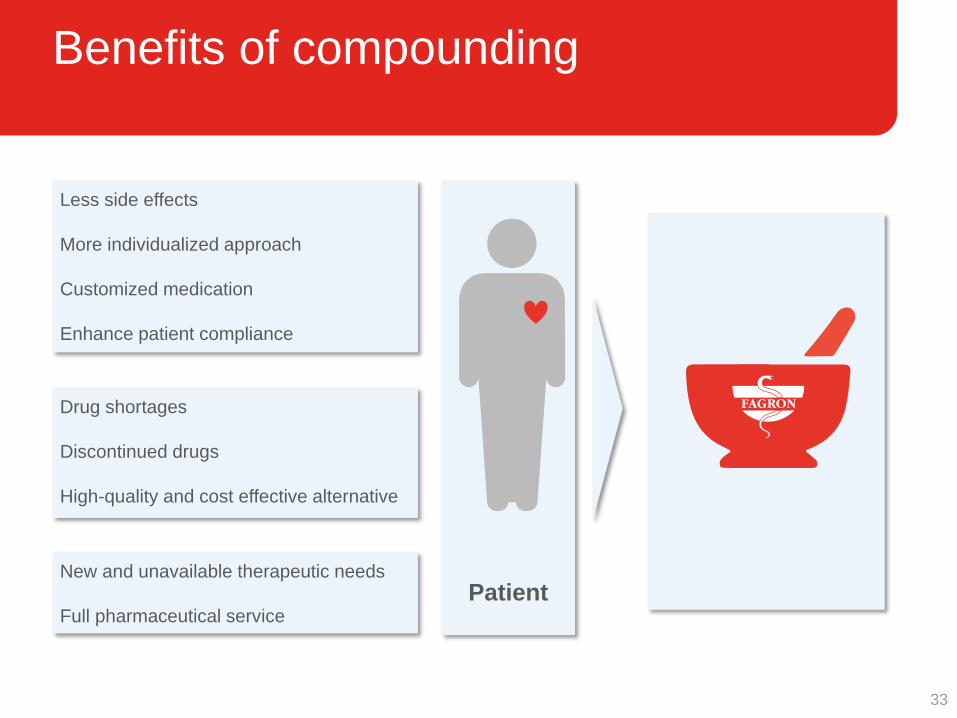
Benefits of compounding
Patient
Less side effects
More individualized approach
Customized medication
Enhance patient compliance
Drug shortages
Discontinued drugs
High-quality and cost effective alternative
New and unavailable therapeutic needs
Full pharmaceutical service
33
Disclaimer
Important information about forward-looking statements
Certain statements in this presentation may be considered “forward-looking”. Such
forward-looking statements are based on current expectations, and, accordingly, entail
and are influenced by various risks and uncertainties. The Company therefore cannot
provide any assurance that such forward-looking statements will materialize and does
not assume an obligation to update or revise any forward-looking statement, whether as
a result of new information, future events or any other reason.
34
Recommended