MERCED COUNTY ASSOCIATION OF GOVERNMENTS
YARTS STRATEGIC PLANWORKING PAPER
Prepared by LSC Transportation Consultants, Inc


YOSEMITE AREA REGIONAL TRANSPORTATION SYSTEM
STRATEGIC PLAN
Working Paper
Prepared for
Merced County Association of Governments 369 West 18th Street
Merced, California 95340
Prepared by
LSC Transportation Consultants, Inc. PO Box 5875
2690 Lake Forest Road, Suite C Tahoe City, California, 96145 530
530-583-4053
January 5, 2021


YARTS Strategic Plan Working Paper
- i -
Table of Contents
CHAPTERS
Chapter 1: Introduction ................................................................................................................... 1
Chapter 2: YARTS Institutional Overview .................................................................................... 2 Institutional Structure of YARTS ................................................................................................................ 2 YARTS Agreements .................................................................................................................................... 5
Chapter 3: Review of Yosemite Visitation and YARTS Service .............................................. 11 Yosemite National Park Visitation ........................................................................................................... 11 YARTS Services Overview ........................................................................................................................ 15 YARTS Performance Analysis ................................................................................................................... 32
Chapter 4: YARTS Capital Overview ......................................................................................... 37 Introduction ............................................................................................................................................. 37 YARTS Fleet .............................................................................................................................................. 37 Moving Toward Zero Emissions .............................................................................................................. 39 YARTS Facilities ........................................................................................................................................ 43
Chapter 5: Funding History and Availability .......................................................................... 45 YARTS Funding Sources ........................................................................................................................... 45 Federal Sources of Revenue .................................................................................................................... 50 State Sources of Revenue ........................................................................................................................ 53 Local Sources of Revenue ........................................................................................................................ 54 Summary—The Future Funding of YARTS ............................................................................................... 55
Chapter 6: YARTS Outlook ........................................................................................................... 57 YARTS Institutional and Administrative Issues ........................................................................................ 57 YARTS Service Issues ................................................................................................................................ 57 YARTS Capital Issues ................................................................................................................................ 58 YARTS Funding Issues .............................................................................................................................. 59 Conclusion ............................................................................................................................................... 59
Appendix A: YARTS Performance Appendix B: YARTS Ridership Trends Appendix C: Fare Structures
LIST OF TABLES
Table 1: NPS Financial Assistance for YARTS Service ................................................................................ 9 Table 2: Monthly Visitor Count (2000 – 2019)........................................................................................ 12 Table 3: Annual Vehicle Count by Park Entrance (1998 – 2019) ............................................................ 14 Table 4: Annual Visitation by Major Entrance Station (2015 – 2019) .................................................... 15 Table 5: 2019 Monthly Visitation by Major Entrance Station ................................................................ 17

YARTS Strategic Plan Working Paper
- ii -
Table 6: Summary of Existing YART Service ............................................................................................ 19 Table 7: Recent YARTS Service Changes ................................................................................................. 19 Table 8: YARTS 2019 and 2020 Service Quantities by Route and Month ............................................... 21 Table 9: YARTS Ridership History by Route ............................................................................................. 22 Table 10: YARTS Ridership History by Route and Season ....................................................................... 25 Table 11: Route 140 Ridership History by Type ...................................................................................... 26 Table 12: Passenger Boardings by Route by Month 2019 & 2020 ......................................................... 27 Table 13: Route Ridership by Average Weekday and Weekend by Month ........................................... 29 Table 14: YARTS 2019 Performance Analysis by Route and Month ....................................................... 34 Table 15: YARTS Vehicle Fleet – Replacement Needs ............................................................................ 38 Table 16: YARTS versus VIA Bus – Calendar Year 2019 ........................................................................... 39 Table 17: YARTS Expenses by Year (Merced Contract) ........................................................................... 46 Table 18: YARTS Revenues (Merced) ...................................................................................................... 47 Table 19: YARTS Expenses and Revenue by Year – Fresno Contract ...................................................... 48 Table 20: YARTS Total Operating Expenses and Revenue by Year ......................................................... 48 Table 21: Countywide Retail Sales Trends in YARTS Service Area .......................................................... 50
LIST OF FIGURES
Figure 1: YARTS 2020 – 21 Board of Directors ......................................................................................... 4 Figure 2: Total Annual Visitors (2000 – 2019) ......................................................................................... 13 Figure 3: Annual Visitors by Season (2000 – 2019) ................................................................................ 13 Figure 4: Annual Vehicle Count by Park Entrance .................................................................................. 14 Figure 5: Yosemite Area Regional Transportation System ..................................................................... 18 Figure 6: YARTS Historic Annual Ridership by Route .............................................................................. 23 Figure 7: 2019 Monthly Ridership by Route ........................................................................................... 28 Figure 8: 2020 Monthly Ridership by Route ........................................................................................... 28 Figure 9: 2019 Average Weekday and Weekend/Holiday Ridership ...................................................... 31

YARTS Strategic Plan Working Paper
- 1 -
Chapter 1: Introduction
INTRODUCTION
Since its founding in 2000, the Yosemite Area Regional Transit System (YARTS) has grown to be a crucial element in Yosemite National Park’s transportation strategy and a key mobility and economic resource for the overall Yosemite Region. However, several factors currently are threatening the long-term viability of the YARTS program, as it currently stands. Most obviously, the COVID-19 pandemic has reduced ridership and impacted operations while also reducing potential funding levels. The aging and insufficient fleet of YARTS-owned vehicles also imposes new financial requirements on the system. Finally, the short-term nature of YARTS agreements and contracting arrangements limits the stability of the program and the availability to make long-term investments.
Concerned with these issues, the YARTS Board of Directors has initiated this Strategic Plan to define new approaches to service levels, capital improvements, financial plans and institutional strategies to define a sustainable long-term framework for the program. It builds on the Short-Range Transit Plan (SRTP) completed in 2018, considering subsequent changes in ridership, financial support and contracting arrangement and including a review of previous plans considering these changing conditions.
This Working Paper is an interim study product, reviewing existing conditions and framing the current issues. It is intended to serve as a resource to the Board, the Authority Advisory Committee and other decision makers in future discussions. This document the groundwork for the analysis by providing an overview of the current institutional framework, reviewing the visitation to Yosemite National Park, analyzing recent service and ridership statistics for YARTS, reviewing capital needs (including bus replacement and zero emission requirements), assessing funding levels, and framing the challenges facing the program. These future discussions and technical analysis will form the basis for final strategies for implementation.
It should be noted at the outset that this plan is looking at conditions beyond the end of the COVID-19 pandemic, which (as of this writing) appears to be on track to occur in mid-2021. Though it is uncertain whether there will be long-term permanent impacts to travel patterns, this analysis focuses on conditions prior to the outset of the pandemic impacts in March 2020.

YARTS Strategic Plan Working Paper
- 2 -
This page intentionally left blank

YARTS Strategic Plan Working Paper
- 3 -
Chapter 2: YARTS Institutional Overview
INSTITUTIONAL STRUCTURE OF YARTS
The Yosemite Area Regional Transportation System (YARTS) is a Joint Powers Authority (JPA) whose members currently consist of Merced County, Mariposa County and Mono County. Tuolumne County is presently in the process of joining the JPA. YARTS is overseen by a Board of Commissioners (the Board) which includes six voting members and four non-voting members. Voting members consist of two elected Supervisors from each of the three member-counties, while non-voting members consist of one elected official from Madera County, one elected official from Tuolumne County and two elected officials from Fresno County. The makeup of the YARTS Board is depicted in Figure 1.
An 18-member Authority Advisory Committee (AAC) assists the YARTS Board by studying issues and making recommendations to YARTS on policy matters and projects. Three members of the AAC are nominated by each member county of the JPA Board, two by the National Park Service, two by the YARTS Executive Director, and one each from Madera and Tuolumne Counties, and three from Fresno County. In addition to the JPA, YARTS has a number of agreements with additional entities, as described below.
YARTS Joint Powers Authority
YARTS is a party to many agreements that define YARTS service and funding arrangements. In some cases, YARTS is the contracting agency and in others it is the contractor. The following is a summary of contractual agreements.
YARTS Joint Powers Authority Agreement
The original YARTS JPA was entered into on September 21, 1999 between the Counties of Merced, Mariposa, and Mono (JPA parties), and was most recently amended on May 9, 2017. The purpose of the JPA is planning, operating, managing, and evaluating transportation improvements within and among the respective JPA parties’ jurisdictions around Yosemite National Park. The JPA was borne out of a common desire, not only among the JPA parties but also the National Park Service and Yosemite Regional Strategic Board, to address the transportation impacts of continued growth in Yosemite visitation and the need for transportation alternatives that helped protect the visitor experience and natural resources of the area.
The JPA established YARTS as a separate public entity with the stated purpose to start an initial two-year passenger bus demonstration project to serve the geographic jurisdictions of the JPA parties and Yosemite. Recognizing that a close relationship with the National Park Service (NPS) was critical, the JPA required that YARTS work with the NPS, as well as Caltrans and the Forest Service.
Per the JPA, the Board consists of two voting member from each JPA party along with one alternate Director, from among the elected official of any political office in the member geographic area. The JPA defines that the Board has the power to contract with an Administering Agency, enter into contracts, acquire and hold property, incur debt, accept funding, invest, have an unpaid Board, and other necessary acts in the provision of passenger bus service.

YARTS Strategic Plan Working Paper
- 4 -
The JPA established the YARTS fiscal year (FY) as October 1st through September 30th. Moreover, the JPA defines a process for creating and adopting a budget, making contributions of funds or in-kind support, appointing a treasurer and controller, and distributing assets if dissolved.
YARTS JPA Bylaws
The YARTS by laws were adopted by the YARTS Board of Commissioners on June 10, 2013 and, in many ways, reinforced and further defined pieces contained in the JPA. The bylaws establish the objectives of the Authority as:
• Preservation of the natural environment of the Yosemite Region • Coordination and communication with Yosemite National Park • Accommodation of increasing visitation to Yosemite and surrounding region, of transportation
options
Mariposa County
2 elected Supervisors
Merced County
2 elected Supervisors
Mono County
2 elected Supervisors
Madera County Supervisor Tom Wheeler
Fresno County Mayor Rhonda Armstrong, City of Kerman/Fresno County
Figure 1: YARTS 2020-21 Board of Directors
VOTING MEMBERS
Supervisor Rosemarie Smallcombe
Supervisor Miles Menetrey
Supervisor Daron McDaniel
Supervisor Scott Silveira, Chair 2020-2021
Supervisor Stacy Corless
Supervisor Bob Gardner, Vice Chair 2020-2021
NON-VOTING MEMBERS
Tuolumne County Supervisor John Gray

YARTS Strategic Plan Working Paper
- 5 -
• Coordinate of local policy and planning of regional transit service and financial resources
The bylaws establish the positions of Chairperson and Vice-Chairperson. The Chairperson is required to have at least one year’s experience as a Commissioner.
The powers and functions of the authority are defined in these bylaws as the ability of the Board to:
• Plan, establish, manage, and evaluate passenger bus service • Employ an Executive Director • Employ agents and employees and contract for services • Make and enter into contracts and agreements • Acquire, hold, and convey property • Incur debt, obligations, and liabilities • Accept funding • Have members of the Board serve without compensation • Establish committees • Exercise any and all other powers provided by California Code section 6547
The bylaws state that authority meetings must be held at least quarterly with proper noticing and agenda posting. Furthermore, the bylaws state that the Board will appoint an Executive Director to manage and administer the transit service plan and budget, in addition to serving as the secretary of the board. A quorum is defined as a majority of voting members. A majority vote of all voting members is required to approve all expenditures.
Importantly, the JPA does not define specific funding requirements on the part of any participant.
YARTS AGREEMENTS
YARTS is a party to many agreements that define YARTS service and funding arrangements. In some cases, YARTS is the contracting agency and in others it is the contractor. The following summary of contractual agreements is all related to financial transactions with YARTS.
YARTS and Merced County Association of Governments Agreement for Management and Marketing
The Merced County Association of Governments (MCAG), under an agreement with the YARTS JPA, provides management, marketing, financial and grant administration, and transportation planning services on behalf of YARTS. In return, YARTS agrees to pay MCAG an annual fee for this service, equal to $465,506 for Fiscal Year 2020/21. This agreement is renewable annually, with the current term expiring June 30, 2021. More specifically, the duties consist of the following:
• Administration and Management – Conduct JPA Board and AAC meetings, accounting services, grants management, contracts and agreements (with Amtrak, Fresno COG, Tuolumne County, etc.), state and federal reporting, maintain YARTS-owned property;

YARTS Strategic Plan Working Paper
- 6 -
• Planning – Conduct passenger surveys, evaluate service modifications, participate in SSTAC meetings, oversee SRTP process, coordinate with other public and private transportation services; and
• Marketing – Prepare and distribute schedules and brochures, oversee the reservation process, maintain website and social media, administer ticket sales, distribute public information and advertising.
This arrangement has been in place since the formation of YARTS in 2000 and appears to work well and in the best interest of YARTS. It allows YARTS to benefit from the cost savings associated with sharing staff resources (and office space) between YARTS and the other transit services (The Bus) managed by MCAG. Managing and marketing a public transit system is a complicated endeavor, particularly with regards to state and federal requirements, the high level of coordination needed for a regional service, the needs specific to serving a national park, and the need to address the many challenges of service operations in the Sierra. Providing the necessary level of expertise as a separate staff would almost certainly incur a greater overall cost than the current arrangement. Considering the relative staff size of the various JPA member organizations, shifting this work to another of these organizations would require significant expansion of the existing staff, with associated increase in costs. In sum, the current YARTS/MCAG agreement is the appropriate means of providing these services in the most cost-effective manner.
The year-to-year agreement, however, places an additional administrative burden on MCAG that could be avoided through a longer-term agreement (such as a five-year agreement). The short-term nature of the contract also has the potential to reduce employees’ level of commitment to their jobs. It would also be beneficial to align the contract term with the federal fiscal year (October to September) as the separate agreement with the National Park Service is a major funding source and as this would avoid the potential of changing YARTS administration in the middle of the busy summer season.
YARTS -- VIA Agreement for Daily Operations
YARTS contracts with VIA Adventures, Inc. for daily operations of the YARTS fixed route services, including service operations, bus maintenance and bus fuel. Since the current contract was signed, there have been two amendments, as discussed below.
Original Agreement
The current agreement was enacted on November 1, 20181. It identified a two-year term, along with the option to extend for up to two additional 1-year terms. Key points of this agreement are as follows:
• Broadly speaking, VIA Adventures is responsible for the day-to-day operations of YARTS services, including providing staff (drivers, schedules/dispatchers and supervisors, trainers) and up to 12 over-the-road coaches (to supplement the 10 owned by YARTS), maintaining and fueling all vehicles, and operating all scheduled services.
1 As a result of the term of the contract, the service year is from November 1st to October 31st.
YARTS Strategic Plan Working Paper
- 7 -
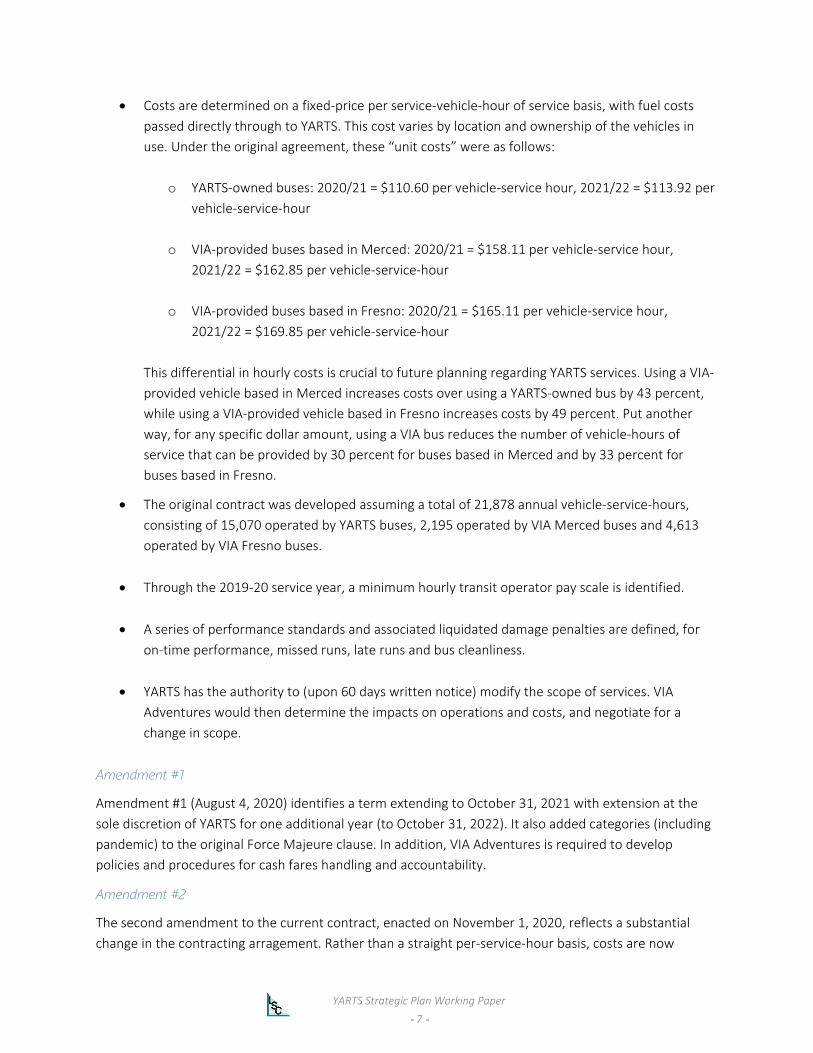
• Costs are determined on a fixed-price per service-vehicle-hour of service basis, with fuel costs passed directly through to YARTS. This cost varies by location and ownership of the vehicles in use. Under the original agreement, these “unit costs” were as follows:
o YARTS-owned buses: 2020/21 = $110.60 per vehicle-service hour, 2021/22 = $113.92 per
vehicle-service-hour
o VIA-provided buses based in Merced: 2020/21 = $158.11 per vehicle-service hour, 2021/22 = $162.85 per vehicle-service-hour
o VIA-provided buses based in Fresno: 2020/21 = $165.11 per vehicle-service hour,
2021/22 = $169.85 per vehicle-service-hour
This differential in hourly costs is crucial to future planning regarding YARTS services. Using a VIA-provided vehicle based in Merced increases costs over using a YARTS-owned bus by 43 percent, while using a VIA-provided vehicle based in Fresno increases costs by 49 percent. Put another way, for any specific dollar amount, using a VIA bus reduces the number of vehicle-hours of service that can be provided by 30 percent for buses based in Merced and by 33 percent for buses based in Fresno.
• The original contract was developed assuming a total of 21,878 annual vehicle-service-hours, consisting of 15,070 operated by YARTS buses, 2,195 operated by VIA Merced buses and 4,613 operated by VIA Fresno buses.
• Through the 2019-20 service year, a minimum hourly transit operator pay scale is identified.
• A series of performance standards and associated liquidated damage penalties are defined, for on-time performance, missed runs, late runs and bus cleanliness.
• YARTS has the authority to (upon 60 days written notice) modify the scope of services. VIA Adventures would then determine the impacts on operations and costs, and negotiate for a change in scope.
Amendment #1
Amendment #1 (August 4, 2020) identifies a term extending to October 31, 2021 with extension at the sole discretion of YARTS for one additional year (to October 31, 2022). It also added categories (including pandemic) to the original Force Majeure clause. In addition, VIA Adventures is required to develop policies and procedures for cash fares handling and accountability.
Amendment #2
The second amendment to the current contract, enacted on November 1, 2020, reflects a substantial change in the contracting arragement. Rather than a straight per-service-hour basis, costs are now

YARTS Strategic Plan Working Paper
- 8 -
identified on a “fixed plus vehicle-service-hour” basis. Fixed costs are identified as $973,389 per year for the Merced-based service and $310,833 per year for the Fresno-based service, while the hourly costs are at a rate of $57.89 per vehicle-service-hour. Note that this rate does not vary by whether a YARTS-owned bus or a VIA-provided bus is operated, or what base the run initiates from. The costs are based on a total of 16,548 annual vehicle-hours for Merced-based service and 2,902 for Fresno-based service, and total payment shall not exceed $2,471,805. This level of service is 11 percent lower than the number of vehicle-service-hours identified in the original contract.
Discussion
The shift from a straight per-service-hour costing to a fixed-plus-per-service-hour costing is more in line with transit industry standards. The change is beneficial in that it better reflects how costs are actually incurred by the contractor and reduces the risk to the contractor that possible future reductions in service will be an undue financial burden. Using a single variable rate, regardless of whether a YARTS bus or contractor bus is used, tends to mask the additional costs associated with use of a contractor bus. Though under this amended contract YARTS does not immediately see a cost differential, the contractor’s costs to provide some of the necessary fleet are built into the rates. Over the long-term, it is still in YARTS’s interest to eliminate the need for contractor-provided buses.
Under the current agreement, the contractor provides storage and maintenance facility space for YARTS buses at the facility at 300 Grogan Avenue in Merced. Costs incurred by VIA for the facility are considered in the monthly and hourly cost rates. Providing a separate publicly-owned operations/maintenance facility would lower annual ongoing costs for YARTS. In addition, it is not feasible for public funding to be used to install electric charging or hydrogen fueling facilities on the contractor’s lot. As California’s public transit programs move towards zero-emission vehicles, the need for a publicly owned facility (perhaps jointly with other public transit programs) will increase.
YARTS – U.S. Department of the Interior National Park Service Cooperative Agreement
The YARTS and National Park Service (NPS) agreement defines the contribution to YARTS for operating ongoing service on YARTS State Route 140 Route and seasonal service on the YARTS State Route 41 Route, as well as enhanced and seasonal service on Routes 120 East, 120 West, and 140. The most recent cooperative agreement was signed on May 27, 2020. For the Federal 20/21 fiscal year (October 1, 2020 to Sept 30, 2021), Federal funding totaling $1,403,788 is identified, as shown in Table 1. The service levels identified in this table exceed the minimum defined in the Agreement text, in that the six daily roundtrips on SR 140 exceed the five identified in the text. The Agreement also indicates that service levels may grow to eight daily year-round trips on Highway 140, five summer and three winter roundtrips on both Highway 41 and Highway 120 West, and three summer roundtrips on Highway 120 East/US 395.
Funding in subsequent years will reflect services as modified, based on the specific service parameters. The agreement specifies that YARTS operate four peak-season routes providing connections to the San Joaquin Valley and Mono Basin. Beyond providing funding, the NPS is required to encourage use of the YARTS system through marketing and coordination and provide park access.
The NPS Agreement outlines goals for the project, which can be summarized as the NPS and YARTS working cooperatively to provide public transportation services in a safe and convenient manner along

YARTS Strategic Plan Working Paper
- 9 -
the State Routes (or Highways) 41, 120, and 140 corridors to Yosemite Valley, for employment, recreation, shopping, education, and social service trips, so long as service can be provided in a cost-effective manner. The agreement also defines project objectives, such as minimum numbers of trips, on-time performance, et cetera.
The most recent agreement includes a statement about COVID-19 provisions, essentially conditioning the award of financial support based on COVID-19 conditions, and potentially waiving minimum service requirements because of those conditions.
The statements of work beyond the first year are loosely defined in the agreement, with detailed statements of work to be defined annually via modification of the agreement.
YARTS – Mariposa County Agreement
The YARTS and Mariposa County contract defines the Mariposa County annual funding contribution for operation of public transportation services that connect Mariposa with Yosemite on the Highway 140 Route. The original term of the agreement was from July 1, 2017 for one year, and is annually renewable, with the current agreement running from July 1, 2020 to June 30, 2021. Under this agreement, YARTS is required to provide Route 140 services, though a specific level of service is not defined, as well as provide planning, marketing and management services. Mariposa County is required to pay YARTS an annual service contribution, with the amount for the 2020-21 fiscal year not to exceed $191,000, due in four quarterly payment.
Table 1: NPS Financial Assistance for YARTS Service2020 Federal Fiscal Year
RoutesOrigin by County
Round Trips
ProvidedScheduled Dates of
ServiceHours of
Operation 1Days in Service
Recipient Operating
Costs 2 NPS Award
Highway 41, Wawona Road Fresno Madera 3 5/11/20 to 9/11/20 (summer
only) 9 124 $569,160 $200,000
Highway 120 East (Tioga Road) and U.S. 395 Mono 1 6/15 to 10/16/20 (summer) 7 139 $165,410 $79,360
1 5/13/20 to 9/30/20 142 $152,082
2 5/25/20 to 8/31/20 102 $218,484
Highway 140, El Portal Road Merced Mariposa 6 7/1/20 to 6/30/21 (year-
round) 7.9 361 $2,908,938
Highway 120 East (Tioga Road) and U.S. 395 Mono 1 6/1 to 10/16/20 (summer) 7 153 $182,070
Highway 140, El Portal Road Merced Mariposa 2 5/18/20 to 9/30/20 (summer) 7.9 136 $365,296 $240,000
Note 1: Per bus, per day $4,561,440
$1,403,788
Source: NPS Cooperative Agreement
Highway 120 West Tuolumne 6.3 $348,768
$535,660
Recipient's Operating Cost
Note 2: Hourly rate = $170 x Hours of Operation per bus per day x Days in Service
Total Financial Assistance

YARTS Strategic Plan Working Paper
- 10 -
YARTS – Fresno Council of Governments Agreement
The YARTS agreement with Fresno Council of Governments (FCOG) agreement was initially enacted in 2014 to provide funding for Route 41 service. Under this agreement, FCOG payments are equal to the operating/administrative costs of the service minus the credit revenues (passenger fares, NPS funding and Amtrak funding).
The most recent (the third) amendment defines a maximum contribution of $746,776 for services from May 2020 through September 2020, less any revenues collected from other sources, resulting in a maximum total of $478,526 from FCOG. Due to the COVID-related drop in ridership, the rate in 2020 was cut by one-third, to $678.32 per day. A new agreement is expected for summer 2021 service, to be negotiated in the spring.
YARTS – National Railroad Passenger Corp (Amtrak) Agreement
The services contract between Amtrak and YARTS, originally enacted in 2007, was most recently amended on July 1, 2020 to extend until June 30, 2021. It defines the Amtrak contribution to YARTS for Thruway bus service provided by YARTS on the Highway 140 Route and the Highway 41 Route. The three-year amendment for service between July 1, 2017 to June 30, 2020, wherein YARTS is the contractor, included a daily rate for service between Merced and Yosemite of $987.84, with an option to increase the daily amount by 3 percent each of the final two years of an extension of the contract. The contract was extended by amendment to continue through June 30, 2021 at a daily rate of $1,017.47. However, due to the COVID-19 related capacity restrictions and drop in ridership, the rate has been cut by one third for this year, to $678.31.
YARTS Strategic Plan Working Paper
- 11 -
Chapter 3: Review of Yosemite Visitation and YARTS Service
YOSEMITE NATIONAL PARK VISITATION
Historic Annual and Seasonal Visitation to Yosemite National Park
Over the past two decades, the number of visitors to Yosemite National Park has averaged 3.7 million per year, as shown in Table 2 and Figure 2. Since 2015, annual visitation has exceeded 4.0 million people, reaching a peak of 5,028,868 visitors in 2016. In recent years, rock falls and wildfires have closed portions of the park at various times, yet 4,422,861 visitors still came to the park in 2019. This reflects a 12 percent decline from the peak in 2016.
Table 2 and Figure 2 also show the number of visitors by month for the past two decades. This data provides some insight into the annual increases in visitation. Summer continues to be the most popular time of year with 1,917,240 people visiting the park in 2019. As shown in Figure 3, the fall season (September – November) has shown growth over the past five years with 1,264,201 visitors in 2019, or a 16.6 percent increase in visitors from 2015. Over these five years, summer (June to August) visitation has grown by 5.7 percent, spring (April and May) visitation has been essentially unchanged, while winter (December through March) visitation declined by 8.6 percent. Since the completion of the YARTS SRTP, visitation over the past three years has increased by 5.6 percent in summer, 4.1 percent in fall, and 3.3 percent in winter, while declining 10.9 percent in spring.
Visitation by Gateway to Yosemite National Park
There are four key corridors serving Yosemite Valley: Arch Rock, South Entrance, Big Oak Flat and Tioga Pass. As shown in Table 3 and Figure 4, the South Entrance (via State Route (SR) 41) has historically received the highest number of vehicles (31 percent on average), although in over the past few years Arch Rock and Big Oak Flat have also received more visitors due to wildfires affecting the South Entrance. Tioga Pass, which is closed during winter months, receives an average of 15 percent.
The number and types of visitors over the past five years has been tracked by each entrance kiosk, as shown in Table 4. Over the past five years, 97 percent of visitors entering through Arch Rock, Big Oak Flat and Tioga Pass were recreational visitors and just 3 percent were non-recreational (employees, etc.). The South Entrance has the most non-recreational visitors (5 percent). In terms of non-recreational visitors, 39 percent entered through the South Gate and just 11 percent enter through Tioga Pass in 2019.
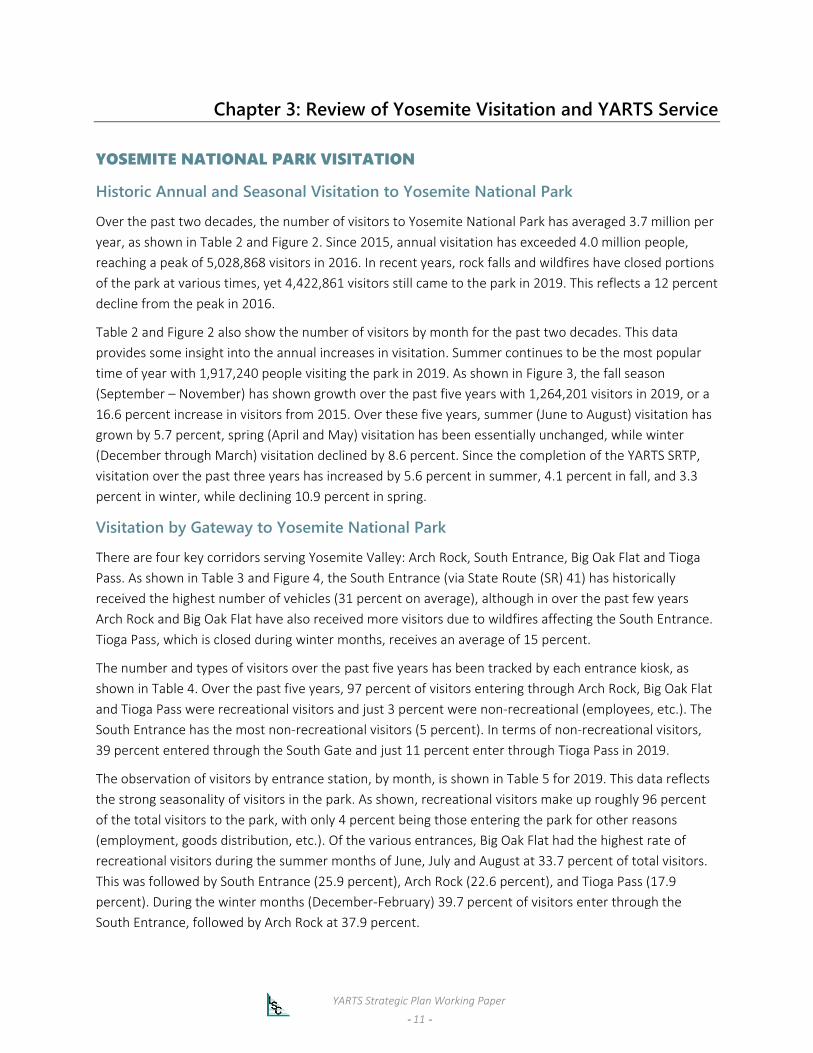
The observation of visitors by entrance station, by month, is shown in Table 5 for 2019. This data reflects the strong seasonality of visitors in the park. As shown, recreational visitors make up roughly 96 percent of the total visitors to the park, with only 4 percent being those entering the park for other reasons (employment, goods distribution, etc.). Of the various entrances, Big Oak Flat had the highest rate of recreational visitors during the summer months of June, July and August at 33.7 percent of total visitors. This was followed by South Entrance (25.9 percent), Arch Rock (22.6 percent), and Tioga Pass (17.9 percent). During the winter months (December-February) 39.7 percent of visitors enter through the South Entrance, followed by Arch Rock at 37.9 percent.

YARTS Strategic Plan Working Paper
- 12 -
Tabl
e 2:
Mon
thly
Visi
tor C
ount
(200
0-20
19)
JAN
FEB
MAR
APR
MAY
JUN
JUL
AUG
SEP
OCT
NO
VDE
CTo
tal
2019
116,
746
111,
665
173,
610
297,
207
393,
004
496,
625
717,
462
703,
153
584,
664
448,
939
230,
598
149,
188
4,42
2,86
1
2018
129,
432
143,
321
170,
681
278,
349
385,
670
543,
690
504,
230
441,
867
524,
387
360,
776
215,
854
311,
179
4,00
9,43
620
1712
0,02
511
9,42
116
6,79
330
2,55
347
1,84
456
5,70
263
3,35
161
5,89
256
6,27
942
9,82
721
7,92
712
7,27
64,
336,
890
2016
139,
780
201,
601
286,
990
305,
092
457,
309
703,
614
780,
728
692,
450
598,
428
483,
232
218,
998
160,
646
5,02
8,86
820
1512
8,31
813
5,31
619
4,66
728
1,32
840
8,12
154
5,23
162
6,00
963
6,93
652
7,40
235
7,22
316
9,42
514
0,24
14,
150,
217
2014
112,
133
113,
403
146,
750
242,
722
333,
308
496,
363
623,
663
654,
157
467,
205
354,
769
203,
678
134,
491
3,88
2,64
220
1310
3,91
011
4,44
016
5,40
923
1,17
837
0,42
250
8,94
161
1,53
855
2,13
746
0,85
527
9,52
616
1,35
613
1,47
93,
691,
191
2012
120,
496
113,
341
136,
687
243,
102
356,
500
528,
186
623,
101
660,
118
482,
004
322,
687
141,
868
125,
314
3,85
3,40
420
1110
0,71
893
,588
100,
433
231,
372
356,
588
503,
741
704,
553
699,
749
533,
502
360,
449
139,
079
127,
621
3,95
1,39
320
1096
,089
100,
379
149,
651
224,
461
382,
414
521,
059
643,
566
659,
857
520,
210
356,
370
148,
459
98,8
933,
901,
408
2009
101,
984
78,7
9513
2,71
123
0,82
839
9,68
348
3,38
258
6,59
164
3,30
047
1,53
034
6,82
615
1,29
711
0,54
53,
737,
472
2008
95,1
2410
7,72
915
3,73
519
9,59
236
1,19
347
3,18
653
9,87
454
3,79
941
6,91
829
5,54
714
6,83
897
,979
3,43
1,51
420
0799
,892
100,
941
135,
925
219,
854
374,
184
466,
054
543,
235
550,
172
417,
882
298,
122
178,
846
118,
321
3,50
3,42
820
0610
4,59
110
1,19
412
5,55
618
9,47
230
9,38
738
2,97
251
0,93
252
8,25
442
1,50
229
8,77
116
5,49
910
4,51
43,
242,
644
2005
91,2
3810
3,75
614
3,33
519
5,38
530
4,55
241
3,12
455
4,56
748
5,64
343
0,13
431
8,50
815
2,67
111
1,23
13,
304,
144
2004
100,
020
106,
258
146,
876
228,
212
326,
017
449,
566
531,
864
508,
094
393,
437
272,
200
121,
622
96,7
453,
280,
911
2003
116,
984
111,
506
137,
550
174,
337
280,
335
445,
887
536,
683
604,
093
405,
605
316,
366
136,
390
112,
928
3,37
8,66
420
0210
8,90
611
3,69
514
1,76
618
6,68
229
5,51
143
6,86
251
3,78
957
0,91
442
6,68
430
0,91
914
9,82
811
6,31
13,
361,
867
2001
102,
455
101,
897
142,
141
192,
936
315,
897
434,
014
528,
849
591,
196
448,
519
264,
465
137,
876
108,
486
3,36
8,73
120
0093
,633
103,
444
136,
523
216,
087
317,
009
454,
638
548,
440
546,
981
388,
707
324,
484
144,
958
125,
999
3,40
0,90
3
Aver
age
109,
124
113,
785
154,
389
233,
537
359,
947
492,
642
593,
151
594,
438
474,
293
339,
500
166,
653
130,
469
3,76
1,92
9So
urce
: htt
ps:/
/irm
a.np
s.go
v/St
ats/
SSRS
Repo
rts

YARTS Strategic Plan Working Paper
- 13 -
3,400,903
3,737,472
4,150,217
5,028,868
4,009,436
0
1,000,000
2,000,000
3,000,000
4,000,000
5,000,000
6,000,000
2000
2001
2002
2003
2004
2005
2006
2007
2008
2009
2010
2011
2012
2013
2014
2015
2016
2017
2018
2019
Figure 2: Total Annual Visitors (2000-2019)
0
500,000
1,000,000
1,500,000
2,000,000
2,500,000
2000
2001
2002
2003
2004
2005
2006
2007
2008
2009
2010
2011
2012
2013
2014
2015
2016
2017
2018
2019
Seas
onal
Vis
itatio
n
Figure 3: Annual Visitors by Season (2000-2019)
Winter
Spring
Summer
Fall

YARTS Strategic Plan Working Paper
- 14 -
Table 3: Annual Vehicle Count by Park Entrance (1998-2019)Year Arch Rock South Gate Big Oak Flat Tioga Pass Total2019 500,591 356,632 508,295 177,794 1,543,3122018 380,520 181,375 427,409 142,766 1,132,0702017 562,150 488,373 412,740 181,377 1,644,6402016 494,331 575,399 546,804 264,245 1,880,7792015 424,316 497,056 408,943 204,882 1,535,1972014 399,544 479,824 344,345 218,950 1,442,6632013 389,005 450,725 318,088 207,250 1,365,0682012 391,468 446,456 354,446 227,150 1,419,5202011 422,988 445,426 395,178 201,150 1,464,7422010 413,561 455,531 371,634 211,993 1,452,7192009 387,502 442,679 347,999 227,490 1,405,6702008 350,771 423,689 327,177 177,695 1,279,3322007 348,570 451,045 319,034 189,450 1,308,0992006 217,742 452,546 349,106 159,933 1,179,3272005 398,723 384,783 317,504 181,463 1,282,4732004 351,588 385,167 293,620 181,925 1,212,3002003 345,097 400,800 291,748 214,023 1,251,6682002 345,476 384,858 297,869 218,950 1,247,1532001 350,007 375,261 306,554 218,950 1,250,7722000 315,250 392,603 328,910 182,732 1,219,495
Source: https://irma.nps.gov/Stats/SSRSReports/Park%20Specific%20Reports/Park%20YTD%20Version%201
0
100,000
200,000
300,000
400,000
500,000
600,000
700,000
2000
2001
2002
2003
2004
2005
2006
2007
2008
2009
2010
2011
2012
2013
2014
2015
2016
2017
2018
2019
Figure 4: Annual Vehicle Count by Park Entrance
Arch Rock South Gate Big Oak Flat Tioga Pass

YARTS Strategic Plan Working Paper
- 15 -
YARTS SERVICES OVERVIEW
Currently YARTS has one year-round route (SR 140 Route between Merced and Yosemite) and three seasonal routes running between May and September (Routes SR 41 from Fresno, SR 120 from Sonora, and SR 120/395 from Mammoth Lakes). A map of the routes is shown in Figure 5, and a list of operating seasons for a typical year, including runs and vehicles required, is shown in Table 6. In 2020, YARTS has continued to operate their services as usual through the duration of the COVID-19 pandemic.
SR 140 Route
Operated every day except New Year’s Day, Easter Sunday, Thanksgiving and Christmas, this route provides service between Merced and Yosemite Valley. In peak season, eight eastbound trips are operated (seven from Merced and one from Mariposa) and nine westbound trips are operated (eight from Yosemite to Merced and one from Yosemite and one from Midpines to Merced). Service is reduced by one trip each direction on weekends and holidays. The 140 Route operates reduced service (Runs 140-1 and 140-27, which are scheduled to serve commuters, are not operated) on weekends and on the following holidays: President’s Day, Memorial Day, Independence Day, Veteran’s Day, Thanksgiving Day, Christmas Day, New Year’s Day.
Table 4: Annual Visitation by Major Entrance Station (2015-2019)2019
% of All Visitors2015 2016 2017 2018 2019 # % By Type
Arch RockTotal Recreation Visitors 1,050,610 1,169,124 1,317,788 866,839 1,158,421 107,811 10% 26%Total Non-Rec Visitors 33,945 39,150 44,234 30,441 40,047 6,102 18% 25%Total Visitors 1,084,555 1,208,274 1,362,022 897,279 1,198,468 113,913 11% 26%South GateTotal Recreation Visitors 1,321,296 1,538,459 1,259,512 1,247,169 1,197,789 -123,507 -9% 27%Total Non-Rec Visitors 69,588 81,750 66,998 65,980 63,102 -6,486 -9% 39%Total Visitors 1,390,884 1,620,209 1,326,510 1,313,149 1,260,891 -129,993 -9% 28%Big Oak FlatTotal Recreation Visitors 1,141,535 1,491,873 1,141,652 1,189,641 1,414,323 272,788 24% 32%Total Non-Rec Visitors 32,715 43,031 32,736 34,193 40,663 7,947 24% 25%Total Visitors 1,174,250 1,534,903 1,174,388 1,223,834 1,454,985 280,735 24% 32%Tioga PassTotal Recreation Visitors 592,171 754,819 518,879 661,741 603,683 11,511 2% 14%Total Non-Rec Visitors 16,391 21,140 14,510 18,624 17,124 734 4% 11%Total Visitors 608,562 775,959 533,389 680,365 620,807 12,245 2% 14%TOTALTotal Recreation Visitors 4,105,613 4,954,275 4,237,831 3,965,390 4,374,215 268,603 7% 100%Total Non-Rec Visitors 152,639 185,070 158,478 149,238 160,936 8,297 5% 100%Total Visitors 4,258,252 5,139,346 4,396,309 4,114,627 4,535,151 276,899 7% 100%
Arch Rock 97% 97% 97% 97% 97%South Gate 95% 95% 95% 95% 95%Big Oak Flat 97% 97% 97% 97% 97%Tioga Pass 97% 97% 97% 97% 97%
Source: NPS Monthly Year-to-Date tables. Hetch Hetchy entrance data not included.
Change 2015-19
Percent Recreational Visitors

YARTS Strategic Plan Working Paper
- 16 -
This route requires up to 3 hours 11 minutes to operate in the eastbound direction, and 2 hours 45 minutes in the westbound direction. A full one-way trip is 87 miles (174-mile round trip). This route requires seven buses to operate a full summer schedule, while in winter five buses are needed on weekdays and four on weekends/holidays. Note that these figures are only those in operations, excluding spares.
Table 7 provides a review of recent changes in SR 140 Route services since 2018, both those identified in the 2018 Short Range Transit Plan (SRTP) as well as other changes. Key changes are the addition of eastbound service in the morning, the reduction in short runs ending in Mariposa, and shifting run times to provide greater choices in departure times and matching changes in train times. The required daily number of buses to operate the service remains unchanged at seven.
SR 120 Route
In summer, three eastbound trips are operated each day between the Black Oak Casino 10 miles east of Sonora and Yosemite Valley in the morning, with three westbound trips in the afternoon. Between June 22 and August 31 three trips are operated daily in each direction, dropping to one trip in September. This route requires 3 hours 10 minutes to operate into the Valley and 3 hours 15 minutes on the outbound runs. The route is 84 miles in one direction, or 168 miles round-trip.
Over the last few years, the number of daily runs has remained unchanged, though the season has been shortened to eliminate service from mid-May to June 21st.
SR 120 East/US 395 Route
Dependent on when Tioga Pass is cleared of snow (at the discretion of the National Park Service), service is provided between Yosemite Valley and Mammoth Lakes (via Lee Vining and June Lake) seven days a week from June 22nd to October 15th, with one bus operating prior to July 1 and after Labor Day. The route stretches a total of 110 miles (or 220 miles per round-trip). Over the last few years, this route has been streamlined to drop service to stops along the June Lake Loop, and to make stops in Lee Vining on-request only.
SR 41 Route
This service consists of three roundtrips per day seven days a week, from mid-June through mid-September, with two runs into Yosemite in the morning and one mid-day, paired with one mid-day southbound run and two in the late afternoon. All Fresno runs originate at the Fresno Yosemite International Airport and terminate at the airport if passengers request such. This is the longest route in the YARTS system, at 111 miles in length and 222 miles per round-trip. The schedule requires up to 3 hours 55 minutes into Yosemite Valley and 3 hours 30 minutes leaving the Valley.
Over the last few years, this service has been reduced in the number of full runs and by dropping runs between Oakhurst and Fresno. Service off of SR 41 to The Pines Resort has also been eliminated, as has service between mid-May and mid-June.
YARTS Strategic Plan Working Paper
- 17 -
Tabl
e 5:
201
9 M
onth
ly V
isita
tion
by M
ajor
Ent
ranc
e St
atio
n
Jan
Feb
Mar
Apr
May
Jun
Jul
Aug
Sep
Oct
Nov
Dec
Sum
mer
Win
ter
Arch
Roc
kTo
tal R
ecre
atio
n Vi
sitor
s45
,731
45,3
0963
,691
98,7
0412
5,89
114
0,43
514
7,57
313
8,64
013
2,77
596
,401
71,7
7151
,500
22.6
%37
.9%
Tota
l Non
-Rec
Visi
tors
1,62
41,
490
2,13
73,
339
4,24
14,
852
5,20
34,
922
4,57
83,
362
2,50
41,
794
Tota
l Visi
tors
47,3
5546
,799
65,8
2810
2,04
313
0,13
114
5,28
815
2,77
614
3,56
313
7,35
399
,763
74,2
7553
,294
Sout
h En
tran
ceTo
tal R
ecre
atio
n Vi
sitor
s44
,784
48,0
5857
,440
89,2
9612
2,33
314
8,67
317
1,06
516
9,43
312
6,16
810
4,24
559
,724
56,5
6925
.9%
39.7
%To
tal N
on-R
ec V
isito
rs2,
496
2,64
63,
038
4,72
56,
293
7,77
09,
114
9,11
46,
510
5,20
83,
150
3,03
8To
tal V
isito
rs47
,280
50,7
0460
,478
94,0
2112
8,62
615
6,44
318
0,17
917
8,54
713
2,67
810
9,45
362
,874
59,6
07Bi
g O
ak F
lat
Tota
l Rec
reat
ion
Visit
ors
25,9
7318
,104
50,1
1010
9,20
713
6,17
919
6,07
422
5,81
321
4,64
417
8,09
814
7,08
572
,547
40,4
9033
.7%
22.5
%To
tal N
on-R
ec V
isito
rs76
852
71,
440
3,12
33,
911
5,66
36,
516
6,18
85,
118
4,19
32,
079
1,13
7To
tal V
isito
rs26
,741
18,6
3151
,550
112,
330
140,
090
201,
737
232,
328
220,
832
183,
216
151,
278
74,6
2641
,627
Tiog
a Pa
ssTo
tal R
ecre
atio
n Vi
sitor
s0
00
00
016
4,87
117
4,11
914
1,28
096
,856
26,5
570
17.9
%0.
0%To
tal N
on-R
ec V
isito
rs0
00
00
04,
738
4,90
53,
970
2,74
976
30
Tota
l Visi
tors
00
00
00
169,
609
179,
024
145,
250
99,6
0427
,319
0TO
TAL
Tota
l Rec
reat
ion
Visit
ors
116,
488
111,
471
171,
241
297,
207
384,
402
485,
183
709,
322
696,
836
578,
322
444,
587
230,
598
148,
559
41.7
%8.
3%To
tal N
on-R
ec V
isito
rs4,
888
4,66
36,
615
11,1
8714
,445
18,2
8525
,571
25,1
2920
,176
15,5
128,
496
5,96
91.
5%0.
3%To
tal V
isito
rs12
1,37
611
6,13
417
7,85
630
8,39
439
8,84
750
3,46
873
4,89
272
1,96
659
8,49
846
0,09
823
9,09
415
4,52
8-
-
Perc
ent o
f Tot
alRe
crea
tion
Visit
ors
96%
96%
96%
96%
96%
96%
97%
97%
97%
97%
96%
96%
Non
-Rec
reat
ion
Visit
ors
4%4%
4%4%
4%4%
3%3%
3%3%
4%4%
Sour
ce: N
PS M
onth
ly Y
ear-
to-D
ate
tabl
es. H
etch
Het
chy
entr
ance
dat
a no
t inc
lude
d.
Perc
ent o
f Rec
. Vis
itors

YARTS Strategic Plan Working Paper
- 18 -

YARTS Strategic Plan Working Paper
- 19 -
Table 6: Summary of Existing YART Service
41
Service Parameters Summer WinterPeak
SummerShoulder Season
Peak Summer
Shoulder Season Summer
Peak Summer
Shoulder Season Winter
Start Date 11-Jun 1-Oct 1-Jul 22-Jun 22-Jun 1-Sep 22-JunEnd Date 30-Sep 10-Jun 31-Aug 30-Jun 31-Aug 30-Sep 11-SepStart Date -- -- -- 1-Sep -- -- --End Date -- -- -- 15-Oct -- -- --Days per Year 111 254 61 52 70 29 811-Way Runs per Day
Weekdays 17 12 4 2 6 2 6 33 21 12Weekends/Holidays 15 9 4 2 6 2 6 31 19 9
Required # of Buses in OperationWeekdays 7 5 2 1 3 1 3 15 9 5Weekends/Holidays 7 4 2 1 3 1 3 15 9 4
Source: LSC
Route
140 120/395 120 Total
Table 7: Recent YARTS Sevice Changes
YARTS 2018 SRTP Service Plan Elements StatusAdd 140 Route Summer Run (12:50 PM Eastbound, 9:05 PM Westbound)
Not implemented, but the last westbound departure shifted 29 minutes later
Serve Mariposa Fairgrounds Yes - 7 runs per day serve Fairgrounds on requestExtend 395 Route Season (Weekdays June and Sept, Weekends in October)
Implemented (7 days a week June through October 15)
Streamline the 120/395 Route by Dropping June Lane Loop Stops, Lee Vining Stops
Implemented (Lee Vining Stops made On Request Only)
Reduce Route 120 Runs to Sonora from 3 to 2, Add 2 Groveland-Valley Round Trips
Not Implemented
Start 120 Route Season on May 1, not May 15 Not Implemented. Service now does not start until June 22.Eliminate 41 Route Oakdale-Fresno Run ImplementedCombine 41 Route Runs ImplementedDrop The Pines Resort on 41 Route Implemented
Shift Route 41 Runs to Better Serve AmtrakNot Implemented. Shifting Run 41-5 1 hour 10 minutes later would provide a good connection from Train 719, but would require shifting Run 41-6 to depart YNP at 7:10 PM.
Operate 1 Run of 41 Route Staring Mid-April Not ImplementedDrop 41 Route Service After Labor Day Not Implemented
120 -- No change, except start date shifted later from 1 bus May 14 and 3 buses June 1 to 3 buses all June 22.
140 Winter Westbound Run at 1:20 PM shifted to 2:15 PMLast 140 Winter Westbound Run shifted earlier from 5:45 PM to 5:05 PM41 Fresno-Oakhurst and Oakhurst-Fresno runs dropped41 Service consolidated into 3 full trips per day in each direction, down from 5 in 2017 and 4 in 2018. Now 2 arrivals in late morning/Noon plus 1 in evening, and 1 departure late morning and 2 late afternoon.
Early AM runs that previously started in Catheys Valley now start in MercedNew 140 Winter Eastbound Run at 8:45 AM140 Winter Eastbound Run at 1:20 PM droppedLast 140 Winter Eastbound Run shifted later from 4:30 PM to 5:25 PMFirst 140 Winter Westbound Run shifter earlier from 9:32 AM to 8:20 AM
Other Changes Implemented Since SRTP
140 Summer Westbound earliest AM run now starts at 8:15 AM, not 9:32 AM
New 140 Summer Eastbound run at 6:00 AMLast 140 Summer Eastbound run shifted later (from 4:30 to 5:45 PM)New 140 Summer Westbound run at 2:30 PM140 Summer Westbound afternoon runs ending in Mariposa dropped from 2 (at 3:15 and 4:35) to 1 at 5:15140 Summer Westbound early AM short run now starts at Midpines, not Mariposa

YARTS Strategic Plan Working Paper
- 20 -
Summary
YARTS routes total 392 miles in length along some of the most challenging rural highways in the nation. Up to 33 one-way runs are operated per day in summer and 12 in winter. The overall service requires 15 buses to operate the summer schedule (excluding spare buses), 9 buses in the shoulder season and 5 in the winter. In comparison with the 10 buses currently owned by YARTS, this indicates that a minimum of five contractor-provided buses are required to operate the summer schedule, while YARTS buses can operate the schedule in other seasons.
Summary of YARTS Vehicle-Hours and Vehicle-Miles
Table 8 presents a summary of the vehicle-miles and vehicle-hours by route and by month from January 2019 to September 2020. For the most recent available 12 months, Route 140 comprises roughly 71 percent of YARTS systemwide services. SR 41 Route comes in second with 14 percent of the revenue hours, followed by SR 120 West Route (9 percent), and SR 120/395 Route (8 percent).
Over the last few years, YARTS overall service levels have been dropping. In total, comparing the 2018 vehicle-hours with the most recent 12 month vehicle-hours, service has been reduced by 3,816 vehicle-hours, or by 33 percent. By route, this change in service levels is as follows:
Route 140 – 11 percent reduction
Route 120 – 26 percent reduction
Route 395/120 – 70 percent increase
Route 41 – 66 percent decrease
These shifts are largely due to reduction in runs on Route 140 and Route 41, a reduction in the days of service on Route 120 and Route 41, and an increase in the days of service on Route 395/120.
Existing Fares
Reflecting the length of the various routes, YARTS has established individual fares for each route and for each trip origin/destination. These fares are presented in Appendix A: YARTS Fare Structure Tables A-1 through A-5 for each of the individual routes. Full fares are roughly equal to 16 cents per mile on the full length of the 41 Route and 22 to 24 cents per mile on the other three routes. Round trip fares are offered at generally twice the one-way fare (no discount). Discounted fares are offered for persons age 62 and above, children age 12 and under, and persons with disabilities. This discount is 44 percent on the SR 140 and SR 120 W. Routes, 58 percent on the SR 41 Route, and only 53 percent on the SR 395/120 Route.
In addition, commuter passes are offered on the SR 140 Route and the SR 41 Route. Monthly passes, 20-ride passes and 10-ride passes are all offered. The monthly pass and 20-ride passes are priced identically, while the 10-ride pass is half the price. These passes provide a 56 percent reduction in the full fare for the 140 Route, and a 58 percent reduction for the 41 Route.

YARTS Strategic Plan Working Paper
- 21 -
Tabl
e 8:
YAR
TS 2
019
and
2020
Ser
vice
Qua
ntiti
es b
y Ro
ute
and
Mon
th
Mon
thSR
140
SR 1
20 W
.SR
41
SR 1
20
E/39
5TO
TAL
% o
f To
tal
SR 1
40SR
120
W
.SR
41
SR 1
20
E/39
5TO
TAL
% o
f To
tal
2019
Janu
ary
27,7
560
00
27,7
565%
964
00
096
45%
Febr
uary
22,2
430
00
22,2
434%
773
00
077
34%
Mar
ch27
,897
00
027
,897
5%96
90
00
969
5%Ap
ril27
,987
00
027
,987
5%97
00
00
970
5%M
ay37
,099
4,87
212
,138
054
,109
10%
1,24
918
942
3.3
01,
860
9%Ju
ne40
,950
15,1
2021
,420
077
,490
14%
1,36
158
575
60
2,70
214
%Ju
ly42
,325
15,6
2420
,560
13,4
2091
,929
16%
1,40
760
577
044
53,
227
16%
Augu
st42
,325
15,4
5620
,774
13,5
3092
,085
16%
1,40
659
877
844
93,
231
16%
Sept
embe
r40
,167
5,71
29,
856
5,94
061
,675
11%
1,33
722
137
019
72,
124
11%
Oct
ober
24,8
140
06,
820
31,6
346%
831
00
226.
31,
057
5%N
ovem
ber
26,0
580
00
26,0
585%
875
00
087
54%
Dece
mbe
r27
,491
00
027
,491
5%91
90
00
919
5%To
tal
387,
112
56,7
8484
,748
39,7
1056
8,35
410
0%13
,060
2,19
73,
097
1,31
819
,671
100%
% o
f Tot
al68
%10
%15
%7%
100%
66%
11%
16%
7%10
0%
2020
Janu
ary
27,9
870
00
27,9
877%
935
00
093
55%
Febr
uary
26,6
340
00
26,6
347%
891
00
089
15%
Mar
ch23
,442
00
023
,442
6%81
10
00
811
4%Ap
ril14
,783
00
014
,783
4%56
40
00
564
3%M
ay11
,966
00
011
,966
3%49
30
00
493
3%Ju
ne31
,165
4,53
65,
994
1980
43,6
7512
%1,
081
176
211
65.7
1,53
28%
July
42,6
3715
,540
20,6
4613
,640
92,4
6324
%1,
437
601
725
453
3,21
716
%Au
gust
42,3
6112
,718
20,6
4613
,640
89,3
6524
%1,
429
493
725
453
3,10
116
%Se
ptem
ber
35,2
034,
788
3,99
65,
060
49,0
4713
%1,
186
182
185
168
1,72
19%
Tota
l (to
dat
e)25
6,17
837
,582
51,2
8234
,320
379,
362
100%
8,82
71,
452
1,84
71,
139
13,2
6410
0%%
of T
otal
68%
10%
14%
9%10
0%67
%11
%14
%9%
100%
Mos
t Rec
ent 1
2 M
onth
sTo
tal
334,
541
37,5
8251
,282
41,1
4046
4,54
511
,452
1,45
21,
847
1,36
516
,115
% o
f Tot
al72
%8%
11%
9%10
0%71
%9%
11%
8%10
0%
Reve
nue
Mile
s by
Rou
teRe
venu
e H
ours
by
Rout
e
Sour
ce: M
CAG
Sum
mar
y Re
port
s, O
ctob
er 2
020

YARTS Strategic Plan Working Paper
- 22 -
Since 2018, full-length base round-trip fares have changed as follows:
• Routes 140 and Route 120 – 50 percent increase in regular fare, no change in discounted fare • Route 395/120 – 44 percent increase in regular fare, no change in discounted fare • Route 41 – 13 percent increase in regular fare, no change in discounted fare
Current and Historical YARTS Ridership
Table 9 summarizes annual ridership by route over the past six years. As shown, a total of 102,143 passengers boarded the YARTS system in 2019, reflecting an increase of 13 percent over the previous year and a slight (1 percent) drop since 2015. By route2, the SR 140 Route in 2019 generated 59 percent of the annual ridership, followed by 15.8 percent on the SR 120 West Route, 8.5 percent on the SR 41 Route, and 6.1 percent on the SR 120 E./US 395 Route. Ridership by route and by year is also shown in Figure 6 dating back to the year 2000. As shown, ridership has fluctuated most along the SR 140 Route and the SR 41 Route over the past three years with overall rideship peaking at 127,055 passengers in 2017. It should be noted that while 2020 is included, winter ridership (after September) has not been included. As of September of 2020, overall ridership has declined by 58.3 percent from the same period in 2019.
Considering the 2015 to 2019 period (pre-COVID), on a percentage basis the data indicates a very large 195 percent increase in ridership on the 120 Route serving Sonora/Tuolumne County. The US 395/120 Route also had a substantial (33 percent) growth in ridership, while the 140 route had a modest (5 percent) growth. On the other hand, the 41 Route ridership dropped by 29 percent, the Amtrak ridership by 38 percent and the Aramark/NPS Ridership fell by 70 percent.
YARTS monthly data can also be used to assess the impact of COVID-19 on ridership. Comparing ridership for the months of March through September in 2019 with the same months of 2020 indicates that the overall ridership dropped by 57 percent (45,694 passenger-trips). By route, this drop was as follows:
2 Note that YARTS ridership tracking includes two types of ridership (Amtrak and Aramark/NPS) that are not summarized by the specific route. These categories represent a relatively small proportion of current ridership (6 percent in total).

YARTS Strategic Plan Working Paper
- 23 -
• 140 Route – 60 percent drop • 120 Route – 58 percent drop • 395/120 Route – 30 percent drop • 41 Route – 32 percent drop • Amtrak ridership (all routes) – 96 percent drop • NPS/Aramark ridership (all routes) – 79 percent drop
The drop in ridership generated through Amtrak ticketing was particularly dramatic – over the seven months included in the data, only 206 passengers boarded using Amtrak-generated tickets.
Ridership by Season
To allow further analysis of route ridership trends, YARTS ridership data was grouped into three operating “seasons”: Summer (June, July, August), Shoulder (May, September) and Winter (remainder of the year). Table 10 presents this data while also summarizing change year over year. As indicated, ridership along all routes have been greatest during the summer months over the past five years, in large part because this is when the most service has been offered. However, reviewing the ridership by season by route shows several trends:
YARTS Strategic Plan Working Paper
- 24 -
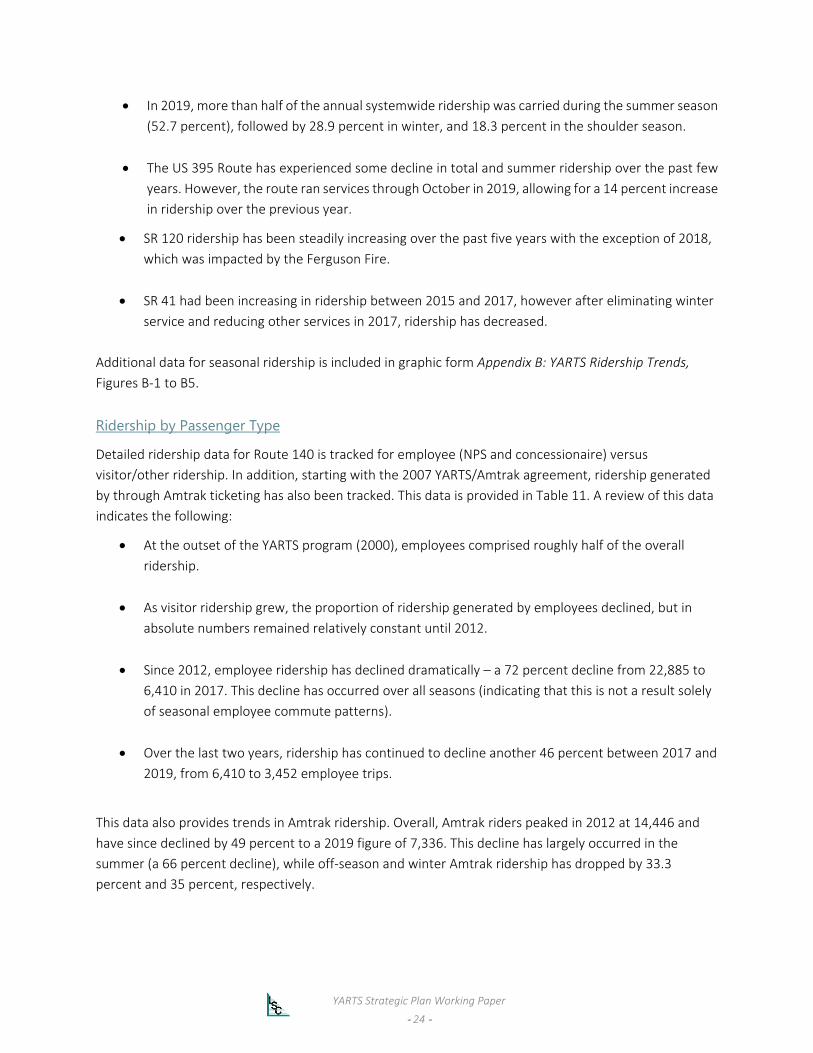
• In 2019, more than half of the annual systemwide ridership was carried during the summer season (52.7 percent), followed by 28.9 percent in winter, and 18.3 percent in the shoulder season.
• The US 395 Route has experienced some decline in total and summer ridership over the past few years. However, the route ran services through October in 2019, allowing for a 14 percent increase in ridership over the previous year.
• SR 120 ridership has been steadily increasing over the past five years with the exception of 2018, which was impacted by the Ferguson Fire.
• SR 41 had been increasing in ridership between 2015 and 2017, however after eliminating winter
service and reducing other services in 2017, ridership has decreased. Additional data for seasonal ridership is included in graphic form Appendix B: YARTS Ridership Trends, Figures B-1 to B5.
Ridership by Passenger Type
Detailed ridership data for Route 140 is tracked for employee (NPS and concessionaire) versus visitor/other ridership. In addition, starting with the 2007 YARTS/Amtrak agreement, ridership generated by through Amtrak ticketing has also been tracked. This data is provided in Table 11. A review of this data indicates the following:
• At the outset of the YARTS program (2000), employees comprised roughly half of the overall ridership.
• As visitor ridership grew, the proportion of ridership generated by employees declined, but in absolute numbers remained relatively constant until 2012.
• Since 2012, employee ridership has declined dramatically – a 72 percent decline from 22,885 to 6,410 in 2017. This decline has occurred over all seasons (indicating that this is not a result solely of seasonal employee commute patterns).
• Over the last two years, ridership has continued to decline another 46 percent between 2017 and 2019, from 6,410 to 3,452 employee trips.
This data also provides trends in Amtrak ridership. Overall, Amtrak riders peaked in 2012 at 14,446 and have since declined by 49 percent to a 2019 figure of 7,336. This decline has largely occurred in the summer (a 66 percent decline), while off-season and winter Amtrak ridership has dropped by 33.3 percent and 35 percent, respectively.

YARTS Strategic Plan Working Paper
- 25 -
Table 10: YARTS Ridership History by Route and Season
Routes 2015 2016 2017 2018 2019 2020 1 2016 2017 2018 2 2019 2020 1 2015-19
Merced SR 140 RouteSummer 19,286 23,861 27,022 12,189 23,490 12,817 24% 13% -55% 93% -45% 22%Shoulder 10,276 13,155 14,982 11,195 11,014 2,198 28% 14% -25% -2% -80% 7%Winter 27,880 30,168 31,367 28,595 25,801 8,719 8% 4% -9% -10% -66% -7%Total 57,442 67,184 73,371 51,979 60,305 23,734 17% 9% -29% 16% -61% 5%
Mono US 395/ SR 120 E 2016 2017 2018 2019Summer 4,380 6,046 5,901 4,914 4,378 3,532 38% -2% -17% -11% -19% 0%Shoulder 341 694 602 591 1,244 377 104% -13% -2% 110% -70% 265%Winter 0 0 0 0 657 0 - - - - - -Total 4,721 6,740 6,503 5,505 6,279 3,909 43% -4% -15% 14% -38% 33%
2015 2016 2017 2018 2019Sonora SR 120 W. Route
Summer 4,487 8,185 13,442 8,190 13,521 6,430 82% 64% -39% 65% -52% 201%Shoulder 985 1,577 2,745 2,464 2,614 355 60% 74% -10% 6% -86% --Total 5,472 9,762 16,187 10,654 16,135 6,785 78% 66% -34% 51% -58% --
2015 2016 2017 2018 2019Fresno SR 41 Route
Summer 5,512 9,809 12,711 6,207 6,781 5,494 78% 30% -51% 9% -19% 23%Shoulder 1,727 4,571 2,199 2,044 1,855 401 165% -52% -7% -9% -78% 7%Winter 4,920 7,116 0 0 0 0 45% -100% -- -- -- -100%Total 12,159 21,496 14,910 8,251 8,636 5,895 77% -31% -45% 5% -32% -29%
YARTS Route Ridership TotalSummer 33,665 47,901 59,076 31,500 48,170 28,273 42% 23% -47% 53% -41% 43%Shoulder 13,329 19,997 20,528 16,294 16,727 3,331 50% 3% -21% 3% -80% 25%Winter 32,800 37,284 31,367 28,595 26,458 8,719 14% -16% -9% -7% -67% -19%Total 79,794 105,182 110,971 76,389 91,355 40,323 32% 6% -31% 20% -56% 14%
Amtrak RidershipSummer 3,341 2,952 2,791 2,365 2,306 7 -12% -5% -15% -2% -100% -31%Shoulder 2,253 2,151 2,184 2,086 1,582 0 -5% 2% -4% -24% -- -30%Winter 6,246 5,425 4,699 4,319 3,448 1,075 -13% -13% -- -- -- -45%Total 11,840 10,528 9,674 8,770 7,336 1,082 -11% -8% -9% -16% -- -38%
Aramark/NPS RidershipSummer 3,034 2,855 1,724 1,482 1,230 200 -6% -40% -14% -17% -84% -59%Shoulder 1,897 1,574 910 954 560 62 -17% -42% 5% -41% -- -70%Winter 6,644 4,841 3,776 3,166 1,662 850 -27% -22% -- -- -- -75%Total 11,575 9,270 6,410 5,602 3,452 1,112 -20% -31% -13% -38% -- -70%
All Route RidershipSummer 40,040 53,708 63,591 35,347 51,706 28,480 34% 18% -44% 46% -45% 29%Shoulder 17,479 23,722 23,622 19,334 18,869 3,393 36% 0% -18% -2% -82% 8%Winter 45,690 47,550 39,842 36,080 31,568 10,644 4% -16% -9% -13% -66% -31%Total 103,209 124,980 127,055 90,761 102,143 42,517 21% 2% -29% 13% -- -1%
Data is summarized by calendar year. Summer is June, July and August; shoulder is May and September; winter is the remainder of months. Note 1: Through September.
Source: YARTS Ridership Report, 2020Note 2: External factors affecting ridership include the Ferguson fire (summer 2018), Creek fire (summer 2020) and Covid-19 (beginning March 2020)
Calendar Year
Five Year Change
Change From Previous Year

YARTS Strategic Plan Working Paper
- 26 -
Tabl
e 11
: Rou
te 14
0 Ri
ders
hip
Hist
ory
by T
ype
Sum
mer
Shou
lder
Win
ter
Tota
lSu
mm
erSh
ould
erW
inte
rTo
tal
Sum
mer
Shou
lder
Win
ter
Tota
lSu
mm
erSh
ould
erW
inte
rTo
tal
2000
11,8
564,
334
4,64
520
,835
----
----
10,5
623,
756
7,20
421
,522
22,4
188,
090
11,8
4942
,357
2001
10,7
415,
365
12,2
3928
,345
----
----
9,93
94,
938
14,3
4729
,224
20,6
8010
,303
26,5
8657
,569
2002
13,4
847,
178
15,2
3035
,892
----
----
5,56
23,
512
11,7
2620
,800
19,0
4610
,690
26,9
5656
,692
2003
12,7
556,
567
15,4
7434
,796
----
----
5,25
73,
589
11,1
2019
,966
18,0
1210
,156
26,5
9454
,762
2004
13,3
867,
634
14,8
3635
,856
----
----
6,30
93,
636
12,0
7922
,024
19,6
9511
,270
26,9
1557
,880
2005
14,9
277,
849
15,5
9038
,366
----
----
7,60
63,
984
12,7
9024
,380
22,5
3311
,833
28,3
8062
,746
2006
9,03
55,
836
16,0
6430
,935
----
----
1,95
61,
980
12,7
4316
,679
10,9
917,
816
28,8
0747
,614
2007
13,3
906,
929
15,6
1535
,934
2,60
182
12,
307
5,72
95,
330
3,27
611
,283
19,8
8921
,321
11,0
2629
,205
61,5
5220
0817
,008
8,53
217
,889
43,4
293,
735
2,60
66,
961
13,3
027,
654
3,96
212
,024
23,6
4028
,397
15,1
0036
,874
80,3
7120
0914
,876
8,12
017
,081
40,0
773,
152
2,34
35,
567
11,0
627,
045
3,82
912
,857
23,7
3125
,073
14,2
9235
,505
74,8
7020
1016
,795
9,09
420
,740
46,6
293,
376
2,54
16,
391
12,3
087,
566
4,19
712
,904
24,6
6727
,737
15,8
3240
,035
83,6
0420
1119
,958
9,93
219
,728
49,6
183,
685
2,28
45,
090
11,0
596,
495
4,04
912
,740
23,2
8430
,138
16,2
6537
,558
83,9
6120
1220
,562
10,2
0223
,546
54,3
106,
788
2,37
25,
306
14,4
666,
051
3,87
612
,958
22,8
8533
,401
16,4
5041
,810
91,6
6120
1319
,176
11,2
5523
,376
53,8
073,
586
1,88
04,
703
10,1
696,
101
3,55
49,
937
19,5
9228
,863
16,6
8938
,016
83,5
6820
1420
,512
10,6
6124
,857
56,0
303,
851
2,27
25,
686
11,8
093,
646
2,42
97,
807
13,8
8228
,009
15,3
6238
,350
81,7
2120
1519
,286
10,2
7627
,880
57,4
423,
341
2,25
36,
246
11,8
403,
348
1,89
76,
644
11,8
8925
,975
14,4
2640
,770
81,1
7120
1623
,861
13,1
5530
,168
67,1
842,
952
2,15
15,
425
10,5
282,
855
1,57
44,
841
9,27
029
,668
16,8
8040
,434
86,9
8220
1727
,022
14,9
8231
,367
73,3
712,
791
2,18
44,
699
9,67
41,
724
910
3,77
66,
410
31,5
3718
,076
39,8
4289
,455
2018
12,1
8911
,195
28,5
9551
,979
2,36
52,
086
4,31
98,
770
1,48
295
43,
166
5,60
216
,036
14,2
3536
,080
66,3
5120
1923
,490
11,0
1425
,801
60,3
052,
306
1,58
23,
448
7,33
61,
230
560
1,66
23,
452
27,0
2613
,156
30,9
1171
,093
2020
12,8
172,
198
8,71
923
,734
70
1,07
51,
082
200
6285
01,
112
13,0
242,
260
10,6
4425
,928
Perc
ent o
f Tot
al20
0763
%63
%53
%58
%12
%7%
8%9%
25%
30%
39%
32%
2008
60%
57%
49%
54%
13%
17%
19%
17%
27%
26%
33%
29%
2009
59%
57%
48%
54%
13%
16%
16%
15%
28%
27%
36%
32%
2010
61%
57%
52%
56%
12%
16%
16%
15%
27%
27%
32%
30%
2011
66%
61%
53%
59%
12%
14%
14%
13%
22%
25%
34%
28%
2012
62%
62%
56%
59%
20%
14%
13%
16%
18%
24%
31%
25%
2013
66%
67%
61%
64%
12%
11%
12%
12%
21%
21%
26%
23%
2014
73%
69%
65%
69%
14%
15%
15%
14%
13%
16%
20%
17%
2015
74%
71%
68%
71%
13%
16%
15%
15%
13%
13%
16%
15%
2016
80%
78%
75%
77%
10%
13%
13%
12%
10%
9%12
%11
%20
1786
%83
%79
%82
%9%
12%
12%
11%
5%5%
9%7%
2018
76%
79%
79%
78%
15%
15%
12%
13%
9%7%
9%8%
2019
87%
84%
83%
85%
9%12
%11
%10
%5%
4%5%
5%20
2098
%97
%82
%92
%0%
0%10
%4%
2%3%
8%4%
Perc
ent C
hang
e ov
er L
ast 1
0 an
d 5
Year
s20
10-1
940
%21
%24
%29
%-1
00%
-100
%-5
3%-8
1%-9
6%-9
8%-9
2%-9
4%-3
9%-8
0%-6
4%-5
8%20
15-1
922
%7%
-7%
5%-1
00%
-100
%-8
0%-9
3%-9
7%-9
8%-9
3%-9
5%-6
1%-8
6%-7
5%-7
2%So
urce
: 201
9-20
20 V
IA M
onth
ly R
epor
ts th
roug
h Se
ptem
ber 2
020
Not
e 1:
Sum
mer
incl
udes
June
, Jul
y an
d Au
gust
. Sho
ulde
r inc
lude
s May
and
Se
ptem
ber.
Win
ter i
nclu
des J
anua
ry to
Ap
ril a
nd O
ctob
er to
Dec
embe
r.
Visi
tor/
Oth
er -
Non
-Am
trak
Visi
tor
- Am
trak
Empl
oyee
sTo
tal R
oute
140

YARTS Strategic Plan Working Paper
- 27 -
Ridership by Route by Month
2019 and 2020 ridership data were further analyzed by month, as shown in Table 12, and depicted in Figures 7 and 8. In 2019, the peak month was July with 18,194, barely edging out August with 17,767. The lowest ridership was 2,774 in January.
During 2020, ridership initially started off with greater ridership in January than the previous year. Ridership immediately dropped in March due to COVID-19 and has stayed low through June. However, ridership did rise to 13,100 trips in July (a 28 percent decrease from the previous year).
Ridership by Route by Month and Day
Average ridership for 2019 was also analyzed by month, weekday, and weekend/holiday by service (Table 13 and Figure 9). This data indicates that weekend ridership is typically higher than weekday ridership on all routes, with ridership relatively close to equal on the 395 Route and relatively more concentrated on weekends/holidays on the 140 and 120 Routes. Weekend/holiday ridership is highest in July (reflecting the Fourth of July).
Table 12: Passenger Boardings by Route by Month 2019 & 2020
Year/Month SR 140 US 395/SR 120 E. SR 120 W. SR 41 TOTAL2019
January 2,774 0 0 0 2,774February 3,596 0 0 0 3,596
March 3,802 0 0 0 3,802April 3,848 0 0 0 3,848May 5,823 0 969 983 7,775June 6,909 0 3,276 2,024 12,209July 9,009 2,082 4,593 2,510 18,194
August 7,572 2,296 5,652 2,247 17,767September 5,191 1,244 1,645 872 8,952
October 2,989 657 0 0 3,646November 3,359 0 0 0 3,359December 5,433 0 0 0 5,433
Total 60,305 6,279 16,135 8,636 91,3552020
January 3,924 0 0 0 3,924February 2,838 0 0 0 2,838
March 1,743 0 0 0 1,743April 214 0 0 0 214May 246 0 0 0 246June 1,893 230 497 522 3,142July 5,563 1,704 3,321 2,512 13,100
August 5,361 1,598 2,612 2,460 12,031September 1,952 377 355 401 3,085
Total to Date 23,734 3,909 6,785 5,895 40,323Note: Amtrak/Aramark ridership not included.Source: 2019-2020 VIA Monthly Reports through September 2020
Route
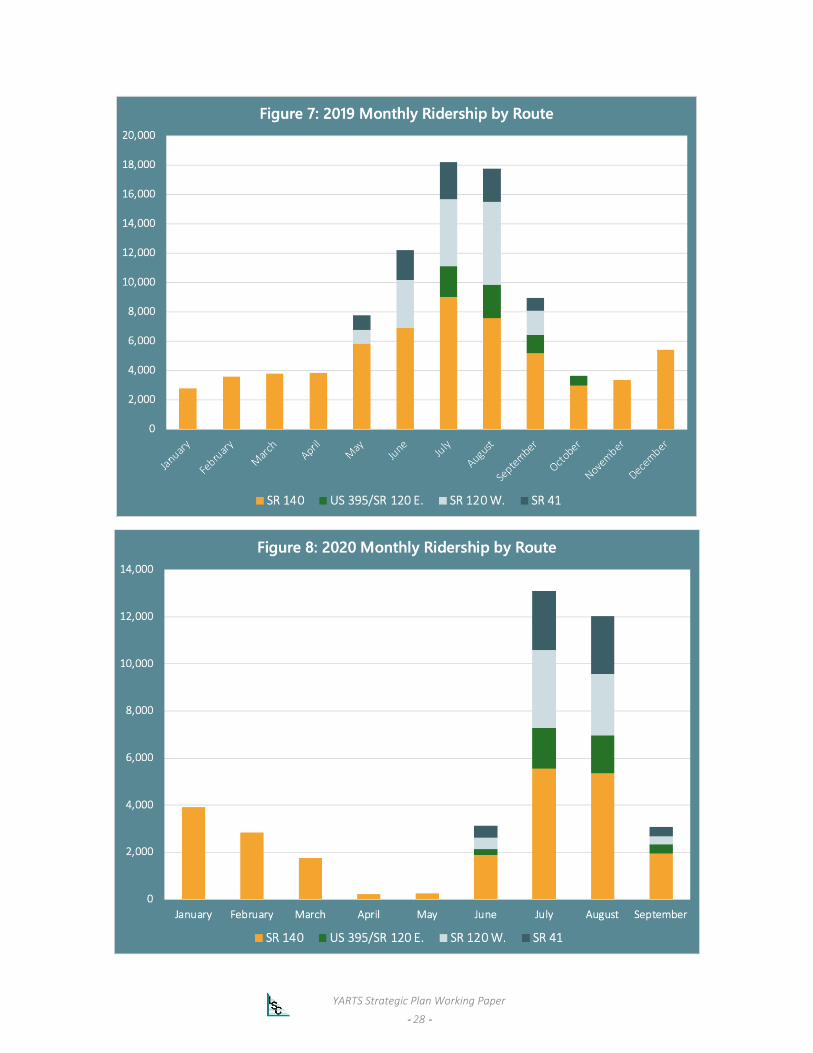
YARTS Strategic Plan Working Paper
- 28 -

YARTS Strategic Plan Working Paper
- 29 -
Boarding by Fare Type
The detailed records of passenger boardings by fare type provide a good indication of the type of passenger and trip purpose on the various routes. This data is included in Appendix B, Tables B-1 to B-4, and indicates the following:
• Adult full-fare passengers generate the largest (81.2 percent) proportion of boardings on the 140 Route. This route has the highest proportion of Amtrak passengers at 10.2 percent. NPS Employees make up approximately 5.2 percent of boardings, followed by 3.4 percent free children fares.
• Full adult fares were used for 91.4 percent of the boardings on the 120 West route, along with 8.4 percent free Child boardings. Amtrak passengers made up only 0.1 percent of boardings.
• The US 395 / SR 120 E. Route boardings were also concentrated among the Adult Paid category (96.6 percent), Free Child (2.5 percent) and Amtrak (0.9 percent).
• SR 41 Route boardings have 90.4 percent adult paid fare with 5.1 percent free child boardings. Employees only make up 0.2 percent of ridership along this route. This route has the second highest proportion of Amtrak passengers at 4.3 percent.
Boardings by Stop
A summary of average daily boardings by stop on each of the various routes indicates the following:
Table 13: Route Ridership by Average Weekday and Weekend by Month
Month, 2019 Weekday Weekend/
Holidays Weekday
Weekend/ Holidays
Weekday Weekend/
Holidays Weekday
Weekend/ Holidays
January 97 141 - - - - - -February 207 317 - - - - - -March 148 142 - - - - - -April 158 173 - - - - - -May 170 191 - - 30 27 28 35June 246 241 - - 111 105 67 68July 276 332 64 75 135 186 75 97August 239 256 74 75 108 130 71 76September 191 230 42 40 48 71 24 41October 116 101 18 32 - - - -November 117 169 - - - - - -December 198 216 - - - - - -
Source: 2019-2020 VIA Monthly Reports through September 2020
US 395 / SR 120 E. Route SR 120 W. Route SR 41 RouteSR 140 Route
YARTS Strategic Plan Working Paper
- 30 -
• Not surprisingly, the busiest YARTS stop (on all four routes) is the Yosemite Valley Visitor Center, where 36 percent of total boarding occur over a July day.
• On the 140 Route in the summer, other busy stops are Merced Amtrak Station (11 percent), Yosemite Valley Lodge and Curry Village (8 percent of boardings each) and the Merced Transpo (7 percent). The Mariposa park-and-ride and Cedar Lodge are also busy stops. In winter, the busiest stops outside the Park are the Mariposa park-and-ride (10 percent) followed by the Amtrak station (9 percent).
• The 120 Route ridership is heavily concentrated in the lodging/campground areas between Groveland and the park. Of all boardings outside the park, 40 percent are at the Yosemite Pines RV Park and 28 percent are at Yosemite Lakes. In total, 93 percent of boardings outside the park are between Groveland and the park entrance, with only 7 percent in Jamestown, Sonora or at the Black Oak Hotel.
• 15 percent of the 395 Route ridership is in the Tuolumne Meadows area. Outside the park, ridership is largely generated by the stops at Shilo Inn (10 percent), the Village (7 percent) and the Mammoth Mountain Inn (5 percent).
• Outside the park, boardings on Route 41 are highest at the Oakhurst Best Western (14 percent of total boardings), the Fresno Airport (10 percent) and the Fresno Amtrak/Greyhound stop (7 percent). Within the park, 41 percent of total Route 41 boardings are at the Yosemite Valley Visitor Center, and 5 percent each at Wawona Store and Mariposa Grove.
Data with boarding by stop is summarized in Appendix B, Table B-5.
Boardings by Run
Ridership was also summarized by run for each route, and for peak months in each season (July, September, and January) and can be summarized as follows:
• On Route 140, the highest July ridership are the eastbound departures at 6:00 AM, 6:45 AM, 8:45 AM, 10:30 AM and 6:00 PM, and the westbound departures at 9:05 AM, 3:15 PM and 6:00 PM. The lowest ridership is on the 5:54 AM departure from Midpines to Merced, with only 5.1 passengers per weekday. In September, eastbound ridership is highest on the 5:45 PM run while westbound ridership is highest on the 3:15 PM run. Morning ridership into the park is significantly less in September than in July, though the morning run from Midpines to Yosemite remains the lowest ridership run. In January, ridership is highest eastbound on the 6:40 AM departure, the 8:45 AM departure and the 5:25 PM departure, and highest westbound on the 2:20 PM and 8:20 AM departures. The morning Midpines – Merced run carries an average of only 3.4 passengers per day.

YARTS Strategic Plan Working Paper
- 31 -
Figu
re 9
: 201
9 Av
erag
e W
eekd
ay a
nd W
eeke
nd/H
olid
ay R
ider
ship
Sour
ce: 2
019-
2020
VIA
Mon
thly
Rep
orts
thro
ugh
Sept
embe
r 202
0
050100
150
200
250
300
350
SR 1
40 R
oute
Aver
age
Wee
kday
Aver
age
Wee
kend
/Hol
iday
s
01020304050607080
July
Augu
stSe
ptem
ber
Oct
ober
US
395
/ SR
120
E. R
oute
Aver
age
Wee
kday
Aver
age
Wee
kend
/Hol
iday
s
020406080100
120
140
160
180
200
May
June
July
Augu
stSe
ptem
ber
SR 1
20 W
Rou
te
Aver
age
Wee
kday
Aver
age
Wee
kend
/Hol
iday
s
020406080100
120
May
June
July
Augu
stSe
ptem
ber
SR 4
1 Ro
ute
Aver
age
Wee
kday
Aver
age
Wee
kend
/Hol
iday
s

YARTS Strategic Plan Working Paper
- 32 -
• 0n the 120 Route, ridership in July is relatively high on all runs (a minimum of 13.9 passengers per trip, on average) with the highest ridership on the first AM departures (6:40 AM) and first afternoon return trip (4:00 PM). Ridership in September is even higher, particularly on weekends/holidays, with up to 51 passengers per trip on the first AM run.
• The 395 Route ridership is also highest on the first run of the day in each direction in July, with up
to 32 passengers per trip on the 4:05 PM eastbound departure on weekends/holidays. • Route 41 July ridership is greatest in the northbound direction on the early morning runs (up to
18.3 boardings on the 7:50 AM run on weekends/holidays), and lower on the mid-day run (7.5 on weekdays and 11.3 on weekends/holidays). This is also the overall pattern in September. In the southbound direction, ridership is highest on the first of the two afternoon runs (4:06 PM departure) and lowest on the 11:15 AM run.
Overall, this review reflects the high productivity of the 120 Route runs, as well as specific runs on the 140 Route and 395 Route. The resulting data is detailed in Appendix C.
YARTS PERFORMANCE ANALYSIS
Performance Analysis by Route and by Month
A “performance analysis” provides useful insights regarding the elements of a transit program that are relatively effective or ineffective. A higher-level performance analysis was conducted for each YARTS route and month of service over the calendar year of 2019, as presented in Table 14. The following summarizes the data used for this analysis:
• Service quantities for each route and month were calculated between January and December of 2019 to cover FY 2018-19 and FY 2019-20. The vehicle-hours costs were based on both YARTS and VIA contract rates as follows:
o $104.76 and $107.38 per vehicle-hour for service operated with YARTS-owned buses for Route 120 Sonora and Route 140 Merced operated during winter and shoulder season months.
o $149.76 and $153.50 per vehicle-hour for service operated with VIA-provided buses for Route 140 Merced during summer months.
o $156.76 and $160.50 per vehicle-hour for service operated with VIA-provided buses for Route 41 Fresno.
• Ridership by route and month were drawn from Table 9 multiplied by average fare revenue per
passenger-boarding for the various routes, to estimate the farebox revenue per route and month.
• Subtracting the fare revenues from the operating costs yields the marginal operating subsidy per route and month.
• Dividing the passenger boarding figures by the vehicle-hours yields the passenger boardings per
vehicle-hour, also known as the “productivity” of a transit service. As indicated, this figure

YARTS Strategic Plan Working Paper
- 33 -
reaches a high of 9.5 (Route 120 in August) and a low of 2.3 (Route 41 in May). Overall, Route 120 West is the most productive of the routes, with an overall figure of 7.3, followed by Route 395 at 4.8, Route 140 at 4.6, and Route 41 at 2.8. Overall, systemwide productivity for 2019 was 4.6 passenger boardings per vehicle hour with a peak occurring in the months of July, August and December (5.5, 5.6, 5.9 passenger boardings per vehicle-hour, respectively).
• The operating subsidy per passenger boarding is a key measure of the cost effectiveness of a transit service, as it relates the key public “input” – public subsidy funding – with the key “output” – passenger boardings. A lower figure reflects a more cost-effective service. As shown, the lowest subsidy per passenger-trips by overall routes is for Route 120, requiring $8.75 per passenger-trip. This figure ranges up to $51.32 (along Route 41). Subsidy per passenger-trip by month was highest in January ($30.64) and lowest in December ($12.41).
• Another important measure is the “farebox ratio” – the ratio of passenger revenues to marginal
contractor operating costs. A “better” measure is reflected by a higher figure, by this measure. The best service by this measure is Route 120 in August, which covers 50 percent of the contractor costs with fare revenues. Again, Route 120 is “best” annually by this measure (40 percent) followed by the 395 Route (26 percent), the 140 Route (21 percent) and the 41 Route (10 percent).
Ridership and Performance Analysis by Run
A detailed analysis was conducted of the average daily ridership and performance analysis for the individual runs on all YARTS routes (pre-COVID). To reflect peak summer, shoulder season and winter conditions, this analysis was conducted for July 2019, September 2019 and January 2020, respectively. The analysis included the following elements:
• Monthly ridership per run was identified from the monthly Contractor Monthly Reports and divided by the runs per month to result in the average daily ridership by run. Note that the ridership and runs conducted on the free-fare day in January were excluded.
• Service revenue miles and revenue hours per day were also drawn from the Monthly Reports.
• Marginal operating cost per run was estimated based on the various contract rates described above.
• Various contract rates were applied to each route depending on time of year and whether a YARTS-
owned or VIA bus was used. Systemwide farebox revenue and ridership was also used to calculate an average passenger fare of $5.13. This value was then subtracted from the marginal operating cost per run to yield the marginal operating subsidy per run. A series of performance measures were then calculated for each run:

YARTS Strategic Plan Working Paper
- 34 -
Table 14: YARTS 2019 Performance Analysis by Route and Month
Month 140 120 41 395 TOTAL 140 120 41 395 TOTAL
Revenue Miles Revenue Hours
January 27,756 27,756 963 963February 22,243 22,243 773 773March 27,897 27,897 969 969April 27,987 27,987 970 970May 37,099 4,872 12,138 54,109 1,249 189 423.3 1,860June 40,950 15,120 21,420 77,490 1,361 585 755.8 2,702July 42,325 15,624 20,560 13,420 91,929 1,407 605 770.4 445 3,227August 42,325 15,456 20,774 13,530 92,085 1,406 598 778.3 449 3,231September 40,167 5,712 9,856 5,940 61,675 1,338 221 369.6 197 2,126October 24,814 6,820 31,634 831 226.3 1,057November 26,058 26,058 875 875December 27,491 27,491 918 918Total 387,112 56,784 84,748 39,710 568,354 13,060 2,197 3,097 1,318 19,671
Contractor Operating Cost Passenger Fare Revenue
January $100,900 $100,900 $15,900 $15,900February $81,000 $81,000 $20,600 $20,600March $101,500 $101,500 $21,800 $21,800April $101,600 $101,600 $22,100 $22,100May $130,800 $19,700 $66,400 $216,900 $33,400 $5,600 $5,600 $44,600June $203,800 $61,300 $118,500 $383,600 $39,700 $18,800 $11,600 $70,100July $215,900 $64,900 $123,600 $47,800 $452,200 $51,700 $26,400 $14,400 $12,000 $104,500August $215,900 $64,200 $124,900 $48,200 $453,200 $43,500 $32,400 $12,900 $13,200 $102,000September $205,400 $23,700 $59,300 $21,200 $309,600 $29,800 $9,400 $5,000 $7,100 $51,300October $89,200 $24,300 $113,500 $17,200 $3,800 $21,000November $93,900 $93,900 $19,300 $19,300December $98,600 $98,600 $31,200 $31,200Total $1,638,500 $233,800 $492,700 $141,500 $2,506,500 $346,200 $92,600 $49,500 $36,100 $524,400
Marginal Operating Subsidy Passenger Boardings per Vehicle Hour
January $85,000 $85,000 2.9 2.9
February $60,400 $60,400 4.7 4.7March $79,700 $79,700 3.9 3.9April $79,500 $79,500 4.0 4.0May $97,400 $14,100 $60,800 $172,300 4.7 5.1 2.3 4.2June $164,100 $42,500 $106,900 $313,500 5.1 5.6 2.7 4.5July $164,200 $38,500 $109,200 $35,800 $347,700 6.4 7.6 3.3 4.7 5.6August $172,400 $31,800 $112,000 $35,000 $351,200 5.4 9.5 2.9 5.1 5.5September $175,600 $14,300 $54,300 $14,100 $258,300 3.9 7.4 2.4 6.3 4.2October $72,000 $20,500 $92,500 3.6 2.9 3.4November $74,600 $74,600 3.8 3.8December $67,400 $67,400 5.9 5.9Total $1,292,300 $141,200 $443,200 $105,400 $1,982,100 4.6 7.3 2.8 4.8 4.6
Operating Subsidy Per Passenger Trip Marginal Farebox Ratio
February $16.80 $16.80 25% 25%
March $20.96 $20.96 21% 21%April $20.66 $20.66 22% 22%May $16.73 $14.55 $61.85 $22.16 26% 28% 8% 21%June $23.75 $12.97 $52.82 $25.68 19% 31% 10% 18%July $18.23 $8.38 $43.51 $17.20 $19.11 24% 41% 12% 25% 23%August $22.77 $5.63 $49.84 $15.24 $19.77 20% 50% 10% 27% 23%September $33.83 $8.69 $62.27 $11.33 $28.85 15% 40% 8% 33% 17%October $24.09 $31.20 $25.37 19% 16% 19%November $22.21 $22.21 21% 21%December $12.41 $12.41 32% 32%Total $21.43 $8.75 $51.32 $16.79 $21.70 21% 40% 10% 26% 21%
Source: LSC
Route Route

YARTS Strategic Plan Working Paper
- 35 -
o Boardings per revenue mile o Boardings per revenue hour (“productivity”) o Cost per Passenger Boarding o Subsidy per Passenger Boarding o Farebox Ratio (ratio of passenger fares to marginal operating cost)
The resulting summaries are included in Appendix C. The date was analyzed in Table C-3 through C-6 (for the average July day), Tables C-7 through C-10 (for the average September day) and Table C-11 (for Route 140 on the average January day). This information will be used to assess route and scheduling alternatives. A review of this data indicates the following:
• As measured by passenger boardings per mile, the best runs are the 120 Route weekend runs in September, with up to 0.61 passengers per mile. The 140 Route morning short run from Mariposa to the Valley is also a good performer, at 0.55.
• Passenger boardings per hour are also highest on the September weekend 120 Route runs, with up to 15.9 boardings per hour. The 3:15 PM westbound departure on the 140 Route in July is also relatively high, at 11.9 on weekdays and 10.2 on weekends/holidays. On the other end of the spectrum, some of the 41 Route runs carry as few as 1.3 passengers for every hour of operation.
• The best performing runs by cost per passenger-trip are the weekend/holiday Route 120 service,
with runs requiring as low as $6.74 in subsidy in September and $8.47 in July.
• The subsidy per passenger-trip (costs minus fare revenues) are lowest on the 120 Route September weekend runs, ranging from $1.60 to $2.10 per passenger-trip. On the other extreme, some of the 41 Route runs require more than $100 in subsidy per passenger served.
• The weekend September 120 Route runs are also the best performing runs as measured by
farebox ratio (fare revenue divided by operating costs), with runs covering between 71 and 76 percent of costs. This value falls below 10 percent on some of the 41 Route runs.
YARTS Connections
YARTS service provides important connections to various modes of travel and transit, enhancing its value in providing non-vehiclular access to Yosemite. Greyhound bus and Amtrak rail connections are available in Merced and Fresno. Eastern Sierra Transit Authority (ESTA) bus connections to YARTS are available in Mammoth Lakes connecting to Reno, Nevada and southern California. Additionally, the Merced Regional Airport (airport code MCE) operates one commercial airline, and the Fresno Yosemite International Airport (FAT) is served by five domestic and two international airlines. Mammoth Lakes Airport has direct flights from Denver, San Francisco, Las Vegas, Los Angeles, and San Diego available, with service varying by season. YARTS does not directly serve the airport in Mammoth, but serves within 8 miles.
A key connection for YARTS service is to and from Amtrak San Joaquin rail service in Fresno and particularly in Merced. Over the last few years (since the SRTP was completed), there has been a cut in

YARTS Strategic Plan Working Paper
- 36 -
daily rail service, from eight trains per day in each direction down to four trains per day. Current rail service times are as follows:
Merced
Northbound: 7:23 AM, 11:23 AM, 3:23 PM, 7,23 PM
Southbound: 10:45 AM, 12:45 PM, 4:45 PM 8:45 PM
Fresno
Northbound: 6:12 AM, 10:16 AM, 2:16 PM, 6:16 PM
Southbound: 11:49 AM, 1:49 PM, 5:49 PM, 9:49 PM
The previous direct rail runs to/from Sacramento have been revised to require bus service north of Stockton.
This rail service, combined with YARTS service, provides the following useful connections:
• A one-day trip between the Bay Area and Yosemite Valley is still possible, combining Train 710 (departing Oakland at 7:36 AM, arriving at Merced at 10:45 AM) with YARTS Bus 140-13 (departing Merced at 10:55 AM, arriving in the Valley at 1:41 PM), along with YARTS Bus 140-16 (departing the Valley at 4:35 PM, arriving in Merced at 7:05 PM) with Train 719 (departing Merced at 7:23 PM, arriving in Oakland at 10:29 PM).
• Another useful rail/bus connection is between Train 716 (depart Oakland at 1:36 PM, arrive in Merced at 4:45 PM) with YARTS Bus 150-15 (depart Merced at 6:00 PM, arrive in the Village at 8:36 PM).
• Leaving the Valley, YARTS Bus 140-12 departs the Valley at 8:15 AM and arrives at Merced at
10:46 AM, tranferring to Train 713 departing Merced at 11:23 AM and arriving in Oakland at 2:27 PM.
Reflecting the longer travel times, connections to/from Southern California are not as convenient. Traveling from Los Angeles Union Station, Train 711 arrives in Fresno at 6:12 AM and provides a short connection time with YARTS Bus 41-1 6:38 AM departure to the Valley (arriving at 10:02) but requires the passenger to board a bus at Union Station at 1:00 AM. The other feasible connection has a slightly more feasible Los Angeles departure time (5:00 AM, arriving via Train 713 at 10:16 AM) but then requires almost a three-hour layover before the 1:10 PM departure of YARTS Bus 41-6 (arriving at the Valley at 4:45 PM). In the other direction, YARTS Bus 41-2 (Valley departure at 11:15 AM, Fresno arrival at 2:45 PM) requires a two-hour layover before the 5:49 departure of Train 716, arriving (via bus) in Los Angeles at 10:35 PM. The other southbound option is the YARTS Bus 41-6 (departure at 6:00 PM, arriving in Fresno at 9:30 PM) and Train 718 (departing at 9:49 PM, arriving in Los Angeles via bus at 2:15 AM).
YARTS Strategic Plan Working Paper
- 37 -
Chapter 4: YARTS Capital Overview
INTRODUCTION
The YARTS program relies on a combination of YARTS-owned vehicles and vehicles provided by the contractor (currently VIA). As previously discussed, the cost of operating contractor-owned vehicles is higher than the cost of operating YARTS-owned vehicles. Until recently, this cost was calculated by contracted vehicle-hour for the provision of services, but more recently, the cost is built into the fixed monthly cost. Either way, operating the non-YARTS vehicles incurs a higher cost. To further complicate the matter, YARTS is facing the following challenges:
• The YARTS-owned fleet is aging, with all the buses reach the end of their useful life benchmark3
within the next five years.
• California Air Resources Board (CARB) regulations requires YARTS to move toward a zero-emission fleet, likely battery electric buses or hydrogen electric buses.
• Zero emission technologies require supporting infrastructure, such as electric charging stations orhydrogen fueling stations.
• The new technologies are expensive.
• The vehicle range of electric or fuel cell buses can be limiting, particularly in hot, frigid, or hillyenvironments.
• Installing supporting infrastructure, particularly in a National Park, may have environmentaland/or physical challenges.
• Grant funding for buses and infrastructure is limited.
This chapter further discusses these challenges, focusing on the fleet requirements for replacement. The pros and cons of the various technologies will be explored.
YARTS FLEET
The YARTS fleet consists of ten high quality over-the-road coaches, as shown in Table 15. Nine additional vehicles are provided by VIA. The vehicles are fueled with clean diesel and carry 49 passengers, with 2 wheelchair tie-down positions. The vehicles were purchased between 2010 and 2015 and have a useful life benchmark of 12 years or 500,000 miles, whichever comes first. Due to the high mileage of YARTS routes, the vehicles are expected to expire based on mileage rather than age, with five expiring in the coming year, two more in 2022, and one each in the years 2023, 2024, and 2025.
3 The Useful Life Benchmark (ULB) is 12 years, or 500,000 miles, whichever comes first.

YARTS Strategic Plan Working Paper
- 38 -
YARTS versus VIA Vehicle Use
As discussed above, costs incurred by YARTS services depends on whether a YARTS-owned bus is used or a bus provided by the service contractor. The need for the contractor to provide buses also has the potential to limit the pool of possible contractors. As a result, the proportion of service operated by YARTS versus VIA buses is an important factor. Table 16 presents a summary of vehicle-hours operated monthly in 2019 by bus type. Reflecting the fact that the current winter service plan requires less buses than the size of the YARTS fleet, in winter virtually 100 percent of service is operated using YARTS-owned buses. At the other extreme, in August almost half (49 percent) of total YARTS service was operated using VIA buses. By route, this data reflects that the 41-Fresno route is operated using contractor buses, while on the 120-Sonora and 395-Mammoth routes contractor buses are only used when necessary due to YARTS-owned buses being out of service. For the key 140-Merced Route, YARTS buses provide 84 percent of the service over the course of the whole year, but only 49 percent in the busiest month of August.
Table 15: YARTS Vehicle Fleet - Replacement Needs
FuelBus ID Make / Model Year Mileage2 Type In Service By Date3 By Mileage 4
501 D4500 Commuter Coach 2010 491,695 Diesel 4/23/2010 4/20/2022 1/11/2021
502 MCI Intercity Coach 2012 448,239 Diesel 10/24/2011 10/21/2023 1/31/2022
503 MCI Intercity Coach 2012 430,992 Diesel 10/24/2011 10/21/2023 7/3/2022
504 MCI Intercity Coach 2012 455,443 Diesel 10/24/2011 10/21/2023 11/28/2021
505 MCI D400 Intercity 2012 456,582 Diesel 5/23/2012 5/20/2024 11/18/2021
506 MCI D400 Intercity 2012 458,739 Diesel 5/23/2012 5/20/2024 10/30/2021
507 MCI D400 Intercity 2012 454,599 Diesel 5/23/2012 5/20/2024 12/6/2021
508 MCI D400 Intercity 2012 408,421 Diesel 5/23/2012 5/20/2024 1/19/2023
509 MCI D4500 Bus 2015 313,554 Diesel 1/26/2015 1/23/2027 5/8/2025
510 MCI D4500 Bus 2015 348,025 Diesel 1/21/2015 1/18/2027 7/7/2024
Note 2: Mileage as of October 30, 2020.
Note 3: The Useful Life Benchmark (ULB) is 12 years, or 500,000 miles, whichever comes first.
Source: YARTS
Description1 Useful Life Benchmark 3
Note 1: Each bus has 49 seats and 2 wheelchair tie-down positions; no bicycle racks; under-bus storage (luggage and large items), plus over-seat storage for carryons; restroom.
Note 4: At an average of approximately 41,200 miles in use annually per vehicle (based on 2019), the lifespan is expected to reach expire by mileage rather than date.

YARTS Strategic Plan Working Paper
- 39 -
MOVING TOWARD ZERO EMISSIONS
California Air Resource Board Regulations
In December 2018, the California Air Resources Board (CARB) introduced the Innovative Clean Transit (ICT) Regulation to replace the Fleet Rule for Transit Agencies. The ICT requires all public transit agencies to gradually transition to a 100-percent zero-emission bus fleet and encourages them to provide innovative first and last-mile connectivity and improved mobility for transit riders. This regulation also provides various exemptions and compliance options to provide safeguards and flexibility for transit agencies through this transition.
Beginning in 2029, 100% of new purchases by transit agencies must be Zero Emission Buses (ZEBs), with a goal for full transition by 2040. There are only two allowable ZEB technologies: Battery Electric Buses (BEBs) and hydrogen fuel cell buses. This role applies to all transit agencies that own, operate, or lease buses with a gross vehicle weight rating (GVWR) greater than 14,000 pounds (such as YARTS. It includes standard, articulated, over-the-road, double‑decker, and cutaway buses.
Flexibility Options
Transit agencies may be able to take advantage of flexibility options to comply with the ZEB purchase requirements, including:
• Bonus credits for early ZEB purchases: to recognize transit agencies that took more risks by early purchases of innovative technologies; credit is based on each early acquisition of a zero-emission bus per the schedule in the regulation.
Table 16: YARTS versus VIA Bus Use - Calendar Year 2019
MonthYARTS
Bus Hours
VIA Bus Hours
YARTS Bus
Hours
VIA Bus Hours
YARTS Bus
Hours
VIA Bus Hours
YARTS Bus
Hours
VIA Bus Hours
YARTS Bus
Hours
VIA Bus Hours
Total Hours
YARTS Bus
Hours
VIA Bus Hours
January 964 0 0 0 0 0 0 0 964 0 964 100% 0%
February 773 0 0 0 0 0 0 0 773 0 773 100% 0%
March 969 0 0 0 0 0 0 0 969 0 969 100% 0%
April 970 0 0 0 0 0 0 0 970 0 970 100% 0%
May 1,173 76 189 0 0 0 0 423 1,361 499 1,860 73% 27%
June 1,088 273 585 0 0 0 0 756 1,673 1,029 2,702 62% 38%
July 789 518 556 49 445 0 0 770 1,790 1,337 3,127 57% 43%
August 693 714 543 55 409 40 0 778 1,644 1,587 3,231 51% 49%
September 817 520 221 0 197 0 0 370 1,235 890 2,124 58% 42%
October 807 24 0 0 226 0 0 0 1,033 24 1,057 98% 2%
November 875 0 0 0 0 0 0 0 875 0 875 100% 0%
December 913 6 0 0 0 0 0 0 913 6 919 99% 1%
Total 10,830 2,130 2,093 104 1,277 40 0 3,097 14,200 5,372 19,571 73% 27%
% - Annual 84% 16% 95% 5% 97% 3% 0% 100% 73% 27%
% - August 49% 51% 91% 9% 91% 9% 0% 100% 51% 49%Source: YARTS
140-Merced 120-Sonora 395-Mammoth 41-Fresno Combined Services

YARTS Strategic Plan Working Paper
- 40 -
• Zero-emission mobility options: to encourage innovation in providing first- and last-mile connectivity and improved mobility for transit riders; and
• Formation of a joint ZEB group: to allow transit agencies to work together to collectively comply with the ZEB purchase requirements.
Provisions for Exemptions of a ZEB Purchase
To ensure transit service is not adversely impacted, the regulation has exemptions for circumstances that are beyond a transit agency’s control. Providing that all required information is correct and complete, exemptions will be granted upon request under the following circumstances:
• When the needed ZEB type is not available; • When daily mileage needs cannot be met; • When gradeability needs cannot be met; • When incremental capital or electricity costs for depot-charging battery electric buses cannot be
offset after applying for all available incentive and funding programs; • When there is a delay in infrastructure construction; or • When a transit agency declares a financial emergency.
Potential exemptions for YARTS need to be explored, but it is possible that YARTS circumstances may meet multiple conditions listed.
Zero Emissions Technology
As both BEBs and hydrogen fueled vehicles are increasingly added to public transit fleets, the opportunities and challenges associated with them are becoming clearer, though much has still to be learned and tested for both technologies. The two types of vehicles are discussed below, along with the required infrastructure to support each, and various pros and cons of each.
Battery Electric Buses There are three primary manufacturers of battery electric buses available in California: Proterra, Motor Coach Industries (MCI), and Build Your Dreams Co Ltd (BYD):
• Proterra battery-electric buses and battery packs are manufactured at a plant in Burlington, California. Proterra sells several types of all-electric transit vehicles, some of which are used within the region. Proterra buses are a part of the transit fleet in Fresno, Stockton, Modesto, as well as in Yosemite Valley as part of the fleet providing the Yosemite Shuttle. Proterra's Catalyst series includes transit buses ranging from 35 feet to 40 feet in length and various battery configurations. Buses are charged through an overhead charging station that is placed at maintenance facilities as well as at route terminals. Proterra has partnered with the Belgium firm Van Hool to develop an

YARTS Strategic Plan Working Paper
- 41 -
over-the-road battery-electric coach, which might be appropriate for YARTS services. This bus is soon to be on the market but is still in development, and the range is yet to be announced.
• MCI has two new all-electric models: the MCI J4500e CHARGE, and the MCI D45 CRTe LE CHARGE, due to be available in 2020 and 2021, respectively.
• BYD is a subsidiary of the Chinese company and operates out of Lancaster, California. BYD sells ten types of battery-electric buses, including 23-foot, 35-foot, 40-foot and 45-foot motor coaches. BYD vehicles have Alternating Current (AC) technology, whereas Proterra has Direct Current (DC) technology—something to consider when installing charging stations.
Cost of Battery Electric
The initial outlay of a BEB is much higher than a diesel bus (approximately $920,000 compared to $650,000, with prices fluctuating based on supply and demand and technological advances). Furthermore, infrastructure for charging the vehicles can be a significant cost. Developing the infrastructure not only requires that the chargers be purchased and installed, but also that the grid for charging has the capacity to provide the energy. Quick charging can be done en route but requires more stations, while slow charging is typically done overnight. Maintenance costs, however, are significantly lower for electric vehicles than for diesel-fueled vehicles, reflecting the fewer moving parts.
Capability of Battery Electric
Beyond the issue of vehicle cost, a key factor regarding battery electric buses is the potential range between charges. Buses with a range of 120-150 miles have been available for several years, which limits the viability of the buses for YARTS routes. Some manufacturers have recently announced new technology that can operate up to 350 miles between charges. However, mileage claims by manufacturers often do not reflect the requirements to also power onboard heating and cooling systems (particularly heating systems), or to operate on steep grades – an important consideration for YARTS services. YARTS routes range from 84 to 111 miles one way, and in summer, each bus operates an estimated average of between 175 to 228 miles4. To be able to depend on BEBs, YARTS would have to carefully plan which routes (if any) could be served by the limited range, thereby complicating scheduling. Additionally, one of the factors which increases operating costs is the break-down of aging buses, and if a BEB cannot reliably operate on a route, this too would increase the operating cost for YARTS.
Charging Infrastructure of Battery Electric
A ZEB fleet requires charging equipment. These can take the form of slow-charge stations at the vehicle storage facility (for charging overnight) or fast-charge facilities at an outlying location, which typically requires 10 minutes to provide sufficient charge for an hour’s operation. Identifying the appropriate charging strategy and location requires addressing several issues:
4 This is based on the average miles per day per route in July 2019, divided by the peak number of buses in service. Actual mileage by bus varied from this estimate.

YARTS Strategic Plan Working Paper
- 42 -
• Is there adequate space for charging equipment to be installed at a publicly owned facility in outlying locations such as somewhere in Yosemite Valley, Tuolumne, and/or Mammoth Lakes?
• Would fast-charging during the operating day be possible without delaying transit routes?
• Providing adequate charging capacity may require extensive upgrades in the electrical system both on-site as well as in nearby power substations and supply lines, such as an upgrade from a 240-volt service to a 480-volt service. What is the electrical supply available at potential locations, and what are the cost implications of any necessary system upgrades?
• For major power users (such as a transit system with full BEB fleets), electrical rates typically vary
by load and by time of day. What are the long-term operating cost impacts of various charging scenarios?
These issues will need to continue to be explored before a vehicle acquisition strategy can be recommended. However, it should be noted that Yosemite National Park currently has two BEB chargers. Working with the Yosemite Conservancy and “Adopt-a-Charger” (a non-profit group), Yosemite National Park now has two Proterra 60 KW chargers and a 480-volt charging station. The chargers use DC charging (rather than AC). Aramark is currently using one installed at the ice rink site in Yosemite Valley to charge two Proterra buses in use for the Yosemite Shuttle. The other charger is in storage, with plans to install it near Yosemite Lodge once a small building has been installed (to reduce visual impact).
Hydrogen Fuel Cell Buses
Another option for zero emission buses is hydrogen fuel cell buses. Fuel cell vehicles still have batteries, but they are much smaller and lighter than those in battery electric vehicles. Because fuel cell vehicles store energy in the form of hydrogen, their batteries can be anywhere from 6 to 50 times smaller than a battery electric vehicle. The reduced battery weight can be particularly advantageous for vehicles that need a lot of power but also need to maximize their payload.
Fuel cell vehicles also have a fuel tank. Combined with the lighter battery, this energy system allows them to operate at longer ranges than battery electric vehicles because they store more energy at a higher density. Studies that focus on efficiency and well-to-wheel analyses find that fuel cell vehicles could be competitive at ranges over 250 miles. But, critically, fuel cell vehicles require significantly more fueling infrastructure than battery electric vehicles. While battery electric vehicles can potentially plug directly into the existing electricity grid, fuel cell vehicles use hydrogen fuel that requires production, transportation, and storage. Fuel cell vehicles cost in the range of $1.2 million apiece.
Hydrogen Fuel Stations
Infrastructure is the costliest difference between fuel cell and battery electric vehicles because of the sheer number of stakeholders involved in the hydrogen fuel supply chain. There are efforts to grow the fuel cell vehicle market in California, but it depends on large government investments. Fueling infrastructure and hydrogen production costs comprise between 30-60% of total fuel cell vehicle deployment costs in 2020. Stations generally cost between $1-2 million, depending on geography. Station
YARTS Strategic Plan Working Paper
- 43 -
capacity generally ranges from 200 to 600 kg/day, enough to fill between 6 and 20 buses. In comparison, electric charging stations in Philadelphia cost roughly $1 million all-in for a fleet of 25 battery electric buses.5
The closest hydrogen fuel station to Merced is 90 miles away at Harris Ranch in Coalinga. For hydrogen fuel cell to be practical, one or more stations would need to be built within the YARTS service area, preferably in Merced. Given the cost, building a station would likely need to be a multi-user endeavor.
YARTS Active Vehicle Acquisition Grant
In May 2019, YARTS submitted an FTA 5339 grant application to retrofit six buses as battery-electric, estimating the total cost to be $5.1 million. The $765,000 required for local match included $720,000 from the CalSTART HVIP (Hybrid Zero-Emission Truck and Bus Voucher Incentive Program), and $45,000 from the YARTS reserve fund. However, the $850,000 per-bus price was found to be inadequate, and MCAG has been negotiating with Caltrans to alter the grant to best support the YARTS program.
YARTS FACILITIES
YARTS does not own any administrative, maintenance, operations or fueling facilities, instead relying on the contractor or others to provide these. Currently (and since the inception of YARTS), the contractor (VIA) owns the maintenance and operations facility which houses drivers, mechanics, and administrative staff for day-to-day operations. Additionally, eight to ten of the YARTS buses are stored here. This site is located at 300 Grogan Avenue in Merced.
YARTS Vehicle Storage
As mentioned, YARTS-owned vehicles are stored at the VIA yard in Merced. However, when the Route 120 West and Route 120/395 East are operating, three vehicles are stored at the Black Oak Casino in Tuolumne and another two are parked overnight along the side of a road (the east side of Minaret Road just north of Forest Trail, at a shoulder chain-up area) in Mammoth Lakes. VIA-owned buses are stored in Merced and Fresno on VIA property.
Transit Joint Powers Authority for Merced County – Transit Facility
The Transit Joint Powers Authority (TJPA) of Merced County owns the maintenance and operations facility recently built at 1950 Wardrobe Avenue in Merced, California. The site is currently being used by First Transit under their contract to operate Merced’s “The Bus”. Should the VIA yard on Grogan no longer be available under a new contract, YARTS could potentially use the TJPA facility as well, though accommodating two contractors on one site is complicated and creates the potential for conflicts, particularly for shared maintenance space.
The Wardrobe Avenue site is approximately 65.4 acres and includes:
• A 99,000 sf (1650’x60’) shop building • A 52,500 sf (1050’x50’) operations building • A 3,000 sf (60’x50’) service building
5 https://usa.streetsblog.org/2020/08/25/op-ed-do-hydrogen-fuel-cell-buses-make-sense-for-cities/

YARTS Strategic Plan Working Paper
- 44 -
• A fenced yard behind the buildings with o 72 parking spaces for large buses, o 25 parking spaces for small buses, and o 16 parking spaces for additional vehicles
• 97 parking spaces in front of the buildings composed of o 5 spots that are ADA accessible, o 3 spots that are for electric vehicles o 8 spots that are for clean air vehicles and, o 81 for additional vehicles
• A bus wash • Two above-ground fuel tanks and fuel dispensers

YARTS Strategic Plan Working Paper
- 45 -
Chapter 5: Funding History and Opportunities
YARTS FUNDING SOURCES
YARTS has historically used a combination of federal, state and local funding for operations and capital revenues for the transit program. This chapter provides a review of the past use of revenues for YARTS, as well as an overview of the status of funding programs, and projections for future availability of such programs (to the extent possible). Recent events, such as wildfires and the Coronavirus pandemic, have emphasized the need for YARTS to be responsive to outside impacts, and to provide services within a sustainable funding framework. To do so, it will be important to address urgent capital equipment needs, while identifying a sustainable level of operating funds.
YARTS Income and Expenses
Due to separate agreements with MCAG and Fresno County, two budgets are included in review: one for SRs 140, 120, 120/395 (Merced Contract budget) and one for SR 41 (Fresno Contract budget). Table 17 depicts the expenses for Merced for the last three years, the current year and projected for the upcoming year. The past and current budgets indicate the following:
• Operating costs range from $2.43 million in 2018-19 (a year when Yosemite National Park wasclosed for over a month during peak summer season due to the Ferguson Fire) to $3.16 millionprojected for the current fiscal year (FY 21).
• Not including planning expenses, the contract costs are consistently between 61 to 70 percent ofthe overall operating expense, and the MCAG administrative costs are consistently 7 to 15percent of the operating expense.
• Overall expenses, not including planning costs, decreased by 25 percent in FY19, increased by 14percent the next year, with an expected increase in the adopted budget for FY 21 showinganother increase of 23 percent. This swing in operating costs indicates a pressing need tomaintain an operating reserve6.
Table 18 shows the revenue for the Merced contract, with over a dozen sources in each year. The main stays of funding include Federal Transit Administration (FTA) 5311(f) funds for intercity service, National Park Service contributions, and Local Transportation Funds (LTF) from the counties of the JPA, as well as fare revenues. These funding sources will be discussed in greater detail in this chapter.
Table 19 shows the expenses and revenues for the Fresno Contract. Because Fresno County is not part of the JPA, these costs are negotiated separately. Expenses are primarily for the contract operations, fuel, and MCAG administration. While fuel costs are not part of the contract, some years they were reported together. New in FY21, MCAG has added a continency and capital expense cost to cover administrative and capital costs and plans to continue this practice.
6 YARTS maintains a monetary reserve which is potentially available for either capital or operating costs.

YARTS Strategic Plan Working Paper
- 46 -
Revenues for Fresno include fares, National Park contributions, and contributions by the Fresno Council of Governments (COG).
Table 20 shows a summary of the operating costs and revenues for the Merced and Fresno contracts, and the combined total for the past five years. Costs varied by as much as 30 percent or $1.18 million.
Table 17: YARTS Expenses by Year - Merced ContractActual Actual Actual Adopted Projected
2017-18 2018-19 2019-20 2020-21 2021-22
Operating Expenses
Professional Service-YARTS NPS Special $8,850 $0 $0 $0 $0
Marketing, CMAQ1 $160,466 $100,223 $95,596 $200,000 $200,000
Professional Service-Contracts $2,044,048 $1,599,903 $1,615,438 $1,931,353 $1,931,353
Professional Service-Fuel $0 $300,829 $272,979 $430,000 $430,000
Prof Service-MCAG Administration $277,865 $170,930 $293,205 $465,506 $479,471
Prof Service-MCAG Other $59,733 $27,052 $0 $0 $0
Professional Services-Betterz $0 $0 $0 $18,000 $18,000
Audit fees $0 $12,319 $4,000 $8,000 $8,000
FEMA/CALOES2 $329,760 $0 $0 $0 $0
Legal Services & Other Services $0 $6,500 $11,050 $8,423 $9,000
Utilities $3,118 $2,764 $2,018 $8,505 $8,760
Communication $0 $5,606 $5,893 $6,000 $6,180
Insurance - General Liability $12,874 $13,999 $12,867 $13,500 $13,905
Membership $614 $644 $674 $0 $700
Training $4,576 $7,215 $12,800 $4,725 $6,000
Office Expense/ Admin/Event, Misc. expenses $4,843 $6,157 $6,711 $7,975 $8,214
Short Range Transit Plans $91,316 $106,145 $0 $0 $0
Rent & Lease - Structure & Equipment $3,550 $3,760 $5,217 $16,558 $17,055
YARTS-Maint . Mariposa Park & Ride $26,076 $15,391 $11,671 $15,000 $15,000
CA FLAP Program (free fares) $35,869 $55,000 $33,000 $16,500 $16,500
COVID-19 $0 $0 $246,479 $0 $0
Working Reserve $0 $0 $0 $775 $0
Total Operating Expenses 3 $3,063,559 $2,434,436 $2,629,596 $3,150,820 $3,168,138
Capital Expenses
Capital Improvement $0 $19,964 $0 $15,800 TBD
Farebox Purchase $0 -- $0 $15,800 TBD
Bus Purchase $0 -- $0 $4,353,000 TBD
Total Capital Expenses $0 $19,964 $0 $4,384,600 TBD
Note 1: Marketing became the CMAQ fund in FY 19. Note 3: Rent & Lease Structure, Transpo, Equipment
Note 2: Repair of Mariposa PNR sinkhole. Note 3: Does not include depreciation
Source: Actual/budgeted expenses and revenues per YARTS. Projections by LSC

YARTS Strategic Plan Working Paper
- 47 -
Table 18: YARTS Revenues - Merced ContractActual Actual Actual Budgeted Projected
2017-18 2018-19 2019-20 2020-21 2021-22
Operating Revenues
5311(f) Operating $212,685 $292,501 $300,000 $300,000 $300,000
5311(f) Planning (SRTP) $32,855 $67,145 -- -- --
CMAQ-Merced $143,657 $104,337 $90,109 $200,000 $200,000
Federal Lands Access Program (FLAP) $55,000 $55,000 $33,000 $16,500 $16,500
FEMA/CALOES $331,091 -- -- -- --
National Park Service $345,000 $345,000 $376,625 $376,625 $376,625
National Park Service - Special Project, Marketing $627,000 $603,000 $824,288 $827,163 $827,163
CARES Act Funding -- -- -- $326,779 --
Local Transportation Funds (LTF) - Merced $300,000 $300,000 $300,000 $300,000 $300,000
Mariposa County $191,482 $191,000 $191,000 $190,000 $190,000
Mono County $35,000 $35,000 $40,000 $40,000 $40,000
State Transit Assistance (STA) $66,834 $40,405 $105,394 $34,278 $34,278
Low Carbon Transit Operations Program (LCTOP) $0 $33,038 $13,673 $28,775 $28,775
Farebox Revenue $533,158 $408,967 $356,693 $266,301 $311,500
Greyhound - Merced $3,474 $6,980 $12,105 $0 $0
Interest & Other Income -General Ops $8,354 $25,660 $36,547 $11,000 $11,000
Amtrak $361,655 $360,562 $274,739 $263,000 $263,000
Other Revenue (YARTS owned buses and Passes) $0 $25,833 $182 $0 $0
County Short Range Transit Plans $77,848 $4,868 -- -- --
Fresno Staffing Service -- -- $25,000 $25,000
Total Operating Revenues $3,325,093 $2,899,296 $2,954,355 $3,205,421 $2,923,841
Capital Revenues
State of Good Repair -- $8,986 -- $17,421 TBD
Capital from Fresno -- -- -- $26,341 TBD
Farebox LCTOP -- -- -- $15,800 TBD
Farebox - for Capital Improvement -- -- -- $14,200 TBD
Bus and Bus Facilities FTA 5539(b) -- -- -- $4,353,000 TBD
Greyhound - Merced -- -- -- TBD
Total Capital Revenues $0 $8,986 $0 $4,426,762
Total Revenues $3,325,093 $2,908,282 $2,954,355 $7,632,183 $2,923,841Source: Actual/budgeted per YARTS. Projections by LSC
FEDERAL
STATE
LOCAL

YARTS Strategic Plan Working Paper
- 48 -
Budget Projections
Tables 18 through 20 show the actual and adopted budgets (as provided by MCAG staff) and include projections for the 2021-22 fiscal year. The projections are based on recent trends, the revised MCAG-VIA contract, and an inflation rate of 3 percent for items such as fuel and labor. Given these assumptions,
Table 19: YARTS Expenses and Revenue by Year - Fresno ContractActual Actual Actual Adopted Projected
2017-18 2018-19 2019-20 2020-21 2021-22
Operating Expenses
Professional Service-Contracts $800,000 $518,726 $475,961 $478,830 $478,830
Prof Service-MCAG Administration $40,000 $2,149 $36,745 $25,000 $25,000
Prof Service-MCAG Administration-Branding, Media $50,000 -- -- $15,000 $15,000
Short Range Transit Plan -- $4,868 -- -- --
Professional Service-Fuel -- $70,368 -- $70,000 $72,100
Contingency 5% + 5% Capital Expense -- -- -- $47,883 $47,883
Total Operating Expenses $890,000 $596,111 $512,706 $636,713 $638,813
Operating Revenues
Total Farebox - Fresno $59,629 $62,809 $59,316 $55,000 $55,000
Amtrak-Fresno $5,000 $2,748 $902 $4,200 $4,200
National Park Service-Fresno $345,000 $345,000 $290,625 $200,000 $200,000
Greyhound - Fresno -- $4,017 $2,638 $4,000 $4,000
Fresno COG $480,371 $177,414 $158,731 $373,513 $373,513
Total Operating Revenues $890,000 $591,989 $512,212 $636,713 $636,713
Source: Actual/budgeted per YARTS. Projections by LSC
Table 20: YARTS Total Operating Expenses and Revenue by YearActual Actual Actual Adopted Projected
2017-18 2018-19 2019-20 2020-21 2021-22Operating Expenses
Merced Operating Expenses $3,063,559 $2,434,436 $2,629,596 $3,150,820 $3,168,138
Fresno Operating Expenses $890,000 $596,111 $512,706 $636,713 $638,813
Total YARTS Operating Expenses $3,953,559 $3,030,547 $3,142,302 $3,787,532 $3,806,951
Operating Revenues
Merced Operating Revenues $3,325,093 $2,434,436 $2,629,596 $3,150,820 $3,168,138
Fresno Operating Revenues $890,000 $591,989 $512,212 $636,713 $636,713
Total Operating Revenues $4,215,093 $3,026,425 $3,141,809 $3,787,532 $3,804,851
Net Income (Loss) $26,560 ($4,122) ($493) $0 ($2,100)
Source: Actual/budgeted per YARTS. Projections by LSC

YARTS Strategic Plan Working Paper
- 49 -
YARTS appears to be financially sound for the time being. However, several major factors could impact future costs and revenues.
Expense Variables
• The service plan, including level of service, location of service and distribution of hours by season• The VIA contract will expire in two years. The price of new contract will depend on several key
factors, including:o Whether the contractor uses YARTS buses or must provide additional vehicleso Whether YARTS or the contractor provides a maintenance and operations siteo The amount of dead head required in the service plan, as well as the need to house vehicles
and staff at off-site locations.• Administrative expenses—MCAG has on occasion absorbed the administrative costs on behalf of
YARTS when YARTS revenues were low. The administrative costs should be better identified, whichmay impact the cost, but also should improve predictability.
Revenue Variables
• Yosemite National Park generates funds for YARTS through a portion of entrance fees(approximately $2.00 per single vehicle). With changes in visitation to the park, this mayeventually affect revenues available to YARTS.
• The National Park provides funding based on an assumed level of service. If this is greatlyreduced, this may also impact the level of funding received for YARTS.
• Farebox revenues have been decreasing.
• Tuolumne County is joining the JPA, which should stabilize their contribution to YARTS operations• CARES Act funding—already received, with a potential for a second round of funds—is a short-
term source of revenue but may help address capital needs.
• LTF monies are tied to sales tax revenue, specifically a quarter-cent sales tax collected statewideand returned to the county of collection (minus a state collection fee). As discussed furtherbelow, reductions in retail sales could result in parallel changes in LTF funding.
Taxable Sales Trends as an Indicator of Local Transportation Fund
As of this writing, forecasts of LTF revenues by the participating counties are not available. However, State Department of Finance data for the quarter including April to June of 2020 is a useful indication of how COVID-19 is impacting taxable sales and thus LTF sales tax income. Retail sales are shown in Table 21 for the second quarter of the last three years for regional counties, and for the State of California as a comparison. The trend shows the area is doing better than California as a whole. Tuolumne County showed an increase in taxable retail sales in 2020. However, both Mono Mariposa and Mono Counties, which contribute LTF to YARTS, had large drops in taxable sales from previous years—down 41.2 percent in Mariposa and 31.0 percent in Mono County. The reduction in retail sales, if long term, may impact Mariposa and Mono Counties’ ability to contribute LTF to YARTS. Merced County, which contributes the

YARTS Strategic Plan Working Paper
- 50 -
highest proportion of LTF, had a 7.7 percent decrease in taxable sales in 2020. In comparison, Fresno County had a relatively small reduction of 3.0 percent.
FEDERAL SOURCES OF REVENUE
Federal funding accounted for 40 to 64 percent of operating revenues over the past four fiscal years, in increasing proportions. Federal sources of funding YARTS relies on are described below.
FTA 5311(f) Grant Funding
The FTA Section 5311 formula funding program provides supplemental funding for public transit service in non-urbanized areas which have populations of fewer than 50,000 residents, as quantified by the United States Census Bureau. The FTA apportions formula funds to each state on an annual basis. The California Department of Transportation, Division of Rail and Mass Transportation (DRMT) is the designated grantee for California. The DRMT Rural Transit and Intercity Bus Branch manages the 5311 and 5311(f) programs. 5311 funding is apportioned as follows:
• 75% Regional Apportionment --This funding share is apportioned to non-urban areas based onthe size of the rural population. This apportionment is distributed to Transportation PlanningAgencies (TPA) whose county or region contains a non-urbanized area. The TPA submits aProgram of Projects that identifies subrecipients and projects to receive Section 5311 funds intheir planning area. This must be completed by December 31st of each year. Additionally,subrecipients must complete and submit a Section 5311 Program Application and all otherrequired submittals by the appropriate deadline. YARTS does not receive this funding.
Table 21: Countywide Retail Sales Trends in YARTS Service Area
County/Area 2018 2019 2020
Fresno County $3,929,687,664 $4,135,071,158 $4,011,156,443 5.2% -3.0%
Madera County $442,946,407 $464,141,843 $475,302,798 4.8% 2.4%
Mariposa County * $58,769,973 $61,341,480 $36,069,855 4.4% -41.2%
Merced County * $807,968,313 $887,904,896 $819,341,360 9.9% -7.7%
Mono County * $65,011,144 $69,760,855 $48,128,753 7.3% -31.0%
Tuolumne County $187,852,799 $197,661,926 $204,009,376 5.2% 3.2%
YARTS JPA Area $931,749,430 $1,019,007,231 $903,539,968 9.4% -11.3%
Statewide Total $176,223,785,852 $184,616,986,601 $152,362,296,481 4.8% -17.5%
* = Included in the YARTS JPA Area
% ChangeSecond Quarter (Apr-Jun) Total Taxable Sales 2018 to
20192019 to
2020
Source: California Department of Tax and Fee Administration,https://www.cdtfa.ca.gov/dataportal/charts.htm?url=TaxSalesByCounty, accessed 11/4/20

YARTS Strategic Plan Working Paper
- 51 -
• 15% Intercity Bus Program --This funding share is apportioned to the Rural Intercity Bus Program(known as FTA 5311(f)).
• 10% State Administrative Expenses --This funding share is apportioned to State TransportationAgencies to fund the administration of the 5311 & 5311(f) grant programs.
YARTS relies on FTA Section 5311(f) Intercity Bus Program grant funding for operations, receiving $222,000 in FY 2018 and 2019, and expecting $300,000 in FY 2020. This is a reliable funding source. Changes to the allocation occur when additional services qualify for the intercity funds.
YARTS also relies on 5311(f) regional apportionments to fund Short Range Transit Plans, which are required every five years.
FTA 5339 Grant Funding
The FTA Section 5339 Bus and Bus Facilities program provides capital funding to replace, rehabilitate and purchase buses, vans, and related equipment, and to construct bus-related facilities. FTA apportions a discretionary component and a small urban (population 50,000 to 200,000) formula component to governors of each State annually. The California Department of Transportation (Caltrans) is the designated recipient FTA 5339 program funds for small urban and rural areas of the State and distributes funds to eligible sub-recipients (public agencies and private nonprofit organizations engaged in public transportation).
YARTS applied for and was awarded a $4.3 million FTA 5339 grant for the purchase of buses in FY19. The original grant included the purchase of six electric buses. An electric bus (Complete Coach Works) was test-driven in January 2019 and determined to function adequately. However, the vehicle was not fully loaded, and not all factors were considered (such as the potential for one of the six-pack batteries to fail). Additionally, the cost of the six buses were significantly underestimated, and perhaps most significantly, the infrastructure for charging the buses is not yet in place. YARTS is in discussions with Caltrans to revise the grant.
Congestion Mitigation and Air Quality Improvement Program – Merced
The Congestion Mitigation and Air Quality Improvement (CMAQ) Program funds transportation as part of the effort to meet the requirements of the Clean Air Act. CMAQ has been reauthorized under every successive Transportation Bill up to and including the FAST Act in 2015. The FAST Act provides funding to areas in nonattainment or maintenance for ozone, carbon monoxide, and/or particulate matter. In addition, those States that have no nonattainment or maintenance areas still receive a minimum apportionment of CMAQ funding for either air quality projects or other elements of flexible federal aid highway spending. The City of Merced is a nonattainment area and allocates a portion of its CMAQ funds to YARTS. The CMAQ funds are used for marketing purposes and is shown as an expense in Table18. The revenues have ranged from $90,000 to $200,000 annually.

YARTS Strategic Plan Working Paper
- 52 -
National Park Service
The U.S. Department of the Interior National Park Service (NPS) provides funding to YARTS as described in the Cooperative Agreement in Chapter 2. A set-aside of $5.00 per $35.00 entrance fee is earmarked for transportation, with approximately $2.00 per single-vehicle entrance designated for the Mariposa Grove Shuttle and $3.00 per single-vehicle entrance set aside for YARTS. Furthermore, the NPS pays an annual lump fee to cover basic operations and administrative costs, and then a negotiated rate based on the amount of service provided. The base contribution was $345,000 in FY18 and FY19, increasing to $376,625 in FY20, and $379,500 in FY21. The additional contribution was $581,000 in FY18, $603,000 in FY19, and $824,288 for FY20 and FY21. While there is a deal of uncertainty related to visitation and entrance fees, there are no indications that funding will be cut soon.
Federal Lands Access Program (FLAP)
The Federal Lands Access Program (Access Program) was established to improve transportation facilities that provide access to, are adjacent to, or are located within Federal lands. The Access Program supplements State and local resources for public roads, transit systems, and other transportation facilities, with an emphasis on high-use recreation sites and economic generators. YARTS is eligible for the funds as it serves Yosemite National Park.
The Access Program is funded by contract authority from the Highway Trust Fund and subject to obligation limitation. Funds are allocated among the States using a statutory formula based on road mileage, number of bridges, land area, and visitation.
Projects are selected by a Programming Decision Committee (PDC) established in each State. The PDCs request project applications through a call for projects. The frequency of the calls is established by the PDCs. The grant requires a 11.47% local match. The allocation for California is approximately $30 million annually, with the bulk going for road construction projects.
YARTS received $50,130 in FY 2018, $50,130 in FY 2019, and is anticipating $16,500 in FY 2020. YARTS uses FLAP revenues to fund free fares and/or kids’ fares. This funding source should be explored for other potential uses, such as facilities. YARTS should consider this source when it becomes available.
Great American Outdoor Act
The Great American Outdoors Act, signed into law on August 4, 2020, provides up to $1.9 Billion annually for each of five years for the National Parks and Public Lands Restoration Fund. This will be generated by energy development fees and be used for infrastructure and maintenance of facilities on Federal recreation lands (National Parks, National Forests, wildlife refuges and recreation areas) as well as for American Indian schools. It also commits approximately $900 Million per year in oil and gas royalties to the Land and Water Conservation Fund. The key focus of funding for National Parks is on addressing deferred maintenance. The US Department of the Interior has already made funding decisions. For Yosemite, the selected projects include campground improvements, rehabilitation of Glacier Park Road, and improvements to an electrical transmission line. Nationwide, no projects involve transit buses or bus facilities. This funding program overall has a low potential to address YARTS capital needs.

YARTS Strategic Plan Working Paper
- 53 -
Coronavirus Aid, Relief, and Economic Security
The Coronavirus Aid, Relief, and Economic Security (CARES) Act was a response to the Coronavirus pandemic and included funding for transit programs. This was a one-time, emergency funding source. YARTS received $326,779 CARES funds, $246,479 of which was spent in FY 2020, with $80,300 remaining. The CARES funds were paid to VIA to offset loss of revenues due to park closures. A subsequent amount of $654,000 has been provided, which will help to continue to offset losses due to closures. A second COVID-19 Relief Bill has been approved by congress which includes $14 billion for mass transit agencies. The funds will be available for operating and capital projects, and some grants may require local match.
STATE SOURCES OF REVENUE
The Transportation Development Act (TDA) was enacted by the California Legislature to improve existing public transportation services and encourage regional transportation coordination. This law provides funding to be allocated to transit and non-transit related purposes that comply with regional transportation plans.
TDA established two funding sources: The Local Transportation Fund (LTF), and the State Transit Assistance (STA) fund. Providing certain conditions are met, counties with a population under 500,000 (according to the 1970 federal census) may also use the LTF for local streets and roads, construction, and maintenance. The STA funding can only be used for transportation planning and mass transportation purposes.
Local Transportation Funds (LTF)
As also discussed above, Local Transportation Fund (LTF) is derived from a ¼ cent of the general sales tax collected statewide. The State Board of Equalization, based on sales tax collected in each county, returns the general sales tax revenues to each county’s LTF. Each county then apportions the LTF funds within the county based on population.
Merced County LTF
Merced County allocates $300,000 annually for operations of the YARTS program. As mentioned, Merced taxable sales are down 7.7 percent in 2020 over the prior year.
Mono County LTF
Mono County contributed $35,000 in LTF in FY18 and FY19, increased to $40,000 for FY20 and FY21. Mono County taxable sales have declined by 31 percent in 2020 over the year prior.
Mariposa County LTF
Mariposa County contributed $191,000 in LTF in FY18, FY19, and FY20, and $190,000 in FY21. Mariposa County relies heavily on tourism, and taxable sales dropped by 41.2 percent in the early half of 2020 compared to 2019.

YARTS Strategic Plan Working Paper
- 54 -
State Transit Assistance
State Transit Assistance (STA) funds are appropriated by the legislature to the State Controller’s Office (SCO). The SCO then allocates the tax revenue, by formula, to planning agencies and other selected agencies. Statue requires that 50% of STA funds be allocated according to population and 50% be allocated according to transit operator revenues from the prior fiscal year. This funding source is less stable than LTF funds and has ranged from a low of $23,000 in FY18 to a high of $105,000 in FY20. Because of the unpredictability, it is best use for more discretionary purposes.
Low Carbon Transit Operations Program (LCTOP)
The LCTOP was created to provide operating and capital assistance for transit agencies to reduce greenhouse gas emission and improve mobility, with a priority on serving disadvantaged communities. Approved projects in LCTOP support new or expanded bus or rail services, expand intermodal transit facilities, and may include equipment acquisition, fueling, maintenance and other costs to operate those services or facilities, with each project reducing greenhouse gas emissions. For agencies whose service area includes disadvantaged communities, at least 50 percent of the total moneys received shall be expended on projects that will benefit disadvantaged communities. As such, YARTS has used the funds to provide free fares. YARTS has received between $13,673 and $33,038 in LCTOP revenues the past several years.
LOCAL SOURCES OF REVENUE
Local funds have provided 19 to 34 percent of the operating revenues over the past four fiscal years, in decreasing proportions each year. Local sources of revenue are described below.
Farebox Revenue
Farebox revenues are an important source of revenue as they represent the users’ direct contribution to the service. The YARTS fare structure was presented in Chapter 3 and Tables 8 through 12. Farebox revenues have provided between 12 to 17 percent of the operating revenue (not including Greyhound and Amtrak revenues, which contribute to the farebox revenue). Farebox revenue is budgeted to bring in $266,301 in the current fiscal year, which is 9 percent of the operating revenues. Due to coronavirus, services have been offered with reduced or free fares for much of the season.
Greyhound Merced/Fresno
Greyhound services interline with YARTS in Merced and Fresno, allowing passengers to book a Greyhound trip from San Francisco, Visalia or Bakersfield all the way through to Yosemite. The passenger is quoted and pays one fare, but a portion of the fare is paid to Greyhound and a portion to YARTS. As shown in Table 18, this generated between $1,000 to $12,105 in the past several fiscal years, but due to service cuts, Greyhound is no longer generating fares in Merced. As shown in Table 19, $4,017 was generated on Fresno Greyhound in FY19, $2,638 in FY20, with $4,000 projected for FY21.

YARTS Strategic Plan Working Paper
- 55 -
Amtrak
Like Greyhound, YARTS passengers can book rail tickets with connections to YARTS to continue on to Yosemite or other YARTS destinations. Additionally, Amtrak has a contract with YARTS to maintain a minimum level of service to meet passenger rail services in both Merced and Fresno to provide this service.
Amtrak revenues for Merced ranged from a high of $363,000 in FY18, to $274,739 in FY20, with the budgeted amount at $263,000 for FY21. In Fresno, Amtrak fares generated between $902 in FY20 (due to COVID) and $5,000 in FY18.
Fresno Staffing Service
The Fresno staffing service revenues shown in Table 18 are reimbursement funds to cover MCAG’s costs when they work on the Highway 41 service issues on behalf of the Fresno COG.
Interest and Other Income
Interest and other miscellaneous income ranged from $5,000 in FY18 to $36,547 in FY20. The miscellaneous income is generated by interest on funds and sales of passes.
SUMMARY – THE FUTURE FUNDING OF YARTS
YARTS operations and funding are complex due to multiple contracts and obligations, and the multi-jurisdictional service area. Over time, YARTS has developed a sound institutional structure and operational plan—though both continue to evolve and respond to continual challenges. This Strategy Study seeks to use the lessons learned through the institutional, operational, and funding histories to create a flexible and sustainable transit program to meet the goals set forth in the JPA bylaws. While YARTS has secured the necessary funds for operations over the years, the crux of addressing funding issues is to ensure that service plans do not result in costs that exceed available revenues. There also is the possible need to reserve a portion of local funds to build a capital local match reserve funds.

YARTS Strategic Plan Working Paper
- 56 -
This page intentionally left blank

YARTS Strategic Plan Working Paper
- 57 -
Chapter 6: YARTS Outlook and Key Strategic Issues
Based on the information provided in this working paper, the next step in the YARTS Strategic Study will be to develop and investigate options to increase the stability of the YARTS program, with regards to service plans, capital improvements and institutional arrangements. Since its inception in 2000, YARTS has operated on a contingent basis. This has given administrators the opportunity to try numerous approaches to operations and has resulted in many iterations of agreements and contracts. The prime lesson from twenty years of operations is that there is demand for service and a will to have it succeed—and a need for a less tentative approach. Key issues that need to be addressed to put YARTS on a more solid footing are discussed below.
YARTS INSTITUTIONAL AND ADMINISTRATIVE ISSUES
Much of YARTS’s success depends on the cooperation and efforts of the JPA as overseen by the MCAG. The JPA allows members to provide guidance on service needs, planning and most importantly, funding. Membership in the JPA strengthens the purpose of YARTS and is foundational to the regional nature of YARTS. Tuolumne County is the latest entity soon to join the JPA, leaving Fresno as the only entity under contract but not a member. Additionally, YARTS Route 41 serves Madera County, which may have an interest in joining the JPA, particularly if Fresno decides to discontinue supporting Route 41. Whether Fresno and/or Madera Counties should become members is another issue to address in this Strategy Study, as well as the appropriate funding level of each participant.
Another issue is the role of MCAG, which provides manangement, marketing and grant administration, and transportation planning on behalf of YARTS. In return, YARTS agrees to pay MCAG based on actual costs incurred for this service. In some years, MCAG has provided services without full compensation specifically related to approved reimbursement rates. Furthermore, operating on an annual contract basis provides some uncertainty for MCAG and YARTS, while a multi-year contract could lead to greater stability and better management, and better opportunities for long-term investments and marketing.
Another institutional issue is the multiple definitions of “fiscal year” used in the YARTS program. The JPA identifies a fiscal year of July 1 to June 30, which is consistent with that of the various member entities. The NPS funding agreement and the YARTS-MCAG management contract, however, are based on the Federal fiscal year of October 1-September 30th. In addition, the existing service contract is for a November 1-October 31 period. These multiple overlapping fiscal periods complicates financial planning and accounting, and optimally will be simplified through this strategic plan process.
YARTS SERVICE-RELATED ISSUES
The review of NPS visitations and YARTS ridership trends in Chapter 3 reveal these trends:
• In the near term, the effect of the COVID-19 pandemic has been a 57 percent drop in overallridership, including a 60 percent drop on the 140 Route, 58 percent drop on the 120 Route, 32percent drop on the 41 Route and 30 percent drop on the 395/120 Route. NPS ridership andAmtrak ridership have dropped even more (79 percent and 96 percent).

YARTS Strategic Plan Working Paper
- 58 -
• Absent COVID impacts, there are long-term shifts in YARTS ridership, including:
o Employee ridership has dropped substantially. From a peak of 24,667 trips in 2009, ridership by 2019 dropped to only 3,452. This represents a reduction from 37 percent of total ridership to just 3 percent of the total.
o While shoulder-season ridership has been increasing, summer ridership (June, July, and August) still accounts for nearly half of annual ridership and is most effective in terms of passengers carried per passenger hour.
o Reductions in San Joaquin rail service have reduced the potential for generating YARTS ridership via rail connections, and the requirements for coordinating YARTS service with rail schedules.
o There has been strong ridership growth on the 120 Route—a near tripling of ridership over the last five years. Much of this growth is between Groveland and Yosemite Valley, indicating shorter, more frequent trips might be appropriate. Lodging growth in the Oakhurst area and the potential for park-and-ride use of lodging parking on the 140 corridor could indicate potential for shorter and more frequent trips on these other corridors, too.
o Existing YARTS services vary greatly in their effectiveness, as measured by factors such as passengers per trip/service hour and subsidy required per passenger. There are individual runs that are very ineffective, and merit review.
• Yosemite National Park faces its own challenges, with reduced visitation due to COVID and wildfires. As a major contributor to YARTS funding, and the primary reason for YARTS existence, the parks’ future will influence the direction of YARTS.
These issues will need to be considered in developing the service plan. Furthermore, the operations plan will be limited by the ability to secure replacement vehicles for the aging fleet, which is complicated by the need to move toward zero emission vehicles. A new service contract begins Nov 1, 2022, possibly with a new contractor for the first time, lending urgency in addressing these issues.
YARTS CAPITAL ISSUES
During peak summer, YARTS service requires 15 vehicles in operation, with a need for spares bringing the total to 19. YARTS owns 10 vehicles, and the remainder are leased with an associated increase in operating cost. The buses YARTS owns are all nearing the end of their useful life benchmark (ULB) and will all need replacing within the next five years. CARB rules dictate that by 2026, 25 percent of buses purchased will need to be zero emission vehicles, and 100 percent of purchases starting 2029. Zero emission bus (ZEB) options require supporting infrastructure (potentially including charging stations, upgraded electrical grid(s), hydrogen fuel station, etcetera), and the vehicles are much more expensive
YARTS Strategic Plan Working Paper
- 59 -
than the clean diesel YARTS currently uses. Most grants require at least a 15 percent local match. At a unit cost of $650,000 (for a diesel-powered over-the-road coach), replacing ten buses would require $6.5 million in funding, with $925,000 local match. ZEB costs are even higher, with a unit cost on the order of $920,000 per bus (or more). This would total $9.2 million for 10 buses and $17.48 million for 19, with a local match of $1.84 million or $3.5 million, respectively.
Compounding this issue, the lack of publicly owned transit operations facilities also negatively impacts YARTS. Contractor costs associated with their facilities increases annual operating costs. In addition, as publicly funded capital improvements for battery electric buses (or hydrogen buses) cannot be made on private land, the lack of public facilities limits the program’s ability to implement zero emission vehicles.
In short, YARTS will either have to come up with large sums of matching funds, or significantly reduce operations. The likelihood is that YARTS will end up somewhere in the middle—increasing capital expenditures, but potentially curtailing services. This Strategy Study will look at options ranging from operating with just YARTS-owned buses (a service plan with a fleet of ten), to more optimistic options with an increase in YARTS-owned vehicles and a YARTS-owned operations facility. Service strategies may be considered which reduce the peak vehicle requirements but offer a longer operating season, or which consider operating shorter trips at higher frequencies. Whatever service plan is recommended, the capital plan will be an integral component.
YARTS FUNDING ISSUES
The funding review presented in Chapter 5 indicates sustainable operations under the status quo—assuming a similar level of expenses and revenues as in the past several years. However, given the fleet replacement issue, the potential for COVID-related economic impacts to reduce local funding and the impending need to initiate a new operations contract as of November 1, 2022, this is not at all the case. First and foremost, YARTS must address any short-term drops in funding, as they potentially emerge over the coming months. Next, the vehicle replacement needs should be addressed. Then YARTS must position itself as an attractive entity for contractors. What would be most attractive to contractors is a situation where they face the least risk: optimally, a turn-key operation wherein the contractor is provided an operations facility for day-to-day operations and maintenance, as well as a reliable fleet of publicly-owned vehicles. Furthermore a contractor will want to know that the entity it contracts with is solvent, and that it is well managed. Many of the issues that challenge YARTS are issues which a contractor will consider in deciding to bid on a contract.
CONCLUSION
While there are many issues facing YARTS at present, the key issues as seen by the Consultant Team in light of the information presented in this document and discussions with decisionmakers and the public are as follows:
• What ongoing annual revenues should we be planning for over the next several years?
• Should a portion of locally-controlled revenues be set aside to build capital improvement funds?

YARTS Strategic Plan Working Paper
- 60 -
• What is the best strategy to replace and expand the YARTS-owned fleet, in order to reduce or eliminate the need for contractor-provided buses?
• What is the best strategy to address coming requirements for Zero Emission Bus purchases? Is it
in the best interest of the program to put off ZEB purchases as long as possible within the CARB requirements for portions of the YARTS services? Are there ways that YARTS ZEB strategies can “piggyback” on those of other local public transit programs?
• How should YARTS shift to public facilities for storage, maintenance and refueling/recharging in the
four operating base areas?
• In light of the changing demands for YARTS service, are there changes in routes, schedules and the calendar of operations that could make better use of funds available for operations?
• Given the available funding and potential need for capital reserve retention, what is the appropriate service plan?
• Should the Route 41 contracted service be provided indefinitely? Alternatively, should
participation by Fresno and/or Madera entities in the JPA be required after a set date, and if so, what should be the terms of their entry into the JPA?
• What is the best strategy for structuring the new service contract RFP to generate competition
between multiple proposers? For instance, should the RFP allow the option of bidding on only portions of the total service plan (such as the 395 Route, for example)?
• Should the MCAG agreement be multi-year rather than year-by-year to improve planning and
marketing.
While YARTS faces serious challenges as outlined in this Working Paper, its 20-year history and steady institutional framework position it to move forward in a productive capacity. This Strategy Study is being developed to address these challenges and provide a cohesive, sustainable operations plan. Perhaps most critically, the operations plan will provide a framework for developing a sound Request for Proposals for a new operations contractor to be issued in the summer of 2021 (with a start date of November 1, 2022) that can attract a wide pool of competitive proposers.
Recommended