Florida International UniversityFIU Digital Commons
FIU Electronic Theses and Dissertations University Graduate School
11-8-2006
Y-chromosome polymorphisms in southern ArabiaAlicia M. CadenasFlorida International University
DOI: 10.25148/etd.FI14052526Follow this and additional works at: https://digitalcommons.fiu.edu/etd
Part of the Forensic Science and Technology Commons
This work is brought to you for free and open access by the University Graduate School at FIU Digital Commons. It has been accepted for inclusion inFIU Electronic Theses and Dissertations by an authorized administrator of FIU Digital Commons. For more information, please contact [email protected].
Recommended CitationCadenas, Alicia M., "Y-chromosome polymorphisms in southern Arabia" (2006). FIU Electronic Theses and Dissertations. 1962.https://digitalcommons.fiu.edu/etd/1962
FLORIDA INTERNATIONAL UNIVERSITY
Miami, Florida
Y-CHROMOSOME POLYMORPHISMS IN SOUTHERN ARABIA
A thesis submitted in partial fulfillment of the
requirements for the degree of
MASTER OF SCIENCE
in
FORENSIC SCIENCE
by
Alicia M. Cadenas
2006

To: Interim Dean Mark SzuchmanCollege of Arts and Sciences
This thesis, written by Alicia M. Cadenas, and entitled Y-Chromosome Polymorphisms inSouthern Arabia, having been approved in respect to style and intellectual content, is referred toyou for judgment.
We have read this thesis and recommend that it be approved.
Fernando G. Noriega
George T. Du can
Rene J. Herrera, Major Professor
Date of Defense: November 8, 2006
The thesis of Alicia M. Cadenas is approved.
Interim 'ean Mark SzuchmanCollege of Arts and Sciences
Dean George WalkerUniversity Graduate School
Florida International University, 2006
ii

ACKNOWLEDGMENTS
I would like to thank my committee members Dr. Fernando G. Noriega, Dr. George T.
Duncan and Dr. Rene J. Herrera for their guidance and contributions to this study. I would also
like to express my appreciation for the assistance provided by Dr. Maria Regueiro and Tenzin
Gayden throughout my graduate career as well as to all my other lab members for their help and
support.
iii

ABSTRACT OF THE THESIS
Y-CHROMOSOME POLYMORPHISMS IN SOUTHERN ARABIA
by
Alicia M. Cadenas
Florida International University, 2006
Miami, Florida
Professor Rene J. Herrera, Major Professor
In order to explore south Arabia's role in the migratory episodes leaving Africa to
Eurasia and back, high-resolution Y-chromosome analyses of males from the United Arab
Emirates (164), Qatar (72) and Yemen (62) were performed. The distribution of specific
haplogroups (E3bl-M35 and J1-M267) and their microsatellite-based age estimates in southern
Arabia offer additional insight on their dissemination. With the exception of Yemen, southern
Arabia displays high diversity in its Y-haplogroup substructure and share similarities with
populations along the eastern coast of the Gulf of Oman, possibly serving as a coastal corridor for
migrations. Elevated rates of consanguinity may have had an impact in Yemen and Qatar, which
experience deficiencies in their ratios of observed to expected heterozygosity at 15 hypervariable
autosomal STR loci. Higher diversity along the Gulf of Oman may be due to trade emanating
from the kingdom of Oman involving East Africa, southern Pakistan and western India.
iv

TABLE OF CONTENTS
CHAPTER PAGE
I. IN T R O D U C T IO N ................................................................................... 1
II. MATERIALS AND METHODS ................................................................ 4Sample Collection and DNA Extraction ..................................................... 4Y-Haplogroup Analysis ............................................................................ 4Statistical and Phylogenetic Analyses ......................................................... 4M icrosatellite A nalysis .......................................................................... 5Autosomal STR Markers ........................................................................... 7
III. RESULTS ............................................................................................ 8Phylogeography ................................................................................... 8AMOVA............................................................................................... 9Phylogenetic Analyses ............................................................................... 9Interpopulation Haplogroup Diversity ........................................................... 10Admixture Analysis ................................................................................ 11Y-Microsatellite Diversity ........................................................................ 11Intrapopulation Diversity ........................................................................... 12
IV . D ISC U SSIO N ................................................................................... 14Distribution of E3bl-M35 Derivatives..........................................................14O rigin of J1-M 267 ................................................................................. 17Implications of Y-chromosome distribution in Arabia .................................... 19Regional Autosomal STR Analysis ............................................................. 21Conclusion .......................................................................................... 23
R E FE R E N C E S ............................................................................................... 37
APPENDIX ................................................................................................................................... 43
v

LIST OF TABLES
TABLE PAGE
1. Description of Populations Analyzed ............................................................................ 25
2. Y-Chromosome Haplogroup Frequencies Observed............................................. 26
3. AMOVA Results .......................................................................................... 27
4. G-test Results for 11 populations and Qatar, United Arab Emirates and Yemen ........ .... 28
5. Admixture Proportions (pY standard error) from Pakistan, Turkey and Kenya ................ 29
6. Y-Haplogroup variance, expansion and coalescence times based on Y-STR loci .............. 30
7. Observed and Expected Heterozygosity based on 15 Autosomal STR Loci ................... 31
vi

LIST OF FIGURES
FIGURE PAGE
1. Geographic distribution of major Y-chromosome haplogroup frequencies for the 32
populations described in Table 1......................................................................... 32
2. Geographic distribution of Y-chromosome haplogroup frequencies in selected populations
(A) E clade, (B) J clade and (C) R clade................................................................... 33
3. Maximum likelihood radial phylogeny based on Y-haplogroup frequency data from the 32
populations described in Table 1......................................................................... 34
4. Principal component analysis of Y-haplogroup frequency data from the 32 populationsdescribed in T able 1 ..................................................................................... 35
5. Y-STR based principal component analysis of specific haplogroups based on eightmicrosatellite loci (A) E3b3-M123 and (B) J1-M267 ................................................ 36
vii

I Introduction
Arabia has played the role of a strategic crossroad between Africa and Eurasia,
facilitating modern human's first exodus from the Horn of Africa to present day Yemen through
the Bab el Mandab Strait at the mouth of the Red Sea (Lahr and Foley 1994; Stringer 2000;
Oppenheimer 2003). Subsequent migrations through the northern intercontinental passageway
between Africa and the Levant (the Levantine corridor) have also been documented (Luis et al.
2004; Rowold et al. 2006). In addition, the Arabian Peninsula has also linked the distant
populations of China and India to communities of the Mediterranean and beyond. While the
Persian Gulf to the east and an arm of the Indian Ocean, the Arabian Sea, to the south offered
easy passages to India and Asia, the Red Sea on the western coast of the Arabian Peninsula
provided a natural connection to the Mediterranean Sea.
Just north of the peninsula, the Nile River Valley in Egypt and the Tigris-Euphrates area
in Iraq comprised a region known as the Fertile Crescent. Recognized as the birthplace of
agriculture during the Neolithic (-8000ybp) based on linguistic and archaeological evidence
(Hassan 2002, Militarev 2002), the Fertile Crescent became a key player for ancient international
trade. Although the fertile soils produced a surplus of food, the region lacked the natural
resources necessary for building permanent structures (timber) or making metals (minerals).
Therefore early inhabitants relied on trade to acquire these raw materials and established close
links with the commercial centers along the gulf as reflected in archaeological finds (Flavin and
Shepherd 1994; Beech and Elders 1999; Beech et al. 2005). At the extreme southern end of the
Arabian Peninsula, referred to as Arabia Felix by the Romans ("Happy Arabia" in Latin) and
including present day Yemen, the spice trade was an important source of wealth. Frankincense
and myrrh were commonly exported to the Mediterranean via camels and to India by sea.
In agreement with archaeological and historical records that accentuate the region's
active role as a point of contact between distant populations, the Middle East displays a high
1

degree of genetic diversity (Cavalli-Sforza 1994; Cinnioglu et al. 2004; Nasidze et al. 2004;
Regueiro et al. 2006). Although genetic diversity is elevated, various analyses have identified
structural barriers to gene flow into and out of the Near East. Specifically, mtDNA (Quintana-
Murci et al. 2004), Y-chromosome (Quintana-Murci et al. 2001; Wells et al. 2001; Qamar et al.
2002; Regueiro et al. 2006) and microsatellite studies (Shepard and Herrera 2006) have identifed
the Dash-e Kavir and Dash-e Lut deserts in Iran and the Hindu Kush mountains in eastern
Afghanistan as potential barriers to gene flow to the surrounding regions. In contrast, geographic
facilitators for gene flow have also been described with an arid region along the southern coast of
Iran, Afghanistan and Pakistan known as the Balochistan mediating gene flow from South
Pakistan to South Iran (Regueiro et al. 2006).
Mitochondrial DNA analyses have been performed on collections from Qatar, UAE and
Yemen (Kivisild et al. 2004; Rowold et al. 2006), yet the paternal component of this historically
and geographically significant region is incomplete. Although Y-chromosome studies have
focused on neighboring areas, including Egypt (Luis et al. 2004), Iraq (Al-Zahery et al. 2003),
Syria and Lebanon (Semino et al. 2000) as well as on the southern Arabian population of Oman
(Luis et al. 2004) and Yemen (Thomas et al. 2000), Y-chromosome analyses representative of the
entire region is lacking.
In the present study, high-resolution Y-chromosome analyses were performed on three
southern Arabian populations: 62 males from Yemen, 72 males from Qatar and 164 males from
the United Arab Emirates (UAE). In recent years, the analysis of Y-chromosome polymorphisms
in worldwide populations has greatly contributed to the understanding of the evolutionary history
of modern man. In addition, 17 Y-STR loci were typed in order to obtain microsatellite-based
age estimates for a selection of informative Y-chromosome haplogroups in the populations in
which they were observed. Results from these Y-specific analyses were interpreted in
conjunction with data on 15 autosomal STR loci for Yemen, Oman, UAE, Qatar, Iran and Egypt
2

(Shepard and Herrera, 2005; Cadenas and Herrera 2006; Perez-Miranda et al. 2006; Shepard and
Herrera 2006), collectively reanalyzed with the aim of exposing characteristics unique to the
southern Arabian Peninsula.
3

II Materials and Methods
Sample collection and DNA extraction
Blood samples from 298 unrelated males representing three populations that include the United
Arab Emirates, Qatar, and Yemen were collected in EDTA Vacutainer tubes. The paternal
ancestry of the donors was recorded for a minimum of two generations. Table 1 provides
additional information on the sample size, geography, and linguistic affiliation of the populations
involved. DNA was extracted from the blood using the phenol-chloroform extraction method
(Antunez de Mayolo et al. 2002). Ethical guidelines were adhered to in strict compliance with
NIH guidelines as well as to those stipulated by the institutions involved.
Y-Haplogroup Analysis
Seventy-six binary genetic markers were genotyped (Underhill et al. 2001; Cinnioglu et al. 2004;
Shen et al. 2004; Sengupta et al. 2006; Cruciani et al. 2006) following the Y-chromosome
phylogeny hierarchy using standard methods, including PCR/RFLP, allele-specific PCR
(Martinez et al 2005) and the YAP polymorphic Alu insertion (PAI) (Hammer and Horai 1995).
The amplicons generated from these methods were separated by electrophoresis in 1X TAE, 3%
agarose gels and visualized subsequent to ethidium bromide staining and UV light photography
in a Fotodyne FOTO/Analyst®. The Y-SNP haplogroup nomenclature used follows the
recommendations of the Y Chromosome Consortium (YCC 2002).
Statistical and Phylogenetic Analyses
Twenty-nine geographically targeted populations reported in previous studies (Table 1)
were included in the statistical and phylogenetic analyses performed in order to assess Y-
haplogroup variation and phylogeographic relationships throughout the region. Maximum-
4

likelihood (ML) phylogeny was constructed using the Phylip v3.6 program (Felsenstein 1989). A
principal component (PC) analysis was performed using the NTSYSpc-2.02i package by Rohlf
(2002). Two sets of analyses of molecular variance (AMOVA) (Excoffier et al 1992) were
generated using the Arlequin version 2.000 package with the 31 populations subdivided
according to two criteria, geography (North Africa, East Africa, Arabian Peninsula, Caucasus,
Levant, Anatolia, Iranian Plateau, South Asia, Central Asia and Siberia) and linguistic family
(Afro-Asiatic, Indo-European, Niger-Congo, Altaic and South Caucasian). Pairwise comparisons
of the populations from the present study and all reference populations were generated using G-
tests in Carmody's software (Carmody 1991). Admixture proportions (pY) were estimated by
the Weighted Least Squares method (Long et al. 1991). Three parental populations, Turkey
(Cinnioglu et al 2004), Kenya (Luis et al. 2004) and Pakistan (Sengupta et al. 2006), were
utilized in order to measure the contributions from these three distinct points to each of the
hybrid populations from the present study (UAE, Qatar, and Yemen). The Pakistani population
was further subdivided into north and south, while Turkey was divided into east and west based
on the demarcations specified in figure 1 of Cinnioglu et al. (2004), where regions 3, 4, and 5
comprised east Turkey and the remaining six regions constitute west Turkey.
Microsatellite Analysis
DNA Amplification of 17 Y-specific STR loci (specifically DYS19, DYS385,
DYS389I/II, DYS390, DYS391, DYS392, DYS393, DYS437, DYS438, DYS439, DYS448,
DYS456, DYS458, DYS635 and Y-GATA H4) was performed using the AmpFlSTR Yfiler
Amplification Kit (Applied Biosystems, Foster City, CA) according to manufacturer's
instructions in an Eppendorf* Mastercycler®. DNA fragment separation and detection was
achieved in an ABI Prism 3100 Genetic Analyzer (Applied Biosystems, Foster City, CA). ABI
Genescan500 LIZ was utilized as an internal size standard. Amplicon sizes were determined
5

using the Genescan® 3.7 software and alleles were designated by comparison to an allelic ladder
from the manufacturer using Genotyper* 3.7 NT software.
Haplogroup specific expansion times were estimated for select binary haplogroups (J 1-
M267, R1al-M 198, E3bla-M78, and E3b1c-M123) by two methods for those populations with a
minimum sample size of five individuals. Both methods assume a stepwise mutation model (Ohta
and Kimura 1973) and a mean STR mutation rate of 0.00069 per STR locus per generation
(Zhivotovsky et al. 2004) with a 25 year intergeneration time that is congruent with previous
studies (Cruciani et al. 2002; Cinnioglu et al. 2004; Luis et al. 2004). The linear expansion
method assumes a starlike genealogy attributable to continuous growth where the expected value
of the average coalescence time for microsatellite alleles (T) equals the microsatellite variance
(S) divided by the mutation rate (p) times the number of generations since expansion (Di Rienzo
et al. 1994; Kittles et al. 1998). Microsatellite variances were calculated using the vp equation
of Kayser et al. (2001). The second method was carried out using the BATWING program and is
based on a Bayesian coalescent process using the Markov chain Monte Carlo (MCMC) approach
(Wilson et al. 1998). For the current analysis, a model of exponential growth at rate alpha from a
constant size ancestral population of size N beginning at time beta was employed. Prior
distribution parameters were as follows: effective population size (Nprior) = gamma(1,0.0001);
unscaled population growth rate (alphaprior) = gamma(1.01,1); unscaled mutation rate
(muprior)= gamma(5,7143); and unscaled time of expansion (betaprior) = uniform(0,15). The
posterior mean, median and 2.5% and 97.5% quantiles were calculated in years by multiplying
beta by N posterior and 25 years/generation and was based on the 50,000 MCMC outfiles
generated after 20,000 initial warmup "burn in" rounds.
In addition, microsatellite-based divergence times were calculated for each of the
haplogroups based on the method described by Zhivotovsky et al. (2001; 2004), likewise
6
assuming a mutation rate of 0.00069 per STR locus per generation (Zhivotovsky et al., 2004) and
a 25 year intergeneration time.
For the E3blc-M123 and J1-M267 lineages, the Y-STR data from Yemen, Qatar and
UAE was analyzed with respect to published Y-STR data from Turkey (Cinnioglu et al. 2004)
and Pakistan (Sengupta et al. 2006) as well as Oman and Egypt (Luis et al. 2004). PC analyses
were performed for each lineage using the NTSYSpc-2.02i package by Rohlf (2002) based on the
Y-STR frequencies of the 8 loci shared across all four studies.
Autosoinal STR Markers
In order to further assess the level of homogeneity for the populations under study, the
observed and expected heterozygosity for 15 forensic autosomal STR loci were calculated using
GENEPOP software v3.4 (Raymond and Rousset 1995) based on autosomal STR genotypes for
Iran (Shepard and Herrera 2005), Qatar (Perez-Miranda et al. 2006), UAE (Cadenas and Herrera
2006) and Kenya, Egypt, Oman and Yemen (Shepard and Herrera 2006).
7

III Results
Phylogeography
A total of 41 paternal lineages were identified from the analysis of 164 United Arab
Emirate, 72 Qatari, and 62 Yemeni males. Table 2 frequencies observed for these lineages
according to YCC nomenclature (2002) as well as the frequency distributions for the populations
under study. The geographic distribution of the major haplogroups is illustrated in Figure 1.
Only three haplogroups (E, J, and R) display frequencies above five percent in the three
populations occupying the southern portion of the Arabian Peninsula and combined account for
74 to 98% of the chromosomes within these populations. Among these, J is the most common
haplogroup with frequencies of 45.12%, 66.66% and 82.26% for UAE, Qatar and Yemen,
respectively. Group J is trailed by group E, reaching levels of 17.68% in UAE, 13.89% in Qatar
and 16.13% in Yemen. Although group R is completely absent in Yemen it is found in UAE and
Qatar at 11.59% and 9.72%, respectively. Figure 3 displays the geographic distribution of E, J
and R derivatives in a subset of the populations listed in Table 1.
Two major sister clades comprise haplogroup J, J1-M267 and J2-M172. The J1-M267
clade typifies East Africans and Middle Eastern populations. In southern Arabia, it makes up the
majority of the Yemeni (72.58%) with lower representations in Qatar and UAE (58.33% and
34.76%, respectively). In contrast J2-M172 displays lower levels in UAE (10.37%), Qatar
(8.34%) and Yemen (9.68%).
Within group E, E3bl-M35 and its sublineages constitute the greater part of this
haplogroup for the populations under study. While the E3bl-M35 Yemeni samples are only
divided between the E3b1c-M123 (8.06%) and E3b1*-M35 (3.23%) lineages, UAE and Qatar
display higher levels of E3bla-M78 (7.93% and 4.17%, respectively) followed by E3b1c-M123
8

(3.05% and 1.39% for M123, respectively). The E3a-M2 lineage is represented at lower
frequencies than E3bl-M35 in UAE (5.49%), Qatar (2.78%) and Yemen (3.23%).
Haplogroup R samples from the present study are mostly distributed within R1-M173
with R2-M124 only observed in Qatar (1.39%). Of the M173 derivatives, Rlal-M198 is the
most frequent in both UAE (7.32%) and Qatar (6.94%). Within these two populations the Rlb3-
M269 derivative is also observed (3.66% and 1.39%, respectively).
AMOVA
The results of the AMOVA for the three populations from the present study in addition to
29 reference populations are listed in Table 3. Assignment of the populations according to ten
geographical groups generated a higher fraction of variability among groups of populations
(15.73%) than among populations within groups (4.21%) indicating a greater degree of
interregional structuring. In contrast, upon subdividing the populations according to language
family the percentage of among group variance is lower (8.17%) than among populations within
groups (12.94%) suggesting higher intralinguistic structuring for these populations. Genetic
diversity among groups of populations and populations within groups correlate significantly with
geographic and linguistic partitioning.
Plylogenetic Analyses
The ML analysis performed on the NRY frequencies for the populations in Table 1 is
displayed in Figure 3. Strong geographic structuring is observed with the populations grouping
within five main clusters representing distinct regions (Africa/Levant, Arabian Peninsula,
Caucasus/Anatolia/Iranian Plateau, South Asia, and Central Asia). Within the dendrogram, the
populations of Egypt, Iraq, Yemen, Qatar, Oman and UAE occupy an intermediate position
straddled by the populations of Africa and the Levant on one side and Anatolia, Caucasus,
9

Iranian Plateau, Central Asia, and South Asia on the other. Of note for the observed partitioning
is the clustering of Egypt with populations from the Arabian Peninsula. Furthermore, within this
cluster Yemen and Qatar segregate together but separate from their neighboring populations,
Oman and UAE. As expected, the populations from Central Asia group together and away from
the South Asian ones, however there is a segregation of North Pakistan with populations from
Central Asia, while South Pakistan shares a closer affinity to populations to the west. The PC
analysis (Figure 4) supports the population affinities observed in the ML phylogeny with
dimensions 1 and 2 accounting for 40.06% of the total variation (22.71% and 17.35%,
respectively). As in the ML dendrogram, the populations from the present study display
affiliations with other populations within their biogeographic regions with populations from the
Middle East occupying intermediate positions, a segregation that is more prominent along Axis I.
However, some significant differences are apparent. While Yemen and Qatar continue to display
a closer affiliation to each other, in the PC plot they form a cluster with populations from North
Africa (Tunisia, Algerian Arabs and Berbers and Egypt). UAE, on the other hand, segregates
further away close to the South Iranians with the Omani and populations from the Levant (Syria,
Lebanon and Iraq) intermediary to the three south Arabian populations. As in the ML
dendrogram, a prominent separation of the Pakistani populations is generated.
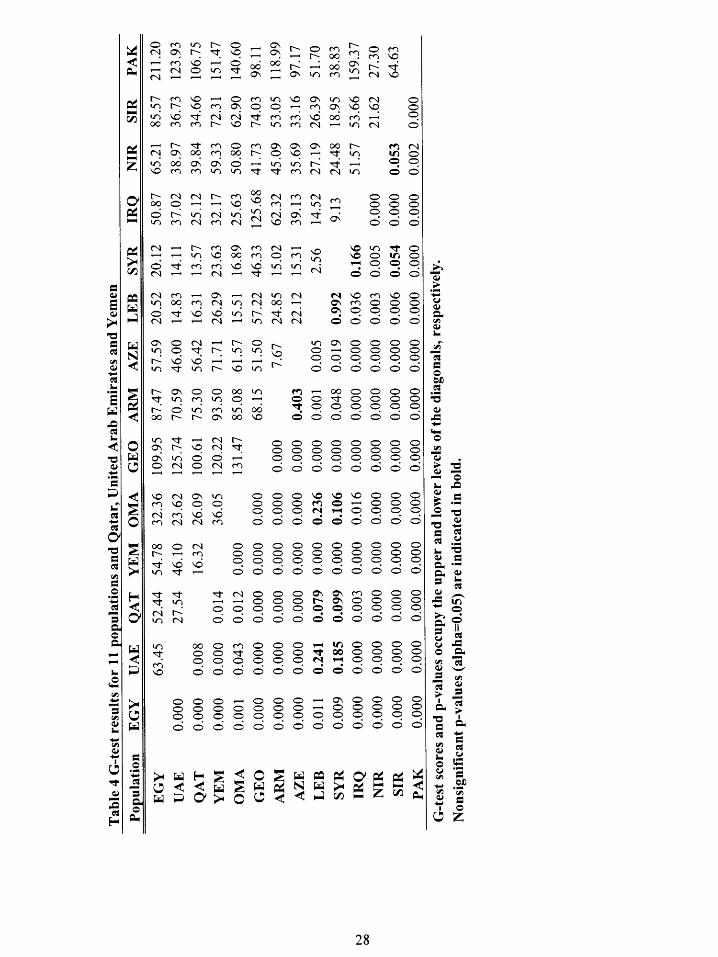
Interpopulation Haplogroup Diversity
In order to assess statistically significant genetic differences, pair-wise G-test
comparisons were performed with the three populations from the present study as well as 14
reference populations from table 1. A total of 91 pairwise assessments were made and the results
are listed in Table 4. The number of nonsignificant genetic differences observed was 11. Of
note, the Lebanese and Syrian populations do not display statistical differences with populations
from UAE, Qatar and Oman but do show statistical differences with Yemen. Furthermore, of the
10

populations from the present study, Yemen is the only one to display statistically significant
differences to all other populations in the analysis. Across all populations, the Lebanese and
Syrians are involved in most of the pairings in which no significant difference is observed
(a=0.05). In addition to the three south Arabian populations of Qatar, UAE and Oman, the
Algerian Berbers, Greece and Tajikistan do not display significant differences to Lebanon and
Syria. However, Turkey and South Iran only display nonsignificant values in pairwise
comparisons with Syria.
Admixture Analysis
Admixture proportions (pY) were calculated for UAE, Qatar, and Yemen as well as for
two populations described in Luis et al. (2004), Oman and Egypt. Results are provided in Table
5. The proportions were generated systematically using three parental populations (Kenya,
Turkey and Pakistan) in various combinations based on the regional subdivision of Pakistan
(north and south) and Turkey (east and west). When considering the parental populations as a
whole, Turkey consistently displays a greater contribution in all hybrid populations tested. For
Oman, Qatar and UAE, the Pakistani and Kenyan admixture proportions differ by less than 0.4
(Oman: 0.136 vs. 0.153; Qatar: 0.074 vs. 0.072; UAE: 0.141 vs. 0.104 for Pakistan and Kenya,
respectively), with the highest values from Kenya obtained for the Omani collection (0.153).
Yemen and Egypt experience a null contribution from Pakistan. Proportions generated upon
introduction of the Pakistani subdivisions generated greater values from the south except for the
Yemeni and Egyptian collections, which continue to display values of zero.
Y-Microsatellite Diversity
Results for the expansion analysis of populations with n>5 for haplogroups J1-M267,
R1al-M198, E3bla-M78 and E3b1c-M123 are provided in Table 6. The variance, linear
11

expansion and median BATWING values for J1-M267 are similar across all three populations.
However, while the median BATWING value is low in Yemen (2.66 ky), Qatar (3.80 ky) and
UAE (1.13 ky), the variance and linear expansion method for this same lineage generates higher
values Yemen, Qatar and UAE (7.11, 4.93 and 5.43 ky, respectively). The E3bl c-M123 and
Rlal-M 198 median BATWING values are comparable for the southern Arabian populations in
question (UAE [12.59ky] and Yemen [7.16ky] for M123; Qatar [9.35ky] and UAE [10.04ky] for
M198).
The microsatellite-based divergence times obtained for these same lineages using the
method described by Zhivotovsky et al. (2004) revealed interesting results (Table 6). While the
M123 age estimates were comparable (11.lky for UAE and 10.6ky for Yemen) to that obtained
by the BATWING analysis, the microsatellite variation observed for all individuals within this
haplogroup were quite different. Furthermore, the ancestors for the M123 chromosomes in both
populations arrived there independently. In contrast, the J 1-M267 haplotypes formed a network
across all three populations and generated much older age estimates compared to the BATWING
analysis for Yemen, Qatar and UAE (9.7ky, 7.4ky and 6.4ky, respectively).
In order to assess genetic similarities between the E3blc-M123 and J1-M267 southern
Arabian lineages to those from other populations, PCAs based on 8 Y-STR loci are presented in
Figure 5. The M123 PCA plot (Panel A) identifies a closer affiliation between the Egyptian and
UAE representatives of this marker, while Yemen and Oman segregate together in the lower right
quadrant and Turkey remains alone. The graph in section B displays a gradient from Anatolia to
Egypt and subsequently to the southern Arabian J1-M267 lineages from UAE, Yemen and Qatar
while Oman does not display an apparent affinity with respect to the J 1-M267 lineages of any of
the former populations.
12

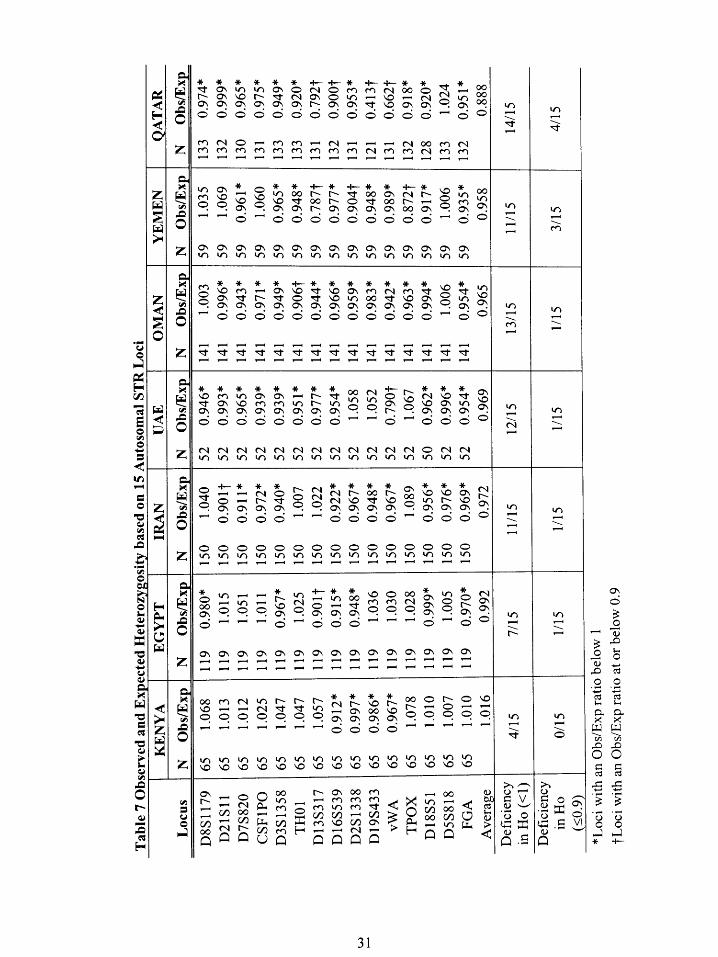
Intrapopulation Autosomal STR diversity
Table 7 presents the observed and expected heterozygosity values of 15 autosomal STR
loci for Kenya, Egypt, Iran, UAE, Oman, Yemen and Qatar with the observed to expected ratios
provided in the final column for each population. A gradient in the number of loci that display a
deficiency in observed heterozygosity (a ratio below 1) is apparent moving north then east from
Africa (4/15 loci for Kenya and 7/15 for Egypt) then south from the Iranian Plateau (11/15 in
Iran) towards the southern populations of the Arabian Peninsula (12/15 for UAE, 13/15 for
Oman, 11/15 for Yemen and 14/15 for Qatar). Despite possessing more loci with a ratio above
one, the average observed to expected heterozygosity ratio for Yemen (0.9581) is slightly lower
than that observed in Oman (0.9652) and UAE (0.9694). By taking into account the number of
loci showing a greater deficiency in their observed to expected ratios (at or below 0.9), a total of
three loci in Yemen and four in Qatar fall below this threshold while only one meets this mark in
Oman, UAE, Iran and Egypt.
13

IV Discussion
Distribution of E3b]-M35 derivatives
The presence of signature sub-Saharan African mtDNA lineages in the south Arabian
populations has been attributed to various waves of gene flow to the region, including that
associated with the Arab slave trade from eastern Africa. This is apparent from the exact mtDNA
haplotype matches between lineages in Yemen and East Africa, including those associated with
the Bantu expansion (Kivisild et al 2004). The presence of the E3a-M2 lineage in Oman (7%)
(Luis et al. 2004), Yemen (3.23%), UAE (5.49%) and Qatar (2.78%) could lead to the erroneous
conclusion that these chromosomes are also a contribution from the East African slave trade.
Mitochondrial DNA analysis of the Yemen Hadramawt indicates recent gene flow (~2500 ybp)
from Africa to the Arab populations in part through the Arab slave trade but an ancient arrival
from East Africa through Y-chromosomal analysis (Richards et al 2003). Further analysis of the
distribution of E3b1-M35 and its derivatives throughout Africa and Arabia has discredited the
possibility of a recent introduction via the seafaring slave trade routes and indicates an ancient
arrival of these markers (Luis et al. 2004). The contrast between female versus male mediated
gene flow between these two areas can be attributed to the assimilation of females within the
Arabian populations, mainly as concubines, while the males were often subjected to castration
and as a result left few descendants.
The E3bl-M35 sublineages, M123 and M78, are believed to have spread from East
Africa to North Africa and later expanded eastward through the Levantine corridor and westward
to northwestern Africa. While E3bla-M78 data suggests that this dispersal occurred in both
directions (Underhill et al 2001; Cruciani et al 2002,; Luis et al 2004), the E3blc-M123 lineage
spread primarily to the east (Luis et al 2004). The distribution of the E3bl-M35 derivatives in
Yemen, Qatar and UAE agrees with the arrival of these lineages by expansion via the Levantine
corridor rather than through the Horn of Africa. This is immediately apparent by the M35 profile
14

of several East African populations. Despite characterizing the East African populations and
persisting even after introduction of E3a-M2 during the Bantu expansion, E3bl*-M35 is
completely absent from the Omani (Luis et al 2004), Qatari and UAE collections and relatively
low in the Yemeni (3.23%). Kenya, Sudan and Tanzania (Luis et al. 2004; Cruciani et al. 2004;
Underhill et al. 2000) also lack the E3b1c-M123 lineage that is common in the Near East
(Cinnioglu et al. 2004; Cruciani et al. 2004; Semino et al. 2004; Underhill et al. 2000).
Furthermore, Ethiopia (Underhill et al. 2000) and Somalia (Sanchez et al. 2005) exhibit high
levels of E3bla-M78 (23% and 77.6%, respectively), which is null or nearly absent in the two
populations closest to the Strait of Sorrows (Bab-el Mandeb Channel), Yemen (0%) and Oman
(1.7%) (Luis et al. 2004).
On the other hand, Cruciani et al. (2004) has postulated that the E3b1c-M 123 clade may
have originated in the Near East since its presence in East Africa is restricted to Ethiopia
(11.2%). The median BATWING expansion time for M123 in UAE (12.59 ky) is older than
those estimated for Yemen (7.16 ky) and Oman (3.2 ky) (Luis et al. 2004) but comparable to
what was obtained for Egypt (10.8 ky). The estimated age of M123 microsatellite variation
obtained through the method described by Zhivotovsky et al. (2004) was 11.1 3.9 ky in UAE
and 10.6 4.1 ky in Yemen. Y-microsatellite diversity also indicated that the ancestors in both
populations arrived independently. A Y-STR based PC analysis of the M123 chromosomes
(Figure 5, Panel A) displays a prominent separation along Axis II in which UAE segregates away
from Yemen and Oman, displaying an affinity towards Egypt. Recent archaeological finds
supports a trading relationship between Mesopotamia and the Arabian Gulf region dating back to
the Al Ubaid Period (-8000ybp) as evidenced by the excavation of Ubaid pottery from
Mesopotamia in UAE (Flavin and Shepherd 1994; Beech and Elders 1999; Beech et al. 2005).
Ancient maritime trade routes linking Mesopotamia to the Indus Valley encompassed Dilmun
(covering the island of Bahrain) and Magan (in the southeastern tip of the Arabian Peninsula). It
15

is possible that the close ties between Mesopotamia with both the Nile River Valley and the
ancient gulf region during the Neolithic helped disseminate these lineages.
UAE is characterized by polymorphic levels of E3bl a-M78 (7.93%), less common in
neighboring populations (4.17% in Qatar and 1.7% in Oman [Luis et al. 2004]) but the highest
M35 derivative in Egypt (18%) (Luis et al. 2004). The majority of the UAE M78 representatives
belong to the E3bla3-V22 clade (6.71%). Microsatellite networks of this newly defined UEP
indicate that it shares a congruity with the M78 haplotype cluster 6, although some discrepancies
exist (Cruciani et al. 2006). Based on the distribution and high microsatellite differentiation of
cluster 6, its dispersal may have occurred early, the first to spread the E3bla-M78 chromosomes
to North Africa and then the Near East (Cruciani et al. 2004). An ancient arrival of the V22 clade
to UAE, however, is not reflected in the low microsatellite variance (0.11) obtained within this
group.
Comparison of the distribution of E3bl-M35 derivatives in the southern region of Iran
with that of Oman and Yemen also sheds light on the ancient migratory path that spread this
lineage to the Iranian plateau. The higher frequencies of E3blc-M123 in conjunction with the
lower frequencies of E3bl a-M78 in Oman (12% and 1.7%, respectively) (Luis et al 2004) and
Yemen (8% and 0%, respectively) does not support spread of the M35 lineage to Iran via the
Strait of Hormuz since south Iran is characterized by a relative higher frequency of the M78
derivative (4.27%) compared to the M123 derivative (0.85%). The data would therefore suggest
that this lineage arrived in Iran via expansion from the Fertile Crescent. Glacio-hydro-isostatic
models in combination with observations of sea level changes have permitted the reconstruction
of paleoshorelines of the Persian Gulf, indicating that the opening of the narrow waterway
presently known as the Strait of Hormuz occurred 14,000 ybp with subsequent flooding
occurring due to the melting of distant glacial ice sheets with present shorelines attained 6,000
ybp (Lambeck 1996). The creation of this waterway possibly acted as a barrier for gene flow
16

during the Neolithic expansion that disseminated the M35 derivatives. However, its absence
during the Paleolithic would have offered a natural route as populations moved eastward, such as
the early dispersals to Australia, in which case a specific coastal route via the Strait of Hormuz
has been suggested (Lahr and Foley 1994, 1998).
Origin of J-M267
Previous studies on haplogroup J1-M267 have documented high frequencies for this
lineage in the areas of Oman (38%) (Luis et al 2004), Iraq (33%) (Al-Zahery et al 2003), Egypt
(20%) (Luis et al 2004), Lebanon (13%) (Semino et al 2000), and Turkey (9%) (Cinnioglu et al.
2004). The combination of these data with the high frequency of J1-M267 in the Yemeni
(72.58%), Qatari (58.33%) and UAE (34.76%) samples examined in the present study reveals a
decreasing frequency moving from southern Arabia northwards. The lineage is also distributed
throughout the northwestern African populations at considerable frequencies (35.0% and 30.1%
in Algeria and Tunisia, respectively) (Semino et al. 2004). Based on biallelic and microsatellite
markers, the greatest degree of differentiation for J1-M267 is detected in the Levant with two
distinct demographic dispersals generating its current distribution. A higher observed STR
diversity of this clade among Europeans and Ethiopians in comparison to populations of North
Africa points to its arrival to Ethiopia and Europe during Neolithic times with a more recent
arrival to the latter (Semino et al 2004). Semino et al. (2004) describes a YCAIIa22-YCAIIb22
motif in the North African (>90%) and Middle Eastern (>70%) J1-M267 representatives that is
less frequent in Ethiopia and Europe, postulating that the dispersal of the M267-YCAIIa22-
YCAIIb22 clade occurred during the Arab expansion in the 7th century A.D.
The decreasing frequency of this marker moving northward to the Fertile Crescent area
and its higher frequencies in the southern regions of the Arabian Peninsula suggests expansion
from this area but median BATWING expansion times based on Y-STR data for the Omani (2.3
17

ky) (Luis et al. 2004), Yemeni (2.66 ky), Qatari (3.80 ky) and UAE (1.13 ky) J1-M267
chromosomes indicates a more recent arrival to the south Arabian populations as compared to the
older expansion times generated for the Egyptian (6.4 ky) (Luis et al. 2004) and Turkish (15.4
ky) (Cinnioglu et al. 2004) representatives of this haplogroup. Y-STR based PC analysis of the
J1-M267 faction from these same populations (Figure 5, Panel B) displays a closer affinity to
Egypt than to Turkey for the south Arabian populations, with the Omani segregating alone more
prominently along Axis II. However, it is difficult to draw conclusions from this type of analysis
among these populations since Y-STR diversity may be plagued by higher levels of inbreeding,
an issue elaborated further in the next section. As a result of intrafamily marriages as a common
practice infused in their cultural beliefs, the lower microsatellite variance (0.14 for Qatar, 0.15
for UAE, 0.20 for Yemen and 0.27 for Oman [Luis et al. 2004] vs. 0.31 in Egypt [Luis et al.
2004] and 0.51 in Turkey [Cinnioglu et al. 2004]) may not accurately reflect the diversity in the
region. Conversely, Y-microsatellite age estimates based on the method described by
Zhivotovsky et al. (2004) retrieved much older values for the J1-M267 haplogroup in Yemen,
Qatar and UAE (9.7 2.4ky, 7.4 2.3ky and 6.4 1.4ky, respectively).
An expansion of J1-M267 from south Arabia can be corroborated with the earlier
Neolithic dispersal observed for Europe and Ethiopia. Kivisild et al (2004) has suggested an
asymmetry between E3bla-M78 and J1-M267 chromosomes, where Ethiopians were recipients
of J 1-M267 from southern Arabians but were not competent donors of E3b 1 a-M78 to this area.
According to Semino et al (2004), the J1-M267 haplogroup distribution in Ethiopia encompasses
a third of Amharan Y-chromosomes but has hardly penetrated the Cushitic-speaking Oromo
population. The Amhara population can trace their roots back to Menelik I, son of Sheba and
King Solomon and their descendants later settled on the west coast of the Red Sea from their
home in southern Arabia around 1000 B.C. (Lundquist and Boyd-Jenkins 1997). Dispersal of the
J 1-M267 chromosomes from the southern Arabian Peninsula to the Semitic-speaking Amharas
18

could have been facilitated via the Horn of Africa as a result of the settlement of the Sabaen
(Sheban) people to the west and can account for the higher frequency of this group in the
Amharan versus the Oromo Ethiopians as well as explain the asymmetry observed in the
distribution of E3bla-M78 and J1-M267. The spread of J1-M267 into Europe could have been
facilitated through trade along the Red Sea. Under Sabaen rule, during the 8th century B.C.,
Yemen was a rich source of frankincense and myrrh for the Arabian spice trade. These were
exported to the Mediterranean via camels on routes through Arabia and via the Red Sea to ports
in Egypt where it was subsequently imported into Europe.
Implications of Y-chromosome distribution in Arabia
Overall, the southern Arabian populations segregate together at an intermediate position
with populations from the Levant in both the ML and PC analyses, appropriate considering their
strategic geographic location at a major bidirectional gateway connecting Africa and Eurasia.
Based on the AMOVA, it is also possible to deduce that the overall Y-haplogroup substructure
observed in these regions is affected more by geography (t_=0. 16) than by language ( c,=0.08).
Upon classifying the populations based on language family affiliations, the variance among
populations within groups was greater ($sc=0.14) than the ct attributable to variation among
groups. This difference can be expected since the Afro-Asiatic family encompasses a large
variety of languages. Pairwise comparisons of the 14 populations based on Y-haplogroup
frequency data (Table 4) revealed that only 9 of 54 comparisons displayed nonsignificant
differences within the Afro-Asiatic family, leaving a total of 65 pairwise comparisons generating
significant differences.
Studies focused on this critical crossroads for human movements have identified
geographical barriers that may have limited gene flow with neighboring regions. Specifically, a
study based on 15 autosomal STR loci identified a concentration of genetic homogeneity within
19

the Near East, suggesting that the Saharan desert, the Iranian deserts and the Hindu Kush
Mountains may have acted as obstacles for dispersal (Shepard and Herrera 2006). The portrayal
of the Dasht-e Kavir and Dash-e Lut deserts of Iran as barriers to gene flow has been described in
the context of the Rlal-M198 lineage (Quintana-Murci et al. 2001; Wells et al. 2001; Qamar et
al. 2002; Regueiro et al. 2006) as well as in the dissemination of Rlbla-M269 within Iran
(Regueiro et al. 2006). Moreover, an admixture analysis by Regueiro et al. (2006) identified the
Hindu Kush Mountains as a limiting factor of gene flow upon stratification of Pakistan into
northern and southern regions, leading to distinct contributions to the Iranian gene pool (0.40 and
0.25 for the south and north, respectively). Similarly, dividing Turkey into northeast, central east
and southeast as part of the admixture analysis associated the harsh, mountainous terrain in
northeast Turkey as a significant barrier for human migrations to the Iranian plateau (Regueiro et
al. 2006).
In order to further understand the population substructure of southern Arabia, admixture
proportions from Turkey, Pakistan and Kenya were generated (Table 5) for Yemen, Qatar and
UAE as well as for Oman and Egypt (Luis et al. 2004). The Hindu Kush Mountains persist as a
geographical obstacle to gene flow from the northern region of Pakistan, as evidenced in the
lower proportions to Qatar, UAE and Oman when compared to South Pakistan (Qatar: 0.165 vs.
0.000, UAE: 0.163 vs. 0.059, Oman: 0.161 vs. 0.030 for the south and north, respectively). In
contrast, Pakistan did not contribute to either the Yemeni or Egyptian gene pool when compared
to Turkey as a whole, which may be indicative of limited contact between these populations as a
result of the greater geographical distance. The arid, coastal region that encompasses parts of
South Iran, Afghanistan and Pakistan known as the Balochistan may have provided a unique
corridor for human dispersals along the Gulf of Oman. A genetic homogeneity can be detected
among the populations surrounding this body of water. South Pakistan, South Iran, UAE, Oman
and Qatar (although to a lesser extent) share a similar Y-haplogroup substructure with clinal
20

decreases in diversity detected as one moves west to Africa, north to the Levant and Caucasus
and east to south and central Asia. While the Hindu Kush Mountains and Iranian deserts may
have played a significant role in encapsulating the region and limiting gene flow, the coastal area
may have served as a unique corridor facilitating dispersals into and out of the region.
At another extreme, the haplogroup distribution of Yemen shows very limited variation,
particularly when compared to neighboring populations, Oman and UAE (3 versus 11
haplogroups each) and is only rivaled in this lack of diversity by Qatar with a total of 7
haplogroups, 4 of which display frequencies of less than 3%. Although Qatar does not
approximate the lack of diversity seen in Yemen, the two populations display affinities that are
apparent in the ML dendogram and PC plot. In both analyses, Qatar and Yemen are set apart
from both UAE and Oman. In the ML tree, Iraq is intermediate to these two clusters, while in the
PC graph the populations of the Levant are interspersed among the south Arabian populations.
To some extent, this trend repeats itself in the admixture analysis in which the proportions from
the three parental populations (Turkey, Pakistan and Kenya) display similarities when comparing
Yemen to Qatar and UAE to Oman.
Regional Autosomal STR Analysis
In order to investigate the potential reasons for the lack of Y-chromosome diversity, the
observed heterozygosity values were calculated based on 15 highly polymorphic autosomal STR
loci from published data on Kenya, Egypt, Oman, Yemen (Shepard and Herrera 2006), Iran
(Shepard and Herrera 2005), Qatar (Perez-Miranda et al. 2006) and UAE (Cadenas and Herrera
2006) and are presented in Table 7. Due to the large number of alleles that exist at each loci,
obtaining a ratio of observed to expected heterozygosity below one may be indicative of a high
degree of consanguinity within the population. Qatar possessed 14 out of 15 loci with an
observed to expected ratio below one, closely followed by Oman (13 loci), UAE (12 loci) and
21

Yemen and Iran (11 loci each). By lowering the threshold to a ratio at or below 0.9, only Qatar
(4 loci) and Yemen (3 loci) rivaled each other while Oman, UAE, Iran and Egypt maintained
only one locus within this new limit.
Due to the social and cultural beliefs of Muslim countries, especially in the Middle East,
consanguineous marriages are a common tradition, particularly among first cousins, which are
preferred. A study performed within Sana'a City, Yemen revealed the incidence of
consanguinity at 44.7%, with first-cousin marriages comprising 71.6%, and an average
coefficient of inbreeding (the probability of an individual having two alleles identical by descent
at a given locus as a result of receiving both from a common ancestor) of 0.02442 (Gunaid et al.
2004), almost double that of the Egyptian population (0.01) (Hafez et al. 1983) and four times
that of the Turkish population (0.0064532) (Basaran et al. 1988). Parallel studies conducted in
Qatar revealed a rate of consanguinity of 54.0% (first cousin marriages accounting for 34.8%)
and a coefficient of inbreeding of 0.02706 (Bener and Alali 2005), while similar consanguinity
rates were observed in UAE (50.5%) (Bener et al. 1997) and Oman (35.9%) (Rajab and Patton,
2000). These figures are representative of the region as a whole where consanguineous
marriages are prevalent (28.96% in Egypt [Hafez et al. 1983]; 33% in Syria [Prothro and Diab,
1974]; 51.2 to 54.4% in Jordan [Khoury and Massad, 1992; Sueyoshi & Ohtsuka, 2003], 57.7%
in Saudi Arabia [El-Hazmi et al. 1995] and 54.4% in Kuwait [Al-Awadi et al. 1985]).
The distinction seen in Qatar and especially in Yemen is difficult to appreciate since it
does not adhere to any apparent trends in geography, with both countries straddling opposite
sides of UAE and Oman. Evidence of early inhabitation in southeast Arabia as well as contact
with other populations is evident (as in the case of trade with Mesopotamia during the Neolithic,
described in a previous section). The region's critical role for trade continued to render it an
important point of contact between populations and a target of attacks in attempts to gain control
of trade from the gulf. Oman has been a critical player in this struggle during historical time.
22

Furthermore, Oman's role in the east African slave trade has been well documented and
supported by previous studies (Richards et al. 2003; Luis et al. 2004; Rowold et al. 2006) and
may account, at least partially, for the greater diversity it exhibits.
Conclusion
The Y-haplogroup substructure of the populations occupying the southern Arabian
Peninsula (with the exception of Yemen) display considerable variability, a trait that is consistent
with neighboring regions and accurately reflects its role as a link between distant civilizations.
The frequency distribution of two haplogroups in particular (E3bl-M35 and J1-M267) further
elucidates their dissemination. Specifically, the role of the Levant in the dispersal of the E3b 1-
M35 derivatives persists, pointing to an earlier arrival to southern Arabia as opposed to a more
recent introduction through the trafficking of East African slaves. In addition, an affinity
between UAE and Egyptian E3b1c-M123 chromosomes supports archaeological finds of ties
between the Fertile Crescent and the trading cities along the Persian Gulf. While the decreasing
frequencies of haplogroup J1-M267 from southern Arabia northwards may be indicative of
spread from this region, Y-microsatellite based age estimates provides contradictory results.
A comparison of Y-haplogroup substructure of the populations surrounding the Gulf of
Oman reveals homogeneity among them. This can be attributed on one hand to geographical
barriers in the form of mountains and deserts limiting gene flow but more importantly, the coastal
region along the Gulf of Oman may have facilitated dispersals into and out of the area. The
limited variability seen in Yemen (and to some extent Qatar) does not mirror the diversity
observed in the coastal populations of UAE, Oman, South Iran and South Pakistan. An analysis
of heterozygosity using hypervariable autosomal STR loci indicates that both Yemen and Qatar
display a deficiency in observed heterozygosity that may be affected to some extent by high rates
of consanguineous marriages in the region. In addition, a string of relatively recent events may
23

have maintained Oman and UAE in close contact with other cultures as a result of attempts to
gain control of the gulf as well as due to Oman's involvement in the East African slave trade.
24

Table 1 Description of Populations Analyzed
Region Population Code n Reference
North Africa Egypt EGY 147 Luis et al.2004Algeria (Arabs) ALA 35 Arredi et al.2004Algeria (Berbers) ALB 19 Arredi et al.2004Tunisia TUN 148 Arredi et al.2004
East Africa Kenya KEN 29 Luis et al.2004
Somalia SOM 201 Sanchez et al.2005
Oromo ORO 78 Semino et al.2002Amhara AMH 48 Semino et al.2002
ArabianPeninsula United Arab Emirates UAE 164 Present study
Qatar QAT 72 Present study
Yemen YEM 62 Present study
Oman OMA 121 Luis et al.2004
Caucasus Georgia GEO 49 Regueiro et al.2006
Armenia ARM 100 Nasidze et al.2003
Azerbaijan AZE 72 Nasidze et al.2003
Levant Lebanon LEB 31 Semino et al.2000
Syria SYR 20 Semino et al.2000Iraq IRQ 139 Al-Zahery et al.2003
Anatolia Greece GRE 76 Semino et al.2000
Turkey TUR 523 Cinnioglu et al.2004
Iranian Plateau North Iran NIR 33 Regueiro et al.2006
South Iran SIR 117 Regueiro et al.2006
South Asia North Pakistan NPK 85 Sengupta et al.2006
South Pakistan SPK 91 Sengupta et al.2006
Gujarat GUJ 29 Kivisild et al. 2003
Punjab PUN 66 Kivisild et al. 2003
Mongolia MON 147 Karafet et al. 2001
Central Asia Tajikistan TAJ 24 Regueiro et al.2006
Uzbekistan UZB 54 Karafet et al. 2001
Kazakhstan KAZ 30 Karafet et al. 2001
Kyrgyzstan KYR 52 Wells et al. 2001
Turkmenistan TKM 30 Wells et al. 2001
25

Table 2 Y-Chromosome Haplogroup Frequencies ObservedHAPLOGROUP QATAR UAE YEMEN
B2a-M150 1.39B2b-M112 1.39
C5-M356 1.22E2-M75 1.39
E2a-M98 2.78
E3a*-M2 3.23E3a1-M191 2.78 5.49
E3b*-M215 1.61
E3b1*-M35 3.23E3bla-M78 2.78 1.22
E3bla3-V22 1.39 6.71E3blb-M81 0.61
E3blcl-M34 1.39 3.05 8.06E3c-M329 1.39F*-M213 3.66F1-M282 0.61
G1*-M285 1.83Gla-P20 0.61G2*-P15 2.78 1.83 1.61
H*-M69 2.44Hla-M82 1.39 1.83
J1-M267 58.33 34.76 72.58
J2a-M12 1.39 1.21
J2al-M241 1.39J2b-M410 1.21 4.84
J2b1*-DYS413 2.78 4.27J2bla-M47 1.39 1.83J2blb-M67 1.39 0.61 4.84
J2blbl-M92 1.21K2-M184 4.89L1-M76 2.78 2.44
L3-M357 0.61
O*-M175 0.61Ola-M119 0.61
Q*-M242 1.22
Q5-M346 0.61
R1*-M306 0.61
Rlal-M198 6.94 7.32
R1bl*-P25 0.61Rlbla-M269 1.39 3.66
R2-M124 1.39
26
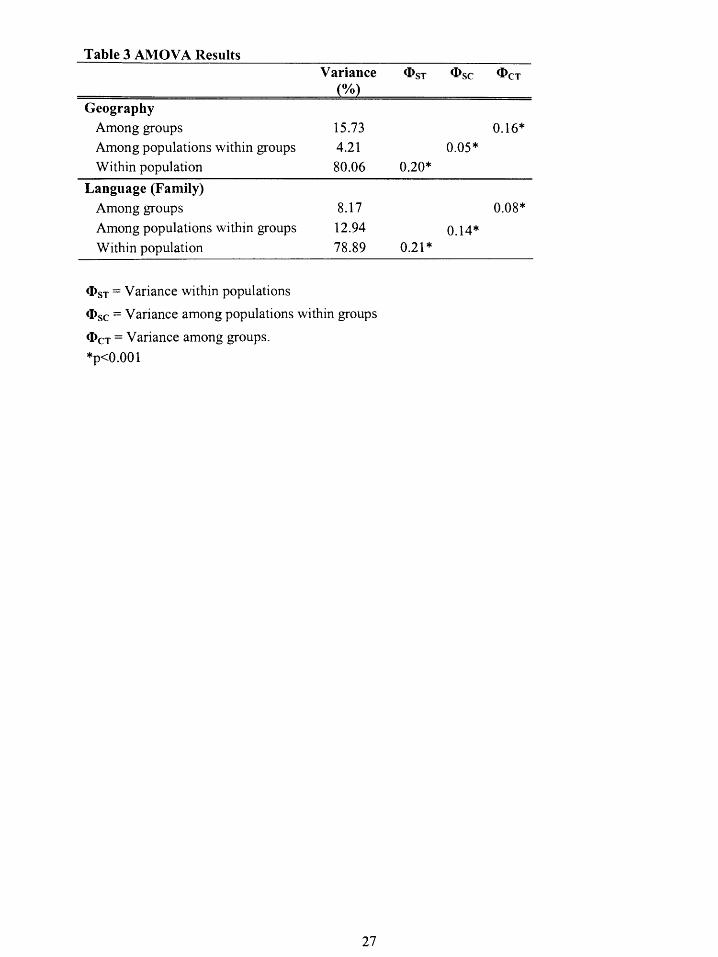
Table 3 AMOVA ResultsVariance OsT Osc OCT
(%)Geography
Among groups 15.73 0.16*
Among populations within groups 4.21 0.05*
Within population 80.06 0.20*
Language (Family)
Among groups 8.17 0.08*
Among populations within groups 12.94 0.14*Within population 78.89 0.21*
(DST = Variance within populations
sc = Variance among populations within groups
OCT = Variance among groups.
*p<0 .0 0 1
27
t O M kn r- o C, lKy N Q1 I ' \O Q r- 00 OM c
r M \O .-- Opy ^" N O o 00 r- '- m G1
d ' C.,1 -4
n [ o M O O O -- + M a1 "S O
j kn \D - N N 4 M M \O 00 M r-+ O
00 M M r- -C r- to m N r-. W N O
-+ r- M O M C's o, 00 t M NN (3r oo M 00 r- O d W) O Oto o'o c1 O -G M M n kn t M N N kn O o
M 00 N cr ) O o 0d 00 0 \,O M . W) O C)
a O N v> n N 01 0 0 0
W-) M N M N N IC M -- O*N O O O
a l- M Q\ M N -- IND Wn IT O.-.-- + to 0 00 M O M 1 0 O kn O
oqt:t c n. "o r> V1 r""4 O O O ;,
N N ct .- "--N O O O O
CW N M -- r v N n N N"D M"D O
kn 00 M N Ln N 00 o 0 0
W O 'ZT
C., O O O O 41
N N "-+ to N N O o 0 0 6
p a, O C 0 0 0 0
N "' o0 0 0 C 0 0 0
cis
" o 0 0 00 Wn m 00 O O O o cl
n r, n o O o qt o 0 0 o b
W r o kn m Lr; oo 0 0 0 0 0
Q 00 r- r- C 00 0 0 0 0 0 0 0 4
" r' N 0 0 0 0 0 0 0 Od Q a . r- . ? 0 0 0 0 0 0 0 0
W o Ln o o 0 0 0 0 0 0 0 0 aC> rq o 0 0 0 0 0 0 6 6
I'D NC Lr) 0 0 0 "D c \0 O O o.
M D O O O O O M O -- + O O O
N M ,O O O O O N 0 0 0 0
Cl Q cM N N M 0 0 0 0 0 0 0 0
da 00 O N O O o 0 0 0 0 0 0 0"CS ( "-M O O o 0 0 0 0 0 0 0 O(. O O o 0 0 0 0 0 0 0
d O O o 0 0 0 0 0 0 0 pA" y
e
+-+ n -- O O O D\ O O C) O
N 0 0 0 0 0 0 0 0 0 0 0 p
D O n N 0 0 0 0 0 0 0 0 0 0 6 a,
O
O
v 00 O cM 0 0 0 .- "+ tn O O O o u "
-- W O O 0 0 0 00 0 0 0 0 O CL
O O O O N 0 0 0 0 Cl
. O O O O O O O O O O O O
0 0 0 0 0 0 Q\ O O o 0
O O O O O CD O 0 0 0 0 o p.,
( O O O O O O O O O O O O Cl
, W 0 0 0 0 0 0 0 0 0 0 0 0 0 p 4
O C
C7 W Ow N W aa, 00 Q ,
- w Or QC7d av a,,
, a C'7 z
28

Table 5 Admixture Proportions (pY standard error) from Pakistan, Turkey and Kenya
Parental Population Hybrid PopulationQatar UAE Yemen Oman Egypt
Pakistan (p1) 0.074 0.34 0.141+0.20 0.000 0.43 0.136 0.24 0.000+0.17Turkey (p2) 0.855 0.37 0.755 0.22 0.943 0.47 0.711 0.27 0.899 0.19
Kenya (p.3) 0.072 0.16 0.104 0.09 0.057 0.20 0.153 0.12 0.101 0.08
North Pakistan (p1) 0.000 0.32 0.059 0.19 0.000 0.40 0.030 0.26 0.000 0.16Turkey (p2) 0.922 0.34 0.832 0.20 0.943 0.43 0.561 0.28 0.899 0.17Kenya (p3) 0.078 0.16 0.108 0.09 0.057 0.20 0.409 3.79 0.101 0.08
South Pakistan (pl) 0.165 0.29 0.163 0.17 0.000 0.36 0.161 0.21 0.000 0.15
Turkey (p2) 0.765 0.39 0.730 0.23 0.943 0.49 0.683 0.28 0.899 0.20
Kenya (p3) 0.069 0.16 0.107 0.09 0.057 0.20 0.156 0.12 0.101 0.08
Pakistan (p1) 0.018 0.34 0.105 0.20 0.000 0.43 0.020 0.25 0.000 0.18
East Turkey (p2) 0.914 0.37 0.793 0.22 0.952 0.47 0.823 0.28 0.898 0.20
Kenya(p3) 0.068 0.16 0.102 0.09 0.048 0.20 0.157 0.11 0.102 0.08
Pakistan (p1) 0.201 0.33 0.245 0.19 0.000 0.41 0.220 0.24 0.066 0.17
West Turkey (p2) 0.725 0.35 0.651 0.21 0.927 0.44 0.624 0.26 0.831 0.19
Kenya (p3) 0.074 0.16 0.105 0.10 0.073 0.20 0.155 0.12 0.103 0.08
29

[ W M
+ CD
M 00 M r- d Olo 1-4 A O O O 00 00 kr)r i V1 D1 M V> N 00 \p
M r- 00 N .- +
v> N -- M
w
It
C c O
'v a M Ln v> 00 00 110 p ON0 O O o O N
0, N o .--" ,
a N O O O O O O O O
H v
v E
...
ar o oC c, d O O
,d b 00 M N00 kr) elf)0
N O
G) «i'
> O
C O [ N Lr) cd O
ci N M -- N C1 00 .d >
M .-. .-. . V') O . C ..
v N N U
y cd
cl O
U M kr) M M .- M r-+ x ,
. O1 [ -- 01 d OS, .- + v
d O cn 00 tf) d [ aO + U O
" pis, Q"
a
c 3
W o s~
GA ' N kn M r-+ N O O a/
y a O O O O O O O O
C13 O O
r- 0z k,", V-) "'
tr)
C4 C/)
C/) .kf,
x C O 00 M 00 M . U
4 en
30
a [_] tt a, to N C, O N O cM M N 00 O r 00
N Do
a, a, a , C\ a, r- C', C dt o ON CN c) 00
d O
d M N O 00 M N
Z, M M M M M M M M M N M M N M M
X kn CN E O 9t 9E -I- 9E -t-- IF dE -i- lE 1 9E 00- In 00 r- t- d- 00 C's N r
W M O O -t oo r- O d 00 l- .-- 4 O M
C\ C1 C\ [ C1 C, Q1 C\ 00 C, C\
O .~ O~ 0 0 0 0 0 0 0 0 0
W M
oll C\ C, CN a\ a, CIS C1 C1 a1 a\ C, C, C, CN
y M * * * 1E -1- * dE dE 9E IC v )C1 "o t? c c, en N M t
d '-"000000000000'-'0o M r'
r~
O -4
C/ G M v) rn as, [- d 00 cqkn C> 110 N I
W C's M M N N C, O C, viD\ Q\ D1 O Q\ F, Q\ C, CN tr)
d O O O O O O O O o '~ ' O '~ O O O O N
+O+ N N N N N N N N N N N N O N N
d
C r~ C114 C) O N N"o 'd- O S 0 W) r- "o CNO Z C1 C' C (0, N C's C\ rn C, rn C, C, kn
0 0 0 0 ' ' O O O o- 0 0 0 0
O O o 0 0 0 0 0 o O CD O o 0 0
Z kn tn tr) kn tr) tn tr) In tr) tn tr) tn kr) Ln N
0
1%0 C> 00 a\
6 a, C> C) C C> CINQ .-. o. ooo.4.--1 o. oo "'
r~
CD O i
v W CN C% CN CIS Gl C C1 CIN aNI oN C olk CIN C a 3 0Z r4 r-4 r-t r-t -4 r-. r4 r4 .-- i r-4 1-4 r-r r4 r4 -4
-4 -4 -4 .-- i r--4 '.--r r"-1 r"1 -4 ,--i r-1 a,
v m
O O
W ? 00 M N cj 4 4r- N [- '1:1 r r- O 6 o- $-
Q" Q-"C ~ , 0 0 0 0 0 0 0 C cC', 00 1 0CIN X 0 0 0 C=
G r_. r~ r-
V) In
O O 110 O so o o o C IO O o
cl m
O
A_ ] x
v r- O . - - CN M M M W) 00 v V p
'-' N a M M in M "t d X Q' 9m
v N - 3 3 UO 00 C,) 00
O 0 00 En .J U U O U x UCIO m "D v) C
U
B oo N r- M H N H A Q '' x "I
F;, AAAUA AAAA A. A - -
31

0ELIEQ
" Q w Q (7
N (psi
32

/ ': _' -; Q ® Q ,wo
.lz
J % -
0 El all
x rN
El M
25.. '... mQQ QQ
N
F' a ..........
a _ ---- _--_-
33

Somalia KenyaOromo
AlgBerbs 477GreeceSyria Tunisia AlgArabs 929
AmharaLebanon EgyptAh
548 301Qatar 502901
Yemen 630622
975 417
IraqOman 160
UAE 281 236378 481 South Iran
499. 524 342 Turkey768- 555
Armenia North IranTurkmenistan AzerbaijanGeorgia 532
500South Pakistan
.451695,
623 Tajikistan
Gujarat Punjab 673North Pakistan
857 Kyrgyzstan
947,Uzbekistan
Kazakhstan Mongolia
Figure 3
100
34

1.50
OMON
0.88
KAZ OKEN
O
0\
ORO0 OAIH
M OSOM
r
0.25
UZB E% GALA
X pO
OMA T O ALB
NIR KYR O OOQAT
O SIT LEBO OIRQ
O UAE O GAZE
GEO SYR
NPK T^J O Oc' OARM
-0.3 O O OSPK
O OTKM
GU] OPUN
-1.0
-1.50 -0.88 -0.25 0.38 1.00
Axis I (22.71 %)
Figure 4
35

A E3b3-M123
1.00
oEGY0.50
OUAE00
ON
0.00 - TUR
OYEM
-0.50
OOMN
-1.00-1.50 -0.75 0.00 0.75 1.50
Axis I (49.28%)
W J1-M267
1.00-
0.50- GY OTUR
PAK0 0
ON OQAT
0.0 oYEM
OUAE
-0.5
0 OMA
-1.50 -0.75 0.00 0.75 1.50
Axis I (49.28%)
Figure 5
36
References
Al-Awadi SA, Moussa MA, Naguib KK, Farag TI, Teebi AS, El-Khalifa M and El-Dossary L(1985) Consanguinity among the Kuwait population. Clin Genet 27:483-486
Al-Gazali LI, Bener A, Abdulrazzaq YM, Micallef R, Al-Khayat Al and Gaber T (1997)Consanguineous marriages in the United Arab Emirates. J Biosoc Sci 29:491-497
Al-Zahery N, Semino O, Benuzzi G, Magri C, Passarino G, Torroni A, Santachiara-BenerecettiAS (2003) Y-chromosome and mtDNA polymorphisms in Iraq, a crossroad of the early humandispersal and of post-Neolithic migrations. Mol Phylogenet Evol 28(3):458-472
Antunez de Mayolo G, Antunez de Mayolo A, Antunez de Mayolo P, Papiha SS, Hammer M,Yunis JJ, Yunis EJ, Damodaran C, Martinez de Pancorbo M, Caeiro JL, Puzyrev VP, Herrera RJ(2002) Phylogenetics of worldwide human populations as determined by polymorphic Aluinsertions. Electrophoresis 23:3346-3356
Basaran N, Sayli BS, Basaran A, Solak M, Artan S, Stevenson JD (1988) Consanguineousmarriages in the Turkish population. Clinical Genetics 34: 339-341
Beech M, Cuttler R, Moscrop D, Kallweit H, Martin J (2005) New evidence for the Neolithicsettlement of Marawah Island, Abu Dhabi, United Arab Emirates. PSAS 35: 37-56
Beech M and Elders J (1999) An 'Ubaid-related settlement on Dalma Island, Abu Dhabi Emirate,United Arab Emirates. Bulletin of the Society for Arabian Studies 4:17-21
Bener A and Alali KA (2005) Consanguineous marriage in a newly developed country: The
Qatari population. J Biosoc Sci 38(2): 239-246
Cadenas AM and Herrera RJ (2006) Submitted
Carmody G (1991) G-test. Carleton University, Ottawa, Canada.
Cavalli-Sforza LL, Menozzi P, Piazza A (1994) The history and geography of human genes.
Princeton University Press, Princeton, NJ
Cinnioglu C, King R, Kvisild T, Kalfoglu E, Atasoy S, Cavalleri GL, Lillie AS, Roseman CC,
Lin AA, Prince K, Oefner PJ, Shen P, Semino 0, Cavalli-Sforza LL, Underhill PA (2004)Excavating Y-chromosome haplotype strata in Anatolia. Hum Genet 114:127-148
Cruciani F, La Fratta R, Torroni A, Underhill PA, Scozzari R (2006) Molecular dissection of the
Y chromosome haplogroup E-M78 (E3bla): A posteriori evaluation of a microsatellite-network-
based approach through six new biallelic markers. Hum Mutat 27(8):831-832
Cruciani F, La Fratta R, Santolamazza P, Sellitto D, Pascone R, Moral P, Watson E, Guida V,
Beraud Colomb E, Zaharova B, Lavinha J, Vona G, Aman R, Cali F, Akar N, Richards M,
Torroni A, Novelletto A and Scozzari R (2004) Phylogeographic analysis of haplogroup E3b (E-
M215) Y chromosomes reveals multiple migratory events within and out of Africa. Am J Hum
Genet 74:1014-1022
37

Cruciani F, Santolamazza P, Shen P, Macauley V, Moral P, Olckers A, Modiano D, Destro-BisolG, Coia V, Wallace DC, Oefner PJ, Torroni A, Cavalli-Sforza LL, Scozzari R, Underhill P (2002)A back migration from Asia to sub-saharan Africa is supported by high resolution analysis ofhuman Y-chromosome haplotypes. Am J Hum Genet 70:1197-1214
Di Rienzo A, Peterson AC, Garza JC, Valdes AM, Slatkin M and Freimer NB (1994) Mutationalprocesses of simple-sequence repeat loci in human populations. Proc Natl Acad Sci USA 91:3166-3170
El-Hazmi MAF, Al-Swailem AR, Warsy AS, Al-Swailem AM, Sulaimani R and Al-Meshari AA(1995) Consanguinity among Saudi Arabian population. J Med Genet 32:623-626
Excoffier L, Smouse PE, Quattro JM (1992) Analysis of molecular variance inferred from metricdistances among DNA haplotypes: application to human mitochondrial DNA restriction data.Genetics 131: 479-491
Felsenstein J (1989) PHYLIP-phylogeny inference package (version 3.2). Cladistics 5:164-166
Flavin K and Shepherd E (1994) Fishing in the Gulf: Preliminary investigations at an Ubaid site,Dalma (UAE). PSAS 24: 115-134
Gunaid AA, Hummad NA, Tamim KA (2004) Consanguineous marriage in the capital citySana'a, Yemen. J Biosoc Sci 36:111-121
Hafez M, El-Tahan H, Awadalla M, El-Khayat H, Abdel-Gafar A, Ghoneim M (1983)Consanguineous mating in the Egyptian population. J Med Genet 20:58-60
Hammer MF, Horai S (1995) Y chromosomal DNA variation and the peopling of Japan. Am J
Hum Genet 56: 951-962
Hassan F (2002) Archeology and linguistic diversity in North Africa. In: Bellwood P, Renfrew C
(eds) Examining the farming/language dispersal hypothesis. McDonald Institute for
Archeological Research, Cambridge, England, pp 127-133
Kayser M, Krawczak M, Excoffier L, Dieltjes P, Corach D, Pascali V, Gehrig C, Bernini LF,
Jespersen J, Bakker E, Roewer L and de Knijff P (2001) An extensive analysis of Y-
chromosomal microsatellite haplotypes in globally dispersed human populations. Am J Hum
Genet 68:990-1018
Khoury SA and Massad D (1992) Consanguineous marriage in Jordan. Am J Med Genet 43:769-
775
Kittles RA, Perola M, Peltonen L, Bergen AW, Aragon RA, Virkkunen M, Linnoila M, Goldman
D and Long JC (1998) Dual origins of Finns revealed Y chromosome haplotype variation. Am J
Hum Genet 62:1171-1179
Kivisild T, Reidla M, Metspalu E, Rosa A, Brehm A, Pennarun E, Parik J, Geberhiwot T, Usanga
E, Villems R (2004) Ethiopian mitochondrial DNA heritage: tracking gene flow across and
around the gate of tears. Am J Hum Genet 75:752-770
38

Kivisild T, Rootsi S, Metspalu M, Mastana S, Kaldma K, Parik J, Metspalu E,Adojaan M, TolkHV, Stepanov V, Golge M, Usanga E, Papiha SS, Cinnioglu C, King R, Cavalli-Sforza L,Underhill PA, Villems R (2003) The genetic heritage of the earliest settlers persists both in Indiantribal and caste populations. Am J Hum Genet 72(2): 313-332
Lahr MM, Foley RA (1998) Towards a theory of modern human origins: Geography,demography, and diversity in recent human evolution. Yearbook of Physical Anthropology41:137-176
Lahr MM, Foley R (1994) Multiple dispersals and modern human origins. Evol Anthropol 3:48-60
Lambeck K (1996) Shoreline reconstructions for the Persian Gulf since the last glacial maximum.Earth and Planetary Science Letters 142:43-57
Long JC, Williams RC, McAuley JE, Medis R, Partel R, Tregellas M, South SF, Rea AE,McCormick B, Iwaniec U (1991) Genetic variation in Arizona Mexican Americans: Estimationand interpretation of admixture proportions. Am J Hum Genet 84:141-157
Luis JR, Rowold DJ, Regueiro M, Caeiro B, Cinnioglu C, Roseman C, Underhill PA, Cavalli-
Sforza LL, Herrera RJ (2004) The Levant versus the Horn of Africa: evidence for bidirectional
corridors of human migrations. Am J Hum Genet 74:32-544
Lundquist R and Boyd Jenkins O (1997) People Profile: The Amhara People. Retrieved August
29, 2005 from http://orvillejenkins.com/profiles
Martinez L, Reategui EP, Fonseca LR, Sierra-Montes JM, Terreros MC, Pereira-Simon S,
Herrera RJ (2005) Superimposing polymorphism: the case of a point mutation within a
polymorphic Alu insertion. Hum Hered 59(2):109-117
Militarev A (2002) The prehistory of a dispersal: the proto-Afrasian (Afroasiatic) farming
lexicon. In: Bellwood P, Renfrew C (eds) Examining the farming/language dispersal hypothesis.
McDonald Institute for Archeological Research, Cambridge, England, pp135-150
Nasidze I, Ling EYS, Quinque D, Dupanloup I, Cordaux R, Rychkov S, Naumova 0, Zhukova 0,
Sarraf-Zadegan N, Naderi GA, Asgary S, Sardas S, Farhud DD, Sarkisian T, Asadov C, Kerimov
A, Stoneking M (2004) Mitochondrial DNA and Y-chromosome variation in the Caucasus. Ann
Hum Genet 68:205-221
Nasidze I, Sarkisian T, Kerimov A, Stoneking M (2003) Testing hypotheses of language
replacement in the Caucasus: evidence from the Y-chromosome. Hum Genet 112(3): 255-261
Ohta M and Ohta T (1978) Stepwise mutation model and distribution of allelic frequencies in a
finite population. Proc Natl Acad Sci USA 75(6):2868-2872
Perez-Miranda AM, Alfonso-Sanchez MA, Pena JA and Herrera RJ (2006) Qatari DNA variation
at a crossroad of human migrations. Hum Hered 61:67-79
Oppenheimer S (2003) Out of Eden: the peopling of the world. Constable, London
39

Qamar R, Ayub Q, Mohyuddin A, Helgason A, Mazhar K, Mansoor A, Zerjal T, Tyler-Smith C,Mehdi SQ (2002) Y chromosomal DNA variation in Pakistan. Am J Hum Genet 70:1107-1124
Quintana-Murci L, Chaix R, Wells RS, Behar DM, Sayar H, Scozzari R, Rengo C, Al-Zahery N,Semino 0, Santachiara-Benerecetti AS, Coppa A, Ayub Q, Mohyuddin A, Tyler-Smith C, MehdiSQ, Torroni A, McElreavey K (2004) Where west meets east: the complex mtDNA landscape ofthe southwest and central Asian corridor. Am J Hum Genet 74:827-845
Quintana-Murci L, Krausz C, Zerjal T, Sayar SH, Hammer MF, Mehdi SQ, Ayub Q, Qamar R,Mohyuddin A, Radhakrishna U, Jobling MA, Tyler-Smith C, McElreavey K (2001) Y-chromosome lineages trace diffusion of people and languages in southwestern Asia. Am J HumGenet 68:537-542
Prothro ET and Diab LN (1974) Changing family patterns in the Arab East Beirut. AmericanUniversity, Beirut
Rajab A and Patton MA (2000) A study of consanguinity in the Sultanate of Oman. Ann HumBio 27: 321-326
Raymond M and Rousset F (1995) GENEPOP (version 1.2): population genetics software for
exact tests and ecumenicism. J Heredity 86:248-249
Regueiro M, Cadenas AM, Gayden T, Underhill PA and Herrera RJ (2006) Iran: Tricontinental
nexus for Y-driven migration. Hum Hered 61:132-143
Richards M, Rengo C, Cruciani F, Gratrix F, Wilson JF, Scozzari R, Macaulay V, Torroni A
(2003) Extensive female-mediated gene flow from sub-Saharan Africa in to Near Eastern Arab
populations. Am J Hum Genet 72:1058-1064
Rohlf F (2002) NTSTSpc. Exter Publishing, Setauket, NY
Rowold DJ, Luis JR, Terreros MC and Herrera RJ (2006) In the steps of our foremothers:
tracking mtDNA geneflow through African-Asian pathways. Submitted
Sanchez JJ, Hallenberg C, Borsting C, Hernandez A and Morling N (2005) High frequencies of Y
chromosome lineages characterized by E3bl, DYS19-11, DYS392-12 in Somali males. Eur J
Hum Genet 13:856-866
Semino 0, Magri C, Benuzzi G, Lin AA, Al-Zahery N, Battaglia V, Maccioni L, Triantaphyllidis
C, Shen P, Oefner PJ, Zhivotovsky LA, King R, Torroni A, Cavalli-Sforza LL, Underhill P,
Santachiara-Benerecetti AS (2004) Origin, diffusion, and differentiation of Y-chromosome
haplogroups E and J: inferences on the neolithization of Europe and later migratory events in the
Mediterranean area. Am J Hum Genet 74:1023-1034
Semino 0, Santachiara-Benerecetti AS, Falaschi F, Cavalli-Sforza LL, Underhill PA (2002)
Ethiopians and Khoisan share the deepest clades of the human Y-chromosome phylogeny. Am J
Hum Genet 70: 265-268
40

Semino O, Passarino G, Oefner PJ, Lin AA, Arbuzova S, Beckman LE, De Benedictis G,Francalacci P, Kouvatsi A, Limborska S, Marcikiae M, Mika A, Mika B, Primorac D,Santachiara-Benerecetti AS, Cavalli-Sforza LL, Underhill P (2000) The genetic legacy ofPaleolithic Homo sapiens sapiens in extant Europeans: a Y chromosome perspective. Science290: 1155-1159
Sengupta S, Zhivotovsky LA, King R, Mehdi Q, Edmonds CA, Chow CT, Lin AA, Mitra M, SilSK, Ramesh A, Usha Rani MV, Thakur CM, Cavalli-Sforza LL, Majumder PP and Underhill PA
(2006) Polarity and temporality of high-resolution Y-chromosome distributions in India identifyboth indigenous and exogenous expansions and reveal minor genetic influence of Central Asian
pastoralists. Am J Hum Genet 78:202-221
Shen P, Lavi T, Kivisild T, Chou V, Sengun D, Gefel D, Shpirer I, Woolf E, Hillel J, Feldman
MW, Oefner PJ (2004) Reconstruction of patrilineages and matrilineages of Samaritans and other
Israeli populations from Y-chromosome and mitochondrial DNA sequence variation. Hum Mutat
24: 248-260
Shepard EM and Herrera RJ (2006) Genetic encapsulation among Near Eastern populations. J
Hum Genet 51:467-476
Shepard EM and Herrera RJ (2005) Iranian STR variation at the fringes of biogeographical
demarcation. For Sci Int 158(2-3): 140-148
Stringer C (2000) Coasting out of Africa. Nature 405:24-25,27
Sueyoshi S and Ohtsuka R (2003) Effects of polygyny and consanguinity on high fertility in the
rural Arab population in South Jordan. J Biosoc Sci 35:513-526
Thomas MG, Parfitt T, Weiss DA, Skorecki K, Wilson JF, le Roux M, Bradman N, Goldstein DB
(2000) Y chromosomes traveling south: the cohen modal haplotype and the origins of the Lemba-
the "Black Jews of Southern Africa". Am J Hum Genet 66: 674-686
Underhill PA, Passarino G, Lin AA, Shen P, Mirazon Lahr M, Foley RA, Oefner PJ, Cavalli-
Sforza LL (2001) The phylogeography of Y chromosome binary haplotypes and the origins of
modern human populations. Ann Hum Genet 65:43-62
Underhill PA, Shen P, Lin AA, Jin L, Passarino G, Yang WH, Kauffman E, Bonne-Tamir B,
Bertranpetit J, Francalacci P, Ibrahim M, Jenkins T, Kidd JR, Mehdi SQ, Seielstad MT, Wells
RS, Piazza A, Davis RW, Feldman MW, Cavalli-Sforza LL, Oefner PJ (2000) Y chromosome
sequence variation and the history of human populations. Nat Genet 26(3): 358-361
Wells RS, Yuldasheva N, Ruzibakiev R, Underhill PA, Evseeva I, Blue-Smith J, Jin L, Bing S,
Pitchappan R, Shanmugalakshmi S, Balakrishnan K, Read M, Pearson NM, Zerial T, Webster
MT, Zholoshvili I, Jamarjashvili E, Gambarov S, Nikbin B, Dostiev A, Aknazarov O, Zalloua P,
Tsoy I, Kitaev M, Mirrakhimov M, Chariev A, Bodmer WF (2001) The Eurasian heartland: a
continental perspective on Y-chromosome diversity. Proc Natl Acad Sci USA 98:10244-10249
Wilson I and Balding D (1998) Genealogical inference from microsatellite data. Genet 150:499-
510
41

Y Chromosome Consortium (2002) A nomenclature system for the tree of human Y-chromosomal binary haplogroups. Genome Res 12:339-348
Zhivotovsky LA, Underhill PA, Cinnioglu C, Kayser M, Morar B, Kivisild T, Scozzari R,Cruciani F, Destro-Bisol G, Spedini G, Chambers GK, Herrera RJ, Yong KK, Gresham D,Tournev I, Feldman MW and Kalaydjieva L (2004) The effective mutation rate at Y chromosomeshort tandem repeats, with application to human population-divergence time. Am J Hum Genet74:50-61
Zhivotovsky LA, Goldstein DB and Feldman MW (2001) Genetic sampling error of distance
(6 )2 and variation in mutation rate among microsatellite loci. Mol Biol Evol 18:2141-2145
42

APPENDIX
Figure Legends
Figure 1 Geographic distribution of major Y-chromosome haplogroup frequencies for the 32populations described in Table 1
Figure 2 Geographic distribution of Y-chromosome haplogroup frequencies in selected
populations (A) E clade, (B) J clade and (C) R clade
Figure 3 Maximum likelihood radial phylogeny based on Y-haplogroup frequency data from the
32 populations described in Table 1
Figure 4 Principal component analysis of Y-haplogroup frequency data from the 32 populationsdescribed in Table 1
Figure 5 Y-STR based principal component analysis of specific haplogroups based on 8
microsatellite loci (A) E3b3-M123 and (B) J1-M267
43
Recommended