VI, 2004 Page 1
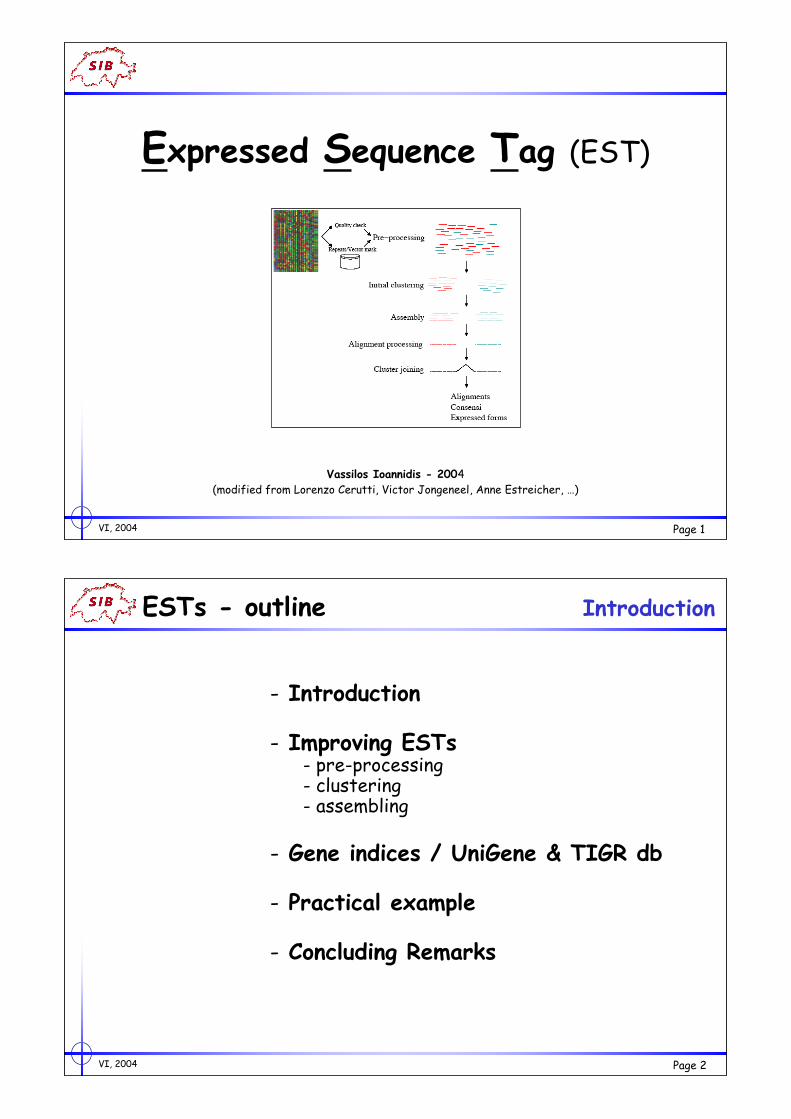
Expressed Sequence Tag (EST)
Vassilos Ioannidis - 2004
(modified from Lorenzo Cerutti, Victor Jongeneel, Anne Estreicher, …)
VI, 2004 Page 2
ESTs - outline Introduction
- Introduction
- Improving ESTs- pre-processing- clustering- assembling
- Gene indices / UniGene & TIGR db
- Practical example
- Concluding Remarks
VI, 2004 Page 3
«!Traditional!» sequencing
cDNA clones isolated on the basis of some functional property of interestto a group
EST sequencing
Large-scale sampling of end sequences of all cDNA clones present in alibrary
«!Full-length!» sequencing
Systematic attempts to obtain high-quality sequences of cDNA clonesrepresenting all transcribed genes
Transcriptome sequencing Introduction
VI, 2004 Page 4
What are ESTs Introduction
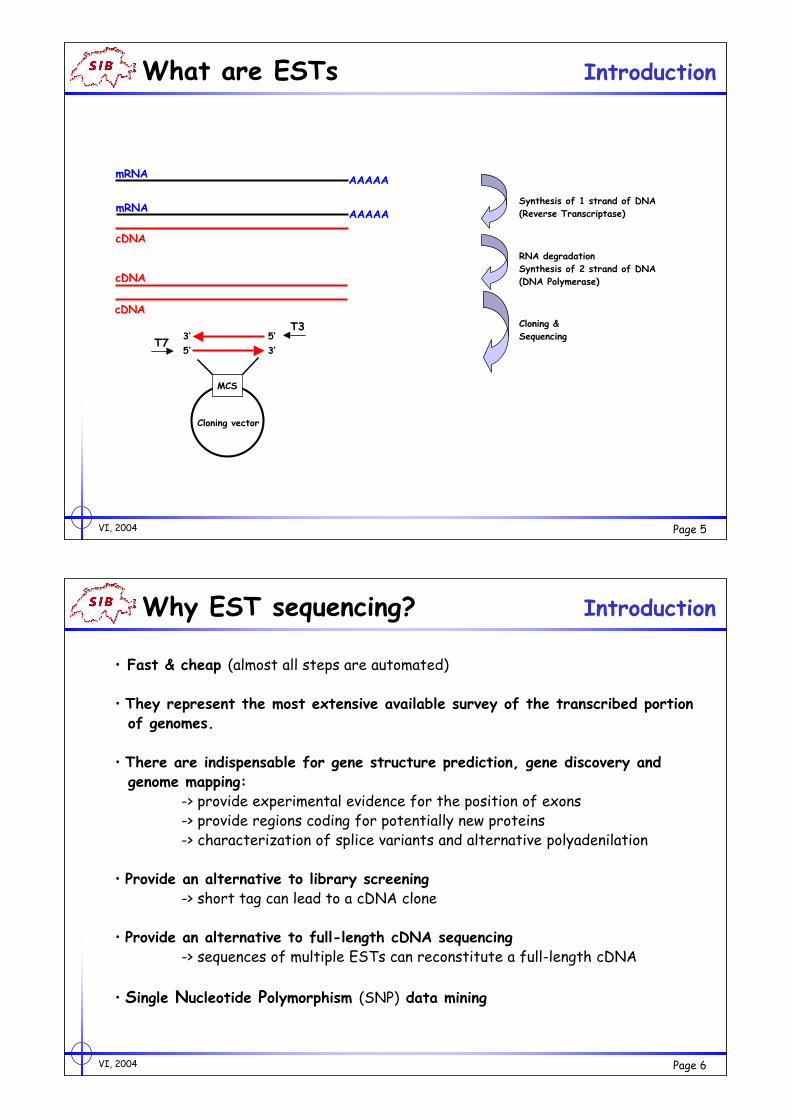
• cDNA libraries prepared from various organisms, tissues and cell lines
using directional cloning
• Gridding of individual clones using robots
• For each clone, single-pass sequencing of both ends (5’ and/or 3’) of insert
• Deposit readable part of sequence in database
• ESTs represent partial sequences of cDNA clones (300 bp -> 700 bp)
VI, 2004 Page 5
What are ESTs Introduction
mRNAAAAAA
mRNA
cDNA
AAAAASynthesis of 1 strand of DNA
(Reverse Transcriptase)
cDNA
cDNA
RNA degradation
Synthesis of 2 strand of DNA
(DNA Polymerase)
Cloning vector
MCS
5’ 3’
3’ 5’T3
T7
Cloning &
Sequencing
VI, 2004 Page 6
Why EST sequencing? Introduction
• Fast & cheap (almost all steps are automated)
• They represent the most extensive available survey of the transcribed portion of genomes.
• There are indispensable for gene structure prediction, gene discovery and genome mapping:
-> provide experimental evidence for the position of exons-> provide regions coding for potentially new proteins-> characterization of splice variants and alternative polyadenilation
• Provide an alternative to library screening-> short tag can lead to a cDNA clone
• Provide an alternative to full-length cDNA sequencing-> sequences of multiple ESTs can reconstitute a full-length cDNA
• Single Nucleotide Polymorphism (SNP) data mining
VI, 2004 Page 7
• Most are “native”, meaning that clone frequency reflects mRNA
abundance
• Most are primed with oligo(dT), meaning that 3’ ends are heavily
represented
• The complexity of libraries is extremely variable
• “Normalized” libraries are used to enrich for rare mRNAs
cDNA libraries Introduction
VI, 2004 Page 8
cDNA libraries used Introduction
• Large number of libraries represented
• Most libraries managed by the IMAGE consortium (http://image.llnl.gov/)
• Human & mouse libraries are the most abundantly represented:
• Many tissues still not sampled
• Quality very uneven
VI, 2004 Page 9
EST databases Introduction
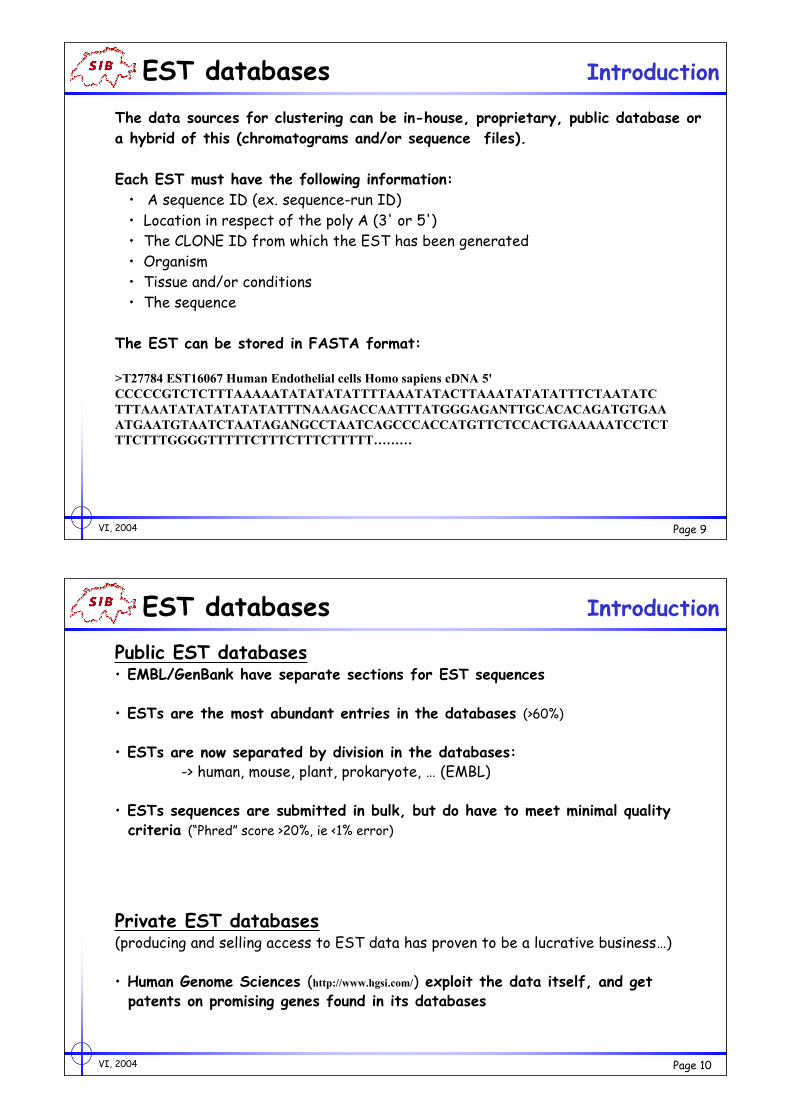
The data sources for clustering can be in-house, proprietary, public database or
a hybrid of this (chromatograms and/or sequence files).
Each EST must have the following information:
• A sequence ID (ex. sequence-run ID)
• Location in respect of the poly A (3' or 5')
• The CLONE ID from which the EST has been generated
• Organism
• Tissue and/or conditions
• The sequence
The EST can be stored in FASTA format:
>T27784 EST16067 Human Endothelial cells Homo sapiens cDNA 5'
CCCCCGTCTCTTTAAAAATATATATATTTTAAATATACTTAAATATATATTTCTAATATC
TTTAAATATATATATATATTTNAAAGACCAATTTATGGGAGANTTGCACACAGATGTGAA
ATGAATGTAATCTAATAGANGCCTAATCAGCCCACCATGTTCTCCACTGAAAAATCCTCT
TTCTTTGGGGTTTTTCTTTCTTTCTTTTT………
VI, 2004 Page 10
EST databases Introduction
Public EST databases• EMBL/GenBank have separate sections for EST sequences
• ESTs are the most abundant entries in the databases (>60%)
• ESTs are now separated by division in the databases:-> human, mouse, plant, prokaryote, … (EMBL)
• ESTs sequences are submitted in bulk, but do have to meet minimal quality criteria (“Phred” score >20%, ie <1% error)
Private EST databases(producing and selling access to EST data has proven to be a lucrative business…)
• Human Genome Sciences (http://www.hgsi.com/) exploit the data itself, and get patents on promising genes found in its databases
VI, 2004 Page 11
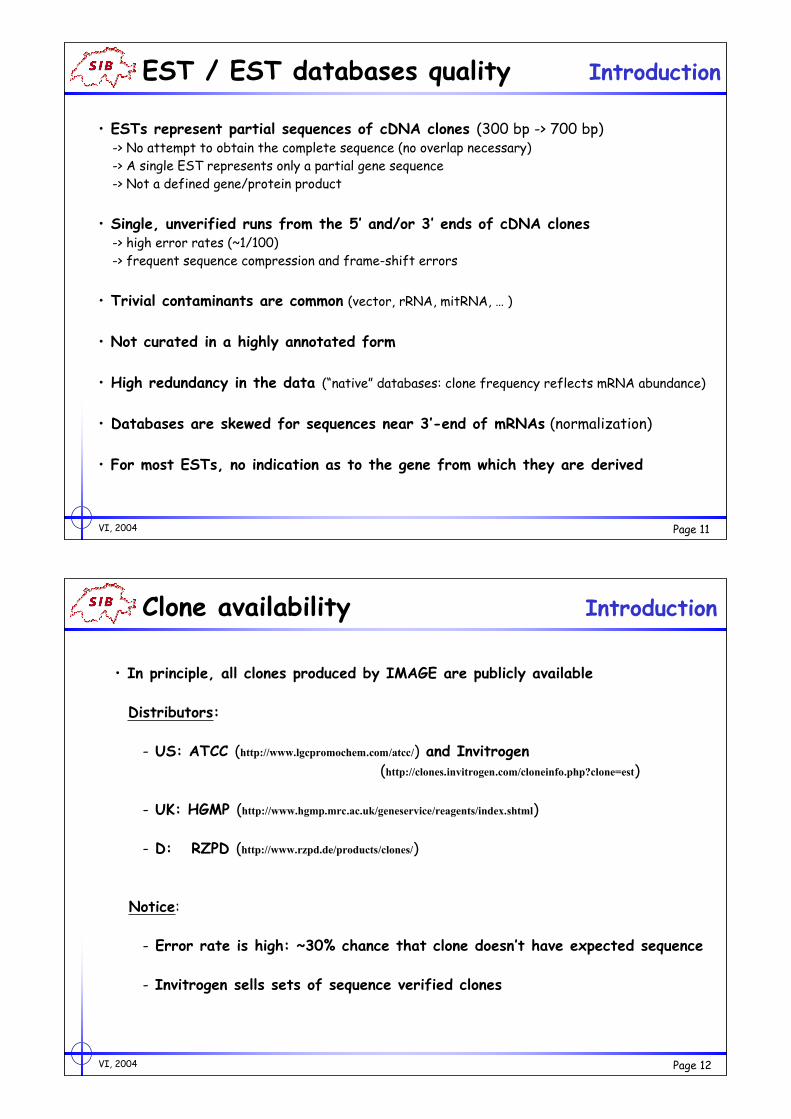
EST / EST databases quality Introduction
• ESTs represent partial sequences of cDNA clones (300 bp -> 700 bp)-> No attempt to obtain the complete sequence (no overlap necessary)
-> A single EST represents only a partial gene sequence
-> Not a defined gene/protein product
• Single, unverified runs from the 5’ and/or 3’ ends of cDNA clones-> high error rates (~1/100)
-> frequent sequence compression and frame-shift errors
• Trivial contaminants are common (vector, rRNA, mitRNA, … )
• Not curated in a highly annotated form
• High redundancy in the data (“native” databases: clone frequency reflects mRNA abundance)
• Databases are skewed for sequences near 3’-end of mRNAs (normalization)
• For most ESTs, no indication as to the gene from which they are derived
VI, 2004 Page 12
Clone availability Introduction
• In principle, all clones produced by IMAGE are publicly available
Distributors:
- US: ATCC (http://www.lgcpromochem.com/atcc/) and Invitrogen (http://clones.invitrogen.com/cloneinfo.php?clone=est)
- UK: HGMP (http://www.hgmp.mrc.ac.uk/geneservice/reagents/index.shtml)
- D: RZPD (http://www.rzpd.de/products/clones/)
Notice:
- Error rate is high: ~30% chance that clone doesn’t have expected sequence
- Invitrogen sells sets of sequence verified clones
VI, 2004 Page 13
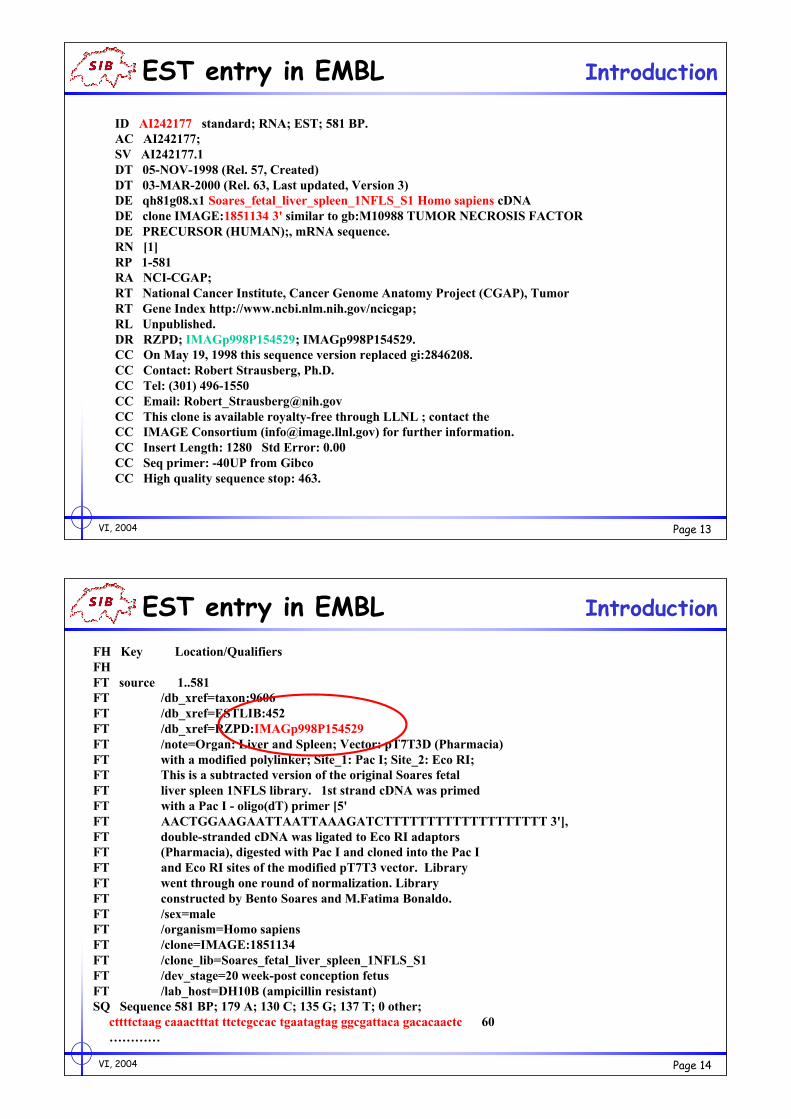
EST entry in EMBL Introduction
ID AI242177 standard; RNA; EST; 581 BP.
AC AI242177;
SV AI242177.1
DT 05-NOV-1998 (Rel. 57, Created)
DT 03-MAR-2000 (Rel. 63, Last updated, Version 3)
DE qh81g08.x1 Soares_fetal_liver_spleen_1NFLS_S1 Homo sapiens cDNA
DE clone IMAGE:1851134 3' similar to gb:M10988 TUMOR NECROSIS FACTOR
DE PRECURSOR (HUMAN);, mRNA sequence.
RN [1]
RP 1-581
RA NCI-CGAP;
RT National Cancer Institute, Cancer Genome Anatomy Project (CGAP), Tumor
RT Gene Index http://www.ncbi.nlm.nih.gov/ncicgap;
RL Unpublished.
DR RZPD; IMAGp998P154529; IMAGp998P154529.
CC On May 19, 1998 this sequence version replaced gi:2846208.
CC Contact: Robert Strausberg, Ph.D.
CC Tel: (301) 496-1550
CC Email: [email protected]
CC This clone is available royalty-free through LLNL ; contact the
CC IMAGE Consortium ([email protected]) for further information.
CC Insert Length: 1280 Std Error: 0.00
CC Seq primer: -40UP from Gibco
CC High quality sequence stop: 463.
VI, 2004 Page 14
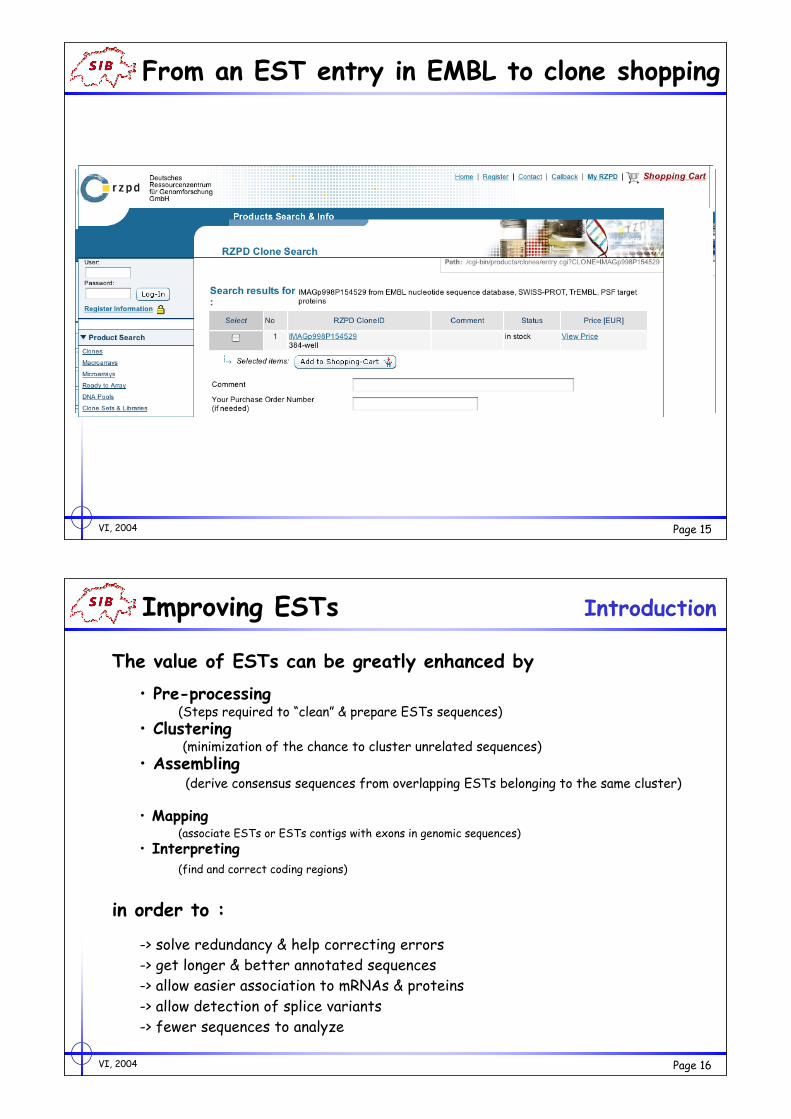
EST entry in EMBL Introduction
FH Key Location/Qualifiers
FH
FT source 1..581
FT /db_xref=taxon:9606
FT /db_xref=ESTLIB:452
FT /db_xref=RZPD:IMAGp998P154529
FT /note=Organ: Liver and Spleen; Vector: pT7T3D (Pharmacia)
FT with a modified polylinker; Site_1: Pac I; Site_2: Eco RI;
FT This is a subtracted version of the original Soares fetal
FT liver spleen 1NFLS library. 1st strand cDNA was primed
FT with a Pac I - oligo(dT) primer [5'
FT AACTGGAAGAATTAATTAAAGATCTTTTTTTTTTTTTTTTTTT 3'],
FT double-stranded cDNA was ligated to Eco RI adaptors
FT (Pharmacia), digested with Pac I and cloned into the Pac I
FT and Eco RI sites of the modified pT7T3 vector. Library
FT went through one round of normalization. Library
FT constructed by Bento Soares and M.Fatima Bonaldo.
FT /sex=male
FT /organism=Homo sapiens
FT /clone=IMAGE:1851134
FT /clone_lib=Soares_fetal_liver_spleen_1NFLS_S1
FT /dev_stage=20 week-post conception fetus
FT /lab_host=DH10B (ampicillin resistant)
SQ Sequence 581 BP; 179 A; 130 C; 135 G; 137 T; 0 other;
cttttctaag caaactttat ttctcgccac tgaatagtag ggcgattaca gacacaactc 60
…………
VI, 2004 Page 15
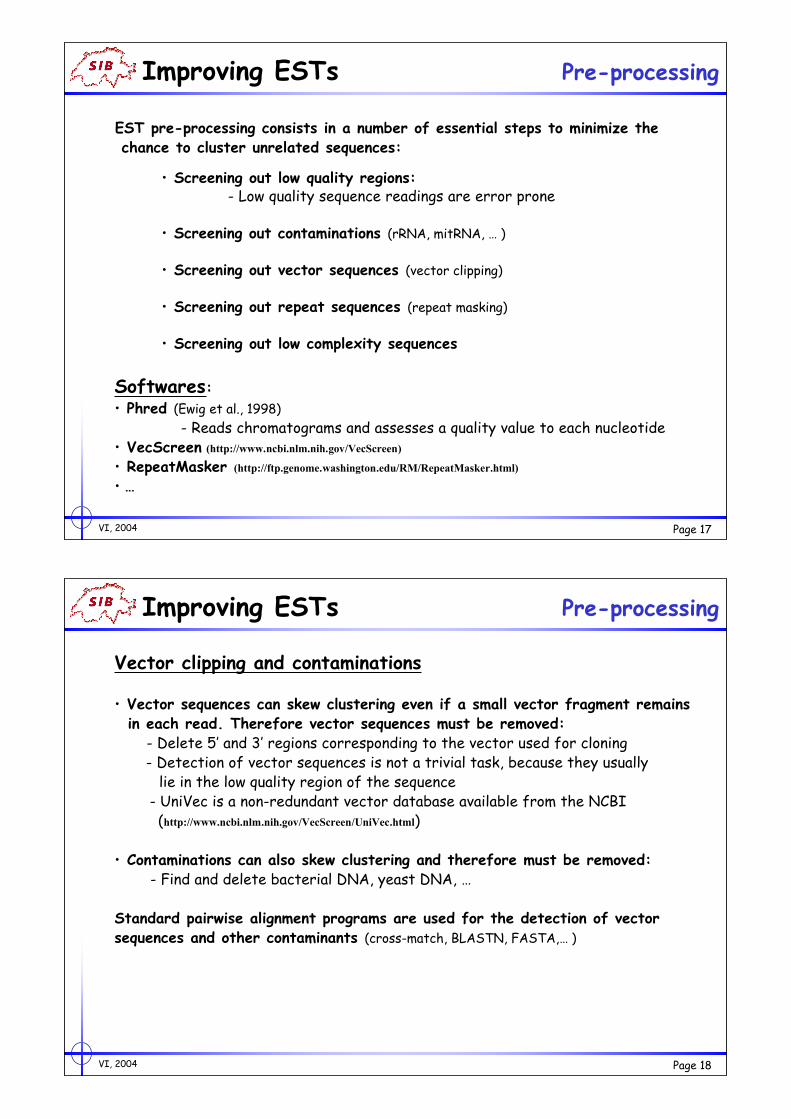
From an EST entry in EMBL to clone shopping
VI, 2004 Page 16
Improving ESTs Introduction
The value of ESTs can be greatly enhanced by
• Pre-processing(Steps required to “clean” & prepare ESTs sequences)
• Clustering (minimization of the chance to cluster unrelated sequences)
• Assembling (derive consensus sequences from overlapping ESTs belonging to the same cluster)
• Mapping(associate ESTs or ESTs contigs with exons in genomic sequences)
• Interpreting(find and correct coding regions)
in order to :
-> solve redundancy & help correcting errors
-> get longer & better annotated sequences
-> allow easier association to mRNAs & proteins
-> allow detection of splice variants
-> fewer sequences to analyze
VI, 2004 Page 17
Improving ESTs Pre-processing
EST pre-processing consists in a number of essential steps to minimize the chance to cluster unrelated sequences:
• Screening out low quality regions:- Low quality sequence readings are error prone
• Screening out contaminations (rRNA, mitRNA, … )
• Screening out vector sequences (vector clipping)
• Screening out repeat sequences (repeat masking)
• Screening out low complexity sequences
Softwares:• Phred (Ewig et al., 1998)
- Reads chromatograms and assesses a quality value to each nucleotide• VecScreen (http://www.ncbi.nlm.nih.gov/VecScreen)
• RepeatMasker (http://ftp.genome.washington.edu/RM/RepeatMasker.html)
• …
VI, 2004 Page 18
Improving ESTs Pre-processing
Vector clipping and contaminations
• Vector sequences can skew clustering even if a small vector fragment remains in each read. Therefore vector sequences must be removed: - Delete 5’ and 3’ regions corresponding to the vector used for cloning - Detection of vector sequences is not a trivial task, because they usually lie in the low quality region of the sequence - UniVec is a non-redundant vector database available from the NCBI (http://www.ncbi.nlm.nih.gov/VecScreen/UniVec.html)
• Contaminations can also skew clustering and therefore must be removed: - Find and delete bacterial DNA, yeast DNA, …
Standard pairwise alignment programs are used for the detection of vectorsequences and other contaminants (cross-match, BLASTN, FASTA,… )
VI, 2004 Page 19
Improving ESTs Pre-processing
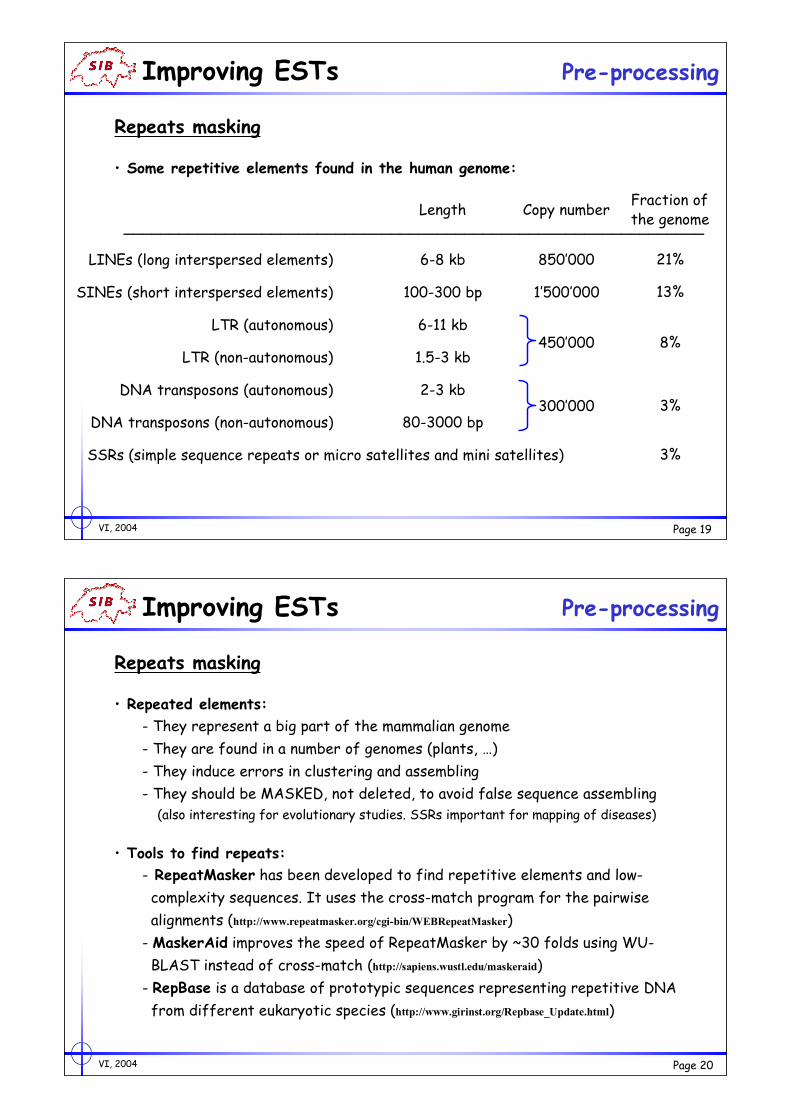
Repeats masking
• Some repetitive elements found in the human genome:
LINEs (long interspersed elements) 6-8 kb 850’000 21%
SINEs (short interspersed elements) 100-300 bp 1’500’000 13%
_______________________________________________________________Length Copy number
Fraction ofthe genome
LTR (autonomous) 6-11 kb
LTR (non-autonomous) 1.5-3 kb450’000 8%
DNA transposons (autonomous) 2-3 kb
DNA transposons (non-autonomous) 80-3000 bp300’000 3%
SSRs (simple sequence repeats or micro satellites and mini satellites) 3%
VI, 2004 Page 20
Improving ESTs Pre-processing
Repeats masking
• Repeated elements:
- They represent a big part of the mammalian genome
- They are found in a number of genomes (plants, …)
- They induce errors in clustering and assembling
- They should be MASKED, not deleted, to avoid false sequence assembling
(also interesting for evolutionary studies. SSRs important for mapping of diseases)
• Tools to find repeats:
- RepeatMasker has been developed to find repetitive elements and low-
complexity sequences. It uses the cross-match program for the pairwise
alignments (http://www.repeatmasker.org/cgi-bin/WEBRepeatMasker)
- MaskerAid improves the speed of RepeatMasker by ~30 folds using WU-
BLAST instead of cross-match (http://sapiens.wustl.edu/maskeraid)
- RepBase is a database of prototypic sequences representing repetitive DNA
from different eukaryotic species (http://www.girinst.org/Repbase_Update.html)
VI, 2004 Page 21
Improving ESTs Pre-processing
Low complexity masking
• Low complexity sequences contain an important bias in their nucleotide compositions (poly A tracts, AT repeats, etc.)
• Low complexity regions can provide an artifactual basis for cluster membership
• Clustering strategies employing alignable similarity in their first pass are very
sensitive to low complexity sequences
• Some clustering strategies are insensitive to low complexity sequences, because
they weight sequences in respect to their information content (ex. d2-cluster).
• Programs as DUST (NCBI) can be used to mask low complexity regions
VI, 2004 Page 22
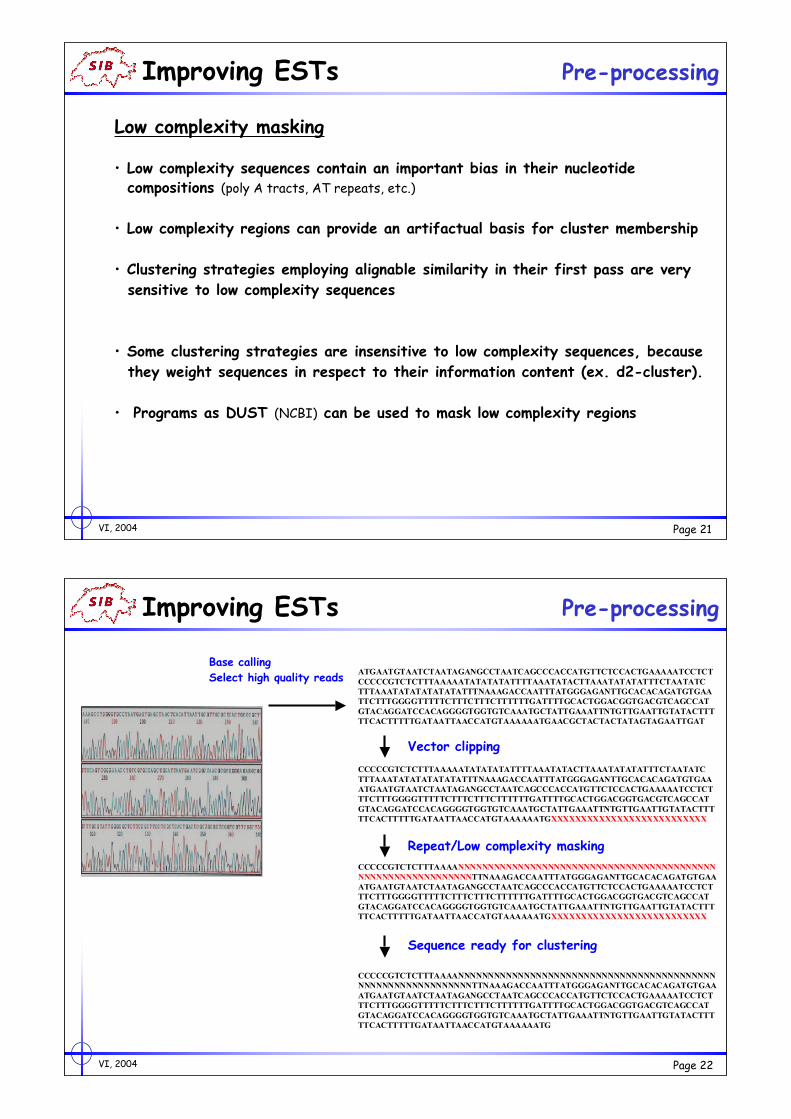
Improving ESTs Pre-processing
ATGAATGTAATCTAATAGANGCCTAATCAGCCCACCATGTTCTCCACTGAAAAATCCTCT
CCCCCGTCTCTTTAAAAATATATATATTTTAAATATACTTAAATATATATTTCTAATATC
TTTAAATATATATATATATTTNAAAGACCAATTTATGGGAGANTTGCACACAGATGTGAA
TTCTTTGGGGTTTTTCTTTCTTTCTTTTTTGATTTTGCACTGGACGGTGACGTCAGCCAT
GTACAGGATCCACAGGGGTGGTGTCAAATGCTATTGAAATTNTGTTGAATTGTATACTTT
TTCACTTTTTGATAATTAACCATGTAAAAAATGAACGCTACTACTATAGTAGAATTGAT
Base calling
Select high quality reads
Vector clipping
CCCCCGTCTCTTTAAAAATATATATATTTTAAATATACTTAAATATATATTTCTAATATC
TTTAAATATATATATATATTTNAAAGACCAATTTATGGGAGANTTGCACACAGATGTGAA
ATGAATGTAATCTAATAGANGCCTAATCAGCCCACCATGTTCTCCACTGAAAAATCCTCT
TTCTTTGGGGTTTTTCTTTCTTTCTTTTTTGATTTTGCACTGGACGGTGACGTCAGCCAT
GTACAGGATCCACAGGGGTGGTGTCAAATGCTATTGAAATTNTGTTGAATTGTATACTTT
TTCACTTTTTGATAATTAACCATGTAAAAAATGXXXXXXXXXXXXXXXXXXXXXXXXXX
Repeat/Low complexity masking
CCCCCGTCTCTTTAAAANNNNNNNNNNNNNNNNNNNNNNNNNNNNNNNNNNNNNNNNNNN
NNNNNNNNNNNNNNNNNNNTTNAAAGACCAATTTATGGGAGANTTGCACACAGATGTGAA
ATGAATGTAATCTAATAGANGCCTAATCAGCCCACCATGTTCTCCACTGAAAAATCCTCT
TTCTTTGGGGTTTTTCTTTCTTTCTTTTTTGATTTTGCACTGGACGGTGACGTCAGCCAT
GTACAGGATCCACAGGGGTGGTGTCAAATGCTATTGAAATTNTGTTGAATTGTATACTTT
TTCACTTTTTGATAATTAACCATGTAAAAAATGXXXXXXXXXXXXXXXXXXXXXXXXXX
Sequence ready for clustering
CCCCCGTCTCTTTAAAANNNNNNNNNNNNNNNNNNNNNNNNNNNNNNNNNNNNNNNNNNN
NNNNNNNNNNNNNNNNNNNTTNAAAGACCAATTTATGGGAGANTTGCACACAGATGTGAA
ATGAATGTAATCTAATAGANGCCTAATCAGCCCACCATGTTCTCCACTGAAAAATCCTCT
TTCTTTGGGGTTTTTCTTTCTTTCTTTTTTGATTTTGCACTGGACGGTGACGTCAGCCAT
GTACAGGATCCACAGGGGTGGTGTCAAATGCTATTGAAATTNTGTTGAATTGTATACTTT
TTCACTTTTTGATAATTAACCATGTAAAAAATG
VI, 2004 Page 23
Improving ESTs Clustering
EST clustering consists in incorporating overlapping ESTs which tag the sameTranscript of the same gene in a single cluster
For clustering, we measure the similarity (distance) between any 2 sequences.The distance is then reduced to a simple binary value:
- accept or reject two sequences in the same cluster
Similarity can be measured using different algorithms:
• Pairwise alignment algorithms:
Smith-Waterman is the most sensitive, but time consuming (ex. cross-match);
Heuristic algorithms, as BLAST and FASTA, trade some sensitivity for speed.
• Non-alignment based scoring methods:
d2-cluster algorithm: based on word comparison and composition (word identity
and multiplicity) (Burke et al., 99). No alignments are performed ) fast.
VI, 2004 Page 24
Improving ESTs Clustering
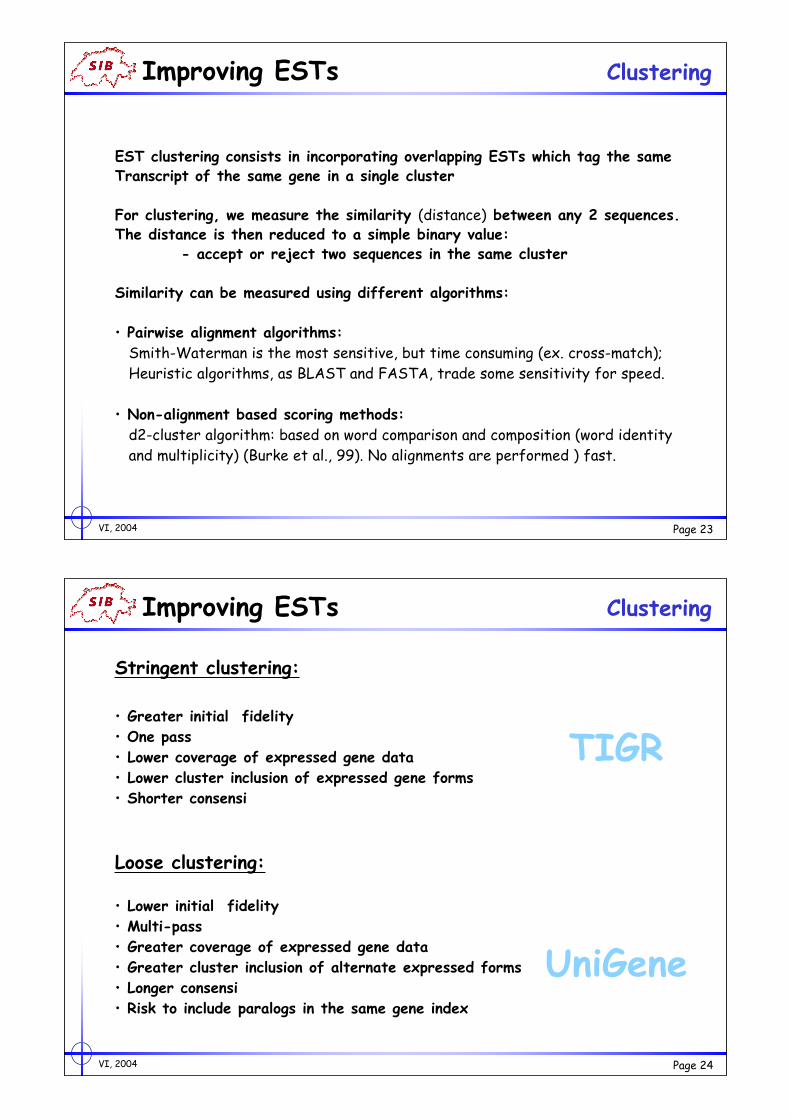
Stringent clustering:
• Greater initial fidelity
• One pass
• Lower coverage of expressed gene data
• Lower cluster inclusion of expressed gene forms
• Shorter consensi
Loose clustering:
• Lower initial fidelity
• Multi-pass
• Greater coverage of expressed gene data
• Greater cluster inclusion of alternate expressed forms
• Longer consensi
• Risk to include paralogs in the same gene index
TIGR
UniGene
VI, 2004 Page 25
Improving ESTs Clustering
Supervised clustering• ESTs are classified with respect to known reference sequences or "seeds" (full
length mRNAs, exon constructs from genomic sequences, previously assembled
EST cluster consensus)
Unsupervised clustering• ESTs are classified without any prior knowledge (“ab initio”)
The two major gene indices use different EST clustering methods:• TIGR Gene Index uses a stringent and supervised clustering method, which
generates shorter consensus sequences and separates splice variants
• A combination of supervised and unsupervised methods with variable levels of
stringency is used in UniGene. No consensus sequences are produced
VI, 2004 Page 26
Improving ESTs Assembling
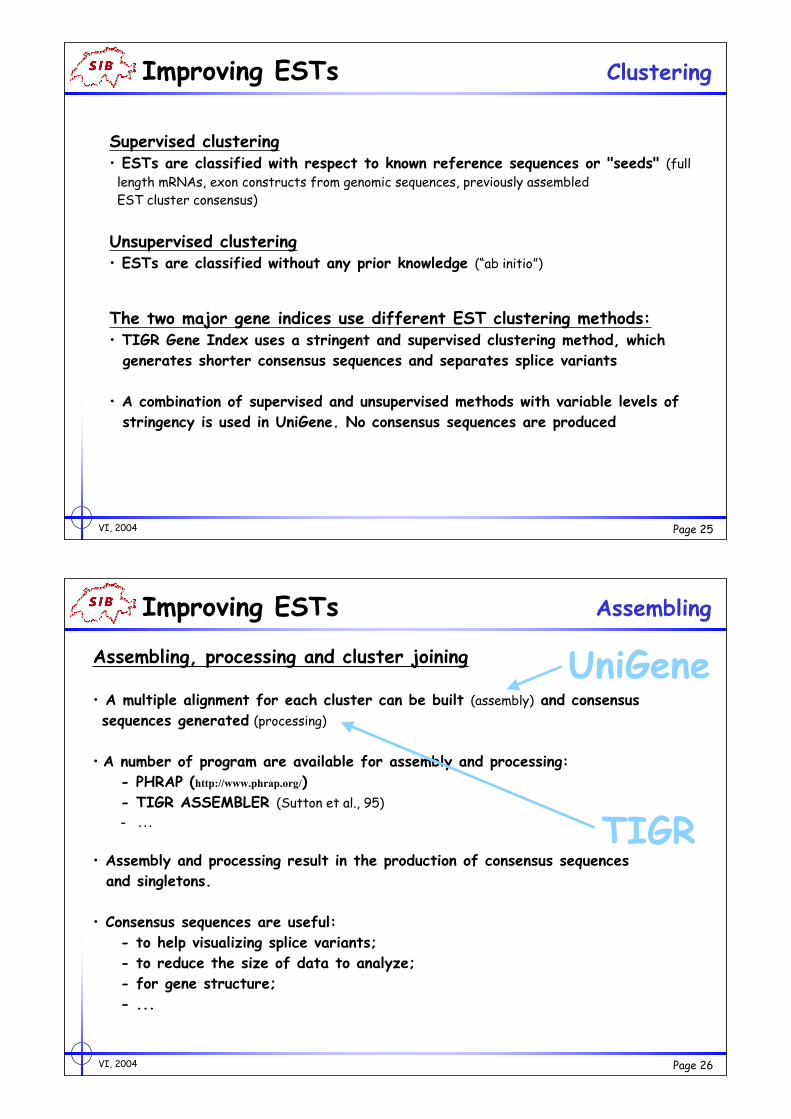
Assembling, processing and cluster joining
• A multiple alignment for each cluster can be built (assembly) and consensus
sequences generated (processing)
• A number of program are available for assembly and processing:
- PHRAP (http://www.phrap.org/)
- TIGR ASSEMBLER (Sutton et al., 95)
- …
• Assembly and processing result in the production of consensus sequences
and singletons.
• Consensus sequences are useful:
- to help visualizing splice variants;
- to reduce the size of data to analyze;
- for gene structure;
- ...
UniGene
TIGR
VI, 2004 Page 27
Improving ESTs Assembling
Assembly &
Processing
Joining
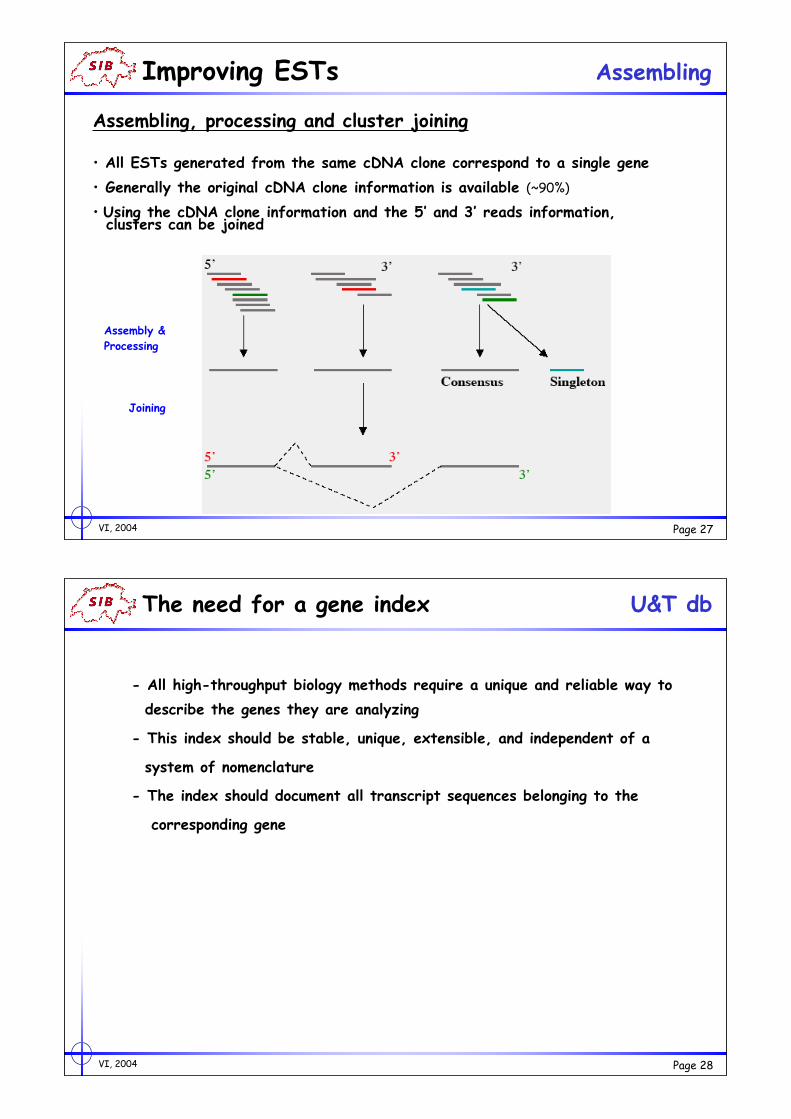
Assembling, processing and cluster joining
• All ESTs generated from the same cDNA clone correspond to a single gene
• Generally the original cDNA clone information is available (~90%)
• Using the cDNA clone information and the 5’ and 3’ reads information, clusters can be joined
VI, 2004 Page 28
The need for a gene index U&T db
- All high-throughput biology methods require a unique and reliable way to
describe the genes they are analyzing
- This index should be stable, unique, extensible, and independent of a
system of nomenclature
- The index should document all transcript sequences belonging to the
corresponding gene
VI, 2004 Page 29
Some commonly used gene indices U&T db
• EMBL/GenBank/DDBJ accession numbers
• Unique and universally accepted BUT
• Highly redundant (many entries per gene)
• Unigene cluster identifiers (NCBI)
• Widely used and non-redundant BUT
• Rely on clustering procedure (unreliable) AND
• Unstable – clusters change with each build
• RefSeq accession numbers (NCBI)
• Stable and non-redundant BUT
• Still very far from comprehensive AND
• Many RefSeq sequences are incomplete AND
• Splice variants are not systematically documented
VI, 2004 Page 30
Indices: The Unigene database U&T db
VI, 2004 Page 31
Indices: The Unigene database U&T db
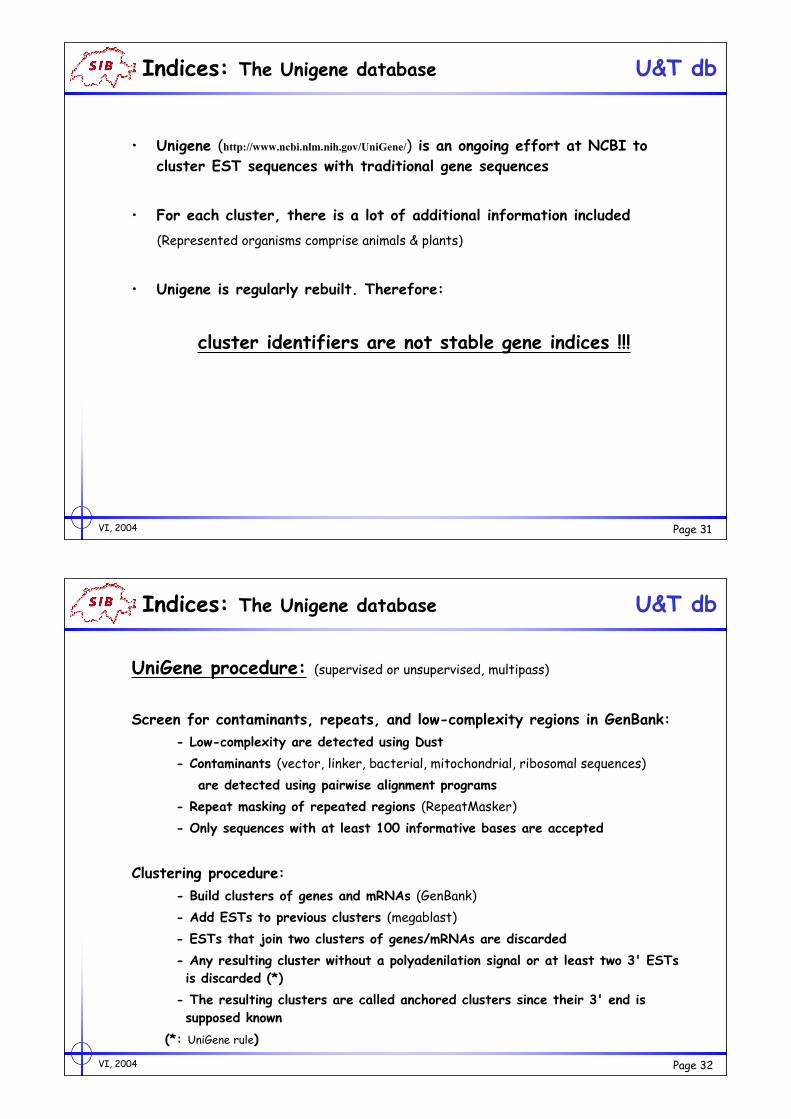
• Unigene (http://www.ncbi.nlm.nih.gov/UniGene/) is an ongoing effort at NCBI to
cluster EST sequences with traditional gene sequences
• For each cluster, there is a lot of additional information included
(Represented organisms comprise animals & plants)
• Unigene is regularly rebuilt. Therefore:
cluster identifiers are not stable gene indices !!!
VI, 2004 Page 32
Indices: The Unigene database U&T db
UniGene procedure: (supervised or unsupervised, multipass)
Screen for contaminants, repeats, and low-complexity regions in GenBank:
- Low-complexity are detected using Dust
- Contaminants (vector, linker, bacterial, mitochondrial, ribosomal sequences)
are detected using pairwise alignment programs
- Repeat masking of repeated regions (RepeatMasker)
- Only sequences with at least 100 informative bases are accepted
Clustering procedure:
- Build clusters of genes and mRNAs (GenBank)
- Add ESTs to previous clusters (megablast)
- ESTs that join two clusters of genes/mRNAs are discarded
- Any resulting cluster without a polyadenilation signal or at least two 3' ESTs
is discarded (*)
- The resulting clusters are called anchored clusters since their 3' end is
supposed known
(*: UniGene rule)
VI, 2004 Page 33
Indices: The Unigene database U&T db
UniGene procedure:
Ensures that the 5' and 3' ESTs from the same cDNA clone belongs to the
same cluster
ESTs that have not been clustered, are reprocessed with lower level of
stringency
ESTs added during this step are called guest members
Clusters of size 1 (containing a single sequence) are compared against the
rest of the clusters with a lower level of stringency and merged with the
cluster containing the most similar sequence
For each build of the database, clusters IDs change if clusters are split or
merged.
VI, 2004 Page 34
Indices: The TIGR database U&T db
VI, 2004 Page 35
Indices: The TIGR database U&T db
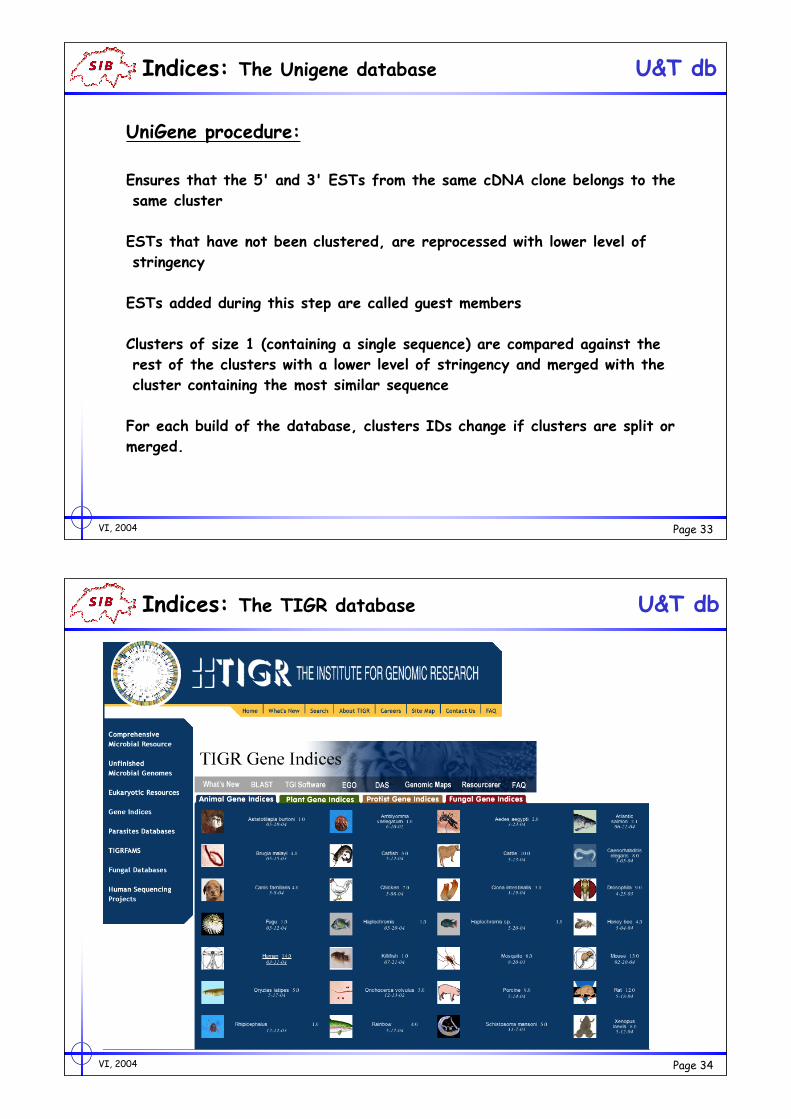
TIGR produces Gene Indices for a number of organisms (http://www.tigr.org/tdb/tgi).
TIGR Gene Indices are produced using stringent supervised clustering methods
Clusters are assembled in consensus sequences, called tentative consensus (TC)
sequences, that represent the underlying mRNA transcripts
The TIGR Gene Indices building method tightly groups highly related
sequences and discard under-represented, divergent, or noisy sequences
TIGR Gene Indices characteristics:
- separate closely related genes into distinct consensus sequences;
- separate splice variants into separate clusters;
- low level of contamination.
TC sequences can be used for genome annotation, genome mapping, and
identification of orthologs/paralogs genes
VI, 2004 Page 36
Indices: The TIGR database U&T db
TIGR procedure: (supervised, stringent)
EST sequences recovered form dbEST (http://www.ncbi.nlm.nih.gov/dbEST);
Sequences are trimmed to remove:– vectors
– polyA/T tails
– adaptor sequences
– bacterial sequences
Get expressed transcripts (ETs) from EGAD (http://www.tigr.org/tdb/egad/egad.shtml)– EGAD (Expressed Gene Anatomy Database) is based on mRNA and CDS (coding sequences)
from GenBank
Get TCs and singletons from previous database build
Supervised and strict clustering– Use ETs, TCs, and CDSs as seed;
– Compare cleaned ESTs to the template using FLAST (a rapid pairwise comparison
– program).
– Sequences are grouped in the same cluster if these conditions are true:
• a minimum of 40 base pair match
• greater than 94% identity in the overlap region
• a maximum unmatched overhang of 30 base pairs
VI, 2004 Page 37
Indices: The TIGR database U&T db
TIGR procedure:
Each cluster is assembled using CAP3 assembling program to produce tentative
consensus (TC) sequences.– CAP3 can generate multiple consensus sequences for each cluster
– CAP3 rejects chimeric, low-quality and non-overlapping sequences
– New TCs resulting from the joining or splitting of previous TCs, get a new TC ID
Build TCs are loaded in the TIGR Gene Indices database and annotated using
information from GenBank and/or protein homology.
Track of the old TC IDs is maintained through a relational database.
References:– Quackenbush et al. (2000) Nucleic Acid Research,28, 141-145.
– Quackenbush et al. (2001) Nucleic Acid Research,29, 159-164.
VI, 2004 Page 38
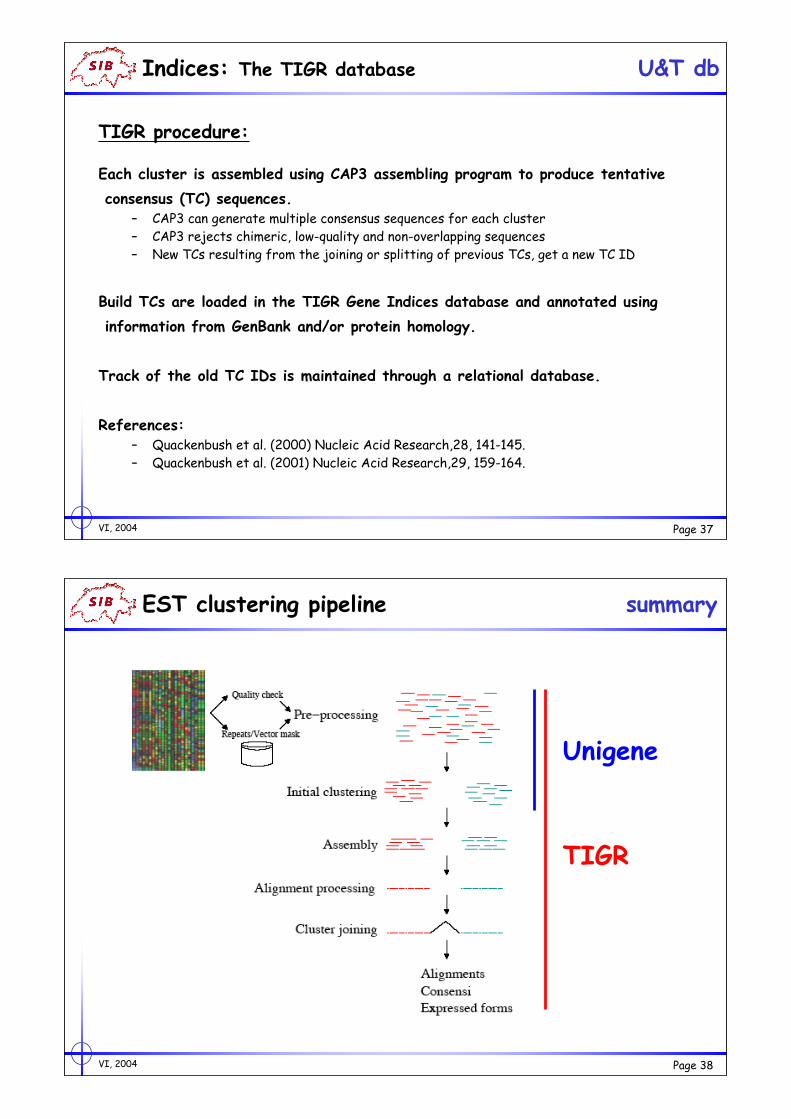
EST clustering pipeline summary
Unigene
TIGR
VI, 2004 Page 39
“In house” databases summary
trEST
trEST is an attempt to produce contigs from UniGene clusters and to translate them into proteins.This is a two-step process:
-assembly of contigs from a collection of ESTs
-translation of the assembled contigs into protein
Hence, it must be stressed that trEST entries are NOT real protein sequences. They are
hypothetical and are known to contain errors. These data are provided because they might help
biologists to find which UniGene cluster(s) may be relevant for their work.
Unigene
TIGRIn house
VI, 2004 Page 40
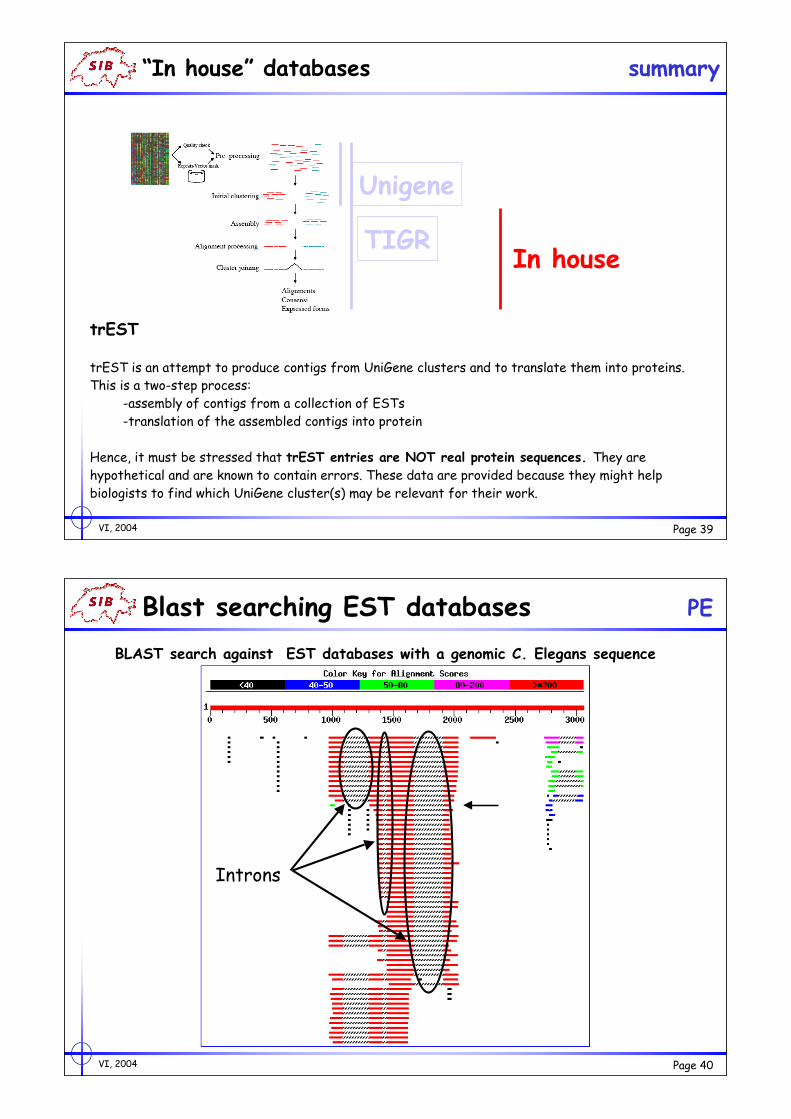
Blast searching EST databases PE
BLAST search against EST databases with a genomic C. Elegans sequence
Introns
VI, 2004 Page 41
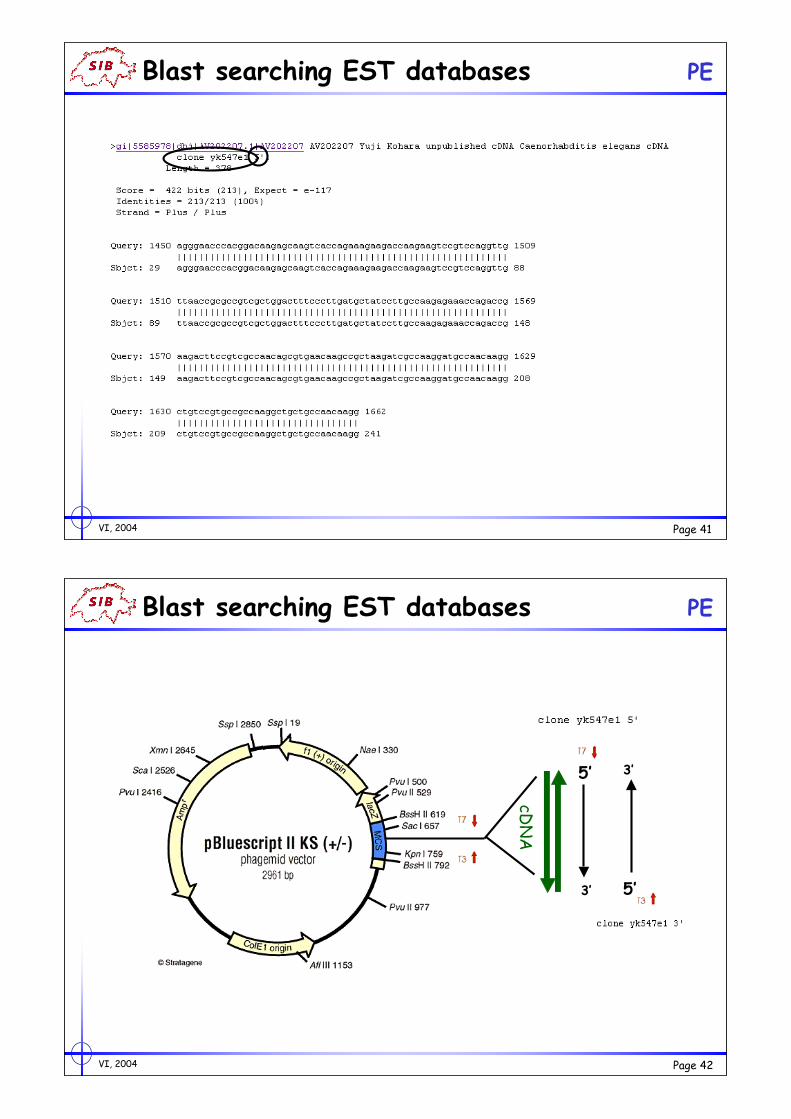
Blast searching EST databases PE
VI, 2004 Page 42
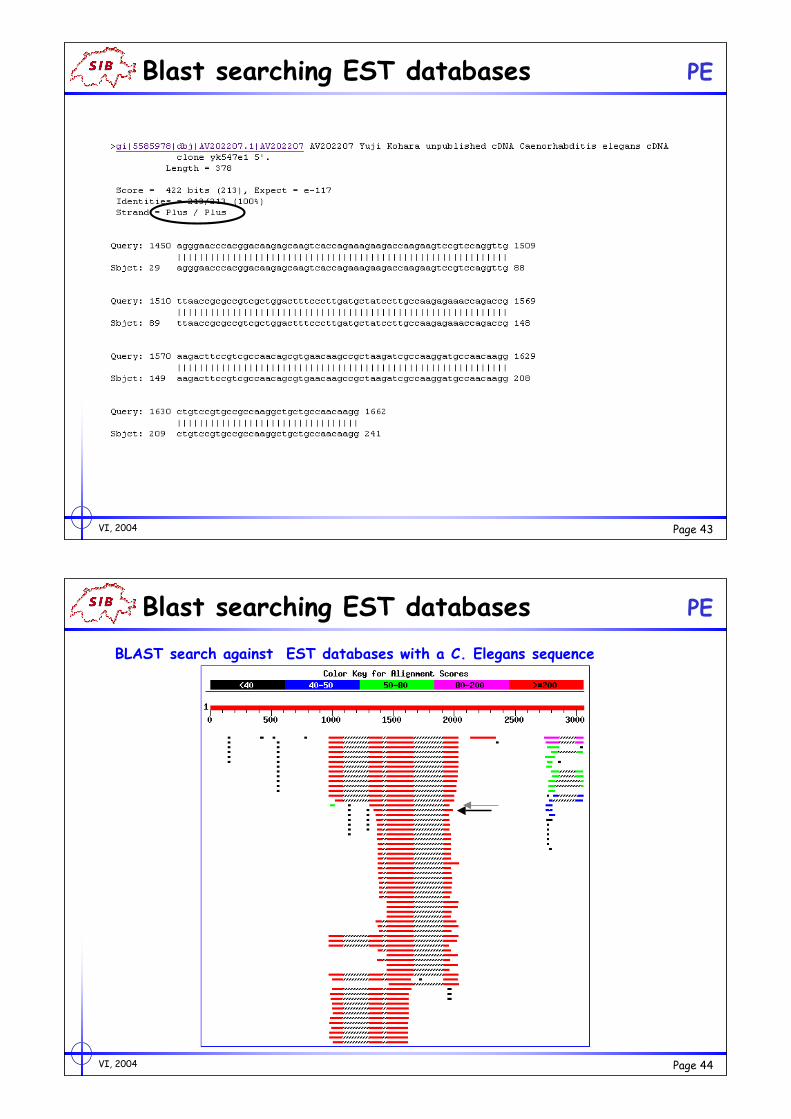
cDN
A
3’
5’ 3’
5’
Blast searching EST databases PE
VI, 2004 Page 43
Blast searching EST databases PE
VI, 2004 Page 44
Blast searching EST databases PE
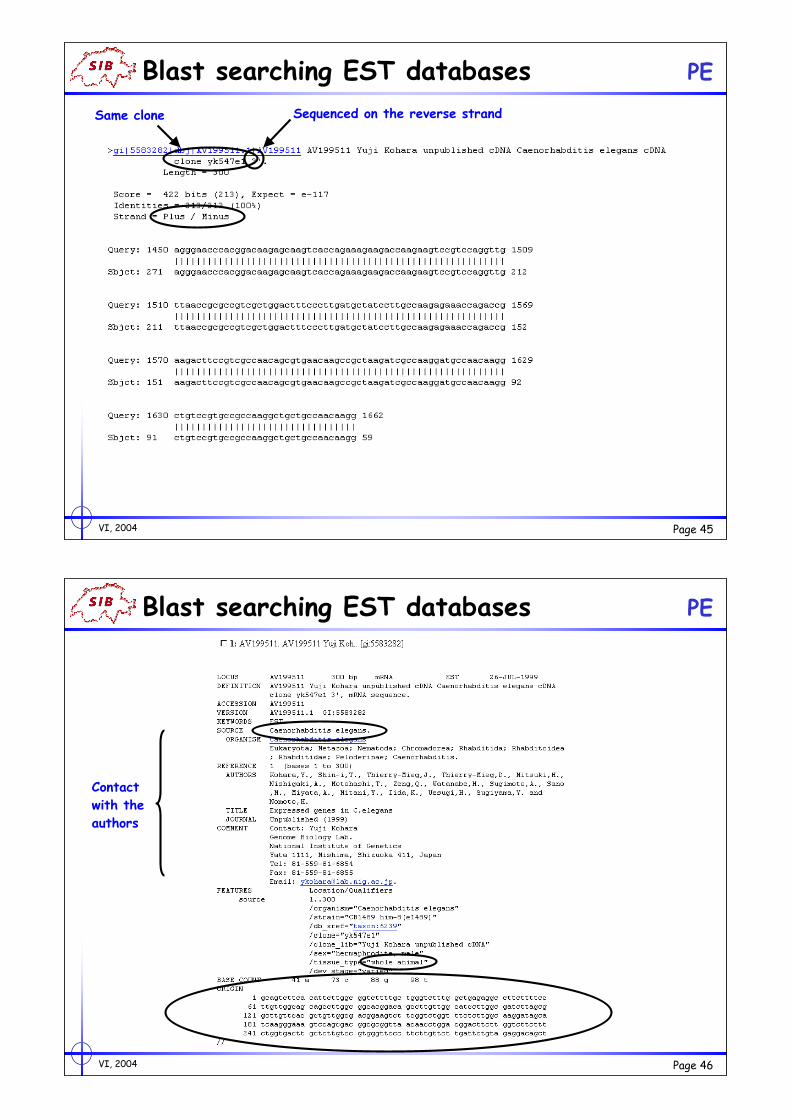
BLAST search against EST databases with a C. Elegans sequence
VI, 2004 Page 45
Blast searching EST databases PE
Same clone Sequenced on the reverse strand
VI, 2004 Page 46
Contact
with the
authors
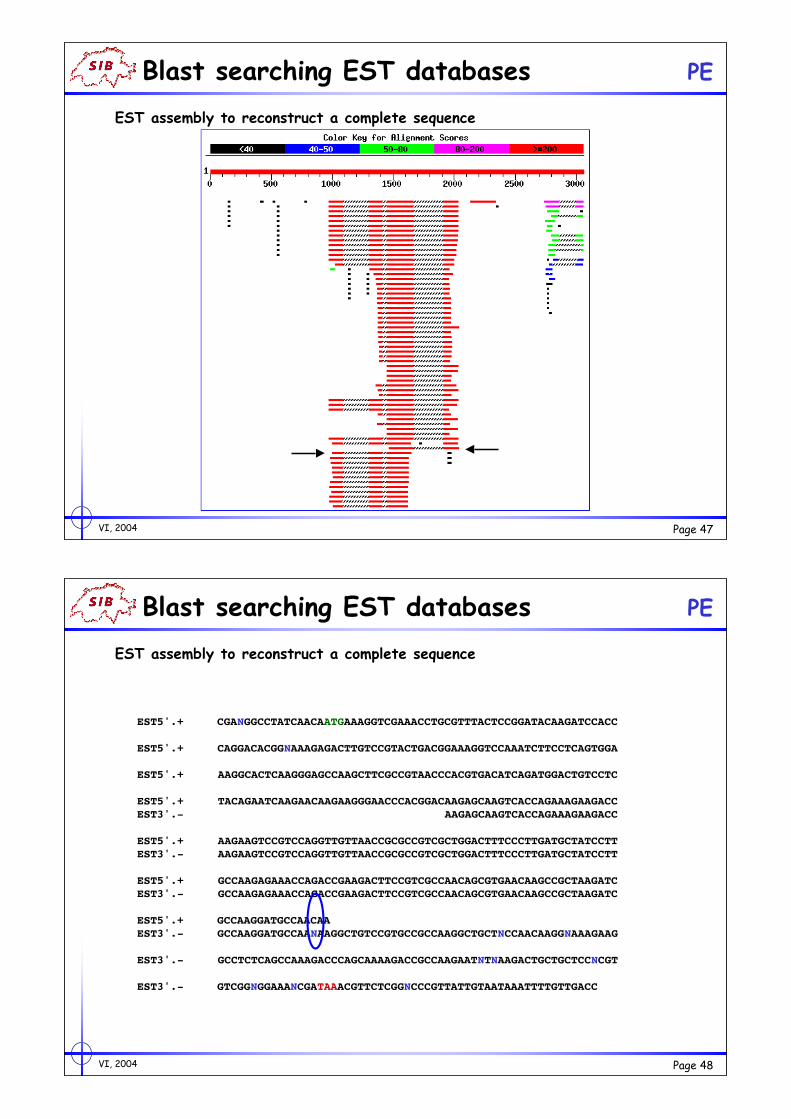
Blast searching EST databases PE
VI, 2004 Page 47
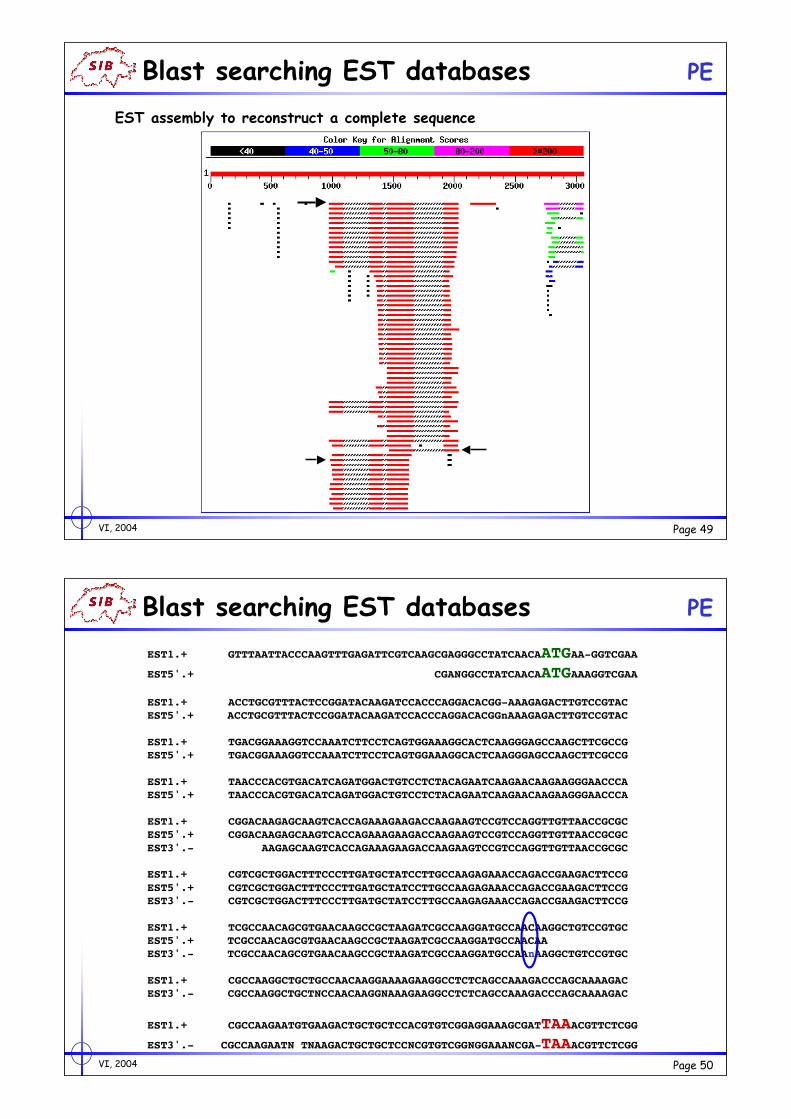
Blast searching EST databases PE
EST assembly to reconstruct a complete sequence
VI, 2004 Page 48
EST5'.+ CGANGGCCTATCAACAATGAAAGGTCGAAACCTGCGTTTACTCCGGATACAAGATCCACC
EST5'.+ CAGGACACGGNAAAGAGACTTGTCCGTACTGACGGAAAGGTCCAAATCTTCCTCAGTGGA
EST5'.+ AAGGCACTCAAGGGAGCCAAGCTTCGCCGTAACCCACGTGACATCAGATGGACTGTCCTC
EST5'.+ TACAGAATCAAGAACAAGAAGGGAACCCACGGACAAGAGCAAGTCACCAGAAAGAAGACC
EST3'.- AAGAGCAAGTCACCAGAAAGAAGACC
EST5'.+ AAGAAGTCCGTCCAGGTTGTTAACCGCGCCGTCGCTGGACTTTCCCTTGATGCTATCCTT
EST3'.- AAGAAGTCCGTCCAGGTTGTTAACCGCGCCGTCGCTGGACTTTCCCTTGATGCTATCCTT
EST5'.+ GCCAAGAGAAACCAGACCGAAGACTTCCGTCGCCAACAGCGTGAACAAGCCGCTAAGATC
EST3'.- GCCAAGAGAAACCAGACCGAAGACTTCCGTCGCCAACAGCGTGAACAAGCCGCTAAGATC
EST5'.+ GCCAAGGATGCCAACAA
EST3'.- GCCAAGGATGCCAANAAGGCTGTCCGTGCCGCCAAGGCTGCTNCCAACAAGGNAAAGAAG
EST3'.- GCCTCTCAGCCAAAGACCCAGCAAAAGACCGCCAAGAATNTNAAGACTGCTGCTCCNCGT
EST3'.- GTCGGNGGAAANCGATAAACGTTCTCGGNCCCGTTATTGTAATAAATTTTGTTGACC
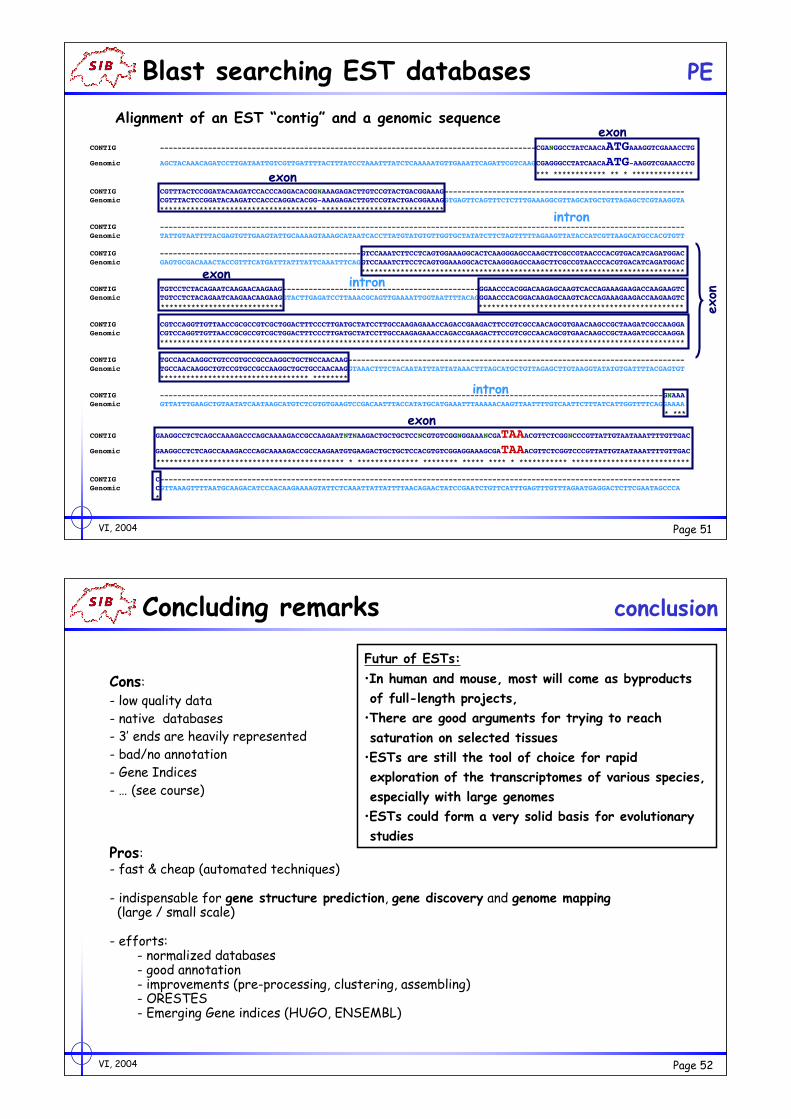
Blast searching EST databases PE
EST assembly to reconstruct a complete sequence
VI, 2004 Page 49
Blast searching EST databases PE
EST assembly to reconstruct a complete sequence
VI, 2004 Page 50
EST1.+ GTTTAATTACCCAAGTTTGAGATTCGTCAAGCGAGGGCCTATCAACAATGAA-GGTCGAA
EST5'.+ CGANGGCCTATCAACAATGAAAGGTCGAA
EST1.+ ACCTGCGTTTACTCCGGATACAAGATCCACCCAGGACACGG-AAAGAGACTTGTCCGTAC
EST5'.+ ACCTGCGTTTACTCCGGATACAAGATCCACCCAGGACACGGnAAAGAGACTTGTCCGTAC
EST1.+ TGACGGAAAGGTCCAAATCTTCCTCAGTGGAAAGGCACTCAAGGGAGCCAAGCTTCGCCG
EST5'.+ TGACGGAAAGGTCCAAATCTTCCTCAGTGGAAAGGCACTCAAGGGAGCCAAGCTTCGCCG
EST1.+ TAACCCACGTGACATCAGATGGACTGTCCTCTACAGAATCAAGAACAAGAAGGGAACCCA
EST5'.+ TAACCCACGTGACATCAGATGGACTGTCCTCTACAGAATCAAGAACAAGAAGGGAACCCA
EST1.+ CGGACAAGAGCAAGTCACCAGAAAGAAGACCAAGAAGTCCGTCCAGGTTGTTAACCGCGC
EST5'.+ CGGACAAGAGCAAGTCACCAGAAAGAAGACCAAGAAGTCCGTCCAGGTTGTTAACCGCGC
EST3'.- AAGAGCAAGTCACCAGAAAGAAGACCAAGAAGTCCGTCCAGGTTGTTAACCGCGC
EST1.+ CGTCGCTGGACTTTCCCTTGATGCTATCCTTGCCAAGAGAAACCAGACCGAAGACTTCCG
EST5'.+ CGTCGCTGGACTTTCCCTTGATGCTATCCTTGCCAAGAGAAACCAGACCGAAGACTTCCG
EST3'.- CGTCGCTGGACTTTCCCTTGATGCTATCCTTGCCAAGAGAAACCAGACCGAAGACTTCCG
EST1.+ TCGCCAACAGCGTGAACAAGCCGCTAAGATCGCCAAGGATGCCAACAAGGCTGTCCGTGC
EST5'.+ TCGCCAACAGCGTGAACAAGCCGCTAAGATCGCCAAGGATGCCAACAA
EST3'.- TCGCCAACAGCGTGAACAAGCCGCTAAGATCGCCAAGGATGCCAAnAAGGCTGTCCGTGC
EST1.+ CGCCAAGGCTGCTGCCAACAAGGAAAAGAAGGCCTCTCAGCCAAAGACCCAGCAAAAGAC
EST3'.- CGCCAAGGCTGCTNCCAACAAGGNAAAGAAGGCCTCTCAGCCAAAGACCCAGCAAAAGAC
EST1.+ CGCCAAGAATGTGAAGACTGCTGCTCCACGTGTCGGAGGAAAGCGATTAAACGTTCTCGG
EST3'.- CGCCAAGAATN TNAAGACTGCTGCTCCNCGTGTCGGNGGAAANCGA-TAAACGTTCTCGG
Blast searching EST databases PE
VI, 2004 Page 51
CONTIG --------------------------------------------------------------------------------------CGANGGCCTATCAACAATGAAAGGTCGAAACCTG
Genomic AGCTACAAACAGATCCTTGATAATTGTCGTTGATTTTACTTTATCCTAAATTTATCTCAAAAATGTTGAAATTCAGATTCGTCAAGCGAGGGCCTATCAACAATG-AAGGTCGAAACCTG
*** ************ ** * **************
!
CONTIG CGTTTACTCCGGATACAAGATCCACCCAGGACACGGNAAAGAGACTTGTCCGTACTGACGGAAAG-------------------------------------------------------
Genomic CGTTTACTCCGGATACAAGATCCACCCAGGACACGG-AAAGAGACTTGTCCGTACTGACGGAAAGGTGAGTTCAGTTTCTCTTTGAAAGGCGTTAGCATGCTGTTAGAGCTCGTAAGGTA
************************************ ****************************
!
CONTIG ------------------------------------------------------------------------------------------------------------------------
Genomic TATTGTAATTTTACGAGTGTTGAAGTATTGCAAAAGTAAAGCATAATCACCTTATGTATGTGTTGGTGCTATATCTTCTAGTTTTTAGAAGTTATACCATCGTTAAGCATGCCACGTGTT
CONTIG ----------------------------------------------GTCCAAATCTTCCTCAGTGGAAAGGCACTCAAGGGAGCCAAGCTTCGCCGTAACCCACGTGACATCAGATGGAC
Genomic GAGTGCGACAAACTACCGTTTCATGATTTATTTATTCAAATTTCAGGTCCAAATCTTCCTCAGTGGAAAGGCACTCAAGGGAGCCAAGCTTCGCCGTAACCCACGTGACATCAGATGGAC
**************************************************************************
CONTIG TGTCCTCTACAGAATCAAGAACAAGAAG---------------------------------------------GGAACCCACGGACAAGAGCAAGTCACCAGAAAGAAGACCAAGAAGTC
Genomic TGTCCTCTACAGAATCAAGAACAAGAAGGTACTTGAGATCCTTAAACGCAGTTGAAAATTGGTAATTTTACAGGGAACCCACGGACAAGAGCAAGTCACCAGAAAGAAGACCAAGAAGTC
**************************** ***********************************************
CONTIG CGTCCAGGTTGTTAACCGCGCCGTCGCTGGACTTTCCCTTGATGCTATCCTTGCCAAGAGAAACCAGACCGAAGACTTCCGTCGCCAACAGCGTGAACAAGCCGCTAAGATCGCCAAGGA
Genomic CGTCCAGGTTGTTAACCGCGCCGTCGCTGGACTTTCCCTTGATGCTATCCTTGCCAAGAGAAACCAGACCGAAGACTTCCGTCGCCAACAGCGTGAACAAGCCGCTAAGATCGCCAAGGA
************************************************************************************************************************
CONTIG TGCCAACAAGGCTGTCCGTGCCGCCAAGGCTGCTNCCAACAAG-----------------------------------------------------------------------------
Genomic TGCCAACAAGGCTGTCCGTGCCGCCAAGGCTGCTGCCAACAAGGTAAACTTTCTACAATATTTATTATAAACTTTAGCATGCTGTTAGAGCTTGTAAGGTATATGTGATTTTACGAGTGT
********************************** ********
!
CONTIG -------------------------------------------------------------------------------------------------------------------GNAAA
Genomic GTTATTTGAAGCTGTAATATCAATAAGCATGTCTCGTGTGAAGTCCGACAATTTACCATATGCATGAAATTTAAAAACAAGTTAATTTTGTCAATTCTTTATCATTGGTTTTCAGGAAAA
* ***
CONTIG GAAGGCCTCTCAGCCAAAGACCCAGCAAAAGACCGCCAAGAATNTNAAGACTGCTGCTCCNCGTGTCGGNGGAAANCGATAAACGTTCTCGGNCCCGTTATTGTAATAAATTTTGTTGAC
Genomic GAAGGCCTCTCAGCCAAAGACCCAGCAAAAGACCGCCAAGAATGTGAAGACTGCTGCTCCACGTGTCGGAGGAAAGCGATAAACGTTCTCGGTCCCGTTATTGTAATAAATTTTGTTGAC
******************************************* * ************** ******** ***** **** * *********** ***************************
!
CONTIG C-----------------------------------------------------------------------------------------------------------------------
Genomic CGTTAAAGTTTTAATGCAAGACATCCAACAAGAAAAGTATTCTCAAATTATTATTTTAACAGAACTATCCGAATCTGTTCATTTGAGTTTGTTTAGAATGAGGACTCTTCGAATAGCCCA
*
exon
exon
exon
exon
exon
intron
intron
intron
Blast searching EST databases PE
Alignment of an EST “contig” and a genomic sequence
VI, 2004 Page 52
ORESTES
•Goal: to obtain EST sequences from the under
represented, often coding, central portions of mRNAs
•Methodology: use low-stringency semi-random priming
followed by PCR, producing low complexity libraries
•Results: over 1’000’000 ESTs produced, of which half
produce novel information
Concluding remarks conclusion
Cons:
- low quality data
- native databases- 3’ ends are heavily represented
- bad/no annotation
- Gene Indices
- … (see course)
Pros:- fast & cheap (automated techniques)
- indispensable for gene structure prediction, gene discovery and genome mapping (large / small scale)
- efforts:- normalized databases- good annotation- improvements (pre-processing, clustering, assembling)- ORESTES- Emerging Gene indices (HUGO, ENSEMBL)
Futur of ESTs:
•In human and mouse, most will come as byproducts
of full-length projects,
•There are good arguments for trying to reach
saturation on selected tissues
•ESTs are still the tool of choice for rapid
exploration of the transcriptomes of various species,
especially with large genomes
•ESTs could form a very solid basis for evolutionary
studies
Recommended