1
Writing C++ in Visual Studio
Proverb:
Work smarter not harder
Summary How to take advantage of Visual Studio‟s features.
Tutorial Overview Visual Studio is more than a glorified syntax colour coder. It contains thousands of hidden tricks and
abilities to make your life easy. Having a better understanding of your tools can help you produce more
robust, cleaner code faster. Then when bugs and problems do arise for some reason, you should be able to
go straight to the problem and rectify it without breaking a sweat.
Environment Variables Setting environment variables for Visual Studio so paths and defines can be used in Visual Studio.
You can add a „USER‟ define, so you can write user specific code for shared projects. In the environment
variables add the variable “USER”, and set it to something specific, e.g. “MYCODE”.
In Visual Studio, add to the pre-processor for the project – “$(USER)”.

2
Now you should be able to use your define in code.
1 2 3
#ifdef MYCODE
printf("Code only to compile/run for me \n");
#endif2
Code Messages and Reminders At various points during code development you can write comments in your code to remind you to come back
to them at a later date. Visual Studio can help you keep track of these by automatically adding them to a
list. Visual Studio has a Task-List window, and will automatically add comments starting with “//TODO” to
the list, so you know what still needs doing, or what others have left unfinished. Note that it‟s case
sensitive, so “//todo” won‟t work, also no spaces between the double slashes and the word TODO.
In Visual Studio 2010 you have to enable this in:
Tools -> Options -> Formatting -> Enumerate comment tasks (Set to true to enable)
To view the task list window:
View -> Other Windows -> Task List
1 //TODO : Add extra check code later

3
You can also send messages to your output window during compile to give additional information by taking
advantage of the #pragma define, e.g:
1 #pragma message( “This is a reminder...hello...” )
This can give additional information, e.g. the order files are compiled, or maybe just updates on which
compile flags should be set etc, by placing the #pragma message inside different #defines you can give
different messages for release and debug builds.
You can also insert custom compile errors, for example if you try and build the code for different platforms
(PS3/PC/Win32) you can spit out compile error informing that this code isn‟t supported, or needs certain
fixes.
1 2 3
#ifdef MYFASTMODE
#error("Error : This code won't work in FastMode" )
#endif3
Temp Files Cleanup Visual Studio generates numerous temporary files in various directories for debugging and during the build
process. At various points you may want to a cleanup and remove all temp and compiled files before giving
the code to someone else, or zipping them up.
4
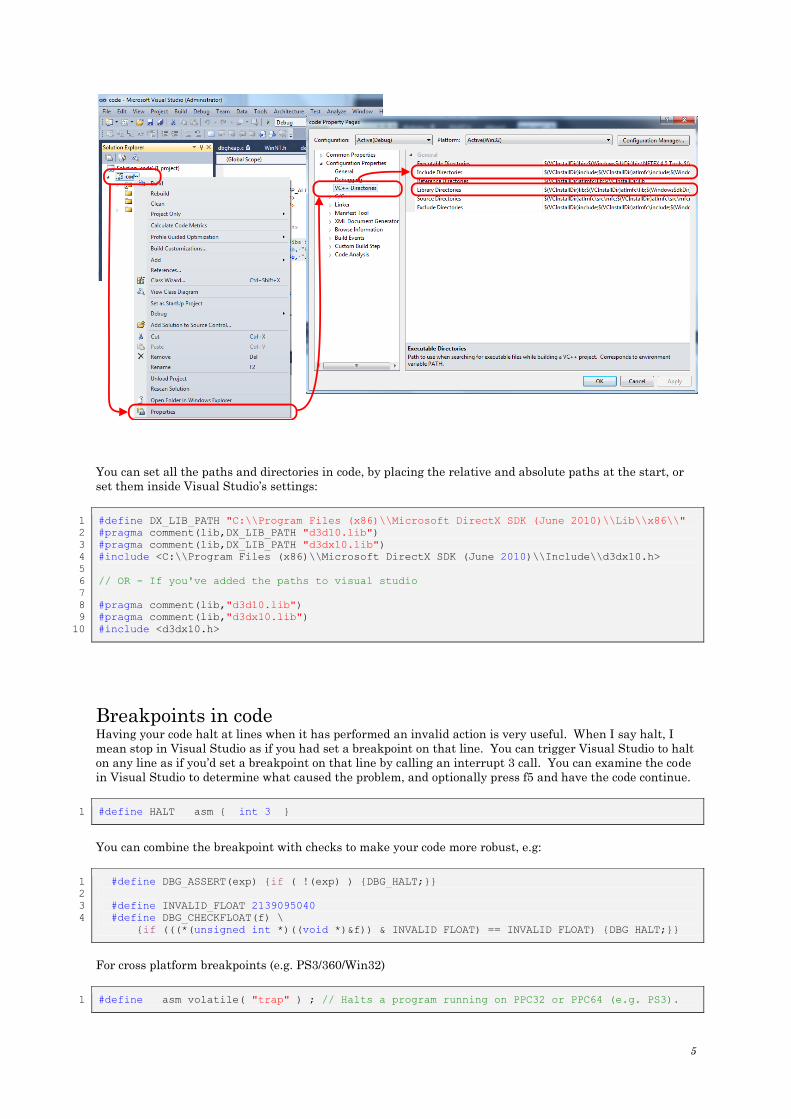
A good method is to create a „.bat‟ script, which when run recursively deletes any temporary files in that
directory. BE WARNED, bat files can be dangerous, deleted files cannot be recovered so be careful where
you put the script and which files you delete.
1 2 3 4 5 6 7 8 9 10 11 12 13 14 15 16 17 18 19 20 21 22 23 24 25
REM Remove Temp Visual Studio Files
REM *******************************
del /s *.aps
del /s *.clw
del /s *.ncb
del /s *.opt
del /s *.plg
del /s *.pdb
del /s *.vsp
del /s *.sdf
del /s /A -H *.suo
del /Q Debug\\*.*
rmdir /Q Debug
del /Q Release\\*.*
rmdir /Q Release
FOR /F "tokens=*" %%G IN ('DIR /B /AD /S *ipch') DO RMDIR /S /Q "%%G"
FOR /F "tokens=*" %%G IN ('DIR /B /AD /S *obj') DO RMDIR /S /Q "%%G"
FOR /F "tokens=*" %%G IN ('DIR /B /AD /S *bin') DO RMDIR /S /Q "%%G"
Code 1. Cleanup.bat to remove temporary Visual Studio files.
Libs and Includes If you‟ve got multiple projects or your including libs from external sources (e.g. DirectX/OpenGL/Bullet),
then you‟ll need to tell your Visual Studio project which libs you want to include and where their located.
You can reference your libs in code by adding #pragma defines which will inform Visual Studio to include
those libs.
1 2 3
// Include these libs in our build
#pragma comment(lib, "kernel32.lib")
#pragma comment(lib, "user32.lib")
Alternatively you can add them directly to the project through the IDE:
Right click the project in solution explorer -> Properties ->Linker -> Input -> Additional Dependencies, and
then add your libs directly.
As well as specifying which libs you want to include, you also have to tell the Visual Studio project where
their located. To add include directories and lib paths to your project:
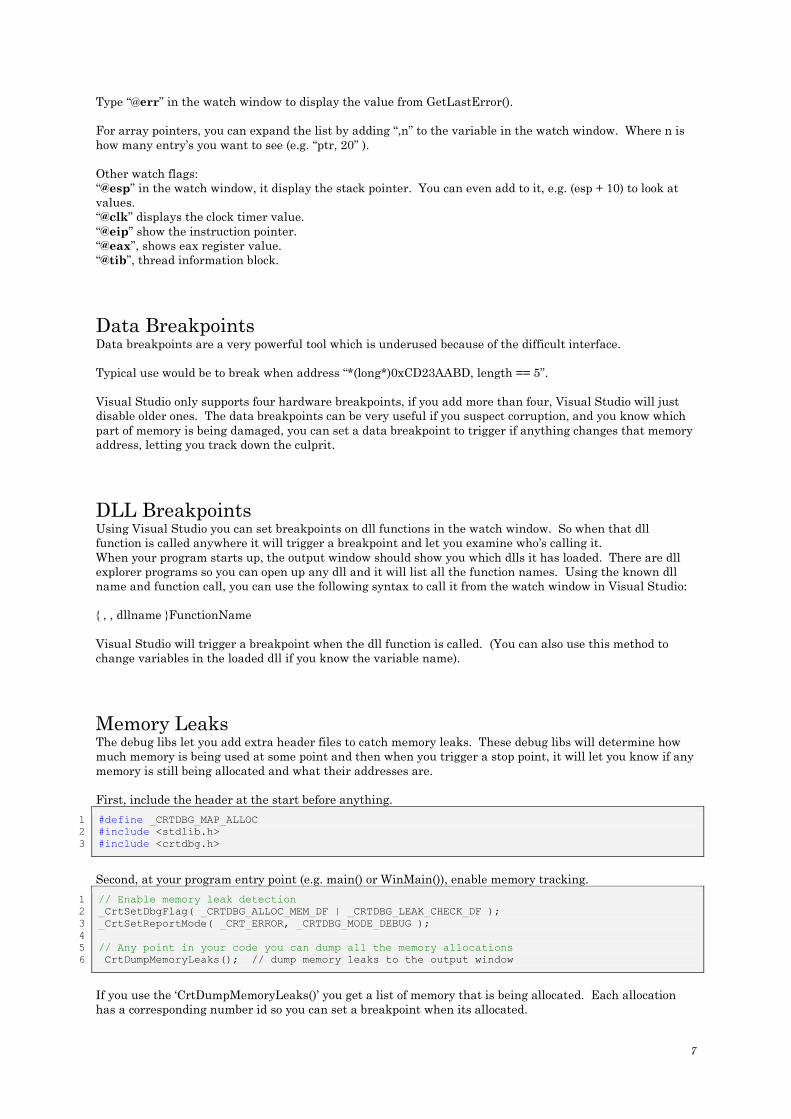
Right click project in the Solution Explorer -> Properties -> VC++ Directories -> Include Directories /
Library Directories.
5
You can set all the paths and directories in code, by placing the relative and absolute paths at the start, or
set them inside Visual Studio‟s settings:
1 2 3 4 5 6 7 8 9 10
#define DX_LIB_PATH "C:\\Program Files (x86)\\Microsoft DirectX SDK (June 2010)\\Lib\\x86\\"
#pragma comment(lib,DX_LIB_PATH "d3d10.lib")
#pragma comment(lib,DX_LIB_PATH "d3dx10.lib")
#include <C:\\Program Files (x86)\\Microsoft DirectX SDK (June 2010)\\Include\\d3dx10.h>
// OR - If you've added the paths to visual studio
#pragma comment(lib,"d3d10.lib")
#pragma comment(lib,"d3dx10.lib")
#include <d3dx10.h>
Breakpoints in code Having your code halt at lines when it has performed an invalid action is very useful. When I say halt, I
mean stop in Visual Studio as if you had set a breakpoint on that line. You can trigger Visual Studio to halt
on any line as if you‟d set a breakpoint on that line by calling an interrupt 3 call. You can examine the code
in Visual Studio to determine what caused the problem, and optionally press f5 and have the code continue.
1 #define HALT __asm { int 3 }
You can combine the breakpoint with checks to make your code more robust, e.g:
1 2 3 4
#define DBG_ASSERT(exp) {if ( !(exp) ) {DBG_HALT;}}
#define INVALID_FLOAT 2139095040
#define DBG_CHECKFLOAT(f) \
{if (((*(unsigned int *)((void *)&f)) & INVALID_FLOAT) == INVALID_FLOAT) {DBG_HALT;}}
For cross platform breakpoints (e.g. PS3/360/Win32)
1 #define __asm volatile( "trap" ) ; // Halts a program running on PPC32 or PPC64 (e.g. PS3).

6
2 3 4
__asm {int 3} ; // Halts a program running on IA-32.
__debugbreak() ; // Halts Win32 (basically a wrapper for int 3)
Output Window (or DOS Prompt) You should direct all your text debug information through a macro or single function, this enables you to
turn it off for speed. You can also redirect it to Visual Studio‟s output window (the preferred way), a txt log
file, or even a DOS output window from a single location.
The function „OutputDebugString(..)‟ let‟s you send strings to the output window while your program is
running.
1 OutputDebugString( char* );
Taking advantage of vsprintf(..) you can create a debug print function that takes variable arguments, which
you pass along to your output/log file.
1 2 3 4 5 6 7 8 9 10 11 12 13 14 15 16 17 18 19 20 21 22
//Saving debug information to a log file
__forceinline void dprintf(const char *fmt, ...)
{
va_list parms;
static char buf[2048]; // Dangerous - buffer overrun issues?
// Try to print in the allocated space.
va_start(parms, fmt);
vsprintf (buf, fmt, parms);
va_end(parms);
// Dirty quick write the information out to a txt file
#if 0
FILE *fp = fopen("output.txt", "a+");
fprintf(fp, "%s", buf);
fclose(fp);
#endif
// Output to the visual studio window
OutputDebugString( buf );
}// End dprintf(..)
Memory Data When using Visual Studio it will use the debug heap, which will initialize memory and variables to default
magic values.
Value Usage
0xCDCDCDCD Allocated in heap, but not initialised.
0xCCCCCCCC Allocated on the stack, but not initialized.
0xDDDDDDDD Released heap memory.
0xFDFDFDFD “NoMansLand” fences are placed around heap allocations to help you
detect if you‟re walking off the edge of an array.
Watch Window The watch window lets you see the value of any variable, but it also has a lot of hidden tricks to let you see
additional information.
7
Type “@err” in the watch window to display the value from GetLastError().
For array pointers, you can expand the list by adding “,n” to the variable in the watch window. Where n is
how many entry‟s you want to see (e.g. “ptr, 20” ).
Other watch flags:
“@esp” in the watch window, it display the stack pointer. You can even add to it, e.g. (esp + 10) to look at
values.
“@clk” displays the clock timer value.
“@eip” show the instruction pointer.
“@eax”, shows eax register value.
“@tib”, thread information block.
Data Breakpoints Data breakpoints are a very powerful tool which is underused because of the difficult interface.
Typical use would be to break when address “*(long*)0xCD23AABD, length == 5”.
Visual Studio only supports four hardware breakpoints, if you add more than four, Visual Studio will just
disable older ones. The data breakpoints can be very useful if you suspect corruption, and you know which
part of memory is being damaged, you can set a data breakpoint to trigger if anything changes that memory
address, letting you track down the culprit.
DLL Breakpoints Using Visual Studio you can set breakpoints on dll functions in the watch window. So when that dll
function is called anywhere it will trigger a breakpoint and let you examine who‟s calling it.
When your program starts up, the output window should show you which dlls it has loaded. There are dll
explorer programs so you can open up any dll and it will list all the function names. Using the known dll
name and function call, you can use the following syntax to call it from the watch window in Visual Studio:
{ , , dllname }FunctionName
Visual Studio will trigger a breakpoint when the dll function is called. (You can also use this method to
change variables in the loaded dll if you know the variable name).
Memory Leaks The debug libs let you add extra header files to catch memory leaks. These debug libs will determine how
much memory is being used at some point and then when you trigger a stop point, it will let you know if any
memory is still being allocated and what their addresses are.
First, include the header at the start before anything.
1 2 3
#define _CRTDBG_MAP_ALLOC
#include <stdlib.h>
#include <crtdbg.h>
Second, at your program entry point (e.g. main() or WinMain()), enable memory tracking.
1 2 3 4 5 6
// Enable memory leak detection
_CrtSetDbgFlag( _CRTDBG_ALLOC_MEM_DF | _CRTDBG_LEAK_CHECK_DF );
_CrtSetReportMode( _CRT_ERROR, _CRTDBG_MODE_DEBUG );
// Any point in your code you can dump all the memory allocations
_CrtDumpMemoryLeaks(); // dump memory leaks to the output window
If you use the „CrtDumpMemoryLeaks()‟ you get a list of memory that is being allocated. Each allocation
has a corresponding number id so you can set a breakpoint when its allocated.

8
For example, if you call CrtDumpMemoryLeaks(), you would get something like this:
Detected memory leaks!
Dumping objects ->
{76} normal block at 0x001F1290, 400 bytes long.
Data: < > CD CD CD CD CD CD CD CD CD CD CD CD CD CD CD CD
In your code, you would set a breakpoint to trigger when the number {76} is hit by adding an extra line of
code:
1 2 3
_crtBreakAlloc = 76; // Break at the 76th memory allocation.
// Or
_CrtSetBreakAlloc(76); // Break at the 76th memory allocation.
Or alternatively you can link to the debug dll while it‟s running in the watch window, and set the debugger
to break when the allocation number is hit:
{,,msvcr100d.dll}_crtBreakAlloc = 76
Optimized Code Once you run optimized code, Visual Studio will attempt to match the actual code with the corresponding
source code point. But due to optimisation methods this is not always the case and you may need to look at
the disassembly window for the truth.
Release vs Debug When your program works in „Debug‟ but not in „Release‟, some common problems are:
Memory corruption (Over/ Under-runs of memory).
o Enable the debug heap to help try and track it down.
Uninitialized variables
o Often set to some magic value in debug (e.g. 0).
o Unless /GZ switch is enabled.
Calling convention (e.g. GetProcAddress)
o Use /GZ in compiler
Memory alignment
o Alignment in memory might need to be 16/32/128 bytes aligned (and just luckily is
working in debug).
Local variables being overwritten.
o Variable with the same name being used multiple times inside a function.
o Local variables being passed on the stack.
Optimiser
o Modifying the code causing it to break, thinks functions might not be getting used, or
variables order being changed for speed. (Very rare but happens).
Outside Debugger If you find that your application doesn‟t run when you run it standalone, this is can be because of numerous
problems.
When you run your program under the debugger it uses the debug heap. To avoid this, you can run
the program standalone and then inside Visual Studio use „attach to process‟ to debug your
program.
PATH may be different. Call GetEnfiromentString(..) in your application to get the working paths
and check.
Thread timing might be different.
Using different dlls.

9
Hacking Code On occasion while your code has stopped you might want to modify your assembly code while running. Such
as blank out a specific line of code (e.g. function call), or have the assembly jump somewhere else, such
commands would be:
0x90 NOP
“Comment-out” chunks of code by using the NOP instruction in the assembly window.
0x74, 0x75 JE, JNE
Modify if statement to redirect your code in another direction.
To view the assembly, stop your program at a breakpoint while running then goto:
Debug->Windows->Disassembly
To view any piece of memory, view the memory viewer:
Debug-> Windows-> Memory
Note, the program must be running and be stopped before you can view the disassembly and memory
windows.
Figure 1. View disassembly and memory in real-time to modify/alter code.
Casting in Watch Window The watch window lets you cast variables to anything, e.g. (char*)0x12345678, let‟s you look at memory
address 0x12345678, because we cast it to char*, it will show the data as ascii.

10
Append to PATH in Visual Studio When running programs through Visual Studio for debugging, you may need to set environment variables
temporarily. One such example would be to modify the PATH environment variable so that it includes an
additional directory where dll‟s are loaded (OpenGL, Glut..).
Goto:
Project>Properties>Configuration Properties>Debugging "Environment" and "Merge Environment”.
The syntax is NAME=VALUE and macros can be used (for example, $(OutDir)).
For example, to prepend “C:\Windows\Temp” to the PATH:
1 PATH=C:\WINDOWS\Temp;%PATH%
Similarly, to append $(TargetDir)\DLLS to the PATH:
1 PATH=%PATH%;$(TargetDir)
Recommended Reading The tutorials only give you a starting point from which you can get a foot hold, so that you can get started
and begin to explore and understand the power...
Work in progress...
Recommended