1
Western Water Assessment
Working Paper
Simulated climate adaptation in stormwater systems:
Evaluating the efficiency of within-system flexibility
Adam D. McCurdy
and
William R. Travis
Western Water Assessment
and
Department of Geography
University of Colorado Boulder
Acknowledgements: Research for this paper was supported by the Western Water Assessment, a
project of the University of Colorado’s Cooperative Institute for Research in the Environmental
Sciences, funded by the U.S. National Oceanic and Atmospheric Administration under Climate
Program Office grant #NA10OAR4310214.

2
Abstract
Changes in temperature and precipitation patterns resulting from climate change may
adversely affect the performance of long-lived infrastructure. Adaptation may be necessary to
ensure that infrastructure continues offering consistent service and remains cost effective. Deep
uncertainty associated with future climate projections makes adaptation decisions especially
challenging for managers. Previous work shows that incorporating flexibility into systems can
increase their effectiveness across different climate futures but can also add significant costs. In
this paper we review existing work on flexibility in climate change adaptation, offer a simple
typology of flexibility, and present a new method of increasing flexibility, termed vertical
flexibility. Rather than treating a system of dispersed infrastructure elements as monolithic,
vertical flexibility acknowledges the inherent differences in individual elements and incorporates
this information into adaptation decisions. We examine the performance of flexible policies that
allow for multiple adaptation strategies with varying timing qualities based on individual
characteristics for a virtual testbed of highway drainage crossings, or culverts. Our results show
that a vertically-flexible strategy informed by crossing characteristics offers a more efficient
method of adaptation than do monolithic policies. We explore the implications of vertical
flexibility as a cost-effective adaptation strategy for agencies building long-lived climate
sensitive infrastructure, especially where detailed system data and analytical capacity is limited.
Introduction
If infrastructure managers accept that the hydro-climatology for which they must design,
build, and maintain, is non-stationary, as much of the literature now urges (Gibbs, 2012; Milly et
al., 2008) (Olsen, 2015), the question remains as to how and when they should adapt policies and
the systems themselves. The Intergovernmental Panel on Climate Change (IPCC) defined
3
adaptation as “The process of adjustment to actual or expected climate and its effects. In human
systems, adaptation seeks to moderate or avoid harm or exploit beneficial opportunities” (Agard
& Schipper, 2014, p. 1758). Adaptations are actions which reduce climate sensitivity, alter
climate exposure, or increase system resilience (Adger et al., 2005). Given continued deep
uncertainty about the unfolding climate (Hallegatte, Shah, Lempert, Brown, & Gill, 2012;
Ranger et al., 2013), the emerging adaptive posture, especially for long-lived infrastructure, has
tended to empathize mixtures of robust and flexible design (Walker et al., 2013).
Decision strategies seeking to optimize infrastructure performance through a “predict-
then-act” strategy are, ipso facto, less effective in a changing climate. Strategic approaches thus
are starting to favor choices that are scaled to the climate risk (Brown et al., 2012; Olsen, 2015)
or dynamic solutions that are adaptable over time as climate trends become more manifest, for
example “adaptation pathways” (Walker et al., 2013). Dynamic adaptation may entail delaying
some decisions, and seeking interim solutions that interfere less with future options, either
physically or financially (Hallegatte, 2009). Where this approach is not feasible, and large
systems must be built now, then the strategy has been toward robustness to a wider range of
future conditions (Lempert et al., 2003). Robust strategies may be quite expensive, and have
predominantly been applied to high consequence decisions with a diverse options space.
Here we apply an exploratory modeling analysis (Bankes, 1993) to highway stormwater
infrastructure, with a focus on culverts---covered water conveyances embedded in the roadbed
whose main purpose is to transport surface runoff from one side of the roadbed to the other.
Culverts are emplaced where drainage ways intersect with the roadbed and where impounded
water might damage or even destroy the road (Federal Highway Administration, 2012), or cause
local property damage. In many parts of the world outside of deserts this intersection is quite

4
common, and even roads providing lower service levels are constructed with frequent culverts.
Such systems are at risk to variation in the intensity, duration and frequency of extreme
precipitation events. Their individual elements, expressing different characteristics, will respond
to climate change in varying ways. Design, performance, and maintenance specifications for
individual units are often codified by governing agencies via blanket standards. Culverts thus
constitute a system of dispersed elements built to similar standards with limited adaptation
options (once in place they may have design lives of 50-70 years and many end up in service for
a century or longer) and relatively high climate exposure. Culvert failure can destroy roads and
present life-threatening conditions, in response to localized, intense rainfall and runoff episodes
or to regional events such as the Hurricane Irene floods in Vermont (Irene Recovery Office,
2013).
While climate theory and models projecting human-induced climate change suggest
increasing temperatures almost universally, there is much less consensus regarding precipitation
and other elements of the hydrologic cycle (IPCC, 2007), especially for regional-to-local
changes, and especially for soil moisture and runoff (Kirkman et al., 2013). The hydrologic cycle
is generally expected to intensify (Donat et al., 2016) but predictions exhibit geographic
variability and high uncertainty (Tebaldi et al., 2006). Rainfall intensity has increased over much
of the U.S. in recent decades and is projected to continue increasing (Walsh et al., 2014). In the
southwestern U.S., where our testbed is located, annual daily maximum precipitation is expected
to increase between 11% and 21% under the IPCC Representative Concentration Pathway (RCP)
8.5 (Wuebbles, Kunkel, Wehner, & Zobel, 2014). Precipitation predictions are complicated by
the myriad ways that shifts in precipitation can be realized: changing means without changing
extremes, changing intensities in given durations without changing means, or changes that

5
exhibit strong seasonality. Additionally, precipitation is generated by a number of different
phenomena, some of which are not well simulated in current climate models (O’Gorman, 2015).
Potential increases in rainfall intensity from convection and orographic effects are of particular
concern in Colorado (Mahoney et al., 2012). Despite the uncertainty the current adaptation trend
in the U.S. is to increase the design storm for infrastructure (Exec. Order No., 2015).
Infrastructure Adaptation Strategies
In other work (McCurdy and Travis, 2016) we investigated the effect of crossing
characteristics on the most efficient system-wide adaptation. That is, we posited and tested
blanket adaptation policies, such as upgrading all culverts on a nominal, or an anticipatory
schedule. In the current study we ask: do individual crossings respond to climate change in ways
that warrant individual-level adaptation strategies? In the next section we situate such strategies
within the broader frame of flexible adaptation. Following that we establish a methodology to
test the efficacy, and to evaluate the potential benefits, of such crossing-specific strategies.
Horizontal and Outcome Flexibility
Researchers have identified the value of flexibility in climate adaptation across diverse
applications, including agriculture, water supply, flood control, and other climate-sensitive
sectors (Iglesias, Quiroga, Moneo, & Garrote, 2011; J. H. Kwakkel et al., 2012; Lempert &
Groves, 2010; Walthall et al., 2012; Michelle Woodward et al., 2014). Most of this research
focuses on what we refer to as horizontal or outcome flexibility. Horizontal flexibility places a
high value on maintaining a wide range of future options and creating a framework for decision-
makers to engage in those options. These strategies draw from concepts of ecological adaptive
management (Tompkins & Adger, 2004), and financial “real options” (Linquiti & Vonortas,
6
2012). They emphasize continual learning, explicitly valuing flexibility and avoiding path
dependence.
The term “horizontal” is in reference to adaptation pathway illustrations that resemble a
transit system map and in which time flows horizontally, left to right, while options stack
vertically. A simple example of horizontal flexibility in illustrated in figure 1a. As time
progresses the decision-maker has several opportunities to switch their strategy to either a new
pathway or an existing one that they previously opted not to take. Horizontal flexibility for
adapting to climate change has been formalized in Adaptation Pathways (AP) (M. Haasnoot,
Middelkoop, van Beek, & van Deursen, 2011), Real-Options (RO) (Michelle Woodward et al.,
2014), and Adaptive Policy Making (APM) (Walker, Rahman, & Cave, 2001). Each of these
techniques incorporates flexibility in different stages or using different decision tools. AP
focuses on the timing of adaptation, identifying when a decision-maker has the opportunity to
shift adaptation strategies, and for how long a decision will meet predefined performance criteria
(Marjolijn Haasnoot, Kwakkel, Walker, & ter Maat, 2013). Kwakkel (2014) accomplished this
using exploratory models and simulating many possible futures. RO is a financial decision
analysis method which enables a decision maker to incorporate the value of future flexibility
(options) into a net present value cost-benefit analysis (M. Woodward, Gouldby, Kapelan, Khu,
& Townend, 2011). Finally APM is a structured approach to design and implement flexible
adaptation strategies (Walker et al., 2001). It provides a framework for decision makers to assess
and review their decisions based on predetermined measures of success and specifies actions to
take when conditions for success are not being met. Computational experiments using these
strategies show they offer important, but different advantages over traditional predict-then-act
approaches to decisions making; however there are reasons to be skeptical. Implementing

7
horizontally-flexible strategies can require significant analysis and continual monitoring, perhaps
especially challenging for limited budget, more routine infrastructure operations.
Decision making tools that emphasize outcome flexibility attempt to identify strategies
that are effective over a wide range of possible futures; thus they are less likely to need adaptive
modification over time. This draws on the engineering concept of robust design, emphasizing
strategies that are insensitive to variation in uncontrollable or unpredictable factors (Park, Lee,
Lee, & Hwang, 2006). Methods for identifying outcome flexibility are extensively explored in
Robust Decision Making (RDM) (Lempert et al., 2003), and Decision Scaling (DS) (Brown et
al., 2012). The Rand Corporation developed RDM as a method to simulate the performance of
adaptation strategies over an extremely wide range of futures and to identify the conditions under
which strategies succeed or fail (Lempert & Groves, 2010). DS works in the opposite direction,
first using a sensitivity analysis to determine where a system will fail due to climate change and
then examining available climate model output to assess how likely that future is (Brown et al.,
2012). Strategies that emphasize outcome flexibility are often more costly, and appropriate for
systems with a high consequence of failure. Increased cost often means they are not economical
for lower-consequence decisions where failure is more acceptable.
Horizontal and outcome flexibility are not mutually exclusive and in some sense both
accomplish the same task, but on different time frames. Outcome flexibility is traditionally used
as a tool for making large, irreversible decisions or forming long term plans, whereas horizontal
flexibility is more explicitly a continuous process. At the time of decision both strive to identify
strategies which will be successful in a range of unpredictable futures; Horizontal flexibility
accomplishes this by adapting to future changes and outcome flexibility by selecting an option
that is robust to future changes.

8
Vertical Flexibility
In this paper we explore the potential of vertical flexibility as an additional dimension to
crafting dynamic adaptation strategies. We define vertical flexibility as increasing the number of
available options at the time of a decision, specifically allowing decisions to be made on a more
granular rather than monolithic scale. This type of flexibility is particularly relevant when
making policy decisions that govern a group of similar elements (i.e. culverts, bridges, road
surfaces, buildings, etc.). Typically, these structures are governed by blanket policies enacted at
the agency level. In the United States many such standards are promulgated at the state level, for
example the Colorado Department of Transportation’s culvert guidelines in table 1 (Colorado
Department of Transportation, 2004).
Table 1-CDOT Culvert Design Guidelines
Road Type Urban/Rural
Design
Storm
Multilane Roads - including
interstate
Urban 100-year
Rural 50-year
Two-Lane Roads
Urban 100-year
Rural (Q50 > 4000
cfs) 50-year
Rural (Q50 < 4000
cfs) 25-year
These guidelines have not been altered to reflect anticipated changes in climate, nor have any of
CDOT’s methods for calculating the return period been adjusted to the notion of non-stationarity.
Adaptation could be implemented within CDOT’s current framework in one of two ways. The
required design storm for all infrastructure could be increased to a larger event, or the methods to
calculate return intervals could be changed to incorporate projections of climate change. Both of

9
these approaches were recently implemented for federal projects in the U.S. by presidential
executive order requiring projects to be built to the 500-yr flood, with 2 feet of freeboard over
the 100-yr flood, or using the best available climate science (“Exec. Order No 13690,” 2014).
These methods of adaptation are monolithic policies that assume climate is the main, or only
variable which should be included when deciding on an adaptation strategy.
Climate change is typically characterized as a problem with ‘deep uncertainty’
(Hallegatte et al., 2012; Ranger et al., 2013). The term ‘deep’ uncertainty refers to “a situation in
which analysts do not know or cannot agree on: (1) models that relate key forces that shape the
future; (2) probability distributions of key variables and parameters in these models, and/or (3)
the value of alternative outcomes” (Hallegatte et al., 2012, p. 2). The deep uncertainty with
regards to climate change is created from the uncertainty in future greenhouse gas emissions,
uncertainty in model accuracy and parameterization especially at small scales, and uncertainty in
how natural systems will react to increases in radiative forcing (Hallegatte, 2009; Milly et al.,
2008; Walker et al., 2013). While there is agreement that climate change will likely result in a
general intensification of the hydrologic cycle there is less certainty about how changes will be
manifest at local level (Donat et al., 2016; Milly, Wetherald, Dunne, & Delworth, 2002).
The uncertainty associated with climate change creates challenges for monolithic
policies, especially as the spatial scale and diversity of affected elements increases. If a decision
maker were to use the ‘best available climate science’ for a project in Colorado they would find
that the annual maximum daily precipitation may decrease, or increase, by as much as 20% and
possibly more when model uncertainty is included. Finding little clarity in the best available
climate science, they may opt to build to the 500 year flood, at a significant increase in expense.

10
This might make sense for projects with high potential for damage but not for widespread,
distributed elements like culverts, where in some cases flooding will have minimal impact.
A monolithic strategy or one without vertical flexibility can be viewed as either of the
decision trees shown in figure 1. One decision is made and applied to every element in the
system. A decision which incorporates vertical flexibility allows for decisions to be made on an
element level taking into account individual characteristics of each unit within the system. The
culvert guidelines in table 1 already incorporate some vertical flexibility; they treat rural and
urban areas differently and specifications vary depending on the size of the road. Additional
flexibility for climate-sensitive decisions could be incorporated by evaluating the ease of
increasing capacity, site characteristics that change the probability of failure, the type of traffic
served by the road, and other factors. As with increasing horizontal or outcome flexibility,
increasing vertical flexibility comes with additional cost. Decision makers must spend additional
time and resources to gather information and evaluate the cost and benefits of each decision.
Vertical flexibility can generally be based on a decisions maker’s current knowledge.

11
Figure 1-A simple schematic styled after the diagrams of Adaptation Pathways (Haasnoot et al., 2012) to compare Horizontal and Outcome flexibility. (a) A policy with Horizontal Flexibility: as time progresses
a decision maker has multiple opportunities to change strategies based on recent information. (b) A policy
with Outcome Flexibility: choices are robust to variations in future climate and well adapted to a wider
range of futures. While Outcome and Horizontal flexibility are shown separately they are frequently designed to make flexible strategies adapted to a wide range of futures. Vertical flexibility (not pictured)
can be viewed as increasing the number of decisions available i.e. expanding one decision map for a
monolithic policy into many decisions for individual elements.
Vertical Flexibility and Culverts
In McCurdy and Travis (2016) we investigate how crossings with different properties
respond to changes in adaptation timing. We found that some crossing characteristics can
significantly increase the likelihood of benefiting from earlier adaptation regardless of the rate of
climate change. In that study we assumed that all of the crossings in our testbed were subject to
the same management policy and received the same climate treatment. In this study we use the
Time

12
same testbed of culverts but allow each simulation to randomly assign individual characteristics
that affect key variables, including the cost of upgrading that culvert, its resilience to exceedance
(how much the flow can exceed design before damage occurs), and the additional costs
associated with upgrading on failure (as opposed to a planned upgrade).
Methods
To examine the efficacy of vertical flexibility we use a testbed of eight realistic road
crossings served by culverts conveying runoff. The crossings are based on recent Colorado
Department of Transportation (CDOT) bid tabulations for actual projects (Colorado Department
of Transportation, 2016a). Each crossing has fixed characteristics (based on the original project
bids) that remain static in the simulations, and variable characteristics which affect the crossing’s
climate sensitivity and adaptability. Variable characteristics are randomly assigned at the start of
each iteration. Here we test the effect of vertical flexibility in the timing of adaptation strategy by
simulating extreme events and adaptation over a 100 year period. Simulations without vertical
flexibility use the same adaptation timing for all crossings, whereas simulations with vertical
flexibility assign different strategies to each crossing based on the crossing’s characteristics.
Model Inputs
Here we offer a short description of model inputs and functions, a more complete
explanation can be found in McCudy and Travis (2016).
Adaptive Strategies
We simulate adaptation timing based on the typology offered by Smit et al. (2000) which
classifies adaptations as being anticipatory, reactive, or concurrent with respect to a climate
stimulus (table 2). Additionally we include a Nominal Strategy: one without adaptation.
Simulations using the Anticipatory Strategy increase culvert capacity by replacing one crossing a

13
year until all crossings in the testbed have been upgraded. The Concurrent Strategy increases the
capacity of crossings at the end of their useful life or when damage from an extreme event
warrants a replacement. The Reactive Strategy initially follows the rules of the Nominal Strategy
and switches to the Concurrent Strategy if a crossing needs to be replaced after damage by an
extreme event.
Table 2- Adaptation Strategies
Strategy Name Description
Nominal Replacement as necessary with same sized crossings. Typically at
end of useful life.
Concurrent Crossing capacity is increased at replacement, assuming climate is
changing and damaging events are indicators of that change
Anticipatory Crossing capacity is increased prior to normal replacement in
anticipation of future increase in flood events
Reactive Switch from the Nominal Strategy to the Concurrent Strategy when a
crossing is destroyed by an extreme event, used as a pacemaker for
adaptation
Vertically-
Flexible
Strategy is specific to each crossing depending on variable
characteristics
Fixed Characteristics
Each crossing has the following fixed characteristics: county name, road designation,
design storm, design life, replacement delay (number of days with reduced traffic capacity or
speed due to replacement), and cost (table 3).
Table 3-Fixed Culvert Characteristics
County Road
Design
Storm Material
Design
Life
Replace
Delay Cost Date
Dolores SH145 100 Concrete 80 25 $ 497,747 7/18/2013
Routt US40 100 Concrete 80 50 $ 1,385,135 2/5/2015
Ouray US550 100 Concrete 80 30 $ 1,281,625 10/29/2015
Huerfano SH12 100 Concrete 80 45 $ 995,000 1/15/2015
Jackson SH125 100 Concrete 80 40 $ 453,761 5/8/2014
Montezuma US491 50 Steel 50 25 $ 270,105 7/18/2013
Mesa SH139 50 Steel 50 25 $ 189,363 10/6/2014
Lake SH82 100 Concrete 80 43 $ 709,426 6/5/2014

14
Variable Characteristics
Each crossing is randomly assigned variable characteristics that determine its adaptability
and climate sensitivity (table 4). Upgrade Amount describes how much the capacity of a crossing
is increased at the time of replacement. For example if a crossing’s original design capacity was
100 years and the upgrade factor is 2 the new design capacity is for a 200 year event. Resilience
Factor describes how much the design event of a crossing can be exceeded before the crossing is
damaged. Upgrade Cost defines how much upgrading the crossing costs per unit of increase.
Emergency Factor describes the additional cost to replace a crossing when it is destroyed by an
extreme event. Post Upgrade Factor applies a reduction in cost to upgrades following an initial
upgrade.
Table 4-Variable Culvert Characteristics
System Characteristic Range Model Implementation
Upgrade Amount (UA) 1.5-2.5 UA * Original DS = New Design Size (DS)
Upgrade Cost (UC) 1.0-4.0 (UC * Original Cost (OC) * % capacity ↑) + OC = New Cost (NC)
Post Upgrade Factor (PF) 0.3-0.7 (PF * OC * UC * % capacity ↑) + OC = NC
Emergency Cost (EC) 1.3-1.7 (EC * OC * UC * % capacity ↑) + OC = NC
Resilience Factor (RF) 0.1-0.5 (% DS Exceeded / RF) * OC * EC = Damage Cost
Simulated Flood Events
The model simulates extreme events using random draws from a Generalized Extreme
Value (GEV) distribution fitted to precipitation records for Colorado (equation 5) (Coles, 2001).
(5)
𝐹(𝑥) = exp{− [1 + 𝜉(𝑧 − µ)
𝜎]−1𝜉}
where z is the annual maximum precipitation over the a given duration, µ is the location
parameter, σ is the shape parameter, and ξ is the scale parameter. Following Mailhot et al. (2009)

15
we implement climate change as a shift in the location parameter keeping the shape and scale
parameters constant. There is evidence that climate change may affect other moments of the
distribution or potentially change the distribution altogether (Field et al., 2012; Read & Vogel,
2015); few studies address such changes and work is needed to assess infrastructural sensitivity
to other statistical shifts. Shifts in the distribution are accomplished by applying a climate factor
which changes the magnitude of a design event to that of an event with a higher return interval.
For example, given a climate factor of two, the magnitude of the 100 year event will have
shifted, by the end of the simulation, to be equivalent to the magnitude of the original 200 year
event. Each year the location parameter is linearly increased to simulate this non-stationary
behavior.
Comparative Outcomes
To compare outcomes with and without vertical flexibility we run simulations with the
same crossing characteristics (Upgrade Amount, Emergency Cost, Resilience Factor, Post
Upgrade Factor, and Upgrade Cost) under all four strategies. Each of these are run 104 (for
parallelization across eight processor cores) times to simulate a variety of event realizations. The
104 runs are then aggregated using the mean of all measures of success. This provides a total of
2500 one-hundred year simulations each with different model parameters and eight crossings.
The 2500 simulations are then divided into 10 bins by climate change factor, ranging from .75 to
3 (the .75 factor implies a lessening of intensity for a given return period event). To create a set
of simulations where each crossing has different characteristics but a similar climate we draw
one of the eight culverts from each of the bins 300 times. From this we produce 3000
simulations, each run for 100 years with the same eight crossings experiencing a similar climate
but otherwise having different characteristics.

16
In simulations without vertical flexibility, each crossing is adapted using the same timing
strategy. In strategies with vertical flexibility each crossing is assigned a strategy based on its
variable crossing characteristics. Strategies are assigned using the multinomial regression model
developed in McCurdy and Travis (2016). In that study we found that the Anticipate Strategy
was never selected as having the best outcome, and that there was little difference between the
Reactive and Concurrent strategies. In light of these results we did not compare a vertically-
flexible strategy based on model predictions to either of these strategies.
We evaluate the efficacy of strategies based on installation and flood damage costs
compared to the lowest cost strategy given the crossing characteristics and climate factor. This is
a simple and compartmentalized view of culvert success and in the real world additional costs
and benefits, such as user delay, might be incorporated. Some original simulations included the
cost of user delay but we found the model was very sensitive to small changes in the time length
of delay and the value assigned to an hour of delay. It could easily be included by a decision
maker who better understands the delay tolerance and willingness to pay of their users.
We examine three simulation groups, in which: (1) each crossing is treated with the same
strategy; (2) each crossing is treated with the strategy predicted as the best by the multinomial
model; and (3) each crossing is treated with the lowest cost strategy; henceforth this is the ‘best’
strategy. We compare monolithic and vertically flexible strategies by the difference between the
best strategy for each crossing and the strategies assigned. We contrast the distributions by
examining means and the 90th percentile, and plots comparing the deviations from the best
strategy.

17
Results
The different adaptation strategies pose two flavors of inefficiency: under-adapting or
over-adapting. The Concurrent Strategy reduces the risk of under-adapting and the Nominal
Strategy reduces the risk of over-adapting. At varying levels of climate change we see each of
these outperforming the other.
Monolithic vs. “Best” Strategy
To assess the efficacy of vertical flexibility we compare use of a single strategy for all
crossings (either Nominal or Concurrent), assigning a strategy to each crossing based on results
from a multinomial model that uses the characteristics of individual crossings to predict which
adaptation strategy has an outcome with the least cost. To assess the performance of each
strategy we compared it to the “best” strategy, that is, the one that resulted in the least cost.
Figure 2 shows the changes in mean and 90th
percentile costs across a range of climate change,
from an increase in return interval of 25% to a decrease by a factor of 3 (i.e., the original 100
year event ranges from a 125 year event to a 33 year event).

18
Figure 2- Percent deviation from the most cost-effective strategy vs changes in climate factor. (a) Median
percent deviation from the most cost effective strategy vs climate factor. (b) 99th
percentile percent deviation from the most cost effective strategy vs climate factor. Only in the low ranges of climate change
is the nominal strategy the most cost-effective approach simulated. At the upper tail of events, where
culvert damage and replacements are the most likely, the nominal strategy underperforms the others at all ranges of climate change. The special case of vertical flexibility in which the climate is “known” (that is,
included in the multinomial model predictions, the purple line) provides a wedge of value at low (1 to 1.5)
climate change.
Assuming that a decision maker has additional information about the climate sensitivity
and adaptability of each infrastructure element, we show that they can frequently do better than
the single strategy approach by using a vertically-flexible strategy that accounts for individual
crossing characteristics. The vertically-flexible strategy performed best under moderate increases

19
in flood risk with its efficacy diminishing in situations with no change or a decrease in risk, and
with higher levels of climate change (the left and right ranges in fig 2). Under climate scenarios
with a decrease or a large increase in risk the Nominal or Concurrent strategies (respectively)
became the preferred choice regardless of other crossing characteristics. A vertically-flexible
strategy informed by knowledge of the climate trend provides benefits (reduced costs) at the
lower rates climate change (fig 2 a). Knowing that flow intensity will increase only slightly
(climate factor 1-1.5) over a century allows the decision maker to forego unnecessary up-grades.
As we move more into the right tail of the distribution as shown by the 99th
percentile (figure
2b), the nominal strategy exhibits a greater relative cost increase over the other strategies, and
the value of knowing the rate of climate change is much reduced.
To visualize the full range of results from each strategy we plotted the relative increases
over the least cost adaptation using box and whisker plots (figure 3).
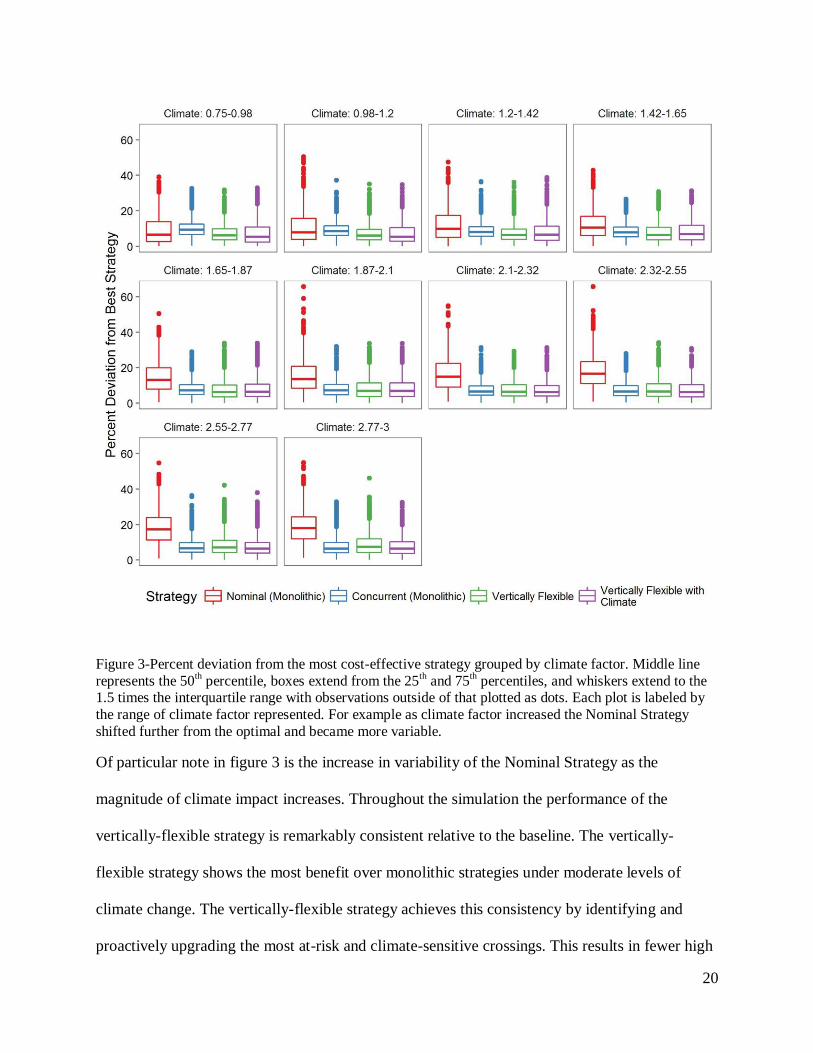
20
Figure 3-Percent deviation from the most cost-effective strategy grouped by climate factor. Middle line
represents the 50th percentile, boxes extend from the 25
th and 75
th percentiles, and whiskers extend to the
1.5 times the interquartile range with observations outside of that plotted as dots. Each plot is labeled by
the range of climate factor represented. For example as climate factor increased the Nominal Strategy
shifted further from the optimal and became more variable.
Of particular note in figure 3 is the increase in variability of the Nominal Strategy as the
magnitude of climate impact increases. Throughout the simulation the performance of the
vertically-flexible strategy is remarkably consistent relative to the baseline. The vertically-
flexible strategy shows the most benefit over monolithic strategies under moderate levels of
climate change. The vertically-flexible strategy achieves this consistency by identifying and
proactively upgrading the most at-risk and climate-sensitive crossings. This results in fewer high

21
losses as compared to monolithic strategies. This result may be of particular interest to managers
aiming to keep upfront cost low in order to meet a budget. It emulates a minimax approach to
risk management, as described by (Kunreuther et al., 2013), while controlling for upfront cost.
Uncertainty in System Characteristics
In the above analysis we assumed that all of the non-climate system characteristics were
known exactly, though in reality these values may not be known or known with some degree of
uncertainty. Since we have no specific knowledge on the difficulty of measuring crossing
characteristics, we treated the standard error for each parameter as a fraction of its original range
shown in table 4. To explore different levels of uncertainties we tested 10%, 30%, and 50% of
the original ranges. We used these values as standard deviations of a normal distribution with a
mean of 0. Random draws from these distributions were added to the original crossing
characteristics used in the model prior to employing the multinomial model for strategy
prediction. Additionally we created a random strategy in which each crossing was assigned either
the Nominal or Concurrent strategy.
Figure 4 shows that the Vertically-Flexible strategy is robust to uncertainty in the values
of crossing characteristics, with uncertainty having a greater impact at higher levels of climate
change. Comparing the results to the random assignment shows model skill even under large
uncertainty in the values of crossing characteristics. Random strategy assignment, while almost
never the ‘best’ strategy in the simulation, is also rarely the ‘worst’. This leads us to suggest that
for a system of similar elements in which each responds differently to adaptation and change, but
with no additional information about how elements will respond, an effective minimax strategy
is diversification. We explore this concept further in the conclusions section.

22
Figure 4- Percent deviation from the most cost-effective strategy vs changes in climate factor. (a) Mean
percent deviation from the most cost effective strategy vs climate factor. (b) 90th
percentile (results from the top decile) percent deviation from the most cost effective strategy vs climate factor. Solid lines show
the standard strategies. The dashed lines show the Vertically-Flexible Strategy determined using variable
crossing characteristics with error added from a normal distribution with mean zero and standard deviation of .1, .3, and .5 times their modeled range. The dotted line shows a simulation in which each
crossing was randomly assigned either the Nominal or Concurrent strategy. For example the “Vertical
Error .05” follows a similar path to the Vertically-Flexible strategy but shifted further from the most cost effective strategy.
Conclusions
Using a testbed of realistic crossings to simulate effects of increasing runoff intensity on
stormwater infrastructure, we found that incorporating vertical flexibility in adaptation, that is
adapting each culvert according to its performance characteristics and climate sensitivities, thus
23
increasing the options available to a decision-maker, can lead to more efficient adaptation than a
monolithic policy strategy. These results indicate that efficiency gains can be found in
dimensions of adaptation decisions that are mediated by existing system characteristics. For
example, managers might focus on infrastructure with a high potential to be adversely impacted
by moderate levels of climate change. Our model assumes that the manager knows individual
culvert characteristics (with some level of uncertainty) and does not incur additional cost to learn
them; the validity of this assumption will vary by agency (Maher, 2015; Jay Meegoda et al.,
2009). Future work could determine how much a decision maker should be willing to pay for this
information. This analysis was also limited to the cost of implementing the strategies and not the
benefits gained by increased crossing reliability. A full economic analysis should include those
benefits and also a realistically-limited budget for crossing improvements. Despite these
simplifications, our work suggests that vertical flexibility could act as a bridge between a
predict-then-act approach governed by broad policies covering a diverse system, and more
nuanced decision strategies based on characteristics of individual elements, even in the face of
deep uncertainty associated with climate change.
The majority of climate sensitive infrastructure decisions made over the next 100 years
will not be for large projects costing hundreds of millions of dollars. The majority will be made
at the local level for projects costing tens or hundreds of thousands of dollars. While the cost of
failure for any one installation will be minor, the collective costs, of either under- or over-
adaptation, are potentially quite large. Our results show that even a naïve, random strategy
choice is an improvement over a monolithic policy approach, suggesting that simple
diversification may be an efficient strategy in the face of climate change. This conclusion
motivates the comparison of a group of dispersed infrastructure to a portfolio of investments. It is
24
common knowledge that diversification can be an effective method for reducing investment risk.
By designing the infrastructure portfolio to various levels of climate change, a decision maker
can insure that a larger portion of their investment will perform well under varying levels of
change. Modern Portfolio Theory (Markowitz, 1952) suggests that each investment is evaluated
by how it contributes to the overall portfolio. It also evaluates the correlation of individual
investments. In the case of infrastructure, a manager can evaluate the correlation of risk based on
possible future conditions and on geographic correlation. Recent advances in decision-making
strategies for climate adaptation under deep uncertainty provide a diverse set of options for
managers. For large infrastructure installation and maintenance, such as water supply and coastal
or urban flood protection, these techniques can help managers improve the efficiency of costly
and complex decisions. Optimal and robust techniques may be time- and cost-intensive,
requiring additional expertise and computational resources. As climate change alters the
hydrologic cycle decisions about long-lived infrastructure such as culverts will be made at all
levels of government, many of them with limited capacity and resources to support decision
making strategies that incorporate horizontal and outcome flexibility. Indeed, the United States
National Climate Assessment identifies rural communities as a unique adaptation challenge due
to their limited institutional capacity and a lack of economic diversity (Melillo, Richmond, &
Yohe, 2014). Approximately 70% of US road miles are in rural areas, many of them managed by
small towns and counties. Vertically-flexible adaptation policies and guidelines can help those
decision-makers work in a familiar framework and evaluate adaptation choices based on
expertise and experience they already have.
25
References
Adger, N., W., Arnell, N. W., & Tompkins, E. L. (2005). Successful adaptation to climate
change across scales. Global Environmental Change, 15(2), 77–86.
http://doi.org/10.1016/j.gloenvcha.2004.12.005
Agard, J., & Schipper, L. (2014). WGIIAR5-Glossary. In Climate Change 2014: Impacts,
Adaptation, and Vulnerability. Part A: Global and Sectoral Aspects. Contribution of
Working Group II to the Fifth Assessment Report of the Intergovernmental Panel on
Climate Change (pp. 1757–1776). Cambridge, United Kingdom: Cambridge University
Press.
Bankes, S. (1993). Exploratory modeling for policy analysis. Operations Research, 41(3), 435–
449.
Brown, C., Ghile, Y., Laverty, M., & Li, K. (2012). Decision scaling: Linking bottom-up
vulnerability analysis with climate projections in the water sector: Decision Scaling-
Linking Vulnerability Analysis. Water Resources Research, 48(9), n/a–n/a.
http://doi.org/10.1029/2011WR011212
Coles, S. (2001). An Introduction to Statistical Modeling of Extreme Values. London: Springer
London. Retrieved from http://link.springer.com/10.1007/978-1-4471-3675-0
Colorado Department of Transportation. (2004). Chapter 7 Hydrology. In CDOT Drainage
Design Manual.
Colorado Department of Transportation. (2016). Archived Bid Tabs [Government]. Retrieved
March 19, 2016, from https://www.codot.gov/business/bidding/Bid%20Tab%20Archives
Donat, M. G., Lowry, A. L., Alexander, L. V., O’Gorman, P. A., & Maher, N. (2016). More
extreme precipitation in the world’s dry and wet regions. Nature Climate Change,
advance online publication. http://doi.org/10.1038/nclimate2941
26
Exec. Order No. (2015, January 30). Retrieved from https://www.whitehouse.gov/the-press-
office/2015/01/30/executive-order-establishing-federal-flood-risk-management-standard-
and-
Exec. Order No 13690. (2014, February 4). 80 Fed. Reg. 23.
Federal Highway Administration. (2012). Hydraulic Design of Highway Culverts. Washington,
D.C.: United States Department of Transportation.
Field, C. B., Barros, V., Stocker, T. F., Qin, D., Dokken, D. J., Ebi, K. L., … Midgley, P. M.
(2012). IPCC: Managing the risks of extreme events and disasters to advance climate
change adaptation. Cambridge, UK: Cambridge University Press.
Gibbs, M. T. (2012). Time to re-think engineering design standards in a changing climate: the
role of risk-based approaches. Journal of Risk Research, 15(7), 711–716.
http://doi.org/10.1080/13669877.2012.657220
Haasnoot, M., Kwakkel, J. H., Walker, W. E., & ter Maat, J. (2013). Dynamic adaptive policy
pathways: A method for crafting robust decisions for a deeply uncertain world. Global
Environmental Change, 23(2), 485–498. http://doi.org/10.1016/j.gloenvcha.2012.12.006
Haasnoot, M., Middelkoop, H., Offermans, A., Beek, E. van, & Deursen, W. P. A. van. (2012).
Exploring pathways for sustainable water management in river deltas in a changing
environment. Climatic Change, 115(3-4), 795–819. http://doi.org/10.1007/s10584-012-
0444-2
Haasnoot, M., Middelkoop, H., van Beek, E., & van Deursen, W. P. A. (2011). A method to
develop sustainable water management strategies for an uncertain future. Sustainable
Development, 19(6), 369–381. http://doi.org/10.1002/sd.438

27
Hallegatte, S. (2009). Strategies to adapt to an uncertain climate change. Global Environmental
Change, 19(2), 240–247. http://doi.org/10.1016/j.gloenvcha.2008.12.003
Hallegatte, S., Shah, A., Lempert, R., Brown, C., & Gill, S. (2012). Investment decision making
under deep uncertainty. Background Paper Prepared for This Report. World Bank,
Washington, DC. Retrieved from http://www-
wds.worldbank.org/servlet/WDSContentServer/WDSP/IB/2013/01/09/000158349_20130
109112237/Rendered/PDF/wps6193.pdf
Iglesias, A., Quiroga, S., Moneo, M., & Garrote, L. (2011). From climate change impacts to the
development of adaptation strategies: Challenges for agriculture in Europe. Climatic
Change, 112(1), 143–168.
IPCC (2007). Climate Change 2007: The Physical Science Basis. Contribution of Working
Group I to the Fourth Assessment Report of the Intergovernmental Panel on Climate
Change [Solomon, S., D. Qin, M. Manning, Z. Chen, M. Marquis, K.B. Averyt, M.
Tignor and H.L. Miller (eds.)]. Cambridge University Press, Cambridge, United
Kingdom and New York, NY, USA, 996 pp.
Irene Recovery Office. (2013). Irene Recovery Status Report. State of Vermont. Retrieved from
http://www.vermontdisasterrecovery.com/sites/www.vermontdisasterrecovery.com/theme
s/vdr/uploads/pdfs/2013-IRO-final-report.pdf
Kirtman, B., S.B. Power, J.A. Adedoyin, G.J. Boer, R. Bojariu, I. Camilloni, F.J. Doblas-Reyes,
A.M. Fiore, M. Kimoto, G.A. Meehl, M. Prather, A. Sarr, C. Schär, R. Sutton, G.J. van
Oldenborgh, G. Vecchi and H.J. Wang (2013) Near-term Climate Change: Projections
and Predictability. In: Climate Change 2013: The Physical Science Basis. Contribution of
Working Group I to the Fifth Assessment Report of the Intergovernmental Panel on

28
Climate Change [Stocker, T.F., D. Qin, G.-K. Plattner, M. Tignor, S.K. Allen, J.
Boschung, A. Nauels, Y. Xia, V. Bex and P.M. Midgley (eds.)]. Cambridge University
Press, Cambridge, United Kingdom and New York, NY, USA.
Kunreuther, H., Heal, G., Allen, M., Edenhofer, O., Field, C. B., & Yohe, G. (2013). Risk
management and climate change. Nature Climate Change, 3(5), 447–450.
http://doi.org/10.1038/nclimate1740
Kwakkel, J. H., Haasnoot, M., & Walker, W. E. (2012). Computer assisted dynamic adaptive
policy design for sustainable water management in river deltas in a changing
environment. In 2012 International Congress on Environmental Modelling and Software.
Leipzig, Germany: International Environmental Modelling and Software Societ.
Retrieved from http://dspace.library.uu.nl/handle/1874/281750
Kwakkel, J. H., Haasnoot, M., & Walker, W. E. (2014). Developing dynamic adaptive policy
pathways: a computer-assisted approach for developing adaptive strategies for a deeply
uncertain world. Climatic Change. http://doi.org/10.1007/s10584-014-1210-4
Lempert, R. J., & Groves, D. G. (2010). Identifying and evaluating robust adaptive policy
responses to climate change for water management agencies in the American west.
Technological Forecasting and Social Change, 77(6), 960–974.
http://doi.org/10.1016/j.techfore.2010.04.007
Lempert, R. J., Popper, S. W., & Bankes, S. C. (2003). Shaping the next one hundred years: new
methods for quantitative, long-term policy analysis. Rand Corporation.
Linquiti, P., & Vonortas, N. (2012). The value of flexibility in adapting to climate change: a real
options analysis of investments in coastal defense. Climate Change Economics, 3(02).
Retrieved from http://www.worldscientific.com/doi/abs/10.1142/S201000781250008X

29
Maher, M. (2015). Service life of culverts. Washington, DC: Transportation Research Board of
the National Academies.
Mahoney, K., Alexander, M. A., Thompson, G., Barsugli, J. J., & Scott, J. D. (2012). Changes in
hail and flood risk in high-resolution simulations over Colorado’s mountains. Nature
Climate Change, 2(2), 125–131. http://doi.org/10.1038/nclimate1344
Mailhot, A., & Duchesne, S. (2009). Design criteria of urban drainage infrastructures under
climate change. Journal of Water Resources Planning and Management. Retrieved from
http://ascelibrary.org/doi/10.1061/(ASCE)WR.1943-5452.0000023
Markowitz, H. (1952). Portfolio Selection. The Journal of Finance, 7(1), 77–91.
http://doi.org/10.1111/j.1540-6261.1952.tb01525.x
McCurdy, A. and W. Travis (2016) Simulated climate adaptation in stormwater systems:
Evaluating the efficiency of adaptation pathways. Working Paper. Western Water
Assessment, University of Colorado Boulder. [Available at:
http://wwa.colorado.edu/climate/extremes/McCurdy_Travis_Pathways_WP.pdf ]
Meegoda, J., Juliano, T., & Tang, C. (2009). Culvert information management system.
Transportation Research Record: Journal of the Transportation Research Board, (2108),
3–12.
Melillo, J. M., Richmond, T. C., & Yohe, G. W. (2014). Climate change impacts in the United
States: the third national climate assessment. US Global Change Research Program, 841.
Milly, P. C. D., Betancourt, J., Falkenmark, M., Hirsch, R. M., Kundzewicz, Z. W., Lettenmaier,
D. P., & Stouffer, R. J. (2008). Climate change. Stationarity is dead: whither water
management? Science (New York, N.Y.), 319(5863), 573–574.
http://doi.org/10.1126/science.1151915

30
Milly, P. C. D., Wetherald, R. T., Dunne, K. A., & Delworth, T. L. (2002). Increasing risk of
great floods in a changing climate. Nature, 415(6871), 514–517.
http://doi.org/10.1038/415514a
O’Gorman, P. A. (2015). Precipitation extremes under climate change. Current Climate Change
Reports, 1(2), 49–59.
Olsen, J.R., ed., (2015) Adapting Infrastructure and Civil Engineering Practice to a Changing
Climate. American Society of Civil Engineers, Reston, VA, p. 93.
Park, G.-J., Lee, T.-H., Lee, K. H., & Hwang, K.-H. (2006). Robust design: an overview. AIAA
Journal, 44(1), 181–191.
Ranger, N., Reeder, T., & Lowe, J. (2013). Addressing “deep” uncertainty over long-term
climate in major infrastructure projects: four innovations of the Thames Estuary 2100
Project. EURO Journal on Decision Processes, 1(3-4), 233–262.
http://doi.org/10.1007/s40070-013-0014-5
Read, L. K., & Vogel, R. M. (2015). Reliability, return periods, and risk under nonstationarity.
Water Resources Research, n/a–n/a. http://doi.org/10.1002/2015WR017089
Smit, B., Burton, I., Klein, R. J. T., & Wandel, J. (2000). An Anatomy of Adaptation to Climate
Change and Variability. Climatic Change, 45(1), 223–251.
http://doi.org/10.1023/A:1005661622966
Tebaldi, C., Hayhoe, K., Arblaster, J. M., & Meehl, G. A. (2006). Going to the extremes.
Climatic Change, 79(3-4), 185–211.
Tompkins, E. L., & Adger, Wn. (2004). Does adaptive management of natural resources enhance
resilience to climate change? Ecology and Society, 9(2), 10.

31
Walker, W. E., Haasnoot, M., & Kwakkel, J. H. (2013). Adapt or Perish: A Review of Planning
Approaches for Adaptation under Deep Uncertainty. Sustainability, 5(3), 955–979.
http://doi.org/10.3390/su5030955
Walker, W. E., Rahman, S. A., & Cave, J. (2001). Adaptive policies, policy analysis, and policy-
making. European Journal of Operational Research, 128(2), 282–289.
http://doi.org/10.1016/S0377-2217(00)00071-0
Walsh, J., D. Wuebbles, K. Hayhoe, J. Kossin, K. Kunkel, G. Stephens, P. Thorne, R. Vose, M.
Wehner, J. Willis, D. Anderson, S. Doney, R. Feely, P. Hennon, V. Kharin, T. Knutson,
F. Landerer, T. Lenton, J. Kennedy, R. Somerville, (2014) Our Changing Climate, in:
Melillo, J.M., Richmond, T.C., Yohe, G.W. (Eds.), Climate Change Impacts in the
United States: The Third National Climate Assessment. U.S. Global Change Research
Program, Washington, DC, pp. 19-67.
Walthall, C. L., Hatfield, J., Backlund, P., Lengnick, L., Marshall, E., Walsh, M., … Ziska, L. H.
(2012). Climate Change and Agriculture in the United States: Effects and Adaptation.
Washington, D.C.: United States Department of Agriculture.
Woodward, M., Gouldby, B., Kapelan, Z., Khu, S.-T., & Townend, I. (2011). Real Options in
flood risk management decision making. Journal of Flood Risk Management, 4(4), 339–
349. http://doi.org/10.1111/j.1753-318X.2011.01119.x
Woodward, M., Kapelan, Z., & Gouldby, B. (2014). Adaptive Flood Risk Management Under
Climate Change Uncertainty Using Real Options and Optimization. Risk Analysis, 34(1),
75–92. http://doi.org/10.1111/risa.12088

32
Wuebbles, D. J., Kunkel, K., Wehner, M., & Zobel, Z. (2014). Severe weather in United States
under a changing climate. Eos, Transactions American Geophysical Union, 95(18), 149–
150.
Recommended