Wisconsin’s Market for Individual Health Coverage and
Preliminary Reinsurance Estimates Preliminary Summary Report
February 2, 2018
Executive Summary
This report provides background information and preliminary estimates for a $200 million
annual reinsurance program to stabilize Wisconsin’s individual health insurance market
beginning in 2019, as proposed in Assembly bill 885.1 The bill would create a $200 million
reinsurance fund contingent on a Section 1332 waiver of the federal Affordable Care Act
(ACA). The 1332 waiver process directs the federal government to refund or “pass through”
federal savings resulting from the state reforms. We estimate that federal funding under the
waiver would be approximately 75 percent ($150 million per year). Thus, annual net state
costs would be approximately $50 million per year. Importantly, the exact federal funding
rate would be determined only after the state’s 1332 waiver application was approved later
in 2018 and is therefore somewhat uncertain.
Individual Market in Crisis: Since the launch of the ACA, Wisconsin’s market for individual
health coverage has been very volatile. Enrollment has lagged expectations and skewed
toward older and sicker enrollees. Facing large losses, several major multi-state health
insurers have exited the market. Wisconsin’s ACA-qualified individual market premiums
increased by an average of 17 percent in 2017 and we estimate they will jump by 38
percent in 2018 (weighted by enrollment). Enrollment declined from a peak of nearly
234,000 in 2016 to an estimated 214,000 in 2017, and we project a continued decline of
nearly 20,000 enrollees in 2018 (see Summary Table 1).
Summary Table 2 outlines the losses incurred by Wisconsin’s individual market insurers
since 2014. This table shows a measure of Wisconsin insurers’ financial results called the
“loss ratio” or “medical loss ratio (MLR)” in the ACA market. In general, MLRs between 85
and 92 percent are consistent with a stable market that is attractive to new health plans and
competition. This is because insurers customarily need premium revenue to exceed claims
1 https://docs.legis.wisconsin.gov/2017/related/proposals/ab885/6/_9
Summary Table 1. Enrollment and Premium Increases in ACA-Qualified Individual Health Plans
2014 2015 2016 2017est 2018est
Enrollment as of December 31 (covered lives) 155,700 213,900 233,900 214,000 194,500
Annual Premium Increase (weighted average by enrollment) 5% 8% 17% 38%Source: Horizon Government Affairs based on data from OCI.

2
costs by at least 8-15 percent to account for staffing, claims processing and IT, marketing
and customer service, and profits or additions to reserves. MLRs below 80 percent mean
that health plans are likely making substantial profits or adding to their reserve funds.
When this occurs, regulators may ask for future premium reductions and the ACA requires
rebates to consumers. On the other hand, MLRs of greater than 90 or 92 percent may raise a
yellow caution flag for regulators, as health insurers’ premiums may not be sufficient to
cover claims payments plus administrative costs. During the 2014-2016 period, Wisconsin
insurers’ losses were mitigated substantially (but not eliminated) by the ACA’s transitional
reinsurance program.
Rapid premium increases in 2017 and 2018 have been caused both by prior losses incurred
by Wisconsin health plans and by the cessation of federal payments to health plans that are
required to reduce cost-sharing (deductibles and copayments) to certain lower-income
enrollees. These are the so-called Cost-Sharing Reduction (CSR) payments. Wisconsin’s
insurers raised premiums sharply for silver-tier plans (those used by CSR enrollees) in
2018 to compensate for the loss of federal funds.
In 2019, insurers may require additional premium increases to address the impact of the
repeal of the penalties for people who remain uninsured, the “individual mandate.” The
Congressional Budget Office (CBO) estimates that the repeal of the individual mandate in
2018 could cause premiums to rise by an additional 10 percent nationally, although the
impact in Wisconsin is uncertain.
Impact of Reinsurance Program in 2019 and 2020: The proposed $200 million annual
reinsurance fund would reduce premium rates in Wisconsin’s individual market by
approximately 13 percent in 2019, from a projected 15 percent increase absent reform to a
2 percent increase after reinsurance was in place. In 2020, the reinsurance fund would
reduce premiums by 12 percent, from a projected pre-reform 10 percent increase to a 2
percent decline (-2%) post reinsurance. With premium increases stabilized, we project that
enrollment would also stabilize, with nearly 10,000 additional enrollees in 2019 and more
than 22,000 added in 2020 (see Summary Table 3).
Summary Table 2. Aggregated Wisconsin Individual ACA Market Results and Impact of Transitional Reinsurance
2014 2015 2016 2017est 2018est
Earned Premiums (millions) 837 1,132 1,302 1,393 1,751
Incurred Claims 972 1,324 1,322 1,296 1,497
Pre-Reinsurance Loss Ratio or "MLR" (percent) 116% 117% 102% 93% 86%
Transitional Reinsurance (millions, 2016 is preliminary) 211 182 94 0 0
Post-Reinsurance Loss Ratio 91% 101% 94% 93% 86%
Reinsurance Impact on Premiums -22% -14% -8% 0% 0%Source: Horizon Government Affairs based on data from CMS/ASPE and NAIC.

3
Federal “Pass-Through” Funding and Budgetary Considerations: We estimate that
Wisconsin’s likely pass-through rate would be between 70 and 80 percent, with our best
current estimate of 75 percent. However, it is important to note that CMS and the Treasury
Department, the federal agencies administering the ACA, will compute the final pass-
through rate. Thus, it would be prudent to plan for a possible range of federal funding levels.
We also estimate that the pass-through rate would be 3-4 percentage points lower if the
Wisconsin reinsurance program applied to pre-ACA plans (transitional plans and so-called
“grandfathered” plans) that offer renewable non-ACA compliant coverage in the individual
market. (Transitional plans are slated for elimination after 2018, but it is possible they will
be renewed.) For planning purposes, we believe a worst-case possible scenario for federal
funding would be about 60 percent.
On the other hand, Congress is currently considering proposals that would provide
additional federal funds or “seed money” to help states launch 1332 waivers for reinsurance
programs. A possible, but less likely, approach would also provide a resumption of CSR
funding, which would allow Wisconsin insurers to reduce silver-tier premiums
considerably. We will continue to monitor federal developments that could affect the
budgetary impact of Wisconsin’s proposed reinsurance program.
Background
Since the implementation of the ACA in 2014, Wisconsin’s market for individual health
insurance coverage has been very volatile. Enrollment has shifted from insurer to insurer as
companies reduce their service areas and, in some cases, exit the individual health
insurance market altogether. In 2018, over 75,000 people in the ACA’s exchange market
(where subsidies are available to lower-income enrollees) were forced to change plans due
to insurers exiting their county. Figure 1 shows the shrinking numbers of on-exchange
plans available by county.
Summary Table 3. Impact of Proposed Reinsurance Fund in 2019 and 2020
2017est 2018est 2019proj 2020proj
Pre-Reform
Enrollment as of December 31 (covered lives) 214,000 194,500 175,100 166,300
Annual Premium Increase (weighted average) 17% 38% 15% 10%
Post-Reinsurance
Enrollment as of December 31 (covered lives) 214,000 194,500 184,700 188,500
Annual Premium Increase (weighted average) 17% 38% 2% -2%
Impact of Reinsurance
Enrollment as of December 31 (covered lives) 9,600 22,200
Annual Premium Increase (weighted average) -13% -12%Source: Horizon Government Affairs.
Note: Preliminary projections subject to change based on updated OCI and CMS data.
4
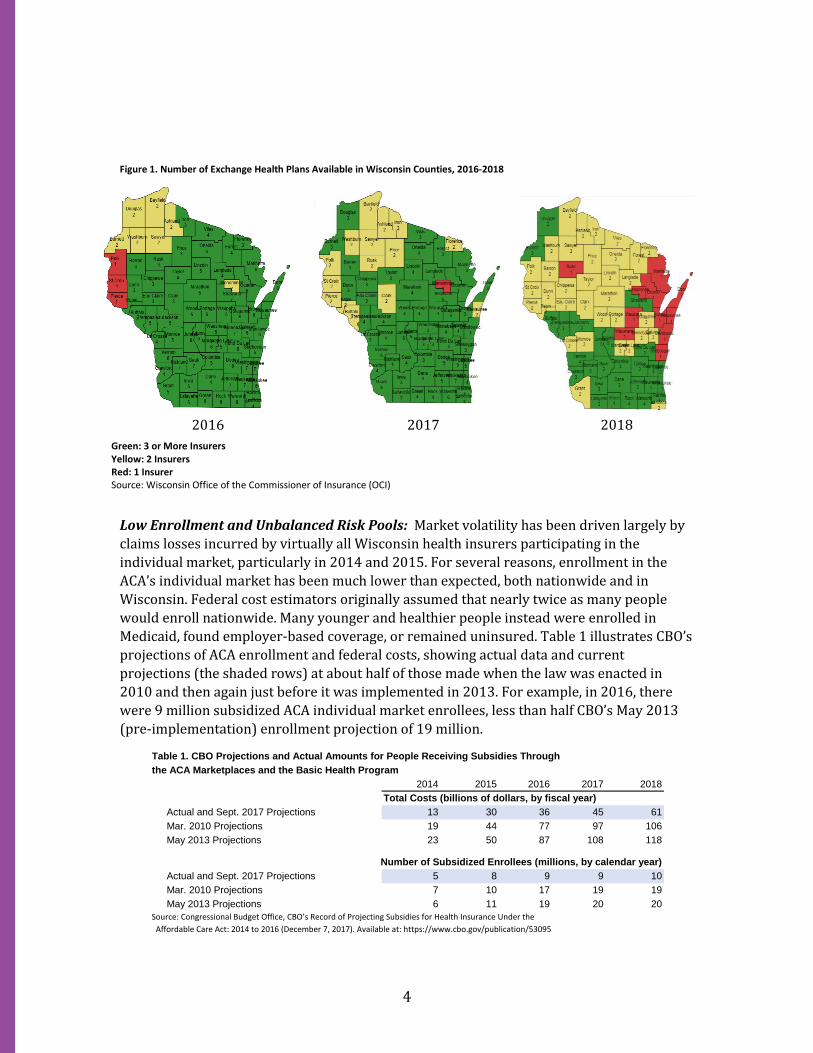
Figure 1. Number of Exchange Health Plans Available in Wisconsin Counties, 2016-2018
2016 2017 2018
Low Enrollment and Unbalanced Risk Pools: Market volatility has been driven largely by
claims losses incurred by virtually all Wisconsin health insurers participating in the
individual market, particularly in 2014 and 2015. For several reasons, enrollment in the
ACA’s individual market has been much lower than expected, both nationwide and in
Wisconsin. Federal cost estimators originally assumed that nearly twice as many people
would enroll nationwide. Many younger and healthier people instead were enrolled in
Medicaid, found employer-based coverage, or remained uninsured. Table 1 illustrates CBO’s
projections of ACA enrollment and federal costs, showing actual data and current
projections (the shaded rows) at about half of those made when the law was enacted in
2010 and then again just before it was implemented in 2013. For example, in 2016, there
were 9 million subsidized ACA individual market enrollees, less than half CBO’s May 2013
(pre-implementation) enrollment projection of 19 million.
Table 1. CBO Projections and Actual Amounts for People Receiving Subsidies Through
the ACA Marketplaces and the Basic Health Program
2014 2015 2016 2017 2018
Total Costs (billions of dollars, by fiscal year)
Actual and Sept. 2017 Projections 13 30 36 45 61
Mar. 2010 Projections 19 44 77 97 106
May 2013 Projections 23 50 87 108 118
Number of Subsidized Enrollees (millions, by calendar year)
Actual and Sept. 2017 Projections 5 8 9 9 10
Mar. 2010 Projections 7 10 17 19 19
May 2013 Projections 6 11 19 20 20
Source: Congressional Budget Office, CBO’s Record of Projecting Subsidies for Health Insurance Under the
Affordable Care Act: 2014 to 2016 (December 7, 2017). Available at: https://www.cbo.gov/publication/53095
Green: 3 or More Insurers Yellow: 2 Insurers Red: 1 Insurer Source: Wisconsin Office of the Commissioner of Insurance (OCI)

5
As a result, risk pools in Wisconsin and most other states have been unexpectedly skewed
toward older and sicker enrollees. Based on data from when consumers were making
selections for health coverage in 2017, 27 percent of consumers were between ages 55 and
64 (inclusive) in the U.S. overall. However, 34 percent of Wisconsin consumers were in that
age range. Likewise, 19 percent of U.S. individual market consumers were in the 26-34 age
range, versus only 16 percent in Wisconsin. (Note that not all exchange consumers who
selected a plan activated their enrollment by paying the premiums.)
Market Fragility: Our assessment for 2018 and 2019 is that Wisconsin’s individual market
is very fragile. As enrollment has shrunk, the market is now dominated by two types of
enrollees: those whose premiums are heavily subsidized by the federal tax credit system
(APTC) and people with chronic illnesses and high healthcare needs, who must purchase
health coverage regardless of the cost. Healthier people with incomes too high to qualify for
the APTC (above 400 percent of the federal poverty level) face increasingly difficult
decisions about whether they can afford to stay in the market.
For 2018, Wisconsin’s average premium increase will be approximately 38 percent.
Premium increases of that magnitude are likely to cause tens of thousands more people to
disenroll. However, we do not know at this time whether the market will enter a so-called
“death spiral,” where relatively younger and healthier enrollees continue to drop out at
such a rapid rate that premium increases can’t catch up.
We are also uncertain about the impact of the new federal tax law2, which repealed the
penalties for persons who do not have qualified health coverage, the so-called “individual
mandate.” The CBO assumes that the individual mandate repeal will worsen risk pools as
some younger, healthier people no longer feel compelled to purchase coverage, and that
premiums would need to rise subsequently by an additional 10 percent. The impact of the
individual mandate repeal will start to affect Wisconsin enrollment in 2018 and premiums
in 2019.
2 Public Law 115-97, available at https://www.congress.gov/115/crpt/hrpt466/CRPT-115hrpt466.pdf
Table 2. ACA MarketPlace Selections by Age Group, U.S. vs. Wisconsin, 2017
Total Number of Consumers Who Have Selected a
Marketplace (Exchange) Plan Wisconsin Nationwide
Age < 18 16,519 7% 1,068,082 14%
Age 18-25 21,073 9% 1,268,102 9%
Age 26-34 39,512 16% 2,041,434 19%
Age 35-44 34,580 14% 1,929,112 15%
Age 45-54 46,823 19% 2,530,669 16%
Age 55-64 83,444 34% 3,270,921 27%
Source: Health Insurance Marketplaces 2017 Open Enrollment Period: Final State-Level Public Use File

6
Figure 2 shows Wisconsin’s average premiums and those nationwide on a per member, per
month (PMPM) basis. Average premiums in the state were slightly higher than the
nationwide average in the 2014-2017 period, but likely surged well higher than the national
average in 2018. Although projections of these volatile markets are highly uncertain, we are
confident that premiums will likely continue to grow at double-digit rates absent state-led
reform.
Figure 2.
Source: Horizon Government Affairs, based on data from CMS and HHS.
Note: Preliminary and subject to revision.
Reinsurance and State-Based 1332 Waivers: To help stabilize premium increases in their
markets, some states have launched state-based reinsurance programs using a combination
of state funding or assessments and federal “pass-through” funding, which is available
under the ACA for states that pursue “waivers” of certain ACA provisions. These waivers are
known as 1332 waivers, after the section of the ACA that authorized them.
The pass-through funding is available from the federal government when states’ 1332
waivers reduce federal costs for the APTC. For example, reinsurance programs that reduce
premiums for consumers also reduce federal APTC subsidy costs. The 1332 waivers allow
for those reduced premium subsidy costs to be passed back to states if the overall impact of
the 1332 waiver is budget-neutral for the federal government.
Alaska and Minnesota have launched state-based reinsurance programs under 1332
waivers. Alaska expects to get federal pass-through funding sufficient to offset about 90
0
100
200
300
400
500
600
700
800
2014 2015 2016 2017 2018
ACA Individual Market Premiums(Average, Per Member Per Month)
U.S. Wisconsin

7
percent of the state’s original funding.3 Minnesota is expecting about a 50 percent pass-
through offset for the state’s fund. Alaska’s program achieved an immediate premium
reduction of approximately 35 percent, from a projected 42 percent increase to a 7 percent
increase.4 The impact in Minnesota has also been immediate, reducing statewide premiums
by about 20 percent.5
Our preliminary assumption is that Wisconsin could likely expect a 75 percent pass-through
rate for federal funding. That is, if the state committed to operating a $200 million reinsurance program, the federal government would pay the state $150 million to account
for the federal APTC savings. The federal pass-through funding thus covers a large portion
of the program’s expenses, with the state’s investment of $50 million. Figure 3 illustrates
the impact of a reinsurance program of that magnitude on rates and enrollment.
Figure 3. Impact of $200 Million Reinsurance Fund (Wisconsin net cost $50 million)
Source: Horizon Government Affairs, based on data from CMS and HHS.
Note: Preliminary and subject to revision.
Baseline Projections and Data Approach
Our preliminary estimates are built from data on enrollment and premium rate changes
from the Wisconsin Office of the Commissioner of Insurance (OCI), and on overall claims,
premiums, and transitional reinsurance payments from rate review and other public use
information files published by the federal Department of Health and Human Services (HHS),
3 Source: https://www.cms.gov/CCIIO/Programs-and-Initiatives/State-Innovation-Waivers/Downloads/Alaska-STCs-signed-by-Treasury.pdf 4 Naomi Klouda, “State granted waiver to continue reinsurance program,” Alaska Journal of Commerce (posted 07/11/2017 - 3:46pm), available at: http://www.alaskajournal.com/2017-07-11/state-granted-waiver-continue-reinsurance-program#.WlEriN-nHD4 5 Minnesota Commerce Department, 2018 Health Insurance Rate Summary, Minnesota Individual and Small Group Markets (October 2, 2017), available at: http://mn.gov/commerce-stat/pdfs/rate-release-packet-2018.pdf
-10%
0%
10%
20%
30%
40%
50%
2017 2018 2019 2020
Annual Premium Increase
Baseline Option $200m Reinsurance
100,000
120,000
140,000
160,000
180,000
200,000
220,000
2017 2018 2019 2020
Enrollment
Baseline Option $200m Reinsurance

8
particularly the Centers for Medicare and Medicaid Services (CMS), which administers much
of the ACA.
Final data for end-of-year 2017 enrollment in Wisconsin from OCI, updated 10-year
projections of health spending details from CMS, and additional information about 2018
enrollment activations from HHS will become available in the coming weeks. In addition,
OCI may conduct additional surveys of preliminary 2017 results and other data points from
Wisconsin insurers in support of the proposed waiver application. The expected new data from both OCI and HHS/CMS will likely cause minor adjustments and revisions to the
estimates.
Baseline Projections and Assumptions (Assuming No Reinsurance): Health plans’
ongoing decisions whether or not to retreat from the Wisconsin market and consumer
responses to rapid premium increases make any predictions for the market in the 2019-
2020 period highly uncertain. Our preliminary baseline (absent reinsurance) assumes that
the market will continue to worsen, but will not immediately collapse or rapidly enter an
unsustainable “death spiral.” Of course, enrollees in counties with only one remaining
exchange insurer are at higher risk of losing access to coverage more rapidly.
Most subsidized consumers are protected from the 2018 rate increases by the APTC subsidy
formula, which limits consumers’ share of the premium based on their incomes. This
insulates many APTC-eligible enrollees from premium increases. Moreover, some of the key
insurers remaining in Wisconsin’s individual market have deep roots in communities and
links with local health systems.
However, consumers with rising incomes will find that their APTC subsidy level falls just as
premiums are surging. This will create an affordability crisis for many. Some will be able to
gain employer-based coverage as their incomes rise. Others may drop coverage altogether.
If relatively younger and healthier people continue to drop individual market coverage,
either to be uninsured or to join an employer plan, the individual market risk pool would
worsen.
On balance, our baseline projects that premium increases will average about 15% in 2019
and 10% in 2020, in both Wisconsin and nationwide, as the combined impacts of the 2017
and 2018 rate increases further reduce enrollment, but as health plans return to more
sustainable loss ratios. We estimate that the impact of the repeal of the individual mandate
penalties in 2018 will further reduce enrollment and raise premiums, but not nearly to the
extent which CBO estimates.
Table 3 illustrates our baseline assumptions for the composition of total premium increases,
and the resulting average premium levels (per member per month, or “PMPM”), both for
our Wisconsin baseline and nationwide. Absent reform, we estimate Wisconsin’s premiums
will continue to exceed national averages by a substantial margin.

9
CBO estimates that nationwide markets will suffer greatly from the repeal of the individual
mandate, with coverage reduced by roughly one-third between 2018 and 2021. CBO
assumes premiums will rise by about 15-20 percent in 2019 and again in 2020, as risk pools
worsen before re-stabilizing in about 2021. These estimates are based on our
interpretations of CBO’s September 2017 baseline6 and the agency’s estimate of the
individual mandate repeal.7
Although there is a high degree of uncertainty, we believe CBO may be too pessimistic about
the impact of the individual mandate repeal, particularly regarding Wisconsin’s market. As a
result, our baseline shows a somewhat smaller impact of the individual mandate repeal in
Wisconsin than CBO predicts nationwide. Table 4 shows our preliminary estimate of the
Wisconsin individual market’s current trajectory absent reform.
6 https://www.cbo.gov/sites/default/files/recurringdata/51298-2017-09-healthinsurance.pdf 7 https://www.cbo.gov/publication/53300
Table 3. Premium Trends and Baseline Assumptions, ACA Individual Market, U.S. and Wisconsin
2014 2015 2016 2017est 2018est 2019proj 2020proj
U.S.
Underlying Trend 5% 5% 5% 5% 5% 5% 5%Transitional Reinsurance Withdrawal 7% 8% 5% 0% 0% 0%Residual (Initial Underpricing, Risk Pool Deterioration) -7% -4% 12% 21% 0% 0%
Individual Mandate Repeal (additional risk pool deterioration) 0% 0% 0% 0% 10% 5% Total Premium Increase 4% 8% 23% 27% 15% 10%National Weighted Avg Premium (pmpm) 341 356 386 476 605 695 765
Wisconsin Underlying Trend 5% 5% 5% 5% 5% 5% 5%Transitional Reinsurance Withdrawal 9% 8% 8% 0% 0% 0%
Residual (Initial Underpricing, Risk Pool Deterioration) -8% -5% 3% 32% 0% 0%
Individual Mandate Repeal (additional risk pool deterioration) 0% 0% 0% 0% 10% 5%
Total Premium Increase 5% 8% 17% 38% 15% 10%
Statewide weighted Avg Premium (pmpm) 386 407 440 514 710 817 899Source: Horizon Government Affairs based on data from OCI and CMS/ASPE.
Notes: pmpm = per member per month. Preliminary estimates and projections are subject to change.
Premium levels pmpm from : https://aspe.hhs.gov/system/files/pdf/256751/IndividualMarketPremiumChanges.pdf
Table 4. Baseline (No Reform) Projections Through 2020
Aggregated WI Individual ACA Market Results and Initial Draft Projections Assuming No Reform (Current Policy)
2014 2015 2016 2017est 2018proj 2019proj 2020proj
Baseline Scenario
Earned Premiums (millions) 837 1,132 1,302 1,393 1,751 1,812 1,893
Incurred Claims 972 1,324 1,322 1,296 1,497 1,550 1,619
Loss Ratio (percent) 116% 117% 102% 93% 86% 86% 86%
Transitional Reinsurance (millions, 2016 is prelim) 211 182 94 0 0 0 0
Post Reinsurance Loss Ratio 91% 101% 94% 93% 86% 86% 86%
Enrollment December 31 (covered lives) 155,700 213,900 233,900 214,000 194,500 175,100 166,300
Weighted Avg Premium Increase 5% 8% 17% 38% 15% 10%
Average Premium (per member per month) 386 407 440 514 710 817 899Source: Horizon Government Affairs based on data from CMS/ASPE and NAIC.
Note: Preliminary projections subject to change based on updated OCI and CMS data.

10
Importantly, we are assuming that health plans’ loss ratios are stable in our baseline. This is
an assumption of convenience, not a prediction. In reality, health plans don’t know whether
Wisconsin’s consumers will be more resilient (as in our baseline) or more likely to drop
coverage (as in CBO’s estimation). As a result, given the uncertainty, plans will likely
continue to have difficulty pricing their policies correctly, and it is not unreasonable to
believe that some will have loss ratios that exceed or undershoot expectations. In short,
while projections tend to envision a steady state, reality is usually volatile. Our baselines
assume that Wisconsin’s remaining health plans stay in the market, but given the
uncertainty, it would not be a surprise if some additional plans left the market.
Enrollment by Market and Pass-Through Calculations. Based on end-of-year enrollment
data collected by OCI through 2016, preliminary OCI estimates for 2017, and our
projections for 2018 based on initial ACA sign ups and trends in non-ACA coverage, Table 5
shows our current projections of enrollment in Wisconsin’s individual market through
2020. These figures assume a $200 million reinsurance program waiver was approved
effective in 2019, and that transitional coverage (sometimes called “grandmothered”
coverage) is extended beyond its current 2018 expiration.
Our preliminary calculations of likely pass-through rates are shown in Table 6. Based on
data from HHS, we estimate that federal premium tax credits accounted for 75 percent of
premiums for ACA on-exchange (subsidy eligible) plans in 2016, and 78 percent of
premiums in 2017. We assume that Wisconsin’s subsidy rate will jump to 83 percent in
2018, due to the extra premium increases in silver-tier plans, which are used by many near-
poverty enrollees with very high subsidy rates. We believe this is a conservative
assumption, and it is possible that the final 2018 subsidy rate computed by CMS/HHS could
be higher.
Table 5. Wisconsin Individual Market Enrollment Estimates and Projections, by Submarket
Enrollment (covered lives) on December 31 2017est 2018est 2019proj 2020proj
ACA Single Risk Pool Individual Enrollment (December 31)
On-Exchange 198,300 180,200 171,100 174,700
Off-Exchange 15,700 14,300 13,600 13,900
Total, ACA 214,000 194,500 184,700 188,600
Transitional Individual 22,700 15,100 10,000 6,600
Grandfathered/Individual Association 3,300 1,700 900 500
Total (including Single Risk Pool, Grandfathered and Transitional) 240,000 211,300 195,600 195,700Source: Horizon Government Affairs based on data from OCI.
Note: Preliminary projections subject to change based on updated OCI data. Assumes $200m reinsurance fund effective in 2019.

11
Table 6 shows two possible subsidy rates, based on whether the state decides to limit the
reinsurance funding to only ACA-qualified plans or to extend the reinsurance also to non-
ACA grandfathered and transitional plans. Under the assumption that reinsurance is limited
to ACA plans, we currently estimate that the federal pass-through rate would be about 77
percent. Under the assumption that reinsurance is extended to all individual market plans, we estimate that the pass-through rate would be about 73-74 percent. On balance, we have
generally assumed that the most likely federal pass-through rate would be about 75
percent, and that the final federal determination would probably be in the 70-80 percent
range. As noted above, the Table 6 illustration also assumed that the federal government
allows transitional plans to continue beyond their current scheduled expiration in 2018.8
Given the uncertainty, we have suggested that Wisconsin consider that a worst-case
scenario for the federal pass-through rate would be about 60 percent. We believe that even
in a worst-case scenario, Wisconsin would achieve a substantially higher pass-through rate
than Minnesota, which has a 50 percent rate. Minnesota expanded Medicaid above 100
percent of poverty, and runs a Basic Health Program, which covers many people between
100 percent and 200 percent of poverty. These programs reduce the number of near-
poverty enrollees in Minnesota’s subsidy-eligible ACA plans. Since Wisconsin has relatively
more near-poverty enrollees with high subsidy rates in ACA plans, we calculate that the
state will have a substantially higher overall subsidy rate, and therefore a considerably
higher pass-through rate of federal funding for its proposed reinsurance program.
8 There are also several minor offsets to pass-through rates that could slightly affect these estimates. For example, there is a relatively small fee for the Patient-Centered Outcomes Research Institute (PCORI) that could slightly affect 2019 pass-through rates. Likewise, if the so-called health insurance tax, which was placed on moratorium for 2019 by the recent federal tax cut bill, is reinstated in 2020, the pass-through rate for 2020 could be slightly lowered. (This is because Wisconsin’s reinsurance program, by reducing premiums in the state, would thereby slightly lower federal tax collections under the health insurance tax. This, in turn, would slightly reduce the net federal savings resulting from the reinsurance program to be passed-through to Wisconsin.) These estimates do not assume any offsets to Wisconsin’s pass-through rates from federal exchange fees nor from the reduction in individual mandate penalties.
Table 6. Preliminary Estimates of Likely Pass-Through Rates
2016 2017est 2018est 2019proj 2020proj
Wisconsin On-Exchange Average Premium (pmpm) 440 514 710 725 708
Average Federal Premium Tax Credit (PTC, pmpm) 332 401 590 602 588
Avg. PTC as a Percent of Premiums (on-exchange) 75% 78% 83% 83% 83%
On Exchange Enrollment as a Percent of Single Risk Pool (ACA) 93% 93% 93% 93%
PTC Percentage Based only on Single Risk Pool (ACA) Market 72% 77% 77% 77%
On Exchange Enrollment as Percent of Total Enrollment 83% 85% 87% 89%
PTC Percentage Based on Total Enrollment (incl. GF and Trans.) 65% 71% 73% 74%
Source: Horizon Government Affairs based on data from OCI and HHS.
Notes: pmpm = per member per month. Preliminary estimates subject to revision.

12
Recommended


![INDIVIDUAL MARKET HEALTH INSURANCE …Section 7. Guaranteed Renewability of Individual Market Health Insurance Coverage [( 2703 PHSA)] Section 8. Extension of Dependent Coverage [(](https://img.pdfslide.us/doc/110x75/5f295f6143c2b405851b189a/individual-market-health-insurance-section-7-guaranteed-renewability-of-individual.jpg)