Wireless Broadband AssessmentSeptember 2006
QUALCOMM Proprietary
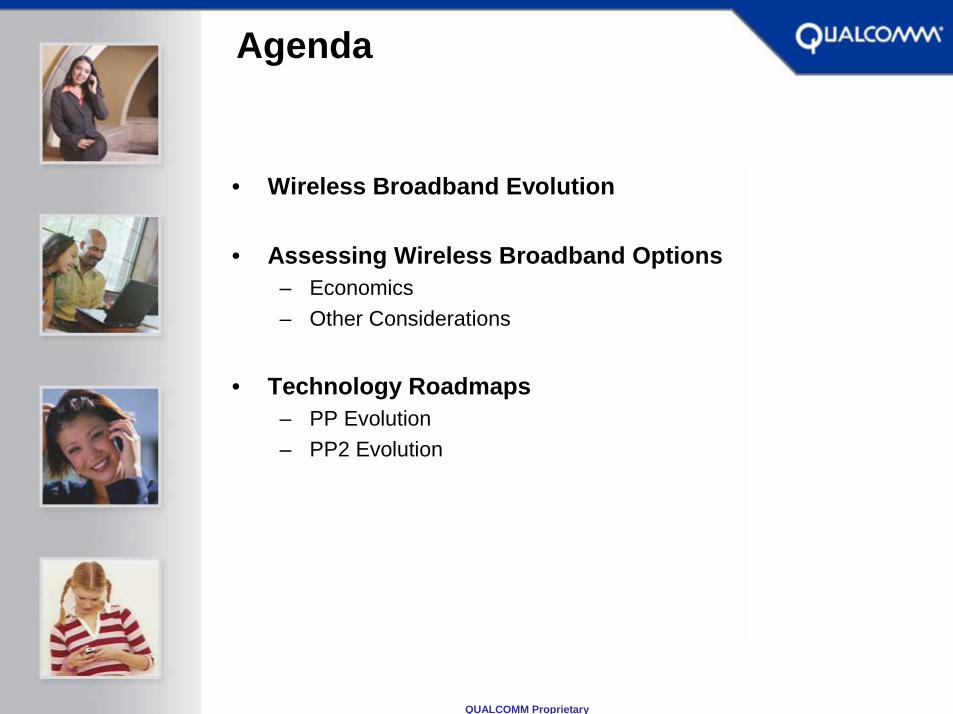
• Wireless Broadband Evolution
• Assessing Wireless Broadband Options – Economics– Other Considerations
• Technology Roadmaps– PP Evolution– PP2 Evolution
Agenda

PAGE 33QUALCOMM Proprietary
• Convergence of Communication,Computing & CE Platforms
• Multi-mode Devices Connect to Various Access Networks
–Service Requirements, Availability, Cost …
Mobile Device EvolutionMobile Device Evolution
• User Behaviors Trendfrom Wired to Wireless in time
• Same Rich IP Apps and Services in all Environments
–Ubiquitous &Consistent Experience Desired
Network EvolutionNetwork Evolution
• All-IP Network For Fixed-Mobile Convergence(VoIP & data)
• Co-existence of Different Access Networks for Various Needs
–Coverage, Mobility, Capacity, QoS, Data Rates …
Service EvolutionService Evolution
Wireless Broadband Evolution
PAGE 44QUALCOMM Proprietary
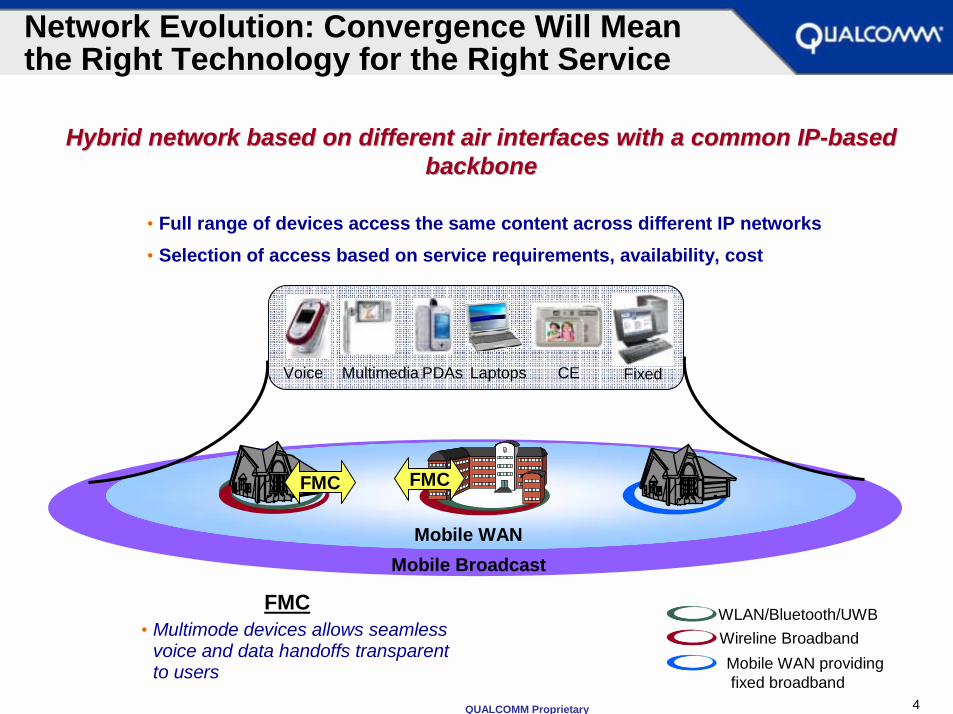
Network Evolution: Convergence Will Mean the Right Technology for the Right Service
• Multimode devices allows seamless voice and data handoffs transparent to users
FMC
• Full range of devices access the same content across different IP networks• Selection of access based on service requirements, availability, cost
Voice Multimedia CELaptopsPDAs Fixed
Wireline BroadbandWLAN/Bluetooth/UWB
Mobile BroadcastMobile WAN
FMC
Hybrid network based on different air interfaces with a common IHybrid network based on different air interfaces with a common IPP--based based backbonebackbone
FMC
Mobile WAN providingfixed broadband

PAGE 55QUALCOMM Proprietary
Device Evolution: Mobile Broadband is Key
Wireless Broadband, Mobility Increasingly Important to Device Wireless Broadband, Mobility Increasingly Important to Device VendorsVendors
• Initially, CPE gateways will be critical for VoIP, data
• Cost reductions expected with scale, market maturity
• Trickle down effect will introduce more capabilities in low end devices over time
• Economic development will lead to higher incomes
• Fixed CPEs will eventually give way to more portable devices
• Computers, Mobile Phones, CE Devices are Converging
• Most Devices Evolving Toward Mobility and Connectivity
– Vendors embracing wireless for communication between devices.
– Wireless capability important for market differentiation
• Growing File Sizes– Device sound, image, video quality
are important differentiators.– Necessitate high transfer rates to
be practical (USB 2.0, 802.11g, etc.)
PAGE 66QUALCOMM Proprietary
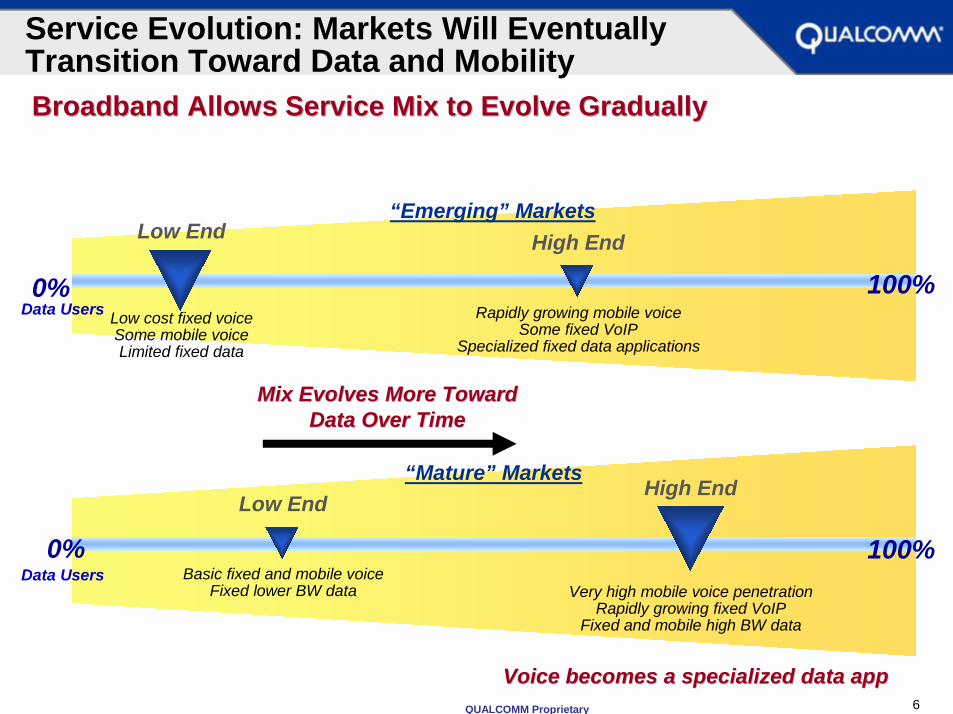
Service Evolution: Markets Will Eventually Transition Toward Data and MobilityBroadband Allows Service Mix to Evolve GraduallyBroadband Allows Service Mix to Evolve Gradually
100%0%
“Emerging” MarketsLow End
Low cost fixed voiceSome mobile voiceLimited fixed data
High End
Rapidly growing mobile voiceSome fixed VoIP
Specialized fixed data applications
Low End
Basic fixed and mobile voiceFixed lower BW data
High End
Very high mobile voice penetrationRapidly growing fixed VoIP
Fixed and mobile high BW data
0% 100%
“Mature” Markets
Voice becomes a specialized data appVoice becomes a specialized data app
Data Users
Data Users
Mix Evolves Mix Evolves MoreMore TowardTowardData Over TimeData Over Time

PAGE 77QUALCOMM Proprietary
Assessing Wireless Broadband Options: Economic Considerations
• All Wireless Networks Entail the Same Kinds of Costs– End-user devices– Network operating expenses
• E.g. maintenance, operations, backhaul, site rental– Network capital depreciation
• E.g. site acquisition, transceivers, RF engineering
• Several Factors Have the Greatest Impact on Cost– Scale– Breadth and maturity of ecosystem– Number of sites required (link budget)– Capacity (spectral efficiency)
PAGE 88QUALCOMM Proprietary
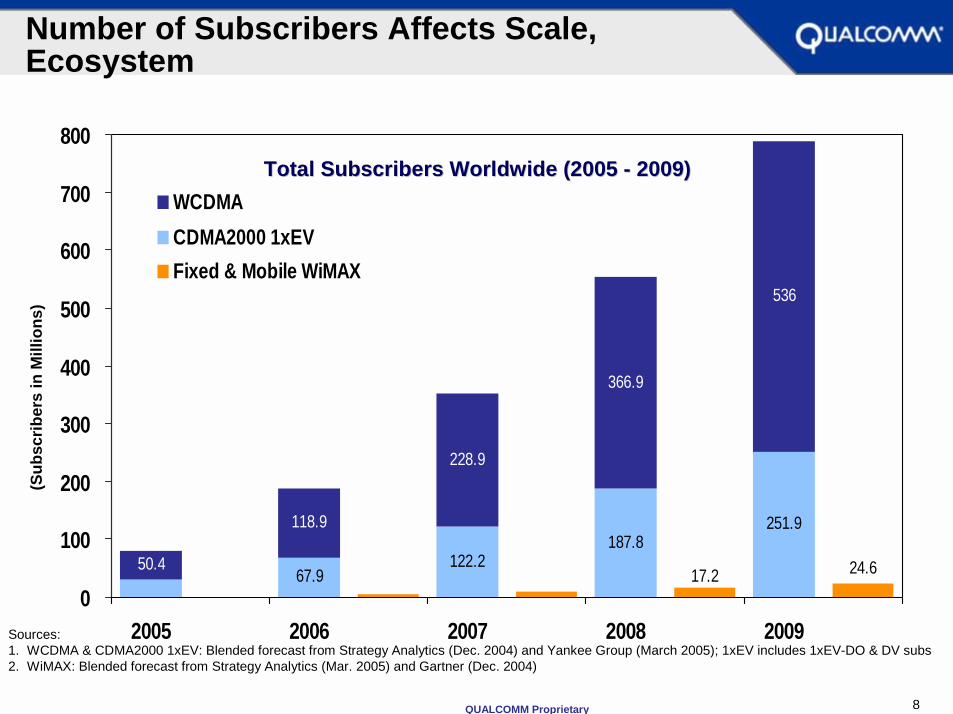
122.2187.8
251.9
228.9
366.9
536
24.617.267.950.4
118.9
0
100
200
300
400
500
600
700
800
2005 2006 2007 2008 2009
WCDMA CDMA2000 1xEVFixed & Mobile WiMAX
Total Subscribers Worldwide (2005 Total Subscribers Worldwide (2005 -- 2009)2009)
Sources:1. WCDMA & CDMA2000 1xEV: Blended forecast from Strategy Analytics (Dec. 2004) and Yankee Group (March 2005); 1xEV includes 1xEV-DO & DV subs2. WiMAX: Blended forecast from Strategy Analytics (Mar. 2005) and Gartner (Dec. 2004)
(Sub
scrib
ers
in M
illio
ns)
Number of Subscribers Affects Scale, Ecosystem

PAGE 99QUALCOMM Proprietary
WWAN Broadband will Create Industry Value, with a Focus on WWAN Broadband will Create Industry Value, with a Focus on Service RevenueService Revenue
2009 Market Size:• WWAN Evolution (incl. 3G mobile broadband)
– $394 B in service revenues1
– $114 B in equipment revenues2
– 960M subscribers by 20093
• Wi-Fi Evolution (802.11 a,b,g,n)– $3.5 B in public Wi-Fi service revenues1
– $9.9 B in equipment revenues4
– 48M subscribers by 20091
• WiMAX (802.16-2004, 802.16e-2005)– $7.4 B in service revenues1
– $3 B in equipment revenues5
– 25 M subscribers by 20096
1 Source: Strategy Analytics (2006)2 Source: Average of Strategy Analytics and Yankee Group forecasts (2006)3 Source: Average of iGR, Informa WCIS, Strategy Analytics and Yankee Group forecasts (2006)4 Source: Forward Concepts (2005)5 Source: Average of Strategy Analytics (2006), Gartner (2006) and Forward Concepts (2005)6 Source: Average of Strategy Analytics (2006) and Gartner (2005)
$0
$100
$200
$300
$400
$500
WWAN Wi-Fi WiMAX
Worldwide Service and Equipment Revenue, 2009
$US,
Bill
ions
Equipment RevenueService Revenue
$114
$394
$508
$13.4 $10.4
Subscriber Numbers Correlate with Equipment and Service Revenues
PAGE 1010QUALCOMM Proprietary
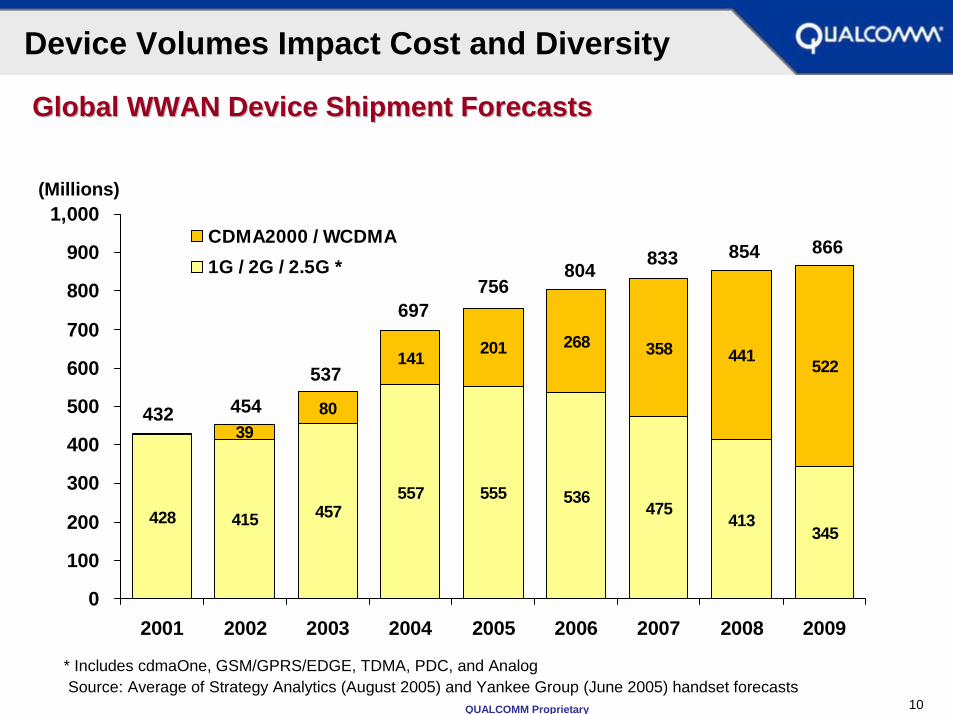
Global WWAN Device Shipment ForecastsGlobal WWAN Device Shipment Forecasts
428 415 457557 555 536
475413
345
268
3980
141 201 358 441 522
0
100
200
300
400
500
600
700
800
900
1,000
2001 2002 2003 2004 2005 2006 2007 2008 2009
CDMA2000 / WCDMA1G / 2G / 2.5G *
* Includes cdmaOne, GSM/GPRS/EDGE, TDMA, PDC, and AnalogSource: Average of Strategy Analytics (August 2005) and Yankee Group (June 2005) handset forecasts
(Millions)
432 454537
697
804 833 854 866
756
Device Volumes Impact Cost and Diversity

PAGE 1111QUALCOMM Proprietary
WiMAX* CPE / Subscriber Unit ForecastsWiMAX* CPE / Subscriber Unit Forecasts
0
5
10
15
20
25
30
2005 2006 2007 2008 2009
*Includes both 802.16-2004 and 802.16e (fixed and portable/mobile) shipments
Shaded area represents ranges between lowest and highest forecasts for shipments of fixed and portable/mobile WiMAX CPEs/subscriber equipment. Forecasts include ABI Research (Q3, 2005), Forward Concepts (September 2005) and Strategy Analytics (March 2005).
28M
20M
7.5M
12M
5M
3M1M
Device Volumes Impact Cost and Variety
PAGE 1212QUALCOMM Proprietary
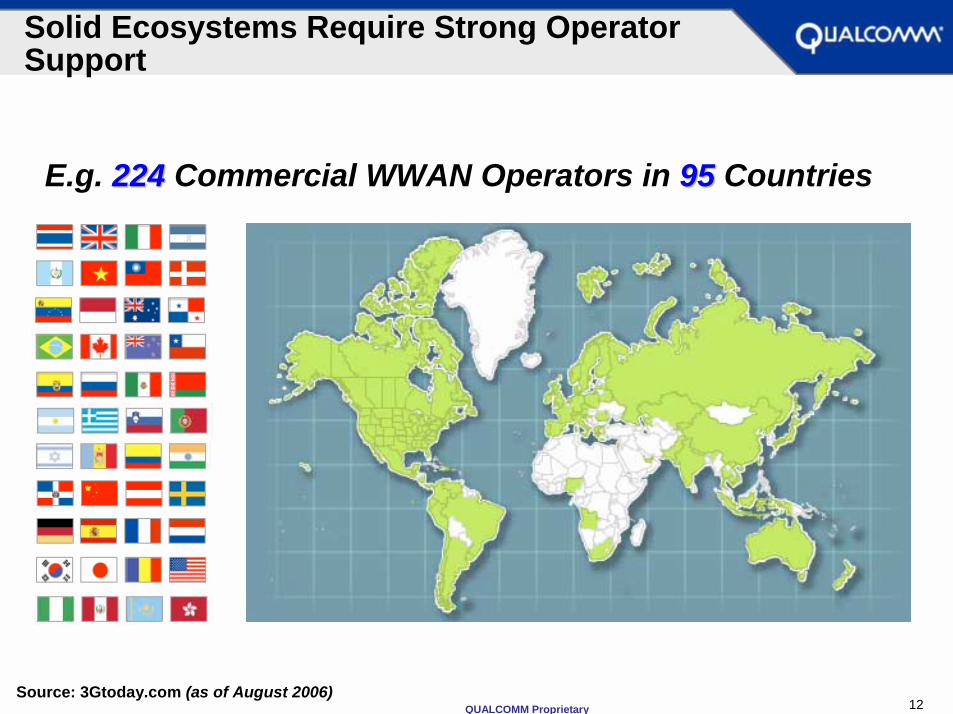
E.g. 224224 Commercial WWAN Operators in 9595 Countries
Source: 3Gtoday.com (as of August 2006)
Solid Ecosystems Require Strong Operator Support

PAGE 1313QUALCOMM Proprietary
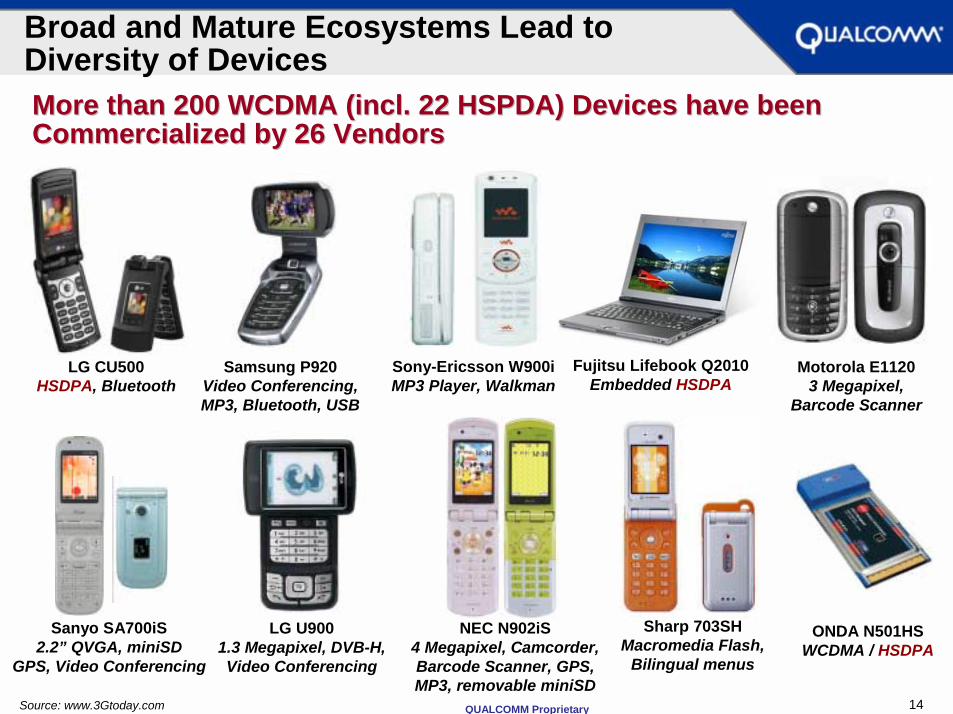
Toshiba W41T4GB Hard Disk Drive
Samsung SCH-i830Windows Mobile 2003,
WorldMode
More than 180 CDMA2000 1xEVMore than 180 CDMA2000 1xEV--DO Devices have been DO Devices have been Commercialized by 30 VendorsCommercialized by 30 Vendors
Source: www.3Gtoday.com
LG KV3600Enhanced 3D Gaming
Graphics
Casio W21CA2.6 inch WQVGA,
2 MP Camera
LG VX8500V-Cast - Streaming
Video, 3DGames, MP3 Player, MicroSD
HP Compaq nc6400Embedded 1xEV-DO
Samsung SCH-A9903.2 Megapixel Camera,
TV Out
KyoceraRx diversity
Samsung V74014mm thin, 1.3MP
Camera
Motorola QWindows Mobile 5
Smartphone Edition
Broad and Mature Ecosystems Lead to Diversity of Devices
PAGE 1414QUALCOMM Proprietary
Sanyo SA700iS2.2” QVGA, miniSD
GPS, Video Conferencing
Sony-Ericsson W900iMP3 Player, Walkman
Sharp 703SHMacromedia Flash,
Bilingual menus
LG U9001.3 Megapixel, DVB-H, Video Conferencing
Source: www.3Gtoday.com
Samsung P920Video Conferencing, MP3, Bluetooth, USB
ONDA N501HSWCDMA / HSDPA
Motorola E11203 Megapixel,
Barcode Scanner
NEC N902iS 4 Megapixel, Camcorder, Barcode Scanner, GPS, MP3, removable miniSD
LG CU500HSDPA, Bluetooth
More than 200 WCDMA (incl. 22 HSPDA) Devices have been More than 200 WCDMA (incl. 22 HSPDA) Devices have been Commercialized by 26 VendorsCommercialized by 26 Vendors
Fujitsu Lifebook Q2010Embedded HSDPA
Broad and Mature Ecosystems Lead to Diversity of Devices

PAGE 1515QUALCOMM Proprietary
The Number of Sites Multiplies Network Costs
MSC
BSC
Backhaul
BTS
Site Rental
Insurance/Training
Spares/ Software Upgrade
Utilities
Installation/Shipping
Site Acquisition
Project Management
RF Engineering/Test Equipment
Maint/Operations
Ancillary Equipment
11%
OperatingExpense
OperatingExpense
CapitalDepreciation
CapitalDepreciation
Capital Depreciation %Ancillary Equipment 2%Installation/Shipping 16%
Site Acquisition 4%Project Management 2%
RF Engineering/Test Equipment 2%BTS 11%BSC 2%MSC 3%
Operating ExpenseSite Rental 24%
Insurance/Training 5%Spares/ Software Upgrade 3%
Backhaul 8%Maint/Operations 13%
Utilities 4%Total 100%
• Network Expense = Operating Expense + Capital Depreciation• Hardware Small Portion of Overall Network Expenses (~16%)
PAGE 1616QUALCOMM Proprietary
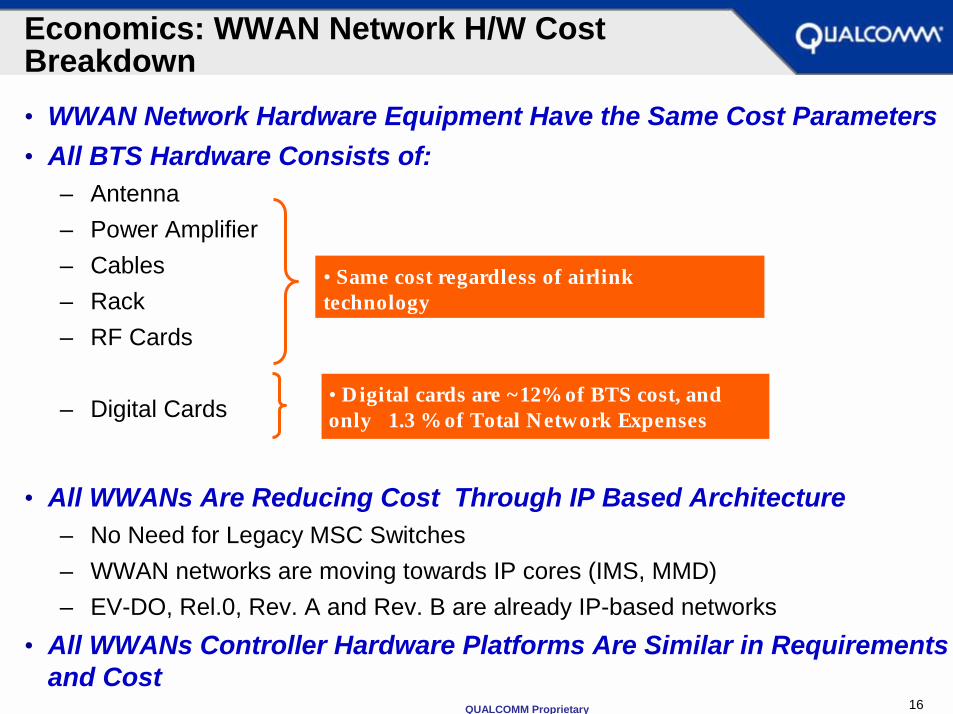
Economics: WWAN Network H/W Cost Breakdown• WWAN Network Hardware Equipment Have the Same Cost Parameters• All BTS Hardware Consists of:
– Antenna– Power Amplifier– Cables– Rack– RF Cards
– Digital Cards
• All WWANs Are Reducing Cost Through IP Based Architecture– No Need for Legacy MSC Switches– WWAN networks are moving towards IP cores (IMS, MMD)– EV-DO, Rel.0, Rev. A and Rev. B are already IP-based networks
• All WWANs Controller Hardware Platforms Are Similar in Requirements and Cost
•Same cost regardless of airlink technology
•Digital cards are ~12% of BTS cost, and only 1.3 % of Total Network Expenses
PAGE 1717QUALCOMM Proprietary
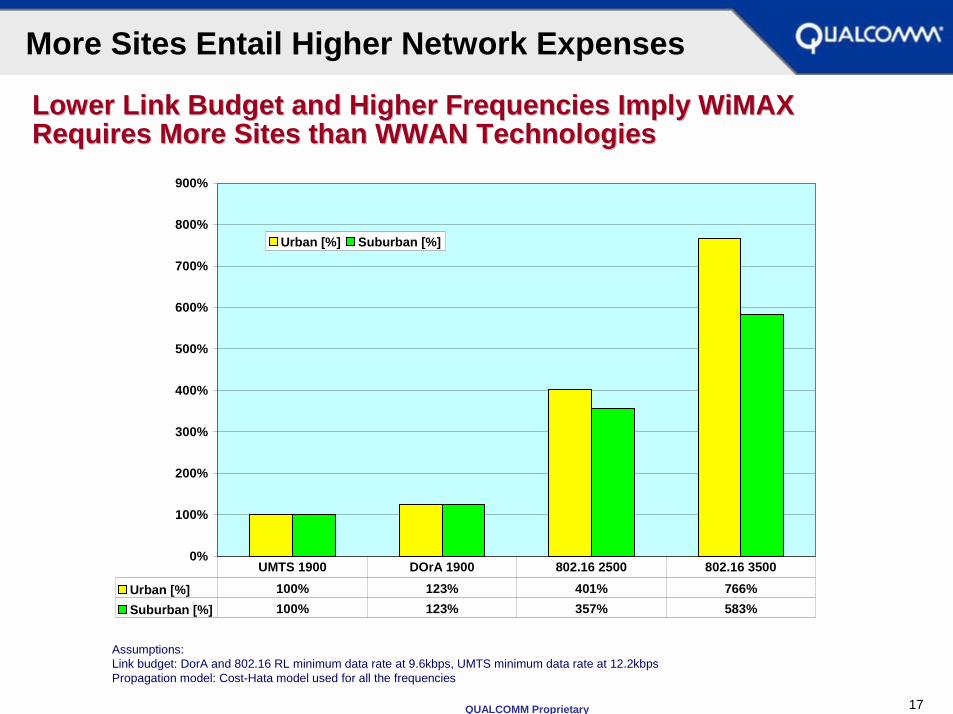
More Sites Entail Higher Network Expenses
Assumptions:Link budget: DorA and 802.16 RL minimum data rate at 9.6kbps, UMTS minimum data rate at 12.2kbpsPropagation model: Cost-Hata model used for all the frequencies
Lower Link Budget and Higher Frequencies Imply WiMAX Lower Link Budget and Higher Frequencies Imply WiMAX Requires More Sites than WWAN TechnologiesRequires More Sites than WWAN Technologies
0%
100%
200%
300%
400%
500%
600%
700%
800%
900%
Urban [%] Suburban [%]
Urban [%] 100% 123% 401% 766%Suburban [%] 100% 123% 357% 583%
UMTS 1900 DOrA 1900 802.16 2500 802.16 3500

PAGE 1818QUALCOMM Proprietary
Simulation assumptions:1 Full buffer; ITU channel models: pedA 3km/h 30%, pedB 10km/h 30%, vehA 30km/ 20%, pedA 120km/h 10%, Rician 10% for all technologies2 No Guard band assumed for WiMAX, frequency reuse of 1 is considered3 Perfect Linear MMSE equalizer assumed, back off 0.75dB4 Equalizer gain simulated; 1.25MHz carriers, 7 in 10MHz
SingleAntenna
SingleAntennaSingle
Antenna
RxDiversity
RxDiversity
RxDiversity
0
2000
4000
6000
8000
10000
12000
WiMAX HSDPA DOrA
kbps
3 4
kbps/sector4,5005MHz5,600 - 7,600 7280 - 10,400 7350 - 10,500
2
Average DL Physical Layer Throughput per Sector in 10MHz
Comparison of EVComparison of EV--DO, HSDPA, and WiMAX Sector ThroughputDO, HSDPA, and WiMAX Sector Throughput
Performance: Higher Capacity Yields Lower Cost per Bit

PAGE 1919QUALCOMM Proprietary
Assessing Wireless Broadband Options: Other Considerations
• Broadband Services Often Require Additional Spectrum– Spectral efficiency of latest technologies close to theoretical limit.– Supplemental spectrum often needed for more broadband capacity, performance.
• All BWA Alternatives Face Same Challenges– Trade-off always exists between range and throughput.– Cheaper higher frequency spectrum has poorer propagation characteristics.– Providing higher data rates usually entails greater cost.
• Successful BWA Technologies Share Important Characteristics– Enable compelling products and services, proven devices.– Facilitate differentiating apps and services for mobile devices.– Enjoy favorable spectrum allocation: allowing scale at specific frequency bands.– Achieve standards compliance: facilitating proliferation of compatible devices.
PAGE 2020QUALCOMM Proprietary
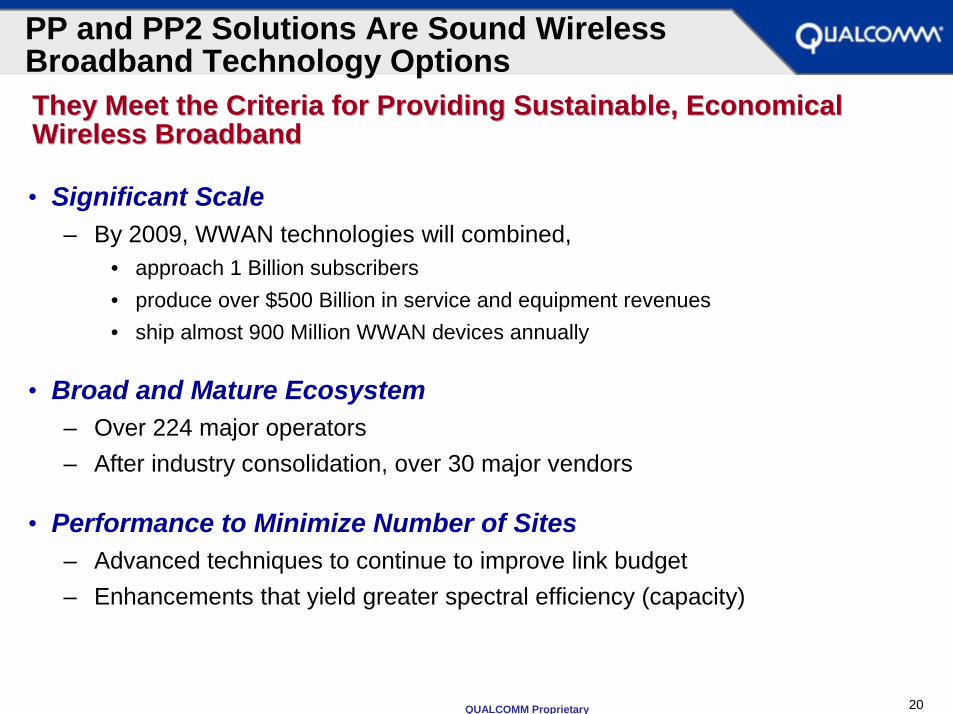
PP and PP2 Solutions Are Sound Wireless Broadband Technology Options
• Significant Scale– By 2009, WWAN technologies will combined,
• approach 1 Billion subscribers• produce over $500 Billion in service and equipment revenues• ship almost 900 Million WWAN devices annually
• Broad and Mature Ecosystem– Over 224 major operators– After industry consolidation, over 30 major vendors
• Performance to Minimize Number of Sites– Advanced techniques to continue to improve link budget– Enhancements that yield greater spectral efficiency (capacity)
They Meet the Criteria for Providing Sustainable, Economical They Meet the Criteria for Providing Sustainable, Economical Wireless Broadband Wireless Broadband

PAGE 2121QUALCOMM Proprietary
End User Benefits
Successive PP/PP2 Releases Evolve Along Four Dimensions of Airlink Performance
• Peak Data Rates:– Achievable when user in
optimal radio conditions
• User Data Rates:– Avg data rate– Cell edge data rate
• Quality of Service (QoS):– Ability to prioritize apps/ flows– Low and consistent latency– Fast connection time– Seamless mobility for delay
sensitive apps
• Capacity:– Higher capacity allows more
simultaneous users (lowers cost) and higher data consumption per user
More Flexible & Affordable Services
Enhanced User Experience
New Apps/Services

PAGE 2222QUALCOMM Proprietary
OFDMACDMA/TDMCDMA
• Broadband Downloads• Reduced Delays on DL• Backward Compatible
• Broadband Uploads• Reduced end to end
delays• Support for real-time
services (VoIP)• MBMS• Backward Compatible
• OFDMA• Deployments utilizing 5-20 MHz carrier BW• Common FDD and TDD modes• Enhanced capacity with advanced MIMO and SDMA support• Higher Avg and Peak Data Rates• Multimode devices provide seamless migration
PP Evolution Offers Industry-leading Wireless Broadband Capabilities
• Improvements to existing 5MHz carrier• Increased Peak, Avg & Cell Edge Rates• MIMO support• Enhanced capacity for real-time services • S/W Upgrade Option• Backward Compatible
LTE
Rel-99WCDMA
Rel-5HSDPA
Rel-6HSUPA
Rel-7 (Ph 1) Rel-8 (Ph 2)HSPA + (Evolution)

PAGE 2323QUALCOMM Proprietary
OFDMACDMA/TDMCDMA OFDM
* Standard supports up to 20 MHz
• All-IP Services• Broadband Downloads
• Advanced QoS - VoIP, VT, PTT….
• Broadband Uploads• OFDM introduced for
multicast• Backward Compatible
• Multi-carrier Rev A (up to-5MHz *)
• Existing Spectrum• Improved Peak, Avg & Cell Edge Data Rates • Improved user experience (lower delays,
consistent high data rates)• S/W Upgrade Option• Backward Compatible
• Highly optimized OFDMA solution• Support for flat network architecture• New/Vacant Spectrum for wider bandwidth (5-20 MHz)
• FDD and TDD modes• Enhanced capacity with advanced MIMO and SDMA techniques• Higher Avg and Peak Data Rates• Multimode devices provide seamless migration
** MIMO support I in B+*** 802.20 used for non-IMT bands
PP2 Evolution Offers Industry-leading Wireless Broadband Capabilities
CDMA20001X
CDMA20001xEV-DO
EV-DORev. A
EV-DORev. B**
Rev. C / 802.20 ***
2006 2007 2008 2009 2010
QUALCOMM Proprietary
Thank You

QUALCOMM Proprietary
Appendix

PAGE 2626QUALCOMM Proprietary
Rel 5 - HSDPA
• HSDPA Key improvements on downlink – Shared channel transmission – time, codes and power– Higher order modulation – 16 QAM– Adaptive modulation and coding with Node B scheduling – Hybrid ARQ with faster retransmissions
• Increased capacity– 300% gain in DL sector capacity
• Higher data rates– DL peak data rates up to 7.2 Mbps (14.4 Mbps per standard)
• QoS– Enables flow based QoS prioritization and multiple grades of service on downlink
• Enhanced services and applications– Improves end-user experience for existing applications e.g. web browsing, VoD & MoD– Enables mass marketing of applications such as place shifting of multimedia content,
wireless video monitoring
• Backward compatibility– Allows new device capabilities to be introduced over time – Continued support for Rel 99 handsets
PAGE 2727QUALCOMM Proprietary
Rel 6 - HSUPA
• HSUPA Extends benefits of HSDPA to uplink– Fast Uplink Scheduling– Fast and efficient re-transmission (HARQ) on uplink– Shorter transmission time interval (TTI) on uplink
• Increased capacity– 80% gain in UL sector capacity
• Higher data rates – Provides UL peak data rates of up to 5.76 Mbps
• QoS– Enables flow based QoS prioritization and multiple grades of service on uplink
• `Enhanced services and applications– Improves end-user experience UL intensive applications (sending files, picture/video
messaging)– Low latency networked gaming– Enables mass marketing of applications such as mobile social networking, embedded
consumer electronics– Enables efficient multicast transmission (MBMS)
• Backward compatibility– Allows new device capabilities to be introduced over time

PAGE 2828QUALCOMM Proprietary
HSPA+
• HSPA+ continues evolution of WCDMA and provides best in class performance in a 5MHz carrier
– Enhanced UE receiver performance requirements• Inter-cell interference reduction for improved edge of cell performance
• Increased capacity – Increased System Capacity : 2X Release 6 DL Capacity and 4X Release 6 UL Capacity
• Higher Data Rates– Higher Data Rates: 3X Release 6 DL Peak Rates and 2X Release 6 UL Peak Rates– Increased peak rate in high SNR scenarios - MIMO
• Enhanced support for data services– Reduced set-up times, enhanced support for real time services (Packet VT, VoIP and
enriched V+D applications)– Improved performance in “active state”
• Backward compatible– Continued support for Rel. 99 and HSPA terminals

PAGE 2929QUALCOMM Proprietary
LTE (Long Term Evolution)
• New air interface • OFDMA in DL and SC-FDMA in UL• Same principles as HSPA+ : Link Adaptation, HARQ, MIMO, etc.
• Flexible bandwidth and modes – Variable bandwidths (note Samir stated not to put 1-20 MHz, work in progress)– Wider bandwidths (5-20 MHz)– Asymmetric bandwidth allocation in uplink / downlink– Flexible duplex modes -FDD, TDD and FDD half duplex
• High peak rates – 100 Mps DL/50Mbps UL in 20MHz
• Enhanced control of inter-cell interference and cell edge coverage– Increased cell edge data rates
• Enhanced broadcast (MBMS) support
• Multimode devices provide seamless migration
PAGE 3030QUALCOMM Proprietary
EV-DO Rev A
• Key Improvements– Designed for symmetric traffic– Reduced latency and optimized QoS enables delay sensitive applications
• Increased capacity– 1.2 times Rel 0 forward link sector capacity– 3.4 times Rel 0 reverse link sector capacity
• Higher data rates– 3.1 Mbps peak data rate on forward link– 1.8 Mbps peak data rate on reverse link
• Enhanced services and applications– Greatly improved end-user experience for applications such as sending email
attachments, pictures and videos– Support for new delay sensitive applications – Push to Talk, Video Telephony, Instant
Multi-Media (IMM), VoIP, enriched V+D applications, and low delay gaming– DO Platinum Multicast
• Backward compatibility– Continued support for existing Rel 0 devices
PAGE 3131QUALCOMM Proprietary
EV-DO Rev B
• Key Improvements– Aggregates multiple carriers for higher performance
– 5MHz initial configuration
• Higher spectral efficiency– Improved on both FL and RL due to Multi-carrier TX
• Higher data rates– Linear gains in peak rates
– 2 RFs – 6.2 Mbps*, 3 RFs – 9.3 Mbps
• Enhanced services and applications– Mobile broadband experience across entire coverage area– Similar user experience across mobile and fixed networks– Higher streaming rate for video and music– Faster download of higher quality, longer video and music– Faster upload of pictures, video and audio files (social
networks, blogs)– Faster mobile broadband for laptops
• Backward compatibility– Continued support for existing Rev A devices– Software upgrade option to existing DOrA channel cards

PAGE 3232QUALCOMM Proprietary
EV-DO Rev C
• Highly optimized Mobile OFDMA solution with significantly higherperformance than competing technologies
– Advanced antenna techniques– Superior interference management– Optimized reverse link
• Scalable IP network architecture and advanced QoS mechanisms enable leading-edge performance
– Excellent support for real time services (e.g., VoIP)– Seamless handoffs to same or different technologies
• Enhanced user experience with higher data rates (peak, avg, cell edge), lower latency, and seamless mobility
• More flexible and affordable services with higher capacity and robust QoS capabilities
• Support for all applications ranging across handsets, Smartphones/ PDAs, Laptops, Desktops, and CE platforms
140 Mbps70 Mbps37 MbpsFL
N/A34 MbpsRL*
4 X N2 X N1 X NBW = 10 MHz, FDD
M x N: M tx antennas ,N rx antennas
Recommended