Who You Know Matters:
Venture Capital Networks and Investment Performance * †
Yael Hochberg Alexander Ljungqvist Johnson School of Management Stern School of Business Cornell University New York University and CEPR Yang Lu Stern School of Business New York University
December 8, 2004
* Thanks for helpful comments and suggestions go to Steve Drucker, Jan Eberly, Eric Green, Yaniv Grinstein, Laura Lindsey, Max Maksimovic, Roni Michaely, Maureen O’Hara, Mitch Petersen, Morten Sorensen, and seminar participants at Northwestern University, Cornell University, and Binghamton University. All errors are our own. † Address for correspondence: Yael Hochberg, Johnson Graduate School of Management, Cornell University, Sage Hall 317, Ithaca, NY 14853. Phone 607-255-5002. Fax 607-254-4590. e-mail [email protected].
Who You Know Matters:
Venture Capital Networks and Investment Performance
Abstract
Many financial markets are characterized by strong relationships and networks, rather than arm’s-length, spot-market transactions. We examine the performance consequences of this organizational choice in the context of relationships established when VCs syndicate portfolio company investments, using a comprehensive sample of U.S. based VCs over the period 1980 to 2003. VC funds whose parent firms enjoy more influential network positions have significantly better performance, as measured by the proportion of portfolio company investments that are successfully exited through an initial public offering or a sale to another company. Similarly, the portfolio companies of better networked VC firms are significantly more likely to survive to subsequent rounds of financing and to eventual exit. The magnitude of these effects is economically large, and is robust to a wide range of specifications. Our models suggest that the benefits of being associated with a well-connected VC are more pronounced in later funding rounds. Once we control for network effects in our models of fund and portfolio company performance, the importance of how much investment experience a VC has is reduced, and in some specifications, eliminated.
Key words: Venture Capital, Networks, Syndication, Investment Performance
JEL classification: G24, L14.

Networks are widespread in many financial markets. Bulge-bracket investment banks, for instance, have
strong relationships with institutional investors which they make use of when pricing and distributing
corporate securities (Benveniste and Spindt (1989), Cornelli and Goldreich (2001)). In the corporate loan
market, banks often prefer syndicating loans with other banks over being the sole lender. Similarly, in the
primary equity and bond markets, banks tend to co-underwrite securities offerings with banks they have
long-standing relationships with (Corwin and Schultz (2004)).
In the same spirit, networks feature prominently in the venture capital industry. VCs tend to syndicate
their investments with other VCs, rather than investing alone (Lerner (1994a)). They are thus bound by
their current and past investments into webs of relationships with other VCs. Once they have invested in a
company, VCs draw on their networks of service providers – head hunters, patent lawyers, investment
bankers etc. – to help the company succeed (Gorman and Sahlman (1989), Sahlman (1990)). Indeed, one
prominent VC goes as far as describing itself as a venture keiretsu (Lindsey (2003), Hsu (2004)). The
capital VCs invest in promising new ventures comes from a small set of institutional and other investors
with whom they tend to have long-established relationships. In all these instances, many VCs show a
preference for networks rather than arm’s-length, spot-market transactions.
While the prevalence of networking in many financial markets has been documented in the literature,
the performance consequences of this organizational choice remain unknown. In the venture capital
market, for instance, some VCs presumably have better-quality relationships and hence enjoy more
powerful network positions than others, implying differences in their clout, opportunity sets, access to
information, etc. In this study, we ask whether these differences help explain the cross-section of VC
investment performance.
We focus on the co-investment networks that VC syndication gives rise to, and leave the other two
main networks VCs use (involving service providers and institutional investors in their funds) to future
research. Syndication relationships are a natural starting point, not only because they are easy to observe,
but also because there are good reasons to believe they are vital to a VC’s performance. The two main

2
drivers of a VC’s performance are the ability to source high-quality deal flow (i.e., the ability to select
promising companies), and the ability to nurture its investments (i.e., the ability to add value to portfolio
companies). Syndication likely affects both of these performance drivers.
There are at least three reasons to expect syndication networks to improve the quality of deal flow.
First, VCs invite others to co-invest in their promising deals in the expectation that such invitations will
be reciprocated in the future (Lerner (1994a)). Second, by checking each other’s willingness to invest in
potentially promising deals, VCs can pool correlated signals and thereby may select better investments in
situations of often extreme uncertainty about the viability and return potential of investment proposals
(Wilson (1968), Sah and Stiglitz (1986)). Third, individual VCs tend to have investment expertise that is
both sector-specific and location-specific. Syndication helps diffuse information across sector boundaries
and expands the spatial radius of exchange, thus allowing VCs to diversify their portfolios (Stuart and
Sorensen (2001)).
In addition to improving deal flow, syndication networks may also help VCs add value to their
portfolio companies.1 Syndication networks facilitate the sharing of information, contacts, and resources
among VCs (Bygrave (1988)), for instance by expanding the range of potential strategic alliance partners
and launch customers for their portfolio companies. No less importantly, strong relationships with other
VCs likely improve the chances of securing follow-on VC funding for portfolio companies, and may
indirectly provide access to other VCs’ relationships with service providers such as head hunters and
prestigious investment banks.
An examination of the performance consequences of VC networks requires measures of how well
networked a VC is. We borrow these measures from graph theory, a mathematical discipline widely used
in economic sociology. Graph theory provides us with tools for describing networks at a “macro” level
1 The literature has documented a number of ways in which VCs add value to their portfolio companies, such as addressing weaknesses in the original business plan or the entrepreneurial team (Kaplan and Strömberg (2004)), professionalizing the company (Hellmann and Puri (2002)), reducing the time to product market (Hellmann and Puri (2000)), facilitating strategic alliances among portfolio companies (Lindsey (2003)), and ensuring strong governance structures at the time of the IPO (Hochberg (2004)).

3
and for measuring the relative importance, or “centrality,” of each actor in the network. In our setting,
centrality reflects a highly favored position in the network, giving access to information, deal flow, deeper
pools of capital, expertise, contacts, and so on. In their work on the prominence of actors in networks,
Knoke and Burt (1983) argue that economic concepts such as access to and control over resources or
information are well suited to measurement by network concepts such as centrality. Examples of prior
applications of network analysis in a financial context include Robinson and Stuart (2004), who study the
governance of strategic alliances, and Stuart, Hoang, and Hybels (1999), who focus on the effect of
strategic alliance networks on the performance of biotech ventures.
In addition to measures of how well networked each VC is, we require data on the performance of VC
investments. We examine both the performance of the VC fund and of the fund’s portfolio companies. At
the fund level, we examine “exit rates” in the absence of publicly available data on VC fund returns. We
define a fund’s exit rate as the fraction of its portfolio companies that are successfully exited via an IPO
or a sale to another company. At the portfolio company level, we examine not only whether or not the
portfolio company achieved a successful exit, but also intermediate performance, namely whether the
portfolio company survived to obtain an additional round of funding.
Controlling for other known determinants of VC fund performance such as fund size (Kaplan and
Schoar (2004)) as well as the competitive funding environment and the investment opportunities facing
the VC (Gompers and Lerner (2000)), we find that VCs that are better networked at the time a fund is
raised subsequently enjoy significantly better fund performance, as measured by the rate of successful
portfolio exits over the next ten years. The economic magnitude of this effect is meaningful: Depending
on the specification, a one-standard-deviation increase in network centrality increases exit rates by around
two percentage points from the 34.2% sample average. Using limited data on fund IRRs disclosed
following recent Freedom of Information Act lawsuits, we estimate that this is roughly equivalent to a two
percentage point increase in fund IRR from the 15% average IRR.
When we examine performance at the portfolio company level, we find that a VC’s network centrality
4
has a positive and significant effect on the probability that a portfolio company survives to a subsequent
funding round or exits successfully. Again, the effect is large economically. For instance, the survival
probability in the first funding round increases from the unconditional expectation of 66.8% to 72.4% for
a one-standard-deviation increase in the lead VC’s network centrality. Interestingly, the effect increases
over the course of subsequent funding rounds, suggesting that the importance of VC networking is greater
in the later stages of company development.
Perhaps the leading alternative explanation for the performance-enhancing role of VC networking is
simply experience (e.g., Kaplan, Martel, and Strömberg (2003)). It seems plausible that the better-
networked VCs are also the older and more experienced VCs. To rule out that our measures of network
centrality merely proxy for experience, our models explicitly control for a variety of dimensions of VC
experience. Interestingly, once we control for VC networks, the beneficial effect of experience on
performance is reduced, and in some specifications, eliminated. It is also not the case that the better-
networked VCs are simply the ones with better past performance records: While we do find evidence of
persistence in performance from one fund to the next, our measures of network centrality continue to have
a positive and significant effect on fund exit rates when we control for persistence.
The way we construct the centrality measures makes it unlikely that our results are driven simply by
reverse causality (that is, the argument that superior performance enables VCs to improve their network
positions, rather than the other way around). For a fund of a given vintage year, measures of network
centrality are constructed from syndication data for the five preceding years. Performance is then taken as
the exit rate over the life of the fund, which lasts 10-12 years. Thus, we are relating a VC’s past network
position to his future performance.
Our main results are based on centrality measures derived from syndication networks that span all
industries and the entire United States. To the extent that VC networks are geographically concentrated or
industry-specific, this may underestimate a VC’s network centrality. We therefore repeat our analysis
using industry-specific networks and a separate network of VC firms in California, the largest VC market
5
in the U.S. Our results are not only robust to these modifications, but their economic significance
increases substantially. In the California network, exit rates improve by approximately five percentage
points relative to the unconditional mean of 35.7% among California VCs.
Our contribution is fourfold. To the best of our knowledge, this is the first paper to examine the
performance consequences of the VC industry’s predominant choice of organizational form: Networks.
While previous work has examined the structure of syndication networks (Bygrave (1987, 1988), Stuart
and Sorensen (2001)) and the motivations for the use of syndication (Lerner (1994a), Podolny (2001),
Brander, Amit, and Antweiler (2002)), no previous study has examined the impact of such networks on
VC fund and portfolio company performance. Second, our findings shed light on the industrial
organization of the VC market. Like many financial markets, the VC market differs from the traditional
arm’s-length spot markets of classical microeconomics. The high returns to being well-networked we
document suggest that enhancing one’s network position should be an important strategic consideration
for an incumbent VC, while presenting a potential barrier to entry for new VCs. Third, our findings have
ramifications for institutional investors choosing which VC funds to invest in, as they indicate that better
networked VCs enjoy better investment performance. Finally, our analysis provides a deeper
understanding of the possible drivers of cross-sectional performance of VC funds, and points to the
importance of additional fundamentals beyond those previously documented in the academic literature.
The remainder of the paper is organized as follows. Section 1 provides an overview of network
analysis techniques and discusses their implementation in the VC context. A simple example illustrating
network analysis is presented in the Appendix. Section 2 describes our data. In Section 3, we analyze the
effect of VC networking on fund performance. Section 4 examines the relation between networking and
portfolio company survival. Section 5 examines the effects of industry-specific and spatially separated
networks. Section 6 discusses our findings and concludes.
1. Network Analysis Methodology
The aim of network analysis is to describe the structure of networks. Network analysis focuses first

6
and foremost on the relationships that exist among a set of economic actors, and less on the individual
actors’ characteristics (such as age, wealth, etc.). For instance, a network might be described as “dense”
(if many actors are tied to one another via reciprocated relationships) or “sparse” (if actors tend to be
more autarkic). It might have one dense area surrounded by a periphery of sparsely connected actors, or it
might have several clusters of dense areas that occasionally interact with each other. The network might
be populated by uniformly influential actors, or there may be variation in actors’ influence. And so on.
Influence is usually measured by how “central” an actor’s network position is. An actor is considered
central if he is extensively involved in relationships with other actors. Consider the most centralized of
networks, the “star.” In a star-shaped network, one actor is connected to all other actors, none of whom is
connected to anyone else. Clearly, the actor at the center of the star is the most influential: He has
relationships with all other actors, none of whom can reach anyone else without going via the center.
Contrast this with a ring-shaped network. In a ring, no actor is better connected than any other actor, so all
actors are equally central. Economically, greater centrality may give a VC access to information, deal
flow, deeper pools of capital, expertise, contacts, and so on.
Network analysis uses a branch of mathematics called graph theory to make the concept of centrality
more precise.2 The three most common centrality concepts are degree, closeness, and betweenness.
Degree is based on the number of relationships or ties an actor has. The more ties, the more opportunities
for exchange and so the more powerful the actor. Degree does not consider indirect relationships, that is,
the possibility of reaching other actors via intermediate actors. Closeness captures the idea that an actor
who has direct ties to many other actors has a favored position compared to an actor who must rely on
another actor’s relationship to a third actor, in the absence of a direct relationship with the third actor. For
instance, the center in a star is closer to all other actors than is any other actor. Betweenness is related to
the notion of closeness. An actor who stands “between” two other actors can intermediate exchange
between them. In a ring, each actor stands between his two immediate neighbors, who must involve him
2 See Wasserman and Faust (1997) for a detailed review of network analysis methods.

7
to reach one another.
In graph theory, a network is represented by a square “adjacency” matrix, the cells of which reflect
the ties among the actors in the network. The example described in the Appendix shows how the various
centrality measures outlined below are computed. In our setting, we code two VCs syndicating investment
in the same portfolio company as having a tie.3 Depending on the way ties are coded, adjacency matrices
can be directed or undirected. Directed matrices differentiate between ties that were originated by actor i
versus those originated by actor j, while undirected matrices make no such distinction. In our setting, the
undirected adjacency matrix records as a tie any participation by both VC firm i and VC firm j in a
syndicate. The directed adjacency matrix differentiates between syndicates led by VC i versus those led
by VC j. Unlike the undirected matrix, the directed matrix does not record a tie between VCs j and k who
were members of the same syndicate if neither led the syndicate in question.
Networks are not static. Relationships may change, and entry to and exit from the network may
change each actor’s centrality. We therefore construct our adjacency matrices over trailing five-year
windows. Using these matrices, we construct the following five centrality measures.
1.1 Degree Centrality
VCs who have ties to many other VCs may be in an advantaged position. Since they have many ties,
they are less dependent on any one VC for information or deal flow. In addition, they may have access to,
and may be able to call upon, more of the resources of the network as whole. In undirected data, VCs’
degrees differ merely as a result of the number of ties they have. In directed data, we can distinguish
between VCs who “receive” many ties and those who “originate” many ties. Thus, we will use three
measures of degree centrality:
Degree counts the number of ties each VC has, i.e., the number of unique VCs a VC has participated
3 As the example in the appendix illustrates, this method of coding ties produces a binary adjacency matrix. It is possible to construct a valued adjacency matrix accounting not only for the existence of a tie between two VCs but also for the number of times there is a tie between them. While the results reported in the following sections utilize the binary matrix, we note that all our results are robust to using network centrality measures calculated from valued matrices.

8
in a syndicate with. This ignores the direction of the ties.
Indegree counts the number of ties a VC receives, i.e., the number of other VCs in whose syndicates
he is invited to participate, thereby gaining access to deal flow, information, and resources he otherwise
may not have had access to.
Outdegree counts the number of ties a VC originates, i.e., the number of other VCs he invites into his
own syndicates, thereby perhaps buying himself favors or future syndication opportunities in return.
Clearly, degree centrality is a function of network size, which in our dataset varies over time due to
entry and exit by VCs. To ensure comparability over time, we normalize each degree centrality measure
by dividing by the maximum possible degree in an n-actor network (i.e., n–1).4
1.2 Eigenvector Centrality (Bonacich (1972, 1987))
Eigenvector centrality is a measure of closeness. It measures how central actors are in terms of the
overall structure of the network by using factor analysis to identify the dimensions of the distances among
actors, as measured by the eigenvalues and eigenvector of the adjacency matrix. Eigenvector centrality is
considered a particularly useful way to measure information exchange relationships, as it gives weight not
only to ties to other actors, but also to those actors’ centrality. In essence, eigenvector centrality is a
recursive measure of degree, whereby the centrality of an actor is defined as the sum of his ties to other
actors, weighted by their centralities.5 In our setting, eigenvector centrality measures the extent to which a
VC is connected to other well-connected VCs.
1.3 Betweenness Centrality
Betweenness measures the extent to which an actor is in a favored position by falling on the shortest-
distance paths between other actors in the network. Betweenness centrality attributes power in the network
4 While we normalize the centrality measures used in the empirical analysis, we note that all our results are robust to using non-normalized network centrality measures instead. 5 Formally, given an adjacency matrix A, the eigenvector centrality of actor i (denoted ci) is given by ci=a∑Aijcj where a is a parameter required to give the equations a non-trivial solution (and is therefore the reciprocal of an eigenvalue). As the centrality of each actor is determined by the centrality of the actors he is connected to, the centralities will be the elements of the principal eigenvector. The normalized eigenvector centrality is the scaled eigenvector centrality divided by the maximum possible value.

9
to actors on whom a large number of other actors in the network must rely to make connections within the
network. In our setting, betweenness proxies for the extent to which a VC may act as a broker between
other VCs. Formally, let bjk be the proportion of all paths linking actors j and k which pass through actor i.
The betweenness of actor i is defined as the sum of all bjk where i, j, and k are distinct. Betweenness is
therefore a measure of the number of times an actor occurs on a path. It is normalized by dividing by the
maximum possible betweenness in an n-actor network.
2. Sample and Data
Data for our analysis are obtained from Thomson Financial’s Venture Economics database. Venture
Economics began compiling data on venture capital investments in 1977, and has since backfilled the data
to the early 1960s. Gompers and Lerner (1999b) investigate the completeness of the Venture Economics
database and conclude that it covers more than 90% of all venture investments.
Most venture capital funds are structured as closed-end, often ten-year, limited partnerships. They are
not stock market traded, nor do they disclose fund valuations. The typical fund spends its first three or so
years selecting companies to invest in, and then nurtures them over the next few years (Ljungqvist and
Richardson (2003)). Successful portfolio companies are exited via initial public offerings (IPOs) or sales
to other companies, which generate capital inflows (and hopefully capital gains) that are distributed to the
fund’s investors. The exit phase typically occupies the second half of the fund’s life. At the end of the
fund’s life, any remaining portfolio holdings are sold or liquidated and the proceeds distributed to the
investors.
Owing to this investment cycle, relatively recent funds have not yet operated for long enough to
measure their lifetime performance. But simply excluding relatively recent funds is sometimes felt to
result in performance measures that do not reflect the changes in, and current state of, the VC industry. As
a compromise, Kaplan and Schoar (2004) and Jones and Rhodes-Kropf (2003) consider all funds raised
up to and including 1999, but also show robustness to excluding funds that have not yet completed their
ten-year runs as of the end of their sample period. In the same spirit, we consider all venture capital

10
investments made by VC funds raised between 1980 and 1999 that are included in the Venture Economics
database. We begin in 1980 because venture capital as an asset class that attracts institutional investors
has only existed since the 1980 ERISA “Safe Harbor” regulation.6 Closing the sample period at year-end
1999 provides at least four years of operation for the youngest funds, using November 2003 as the latest
date for measuring fund performance. Our results are robust to excluding funds that have not yet
completed their ten-year lives.
We concentrate solely on investments by U.S. based VC funds, and exclude investments by angels
and buyout funds.7 We distinguish between funds and firms. While VC funds have a limited (usually ten-
year) life, the VC management firms that manage the funds have no predetermined lifespan. A first-time
fund that is successful often enables the VC firm to raise a follow-on fund (Kaplan and Schoar (2004)),
resulting in a sequence of funds raised a few years apart. We will measure VC experience and networks at
the parent firm-level rather than the fund-level.8 This assumes that experience and contacts acquired in the
running of one fund carry over to the firm’s next fund.
In the estimation datasets, there are 3,469 VC funds managed by 1,974 VC firms which participate in
47,705 investment rounds involving 16,315 portfolio companies. 44.7% of investment rounds and 50.3%
of sample companies involve syndicated funding.
We consider two definitions of syndicate. For directed data, we distinguish between VCs who lead
syndicates (inviting others to join them and thereby perhaps earning favors, information, and future deal
flow reciprocity), and VCs who are non-lead members of syndicates (who are invited to join, thereby
gaining access to deal flow, information, and resources they otherwise may not have had access to). To do
6 The institutionalization of the VC industry is commonly dated to three events: The 1978 Employee Retirement Income Security Act (ERISA) whose “Prudent Man” rule allowed pension funds to invest in higher-risk asset classes; the 1980 Small Business Investment Act which redefined VC fund managers as business development companies rather than investment advisers, so lowering their regulatory burdens; and the 1980 ERISA “Safe Harbor” regulation which sanctioned limited partnerships which are now the dominant organizational form in the industry. 7 We do, however, include corporate venture programs as long as Venture Economics reports data for their size. 8 Occasionally, Venture Economics assigns more than one name to the same VC firm (e.g. “Alex Brown and Sons,” “Alex Brown & Sons”). We manually consolidate VC firm names where applicable.

11
so, we examine syndicates at the investment round level. We define the syndicate as the collection of VC
firms that invest in a given portfolio company investment round. As per convention, we identify the lead
investor in the syndicate as the VC firm that makes the largest investment in the round.9
For undirected data, we are primarily interested in the ties among VCs instanced by co-investment in
the same portfolio company. Here, we are less concerned with whether the co-investment occurred in the
same financing round or in different rounds, because we assume VC relationships are built by interacting
with one another in board meetings and other activities that help the portfolio company succeed. Thus, a
VC who invested in the company’s first round may interact with a VC who joined in the second round. To
capture this, we examine syndicates at the company level and define the syndicate as the collection of VC
firms that invested in a given portfolio company. All our results are robust, both in terms of economic and
statistical significance, to employing either definition of syndicate for both directed and undirected
networks.
2.1 Fund Characteristics
Table 1 describes our sample funds. The average VC fund in our sample had $64 million of capital
available for investment, with a range from $0.1 million to $5 billion. (Fund size information is
unavailable for 364 of the 3,469 sample funds.) Once successful, VC management firms tend to raise new
funds. The fund sequence number denotes whether a fund is the first, second and so forth fund raised by a
particular VC management firm. The average sample fund is a third fund, though sequence numbers are
missing in Venture Economics for a third of the funds. A quarter of funds are identified as first-time
funds. Around a third (36.5%) focus on seed or early-stage investment opportunities.
Many VCs specialize in a particular industry, and important performance drivers such as investment
opportunities and competition for deal flow likely vary across industries. Venture Economics does not
identify which industry a fund specializes in, but it classifies the funds’ portfolio companies into six broad
groups. We take a sample fund’s industry specialization to be the broad Venture Economics industry
9 Ties are broken by defining the lead investor as the VC with the largest cumulative investment in the company to date.

12
group that accounts for most of its invested capital. On this basis, 46.2% of funds specialize in “Computer
related” companies, 18.9% in “Non-high-technology,” 9.2% in “Medical, health, life sciences,” 15.5% in
“Communications and media,” 6% in “Biotechnology,” and 4.3% in “Semiconductors, other electronics.”
2.2 Measuring Fund Performance
Ideally, we would measure fund performance directly, using for instance the internal rate of return a
fund achieved over its ten-year life. However, fund returns in the form required for this study are not
systematically available to researchers as VC funds generally do not disclose their performance to anyone
other than their own investors. Venture Economics collects fund performance data from VC investors, but
only makes them publicly available in aggregate form (e.g., “the median IRR for funds raised in 1993
was...”). Some researchers have recently had access to disaggregated performance data from Venture
Economics, but only in anonymized format (see Kaplan and Schoar (2004); Jones and Rhodes-Kropf
(2003)). Absent a facility for identifying individual funds and thus matching their performance data to
their network characteristics and other cross-sectional variables, these anonymized data would not help us
examine the effect of VC networking on investment performance.
Instead, we measure fund performance indirectly. Ljungqvist and Richardson (2003) report that
75.3% of investments are written off completely in the average VC fund in their sample. This implies that
VC funds earn their capital gains from a small subset of their portfolio companies, namely those that they
exit via an IPO or a sale to another company (M&A).10 All else equal, the more successful exits a fund
has, the larger will be its IRR. Thus, we take as our main proxy for VC fund performance the fraction of
the fund’s portfolio companies that have been successfully exited via an IPO or M&A transaction, as
identified in the Venture Economics database as of November 2003. In Section 3.5, we show that this is a
reasonable proxy for fund returns.
Table 1 provides descriptive statistics on our performance measure. In the sample of 3,469 funds
raised between 1980 and 1999, the exit rate averages 34.2%. IPOs outnumber M&A transactions three-to-
10 Unsuccessful investments are typically shut down or sold back to management.
13
two (with exit rates of 20.7% and 13.6%, respectively). These exit rates are comparable to those reported
in Gompers and Lerner (2000) for the 1987-1991 period. Our results are robust to computing exit rates
using instead the fraction of dollars invested in companies that are successfully exited. Dollar exit rates
are a little higher, averaging 35.8%.
Figure 1 illustrates the evolution of exit rates over time, plotting the average exit rate of all sample
funds by vintage year. Exit rates peaked among funds raised in 1988, and there is mild evidence of an
upward trend in exit rates among funds raised before 1988 and a more pronounced downward trend
among funds raised since. The youngest funds – those raised in 1998 and 1999 – have markedly lower
exit rates. This could be because they have yet to complete their ten-year investment lives. Alternatively,
the deterioration in the investment climate and, especially, in the IPO market since the bursting of the dot-
com and technology bubbles of the late 1990s may result in these funds never matching the performance
of earlier VC vintages. Whatever the reason, to capture the pronounced time pattern evident in Figure 1,
we include year dummies throughout our fund-level analysis.
2.3 Company-level Performance Measures
Data limitations prevent us from computing company-level rates of return: The Venture Economics
database does not include details on the fraction of equity acquired by the VCs or the securities they hold,
and occasionally lacks information even on the amount invested.11 Instead, we use two indirect measures
of company-level performance. Most venture-backed investments are “staged” in the sense that portfolio
companies are periodically reevaluated and receive follow-on funding only if their prospects remain
promising (Gompers (1995)). Thus, we view survival to another funding round as an interim signal of
success. Eventually, successful portfolio companies are taken public or sold. Absent return data, we
follow Gompers and Lerner (1998, 2000), Brander, Amit, and Antweiler (2002) and Sorensen (2003) in
11 But see Cochrane (2004) for an analysis of company-level rates of return using data from an alternative database (VentureOne), and see Ljungqvist and Richardson (2003) for similar analysis using a proprietary dataset of 4,000 private equity-backed companies.
14
taking the occurrence of an IPO or M&A transaction as a final signal of the investment’s success.12
We restrict the dataset to companies that received their first institutional funding round between 1980
and 1999, and record their subsequent funding rounds and, if applicable, exit events through November
2003.13 Figure 2 shows what happened to these 16,315 companies. Around a third of the companies do
not survive beyond the first funding round and are thus written off. 1,020 companies (6.3%) proceed to an
IPO or M&A transaction after the first round. The remaining 9,875 companies (60.5%) receive follow-on
funding. Conditional on surviving to round 2, the survival probability increases: Of the 9,875 companies
having survived round 1, 7.7% exit and 70% survive to round 3. Conditional on surviving to round 3,
10.1% exit and 69.2% survive to round 4. And so forth. Overall, 4,235 of the 16,315 portfolio companies
(26%) have successfully exited by November 2003. The median company receives two funding rounds.
It is important to realize that Venture Economics provides next to no information about the portfolio
companies, beyond the dates of the funding rounds, the identity of the investors, subsequent exits, and the
companies’ Venture Economics industry classification. Of the 16,315 companies with first rounds in the
dataset, 32.7% are classified by Venture Economics as “Computer related,” 30.9% as “Non-high-
technology,” 14.1% as “Communications and media,” 10.9% as “Medical, health, life sciences,” 6.4% as
“Semiconductors, other electronics,” and 4.9% as “Biotechnology.”
2.4 VC Firm Experience
Kaplan and Schoar (2004) provide convincing evidence of persistence in returns across a sequence of
funds managed by the same VC firm. Such persistence highlights the importance of investment skill and
experience. While skill is difficult to measure, we derive four proxies of investment experience for each
VC firm and for each year the VC firm is active in the sample. These control variables measure the age of
the VC firm (the number of days since the VC firm’s first-ever investment), the number of rounds the
12 Unlike Gompers and Lerner (1998) and Brander, Amit, and Antweiler (2002), we account for successful exits via M&A transactions as well as IPOs. 13 We thus exclude companies (and all their funding rounds) that received their first institutional funding round before 1980, even if they subsequently received follow-on funding after 1980. Our dataset does, however, include companies that received a non-institutional funding round prior to 1980 (typically involving angel investors or friends and family).

15
firm has participated in, the cumulative total amount it has invested, and the number of portfolio
companies it has backed. Each is calculated using data from the VC firm’s creation to year t.14 To
illustrate, by the time Sequoia Capital raised Fund IX in 1999, it had been active for 24 years, had
participated in 888 rounds investing a total of $1,275 million in 379 separate portfolio companies.
2.5 Network Measures
Over our sample period, the VC industry saw substantial entry and exit and thus a considerable
reordering of relationships. To capture the dynamics of these processes, we construct a new network for
each year t, using data on syndications from the five years ending in t. Within each of these five-year
windows, we make no distinction between relationships reflected in earlier or later syndicates. We then
use the resulting adjacency matrices to construct the five centrality measures described in Section 1.
The parent of the average sample fund has normalized outdegree of 1.203%, indegree of 1.003%, and
degree of 4.237% (see Table 1). This means that the average VC, when acting as lead, involves a little
over 1% of all VCs active in the market at the time as co-investors; is invited to become a syndicate
member by around 1% of all VCs; and has co-investment relationships with a little over 4% of the other
VCs (ignoring its and their roles in the syndicate). Coupled with the fact that more than half of all
investments are syndicated, these low degree centrality scores suggest that VCs each repeatedly co-invest
with a small set of other VCs, that is, that relationships are relatively exclusive and stable.
To illustrate the variation in the degree measures, we consider the extremes. Over the five years
ending in 1999, New Enterprise Associates syndicated with the largest number of VCs (369). By contrast,
186 (10.3%) of the 1,812 VC firms active in the market during the 1995-1999 window never syndicated
any investments, preferring instead to invest on their own.
Betweenness and eigenvector centrality average 0.29% and 3.74% of their respective theoretical
maximum. Throughout most of the 1990s, New Enterprise Associates had the highest betweenness
14 Since Venture Economics’ data are somewhat unreliable before 1980, we ignore investments dated earlier than 1975. This coding convention does not affect our results.

16
centrality scores (standing “between” approximately 6% of all possible VC pairs), only to be overtaken by
Intel Capital, the venture capital arm of Intel Corp, in 1999.
2.6 The Macro Structure of VC Networks
Table 2 provides a macro-level description of each of our five-year networks, from 1976-1980 to
1999-2003. We list the number of VC firms that lead-manage an investment round in each five-year
window, the total number of VCs that participate in investment rounds, and the number of investment
rounds concluded during the window. For instance, during the five years to 1980, 374 VC firms
participated in 1,541 investment rounds, 243 of whom acted one or more times as lead investor.
Overall, VC syndication networks are not particularly dense. As a proportion of all the relationships
between every pair of VCs that could be present, the density of undirected ties peaked at 4.5% in 1987-
1991 and has been declining to below 2% since. Directed ties (i.e., those between lead VC and syndicate
members) are even less dense. In part, this simply reflects the large number of VCs and the tendency of
some VCs never to syndicate their investments,15 but it likely also reflects the aforementioned exclusivity
and repeated nature of syndication relationships evident in the low individual degree centrality scores.
Low density can suggest high centralization. A simple way to measure the overall centralization of a
network (as opposed to the centrality of individual actors) is to express the network-wide variation in the
actors’ degree, betweenness, and eigenvector centralities as a percentage of the variation we would
observe in the most centralized network, a perfect star, of equivalent size. The resulting centralization
numbers can be interpreted as measures of the degree of inequality in the network. As Table 2 shows,
outdegree, degree, and eigenvector centrality are each relatively unequally distributed, suggesting that the
power of individual VCs varies substantially. In other words, positional advantage is quite unequally
distributed in our networks.
2.7 Competition for Deal Flow and Investment Opportunities
Our models include a range of control variables. Gompers and Lerner (2000) show that the prices
15 All our results are robust to excluding VC firms that never syndicate.

17
VCs pay when investing in portfolio companies increase as more money flows into the VC industry,
holding investment opportunities constant. They interpret this pattern as evidence that competition for
scarce investment opportunities drives up valuations. If so, it seems plausible that competition for deal
flow also affects the quality of VCs’ investments and thus performance. We therefore include in our fund-
level and company-level models the aggregate VC fund inflows in the year a sample fund was raised and
the year a portfolio company completed a funding round, respectively. Table 1 shows that the average
sample fund was raised in a year in which $23.8 billion flowed into the VC industry. This ranges from a
low of $2.3 billion (1980) to a high of $84.6 billion (1999).
Controlling for the investment opportunities open to a VC is harder. Gompers and Lerner (2000)
propose public-market pricing multiples as indirect measures of the investment climate in the private
markets. There is a long tradition in corporate finance, based on Tobin (1969), that views low book-to-
market (B/M) ratios in an industry as an indication of favorable investment opportunities. Price-earnings
(P/E) ratios are sometimes used for the same purpose. By definition, private companies lack market value
data, so we must rely on multiples from publicly traded companies. To allow for inter-industry differences
in investment opportunities, we map all COMPUSTAT companies into the six broad Venture Economics
industries. We begin with VC-backed companies that Venture Economics identifies as having gone
public, and for which therefore SIC codes are available. We then identify which Venture Economics
industry each available four-digit SIC code is linked to most often.16 We compute the pricing multiple for
each of the six Venture Economics industries in year t as the value-weighted average multiple of all
COMPUSTAT companies in the relevant four-digit SIC industries.17
16 Similar results are obtained when using three-digit SIC codes. 17 We define a public company’s P/E ratio as the ratio of stock price (COMPUSTAT data item #199) to earnings-per-share excluding extraordinary items (#58). We define the B/M ratio as the ratio of book equity to market equity, where book equity is defined as total assets (#6) minus liabilities (#181) minus preferred stock (#10, #56, or #130, in order of availability) plus deferred tax and investment tax credit (#35), and market equity is defined as stock price (#199) multiplied by shares outstanding (#25). To control for outliers, we follow standard convention and winsorize the P/E and B/M ratios at the 5th and 95th percentiles for the universe of firms in COMPUSTAT in that year. (The results are robust to other winsorization cutoffs.) To calculate a value-weighted average, we consider as weights both the firm’s market value (market value of equity plus liabilities minus deferred tax and investment tax credit plus preferred stock) and the dollar amount of investment in each four-digit SIC code each year (as calculated from the Venture Economics database).

18
VC funds take a number of years to invest their available capital. Thus, we have to decide over what
time period to measure their investment opportunities. For the purpose of the fund-level analyses in
Section 3, we average B/M and P/E ratios over each fund’s first three years of existence, to approximate
its active investment period. Results are robust to using longer or shorter windows. Table 1 reveals the
average fund to face a P/E ratio of 16.4 and a B/M ratio of 0.514 in its industry of specialization over the
first three years of its life.
3. Fund-level Analysis
3.1 Benchmark Determinants of Fund Performance
We begin by replicating Kaplan and Schoar’s (2004) fund performance model, to validate our use of
exit rates instead of fund returns as the measure of performance. Kaplan and Schoar relate VC fund
performance to two fund characteristics (as well as a set of vintage year dummies): Log fund size and log
fund sequence number, each of which is included in levels and squares. Our results are reported in Table
3. When we include both fund size and fund sequence number in the model, only the year dummies are
significant (see column (1)).18 Consistent with Kaplan and Schoar, we find only weak evidence that
higher sequence number funds perform better (p=0.099) once we exclude fund size in column (2), and
strong evidence that larger funds perform significantly better (p<0.001) once we exclude fund sequence
number in column (3). As in Kaplan and Schoar (whose dataset is a subset of ours), the relation between
fund performance and fund size is increasing and concave, consistent with diminishing returns to scale.
The adjusted R2 in model (3) is 13.6%.
Because fund sequence number appears to have little effect on fund performance in our dataset, and
because it is frequently unavailable in the Venture Economics database, we replace it with a dummy
equaling one for first-time funds. We also control for funds that Venture Economics classifies as seed or
18 It is difficult to control directly for exit market conditions over the life of a fund, as market conditions may vary widely over the 7+ years in which portfolio companies are likely to reach exit stage. The year fixed effects may help control for heterogeneity in exit rates related to the fund’s vintage year timing (and hence subsequent exit market conditions). See Section 4.3 for company-level models that control explicitly for exit market conditions.

19
early-stage funds, on the assumption that such funds invest in riskier companies and so have relatively
fewer successful exits. The resulting model is shown in column (4). In addition to the positive and
concave effect of fund size, we find that first-time funds perform significantly worse, mirroring Kaplan
and Schoar’s (2004) results: All else equal, first-time funds have exit rates that are 3.6 percentage points
below average (that is, 30.9% rather than 34.5%). In this specification, seed and early-stage funds do not
perform differently from other funds.
The model shown in column (5) adds the log of vintage-year VC fund inflows in an attempt to control
for Gompers and Lerner’s (2000) “money chasing deals” result, whereby inflows of capital into VC funds
increase the competition for a limited number of attractive investment opportunities. Consistent with the
spirit of their results, we find that funds subsequently perform significantly worse the more money flowed
into the VC industry in the year they were raised. The effect is large economically: A one-standard-
deviation increase in vintage-year fund inflows reduces exit rates by seven percentage points from the
34.5% estimation sample average, holding all other covariates at their sample means. Columns (6) and (7)
add to this specification our two proxies for the investment opportunities funds faced when deploying
their committed capital. Whether we use industry P/E ratios or industry B/M ratios, the results indicate
that a more favorable investment climate at the time a fund invested its capital is followed by significantly
higher exit rates. Of the two, B/M ratios have the larger economic effect, with a one-standard-deviation
decrease in the B/M ratio among publicly traded companies in the fund’s industry of specialization being
associated with a 7.7 percentage point increase in subsequent exit rates. The models that follow will
include industry B/M ratios, though we note that all results are robust to using industry P/E ratios instead.
3.2 The Effect of Firm Experience on Fund Performance
From now on, we take the model shown in column (7) of Table 3 as our baseline fund performance
model. Before we turn to the effect of network position on fund performance, we control for the
investment experience of the fund’s parent firm using the four proxies described in Table 1. Due to the
high degree of correlation among the four proxies, we include them in the baseline model one at a time. In

20
each case, the explanatory power of the models, shown in Table 4, improves substantially.
However we measure it, funds with more experienced parents perform significantly better. One-
standard-deviation increases in the log number of days since the parent’s first-ever investment, the log
number of rounds the parent has participated in, the log aggregate amount it has invested, and the log
number of portfolio companies it has funded, each measured over the five years ending the year the VC
fund was raised, increase exit rates by 3.7, 3.5, 4.4, and 3.3 percentage points, respectively. Note that the
first-fund dummy loses significance in these models, indicating that it is a poor proxy for experience.
Since the log aggregate investment amount proxy has the largest economic effect, we will use it in all
subsequent models to proxy for the parent firm’s experience. Our results are generally robust to using any
of the other three proxies instead.
3.3 The Effect of Firm Networks on Fund Performance
Having controlled for fund characteristics, competition for deal flow, investment opportunities, and
parent firm experience, does a VC’s network centrality (measured over the prior five years) improve the
performance of its fund (over the next ten years)? The results, shown in Table 5, indicate that it is does.
We estimate five separate regression models, adding our five centrality measures to the specification
shown in column (3) of Table 4. We add them one at a time given the relatively high degree of correlation
among them.19 Each specification in Table 5 suggests that better networked VC firms are associated with
significantly better fund performance, and the adjusted R2 increases to around 19%.20 Of the five network
measures, the eigenvectors have the largest economic effect: A one-standard-deviation increase in this
measure of centrality is associated with a 2.3 percentage point increase in fund performance, all else
equal. The economic effect of the other four measures ranges from one percentage point for betweenness
19 One obvious concern is that our network centrality measures merely proxy for (or are cleaner measures of) VC parent firm experience. However, the pairwise correlations between the experience measure and the five measures of network centralities are relatively low, ranging from 36.8% to 43.9%. These low correlations suggest that the network measures do not simply reflect VC experience. 20 If we restrict the sample to funds raised prior to 1995, to ensure each sample fund has completed its ten-year life, betweenness and outdegree cease to be significant at conventional levels. Indegree, degree, and eigenvectors continue to be positively and significantly related to fund performance.
21
to 2.2 percentage points for indegree.
These results illustrate the importance of considering more than one measure of a VC’s centrality, as
each captures certain unique elements of the VC’s ties to other VCs. Based on the above economic
significance examples, VCs benefit from having many ties (degree), especially when these ties involve
other well-connected VCs (eigenvector), while having the ability to act as a broker between other VCs
(betweenness) plays a lesser role.
3.4 Performance Persistence and Reverse Causality
We do not believe that our results are driven simply by reverse causality (that is, the argument that
superior performance enables VCs to improve their network positions, rather than the other way around).
Recall that we construct the network centrality measures from syndication data for the five years before a
fund is created. The fact that these data can help explain fund performance over the next ten years
suggests that networking truly affects performance.
A potentially more serious concern is persistence in performance from fund to fund. To rule out that
the network measures are simply proxying for omitted persistence in performance, we re-estimate our
fund-level models including among the regressors the exit rate of the VC firm’s most recent past fund.
Note that this restricts our sample to VC firms that have raised at least two funds between 1980 and 1999;
first-time funds and VC firms that do not raise follow-on funds are necessarily excluded.21
The results are shown in Table 6. While we do find evidence of performance persistence, we continue
to find that better networked VC firms enjoy better fund performance, all else equal. The economic
magnitude of the performance persistence is large: A one-standard-deviation increase in the exit rate of
the VC firm’s most recent past fund is associated with a 4.9 percentage point increase in the current
fund’s exit rate. As before, the five network centrality measures affect exit rates positively, and three of
them do so significantly. The economic magnitude remains similar: All else equal, a one-standard-
21 We obtain similar (and somewhat stronger) results if we include all funds, setting the prior performance variable equal to zero for first-time funds and including a dummy variable identifying first-time funds.

22
deviation increase in network centrality is associated with a 2.3, 1.9, and 2.1 percentage point increase in
fund performance, for indegree, degree, and eigenvectors, respectively.
3.5 Exit Rates and Internal Rates of Return
To ascertain the extent to which our measure of fund performance, exit rates, relates to fund returns,
we use a sample of fund IRRs that have recently been disclosed by a number of public pension plans and
state universities following Freedom of Information Act suits. Such data are available for 188 of the 3,469
funds in our sample. While this sample is small and not necessarily representative, it provides us with an
opportunity to partially examine the relation between exit rates and IRRs and thus the robustness of our
fund performance results.
The correlation between exit rates and IRRs is 0.42 (p<0.001), suggesting that exit rates are a useful
but noisy proxy for IRRs. We re-estimate our fund-level performance models on the subsample of funds
for which IRRs are available. (To conserve space, the results are not reported in tables.) This both
weakens and strengthens our results. On the one hand, the coefficients estimated for outdegree, degree,
and betweenness are no longer statistically significant. On the other, the coefficient estimates for indegree
and eigenvector are not only statistically significant, they are also very large economically: IRRs increase
by between 11 and 14 percentage points from the 15% sample average for one-standard-deviation
increases in indegree and eigenvector. The adjusted R2s in all five models are high, ranging from 27.8%
for the outdegree specification to 30% for the eigenvector specification.
There are two rival explanations for the reduced ability of the outdegree, degree, and betweenness
measures to explain fund performance in these specifications. It may be the case that using exit rates gives
rise to misleading inference: i.e., networking can explain exit rates but not IRRs. Or it may be the case
that in the much smaller sample of funds for which IRRs are available, the networking measures have a
hard time explaining both IRRs and exit rates. From the data, it appears the latter is the case. In the
subsample of funds for which we have IRR data, we find none of the five network measures to be
statistically significant in explaining exit rates.

23
Finally, we regress IRRs on exit rates to help interpret economic significance in our exit rate models
(results not shown). On average, funds break even (i.e., IRR=0) at an exit rate of 18.8%. Beyond 18.8%,
each 1% increase in exit rates is associated with a 1.046% increase in IRRs (p<0.001). If we are willing to
assume that the relation between IRRs and exit rates remains roughly one-to-one in the overall sample
(for which we do not have IRR data), this suggests that we can translate the economic significance
exercises in the previous sections into IRR gains on nearly a one-for-one basis. In other words, a two
percentage point increase in exit rates (from the mean of around 35%) is roughly equivalent to a two
percentage point increase in IRR (from a mean of around 15%).
4. Company-level Analysis
We now turn to estimating the effect of VC networking on portfolio company performance. In the
absence of company-level rates of return data, we measure company performance indirectly. In terms of
Figure 2, we model the likelihood that a company survives – in the sense of proceeding to another funding
round or exiting via an IPO or M&A transaction – rather than being written off.22 Our analysis focuses on
the first three funding rounds, for the sake of brevity. While the choice of three rounds is arbitrary, our
results do not change if we consider later rounds as well.
The results are shown in Tables 7 and 8. Table 7 relates company survival over the first three rounds
to the same variables used to model fund performance in Table 4: The characteristics of the lead investor
(such as fund size and whether it is a first-time fund); the VC inflow proxy for competition for deal flow,
measured as of the year in which the funding round took place; the B/M proxy for investment
opportunities in the portfolio company’s Venture Economics industry, as of the funding year; and the four
proxies for the lead investor’s investment experience (measured from the investor’s founding date to the
date of the funding round). Table 8 adds our set of network measures. Though not shown, we also include
industry effects to control for unobserved heterogeneity in company-level survival rates. Recall that
22 All results in this section are robust to restricting the sample to funds raised prior to 1995, to ensure each sample fund has completed its ten-year life.

24
Venture Economics provides no data on company characteristics, such as sales or earnings.
The dependent variable in Tables 7 and 8 is an indicator variable for company survival between
funding rounds, equaling one if the company survived from round N to receive another funding round or
exited successfully, and zero if it was written off after round N. Since we focus on survival from the first
three rounds (i.e., N=1..3), we estimate three separate models labeled in the table as “survived round 1,”
“…2,” and “…3.” Clearly, as survival to round N+1 is conditional on having survived to round N, the
sample size decreases from round to round. (Note also that due to missing fund size data, there are fewer
observations available for estimation than are shown in Figure 2.) To mitigate collinearity problems, we
include the four investment experience proxies one at a time, so Table 7 shows a total of 12 models. In
Table 8, we include only one of the experience proxies and add the five network measures one at a time,
resulting in 15 models. All models are estimated using probit MLE.
4.1 The Determinants of Portfolio Company Survival
We first discuss the results shown in Table 7. The pseudo R2s decrease across the three funding
rounds considered, suggesting that as companies become more established, company-specific variables
(which we cannot control for) become relatively more important drivers of company survival. Our models
explain approximately 9% of the variation in survival rates from round 1, 4% for round 2 survival, and
around 2% for round 3 survival.
We find a significant increasing and concave relation between the lead investor’s fund size and a
portfolio company’s survival from any of the first three rounds. This echoes the finding in the previous
section that larger funds have higher exit rates. First-time funds that lead an investment round are
associated with significantly worse survival probabilities, especially from round 3. The more money the
VC industry raised from investors at the time of the funding round, the less likely a portfolio company is
to survive, and this is true across all three rounds. Interpreting fund inflows as a proxy for competition for
deal flow, this suggests that funds make more marginal investment choices at times when investment
capital is plentiful, leading to poorer survival records. A more favorable investment environment, as
25
proxied by a lower average industry B/M ratio, significantly improves a company’s chances of survival,
again across all three rounds. The beneficial effect of low competition and favorable investment
opportunities is strongest economically in the first two rounds.
Controlling for these factors, we find mixed evidence for the effect of the lead investor’s investment
experience on portfolio company survival. The only proxy that has a consistently positive effect is the log
number of rounds the lead investor has participated in over its lifetime, and even this measure of
experience matters only for survival from rounds 1 and 2; once a company has reached round 3, its
continued survival does not appear to depend on its lead investor’s experience.
Table 8 adds the five network measures one at a time. We measure the VC parent firm’s network
centrality over the five-year window preceding the investment round. (For example, for a second round
investment made in 1995, the centrality measures are calculated from data for the years 1991-1995.) In
each of the fifteen probit models, better networked investors are associated with significantly higher
company survival probabilities. To illustrate the economic magnitude, consider a one-standard-deviation
increase in the lead VC’s eigenvector centrality measure. This increases the survival probability in the
first round from the unconditional expectation of 66.8% to 72.4%, in the second round from 77.7% to
83.4%, and in the third round from 79.2% to 86.4%.
Using a sample of Canadian companies, Brander, Amit, and Antweiler (2002) find that syndicated VC
deals have higher returns. In the same spirit, it is possible that syndication itself may improve a
company’s survival chances. If better-networked VCs are more likely to syndicate a given deal, we may
be confusing the beneficial effects of syndication with the beneficial effect of being backed by a well-
networked VC. To rule out this concern, we re-estimate our models incorporating dummy variables for (a)
whether the current round was syndicated or (b) whether any of the company’s previous investment
rounds was syndicated. To conserve space, we do not report the results in tables. The positive effect of
our network measures on portfolio company survival to the next funding round or exit remains robust to
controlling for whether or not the deal was syndicated.

26
4.2 Pooled Portfolio Company Survival Models
So far, we have estimated round-by-round survival models. We now consider a more parsimonious
specification which takes the panel nature of the data explicitly into account. We track each of the sample
companies from its first funding round across all rounds to the date of its exit or November 2003,
whichever is sooner. In this panel structure, the dependent variable equals one in round N if the company
survived to round N+1. Unless it subsequently exited via an IPO or M&A transaction, the dependent
variable is zero in the company’s last recorded round. All models are estimated using panel probit
estimators with random company effects. The panel is unbalanced since portfolio companies receive
varying numbers of funding rounds. We estimate five models, including the five network measures one at
a time. As before, network centrality is measured from the VC syndication network over the five-year
window preceding the investment round. Note that the identity of the lead investor is allowed to change
across rounds.
The results are reported in Table 9. Irrespective of which aspect of the lead investor’s network
connections we control for, we find a significant increasing and concave relation between the lead
investor’s fund size and a portfolio company’s survival. Greater VC fund inflows and a less favorable
investment environment significantly reduce a company’s chances of survival, as before. The effect of the
lead investor’s investment experience, measured as the lead investor’s log aggregate amount invested,
reduces a company’s survival chances in each of the five specifications.
Controlling for these factors, we find that a portfolio company’s survival probability increases, the
better networked its lead investor. This is true for all five centrality measures. The economic effect is
large. Taking the eigenvector centrality measure to illustrate, a one-standard-deviation increase in this
variable is associated with an 8.2 percentage point increase from the unconditional survival probability of
66.8%, holding all other covariates at their sample means.
4.3 Portfolio Company Exit
Finally, we equate good performance with a successful exit (ignoring survival to another funding

27
round) and ask whether the VC firm’s network centrality helps accelerate a portfolio company’s exit.23
For this purpose, we compute the number of quarters between a company’s first funding round and the
earlier of a) its exit, b) the end of the VC fund’s ten-year life, and c) November 2003. Companies that
have not exited by the fund’s tenth anniversary are assumed to have been liquidated. Companies backed
by funds that are in existence beyond November 2003 are treated as “right-censored” (to allow for the
possibility that they may yet exit successfully after the end of our sample period). Allowing for right-
censoring, the average time-to-exit in our sample is 24 quarters.
We relate the log time-to-exit to our network measures controlling for fund and firm characteristics,
competition for deal flow and investment opportunities at the time of the company’s first funding round,
and conditions in the stock market in general and the IPO and M&A markets in particular. Market
conditions are allowed to vary over time, to allow VC firms to react to improvements in (say) IPO
conditions by taking a portfolio company public. We proxy for conditions in the stock market using the
quarterly return on the NASDAQ Composite Index. To measure exit market conditions, we use the
quarterly log number of IPOs and the quarterly log number of M&A deals in the portfolio company’s
Venture Economics industry. All three variables are lagged by a quarter, to allow for the necessary delay
in preparing a company for exit.
Our time-to-exit models are estimated in the form of accelerated-time-to-failure models.24 These are
hazard (or duration) models written with log time as the dependent variable. Parametric hazard models
require that we specify a distribution for log time. While our results are robust to alternative choices, we
assume that log time is normally distributed. This has the advantage that the hazard rate (the instantaneous
probability of exiting in the next instance given that a company has not exited so far) first increases and
23 Econometrically, this is similar in spirit to Hellmann and Puri (2000) who investigate whether VC backing reduces the time it takes a start-up company to bring its product to market. 24 We obtain qualitatively similar results if we estimate simple probits of whether or not a portfolio company exits successfully. However, probits have two shortcomings in our setting. They cannot account for the right-censoring caused by the fact that some funds remain active beyond the November 2003 end of our sample period; and they cannot easily accommodate controls for exit market conditions, since it is unclear at what point in time such conditions should be measured in the case of companies that do not exit.

28
then decreases over time. Other distributions imply either a constant hazard rate (e.g., exponential) or
hazards that increase (or decrease) monotonically over time (e.g., Weibull or Gompertz). In the context of
VC investments, monotonic hazard functions are implausible: It is neither the case that companies are
never more likely to exit than at the time of their first round (a monotonically decreasing hazard function)
nor that companies become ever more likely to exit the longer they have languished in the VC’s portfolio
(a monotonically increasing hazard function).25
The results are reported in Table 10. While fund size has no effect on time-to-exit, we find that first-
time funds exit their portfolio companies significantly faster, in around 20.5 rather than 24 quarters, all
else equal. This is consistent with Gompers’ (1996) finding that younger funds “grandstand” by taking
portfolio companies public as early as possible. Companies that received their first funding at a time when
a lot of money flowed into the VC industry (interpreted as increased competition for deal flow) or when
industry book-to-market ratios were low (interpreted as relatively poor investment opportunities) take
significantly longer to exit. More experienced VC firms exit their portfolio companies significantly faster.
These results mirror those in the previous tables. In addition, we find that higher returns on the NASDAQ
Composite Index and an increase in the number of IPOs (but not M&A deals) are associated with a
significant increase in the probability that a portfolio company will exit in the next quarter. This is
consistent with Lerner’s (1994b) findings.
Controlling for these effects, we find that each of the five centrality measures has a negative and
significant effect on time-to-exit. Eigenvector has the largest effect economically. A one-standard-
deviation increase in the lead VC’s eigenvector centrality is associated with a two-quarter decrease from
the unconditional time-to-exit of 24 quarters. The corresponding effects for the three degree network
measures are around one quarter. Thus, companies benefit from being backed by VCs who have many ties
(degree), especially when these ties involve other well-connected VCs (eigenvector).
5. Location- and Industry-specific Networks
25 A way of avoiding a specific distribution is to estimate semi-parametric Cox models. This does not affect our results.
29
The network measures we have used thus far implicitly assume that each VC in the U.S. potentially
syndicates with every other VC in the U.S. To the extent that VC networks in truth are more
geographically concentrated, or involve only VCs specializing in a certain industry, we may
underestimate a VC’s network centrality. For instance, a given biotech VC firm may be central in a
network of biotech VCs, but may lack connections to non-biotech VCs in the overall network of U.S.-
based VCs. Similarly, a VC firm headquartered in Silicon Valley may be well connected in California but
not in a network that includes East Coast VC firms.
To assess the robustness of our findings we have re-estimated all our models using centrality
measures derived from (a) industry-specific networks defined using the six broad Venture Economics
industries, and (b) a network of Californian VC firms. (We refrain from constructing networks for other
geographic areas due to the comparatively small number of VC firms in areas outside California.) In each
case, we continue to construct the networks on the basis of trailing five-year windows. To conserve space,
we do not report the results in tables.
Using industry-specific networks slightly strengthens our fund-level results, in the sense of both
higher adjusted R2s and larger economic effects. For instance, a one-standard-deviation increase in a
firm’s indegree increases its funds’ exit rates by 2.5 percentage points in the industry-specific models,
compared to 2.2 percentage points using the overall network. In the company-level models, our results are
qualitatively unchanged compared to Tables 7 through 10, and the industry network measures do not
obviously dominate the overall network measures.
Restricting the network to Californian VCs reduces the sample of funds to 872 funds (for which all
necessary variables are available) and the sample of portfolio companies to 4,691. The network measures
continue to improve fund performance significantly, and the economic magnitude of the effects is
considerably larger than before: On the order of 4-5 percentage point improvements in fund exit rates
(from the unconditional mean of 35.7%), compared to 1-2 percentage points in the overall sample. In the
company-level models, our network measures continue to be positively and significantly related to

30
company survival and exit probabilities, and the economic magnitude of the effects is similar to the
models shown in Tables 8 through 10.
6. Conclusion
Many financial markets are characterized by strong relationships and networks, rather than arm’s-
length, spot-market transactions. We examine the performance consequences of this organizational choice
in the context of relationships established when VCs syndicate portfolio company investments. We use a
comprehensive sample of U.S. based VCs over the period 1980 to 2003. To the best of our knowledge,
this is the first study to examine the relation between fund and portfolio company performance and
measures of networking among VCs.
Controlling for known determinants of VC investment performance, we find that VC funds whose
parent firms enjoy more influential network positions have significantly better performance, as measured
by the proportion of portfolio company investments that are successfully exited through an initial public
offering or a sale to another company. Similarly, the portfolio companies of better networked VC firms
are significantly more likely to survive to subsequent rounds of financing and to eventual exit. The
magnitude of these effects is economically large, and is robust to a wide range of specifications. Our
portfolio company models suggest that the benefits of being associated with a well-connected VC are
more pronounced in later funding rounds. Interestingly, once we control for network effects in our models
of fund and portfolio company performance, the importance of how much investment experience a VC
has is reduced, and in some specifications, eliminated.
Our analysis provides a first look at the importance of networks as a choice of organizational form in
the venture capital industry. We leave for future research the question how networking affects
performance in other financial markets, such as syndicated lending, bond or equity underwriting, and
investment bank-institutional investor relationships.
Our findings have ramifications for institutional investors who are choosing a VC fund in which to
invest, as they suggest that more highly networked VCs may enjoy better investment performance.

31
Additionally, our analysis provides a deeper understanding of the possible drivers of cross-sectional
performance of VC funds, and suggests the importance of additional fundamentals beyond those
previously documented in the academic literature. Finally, our findings shed light on the industrial
organization of the VC market. Given the large returns to being well-networked we document, enhancing
one’s network position should be an important strategic consideration for an incumbent VC, while
presenting a potential barrier to entry for new VCs.
Our finding that better networked VCs enjoy superior performance raises the question of how
networks arise in the first place. What determines a VC’s choice whether or not to network? What are the
costs associated with becoming well-networked? What are the dynamics of network evolution? How does
one form relationships with influential VCs in the network? These questions will be addressed in future
research.

32
Appendix: Network Analysis Example
To illustrate the application of network analysis tools to VC syndication networks, consider a network
of four VCs labeled A, B, C, and D. Suppose their syndication history is as follows:
• Syndicate 1: C (lead), D
• Syndicate 2: C (lead), A, B
• Syndicate 3: A (lead), C
• Syndicate 4: B (lead), A
The corresponding adjacency matrix is
Syndicate members
A B C D
A - 1 1 0 B 1 - 1 0 C 1 1 - 1
Lea
d V
C
D 0 0 1 -
Note that the matrix is symmetric. It reflects the “undirected” ties between the VCs (ignoring the direction
of the ties). Each cell is coded one or zero, to denote the presence or absence of a syndication relationship,
respectively. The following “directed” adjacency matrix accounts for the difference between leading a
syndicate and being a non-lead member:
Syndicate members
A B C D
A - 0 1 0 B 1 - 0 0 C 1 1 - 1
Lea
d V
C
D 0 0 0 -
Here, row vectors record syndicate leadership while column vectors record syndicate membership, and
the matrix is no longer symmetric. The row vectors show that A has led (at least) one syndicate in which
C was a member, B has led at least one syndicate in which A was a member, C has led one syndicate each
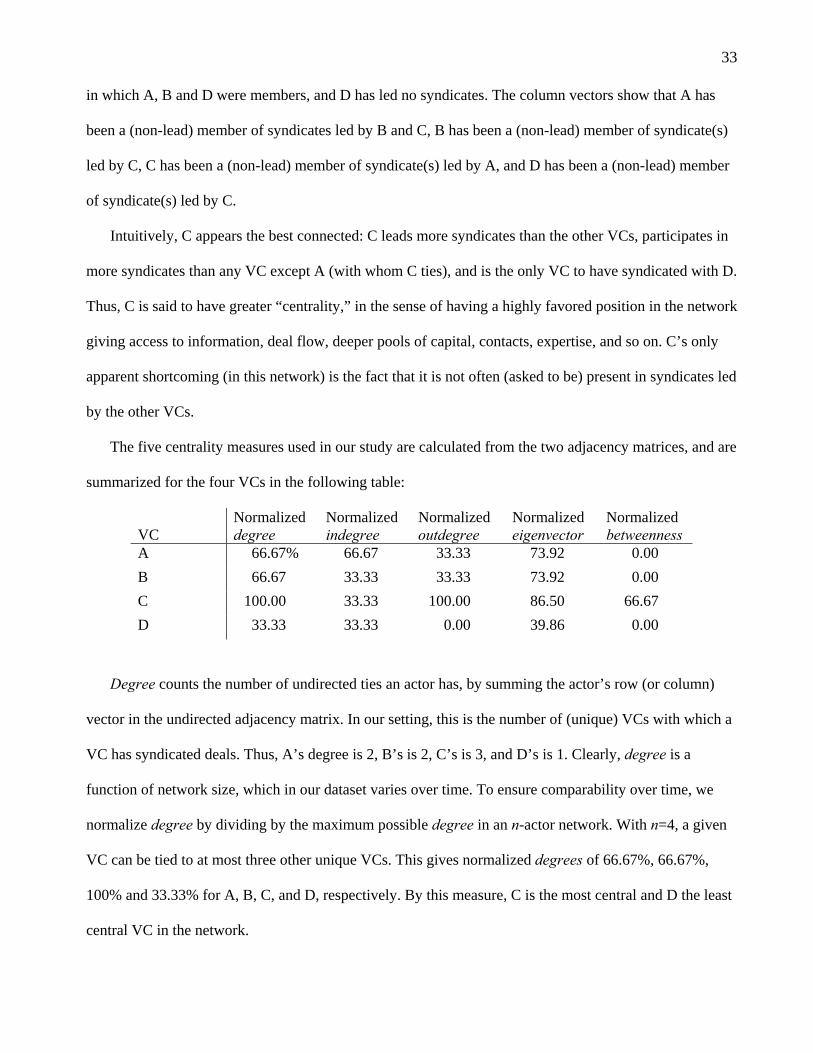
33
in which A, B and D were members, and D has led no syndicates. The column vectors show that A has
been a (non-lead) member of syndicates led by B and C, B has been a (non-lead) member of syndicate(s)
led by C, C has been a (non-lead) member of syndicate(s) led by A, and D has been a (non-lead) member
of syndicate(s) led by C.
Intuitively, C appears the best connected: C leads more syndicates than the other VCs, participates in
more syndicates than any VC except A (with whom C ties), and is the only VC to have syndicated with D.
Thus, C is said to have greater “centrality,” in the sense of having a highly favored position in the network
giving access to information, deal flow, deeper pools of capital, contacts, expertise, and so on. C’s only
apparent shortcoming (in this network) is the fact that it is not often (asked to be) present in syndicates led
by the other VCs.
The five centrality measures used in our study are calculated from the two adjacency matrices, and are
summarized for the four VCs in the following table:
VC
Normalized degree
Normalized indegree
Normalized outdegree
Normalized eigenvector
Normalized betweenness
A 66.67% 66.67 33.33 73.92 0.00 B 66.67 33.33 33.33 73.92 0.00 C 100.00 33.33 100.00 86.50 66.67 D 33.33 33.33 0.00 39.86 0.00
Degree counts the number of undirected ties an actor has, by summing the actor’s row (or column)
vector in the undirected adjacency matrix. In our setting, this is the number of (unique) VCs with which a
VC has syndicated deals. Thus, A’s degree is 2, B’s is 2, C’s is 3, and D’s is 1. Clearly, degree is a
function of network size, which in our dataset varies over time. To ensure comparability over time, we
normalize degree by dividing by the maximum possible degree in an n-actor network. With n=4, a given
VC can be tied to at most three other unique VCs. This gives normalized degrees of 66.67%, 66.67%,
100% and 33.33% for A, B, C, and D, respectively. By this measure, C is the most central and D the least
central VC in the network.

34
Degree does not distinguish between initiating and receiving ties, or in our context, between leading a
syndicate or simply participating in it. Indegree counts the number of directed ties an actor received, by
summing the actor’s column vector in the directed adjacency matrix. In our setting, this is the number of
unique VCs that have led syndicates in which the VC was invited to participate as a non-lead member.
A’s indegree of 2 (or 66.67% when normalized) is the highest in the network. Outdegree measures the
number of ties an actor initiates, by summing the actor’s row vector. In our setting, this is the number of
unique VCs that have participated as (non-lead) members in syndicates led by the VC in question. C’s
outdegree is 3 (or 100% when normalized), reflecting the fact that C has involved every other VC in its
syndicates at least once.
A popular measure of closeness in large networks is eigenvector centrality (Bonacich (1972, 1987)).
It attempts to find the most central actors in the sense of shortest distance from all other actors (where
distances are measured as the shortest number of steps required to reach each “friend of a friend of a
friend...”). It is computed by taking the (scaled) elements of the eigenvector corresponding to the largest
eigenvalue of the adjacency matrix. This yields eigenvector centrality measures of 0.523, 0.523, 0.612
and 0.282 for A, B, C, and D, respectively. These can be normalized by dividing by the maximum
possible eigenvector element value for a four-actor network, yielding normalized eigenvector centrality
measures of 73.92%, 73.92%, 86.5% and 39.86% for A, B, C, and D, respectively.
Finally, betweenness measures the proportion of shortest-distance paths between other actors in the
network that the actor in question lies upon. Imagine a star-shaped network, with one actor connected to
all other actors, none of whom is connected to anyone else. Clearly, the actor at the center of the star
stands “between” all other actors. In our undirected matrix, C occupies such a position with respect to D:
A can reach B and C directly, but must go through C to reach D; B can reach A and C directly, but must
also go through C to reach D; and D can reach C directly, but must go through C to reach either of A or B.
Thus, A, B, and D have zero betweenness while C stands between D and A and between D and B and so

35
has a betweenness measure of 2. The maximum betweenness in a four-actor network is three,26 so the
normalized betweenness measures are 0% for A, B and D, and 66.67% for C.
It is clear from the table that C is the most central VC in the network by all measures save indegree.
This reflects the fact that C is connected to every VC in the network, whereas the other VCs are not, and
the fact that C is present in almost every syndicate that was formed, and led most of the syndicates. C’s
relatively low indegree suggests it is not invited to join many deals (though it may also reflect C’s
tendency to lead deals). C’s high degree and eigenvector centrality measures reflect its central position, or
importance, in the network. Similarly, C’s high betweenness reflects its potential role as a “broker” in the
network, in that C is the sole connector between D and the other VCs.
This example illustrates the importance of considering more than one measure of a VC’s centrality, as
each captures certain unique elements of the VC’s ties to other VCs. That said, it also provides an
indication of the fact that despite these differences, these five centrality measures are still likely to be
highly correlated with each other.
26 To illustrate this, consider the network taking the form of a “Y,” where actors A, C and D sit on the three end points of the “Y” and actor B sits at the center. This is the network configuration that provides the highest number of shortest-distance paths upon which a single actor sits, in this case actor B, who sits upon the shortest-distance paths from A to C, from A to D, and from C to D.

36
References
Benveniste, Lawrence M., and Paul A. Spindt, 1989. ‘How investment bankers determine the offer price and allocation of new issues.’ Journal of Financial Economics 24, 343-361.
Bonacich, Philip, 1972. ‘Factoring and weighting approaches to status scores and clique identification,’ Journal of Mathematical Sociology 2, 113-120.
Bonacich, Philip, 1987. ‘Power and centrality: A family of measures.’ American. Journal of Sociology 92, 1170-1182.
Borgatti, S.P., Everett, M.G. and Freeman, L.C. 2002. Ucinet 6 for Windows. Harvard: Analytic Technologies.
Brander, James, Raphael Amit, and Werner Antweiler, 2002. ‘Venture capital syndication: Improved venture selection versus the value-added hypothesis.’ Journal of Economics and Management Strategy 11, 423-452.
Bygrave, William D., 1987. ‘Syndicated investments by venture capital firms: A networking perspective.’ Journal of Business Venturing 2, 139-154.
Bygrave, William D., 1988. ‘The structure of the investment networks of venture capital firms.’ Journal of Business Venturing 3, 137-158.
Cochrane, John, 2004. ‘The risk and return of venture capital,’ Journal of Financial Economics, forthcoming.
Cornelli, Francesca, and David Goldreich, 2001. ‘Bookbuilding and strategic allocation.’ Journal of Finance 56, 2337-2369.
Corwin, Shane, and Paul Schultz, 2004, ‘The role of IPO underwriting syndicates: Pricing, information production, and underwriter competition.’ Journal of Finance, forthcoming.
Gompers, Paul A., 1995. ‘Optimal investment, monitoring, and the staging of venture capital.’ Journal of Finance 50, 1461-1490.
Gompers, Paul A., 1996. ‘Grandstanding in the venture capital industry.’ Journal of Financial Economics 42, 133-156..
Gompers, Paul A., and Josh Lerner, 1998. ‘What drives fundraising?’ Brookings Papers on Economic Activity: Microeconomics, 149-92.
Gompers, Paul A., and Josh Lerner, 1999a. ‘An analysis of compensation in the U.S. venture capital partnership.’ Journal of Financial Economics 51, 3-44.
Gompers, Paul A., and Josh Lerner, 1999b. The Venture Capital Cycle. MIT Press.
Gompers, Paul A., and Josh Lerner, 2000. ‘Money chasing deals? The impact of fund inflows on private equity valuations.’ Journal of Financial Economics 55, 281-325.
Gorman, Michael and William A. Sahlman, 1989. ‘What do venture capitalists do?’ Journal of Business

37
Venturing 4, 231-248.
Hellmann, Thomas, and Manju Puri, 2000. ‘The interaction between product market and financing strategy: The role of venture capital.’ Review of Financial Studies 13, 959-984.
Hellmann, Thomas J., and Manju Puri, 2002. ‘Venture capital and the professionalization of start-up firms: Empirical evidence.’ Journal of Finance 57, 169-197.
Hochberg, Yael V., 2004. ‘Venture capital and corporate governance in the newly public firm.’ Unpublished working paper, Cornell University.
Hsu, David, 2004. ‘What do entrepreneurs pay for venture capital affiliation?’ Journal of Finance 59, 1805-1844
Jones, Charles M., and Matthew Rhodes-Kropf, 2003. ‘The price of diversifiable risk in venture capital and private equity.’ Unpublished working paper, Columbia University.
Kaplan, Steven N., and Antoinette Schoar, 2004. ‘Private equity returns: Persistence and capital flows.’ Journal of Finance, forthcoming.
Kaplan, Steven N., and Per Strömberg, 2004. ‘Characteristics, contracts and actions: Evidence from venture capital analyses.’ Journal of Finance 59, 2177-2210.
Kaplan, Steven N., Frederic Martel, and Per Strömberg, 2003. ‘How do legal differences and learning affect financial contracts?’ Unpublished working paper, University of Chicago.
Knoke D. and R. S. Burt, 1983. ‘Prominence.’ In Knoke, D. and M. J. Miner, (Eds.), Applied Network Analysis: A Methodological Introduction. Sage, Beverly Hills, CA. 195-222.
Lerner, Josh, 1994a. ‘The syndication of venture capital investments.’ Financial Management 23, 16-27.
Lerner, Josh, 1994b. ‘Venture capitalists and the decision to go public.’ Journal of Financial Economics 35, 293-316.
Lindsey, Laura A., 2003. ‘The venture capital keiretsu effect: An empirical analysis of strategic alliances among portfolio firms.’ Unpublished working paper, Stanford University.
Ljungqvist, Alexander, and Matthew Richardson, 2003. ‘The investment behavior of private equity fund managers.’ Unpublished working paper, New York University.
Podolny, Joel M., 2001. ‘Networks as pipes and prisms of the market.’ American Journal of Sociology 107, 33-60.
Robinson, David T. and Toby E. Stuart, 2004. ‘Network effects in the governance of biotech strategic alliances.’ Unpublished working paper, Columbia University.
Sah, Raaj K., and Joseph E. Stiglitz, 1986. ‘The architecture of economic systems: Hierarchies and poliarchies.’ American Economic Review 76, 716-727.
Sahlman, William A., 1990. ‘The structure and governance of venture capital organizations,’ Journal of Financial Economics 27, 473-421.

38
Stuart, Toby E., Ha Hoang, and Ralph C. Hybels, 1999. ‘Inter-organizational endorsements and the performance of entrepreneurial ventures.’ Administrative Science Quarterly 44, 315-349.
Stuart, Toby E., and Olav Sorensen, 2001. ‘Syndication networks and the spatial distribution of venture capital investments.’ American Journal of Sociology 106, 1546-1588.
Sorensen, Morten, 2003. ‘How smart is smart money? An empirical two-sided matching model of venture capital.’ Unpublished working paper, Stanford University.
Tobin, James, 1969. ‘A general equilibrium approach to monetary theory.’ Journal of Money, Credit, and Banking 1, 15-19.
Wasserman, Stanley, and Katherine Faust, 1997. Social Network Analysis: Methods and Applications. Cambridge University Press, New York, NY.
Wilson, Robert, 1968. ‘The theory of syndicates.’ Econometrica 36, 199-132.
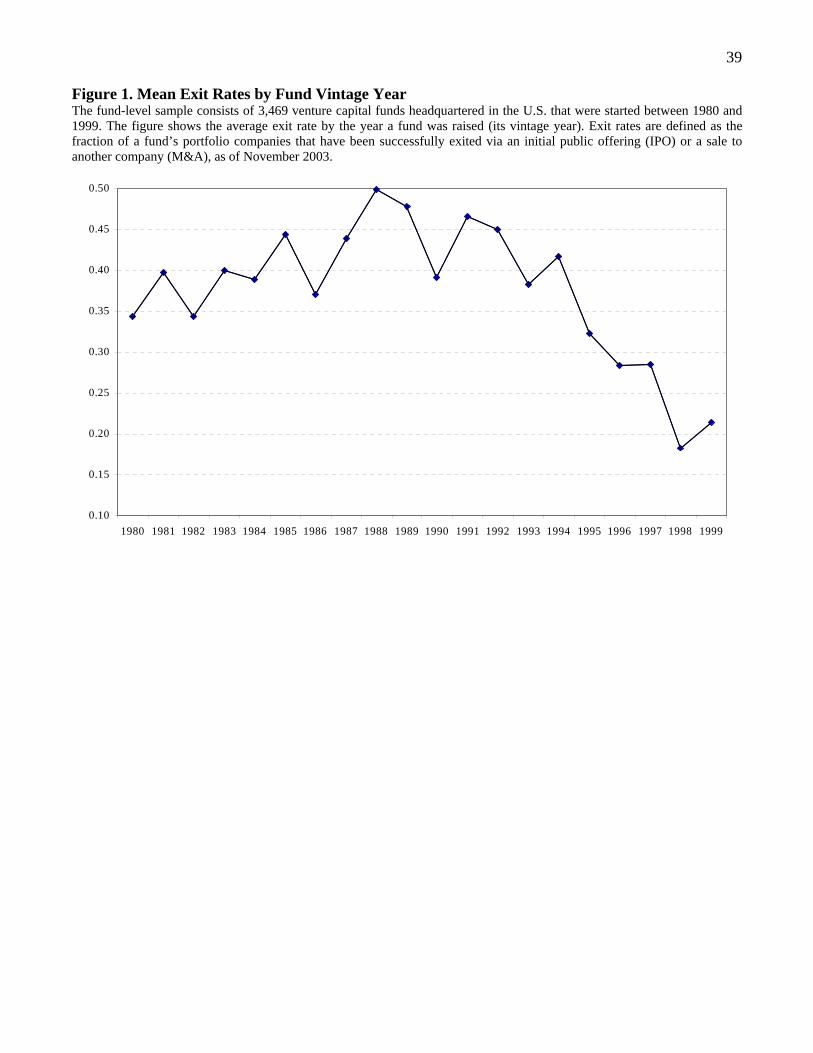
39
Figure 1. Mean Exit Rates by Fund Vintage Year The fund-level sample consists of 3,469 venture capital funds headquartered in the U.S. that were started between 1980 and 1999. The figure shows the average exit rate by the year a fund was raised (its vintage year). Exit rates are defined as the fraction of a fund’s portfolio companies that have been successfully exited via an initial public offering (IPO) or a sale to another company (M&A), as of November 2003.
0.10
0.15
0.20
0.25
0.30
0.35
0.40
0.45
0.50
1980 1981 1982 1983 1984 1985 1986 1987 1988 1989 1990 1991 1992 1993 1994 1995 1996 1997 1998 1999
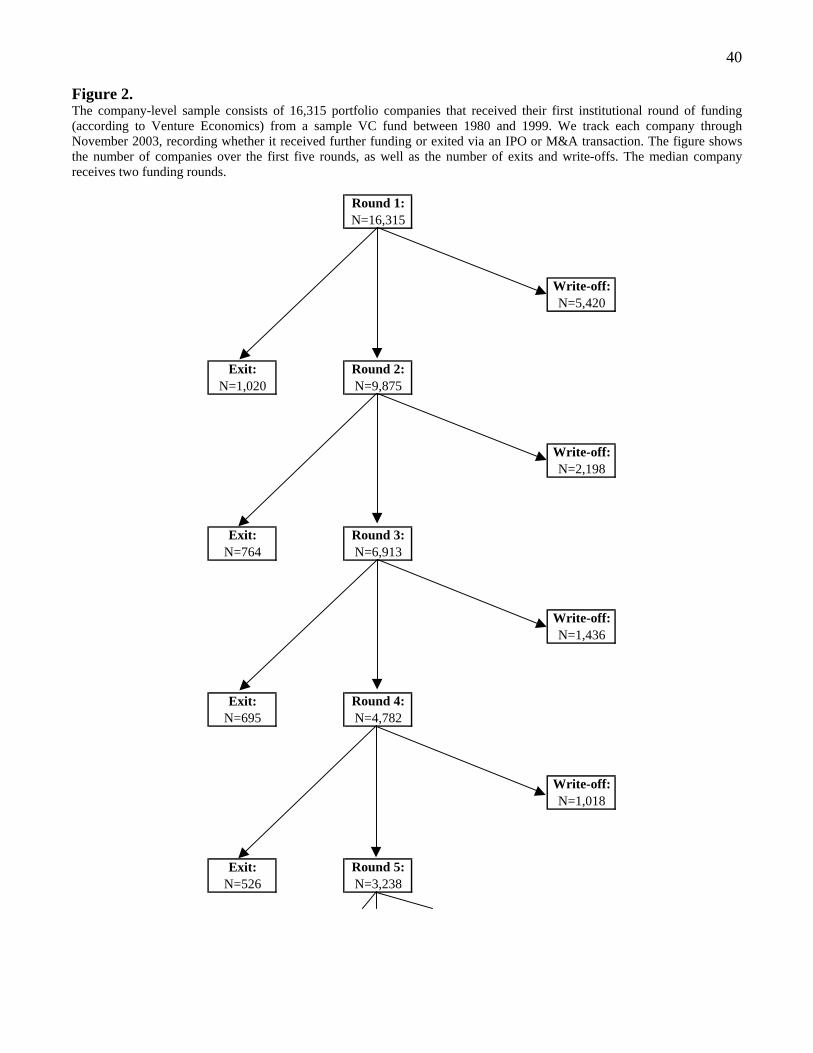
40
Figure 2. The company-level sample consists of 16,315 portfolio companies that received their first institutional round of funding (according to Venture Economics) from a sample VC fund between 1980 and 1999. We track each company through November 2003, recording whether it received further funding or exited via an IPO or M&A transaction. The figure shows the number of companies over the first five rounds, as well as the number of exits and write-offs. The median company receives two funding rounds.
Round 1: N=16,315
Write-off: N=5,420
Exit: N=1,020
Round 2: N=9,875
Write-off: N=2,198
Exit: N=764
Round 3: N=6,913
Write-off: N=1,436
Exit: N=695
Round 4: N=4,782
Write-off: N=1,018
Exit: N=526
Round 5: N=3,238

41
Table 1. Descriptive Statistics The sample consists of 3,469 venture capital funds headquartered in the U.S. that were started between 1980 and 1999 (the “vintage years”). Fund size is the amount of committed capital reported in the Venture Economics database. Sequence number denotes whether a fund is the first, second and so forth fund raised by a particular VC management firm. The classification into seed or early-stage funds follows Venture Economics’ fund focus variable. Absent data on fund returns, we measure a fund’s performance by its exit rate, defined as the fraction of its portfolio companies that have been successfully exited via an initial public offering (IPO) or a sale to another company (M&A), as of November 2003. We also report dollar exit rates, defined as the fraction of the portfolio by invested dollars that has been successfully exited. The four controls for the investment experience of a sample fund’s parent (management) firm are based on the parent’s investment activities measured between the parent’s creation and the fund’s vintage year. By definition, the experience measures are zero for first-time funds. The network measures are derived from adjacency matrices constructed using all VC syndicates over the five years prior to a sample fund’s vintage year. We view networks as existing among VC management firms, not among VC funds, so that a newly-raised fund can benefit from its parent’s pre-existing network connections. A management firm’s outdegree is the number of unique VCs that have participated as non-lead investors in syndicates lead-managed by the firm. (The lead investor is identified as the fund that invests the largest amount in the portfolio company.) A firm’s indegree is the number of unique VCs that have led syndicates the firm was a non-lead member of. A firm’s degree is the number of unique VCs it has syndicated with (regardless of syndicate role). Eigenvector measures how close to all other VCs a given VC is. Betweenness is the number of shortest-distance paths between other VCs in the network upon which the VC sits. Each network measure is normalized by the theoretical maximum (e.g., the degree of a VC who has syndicated with every other VC in the network.) The VC inflows variable is the aggregate amount of capital raised by other VC funds in the sample fund’s vintage year. P/E and B/M are the price/earnings and book/market ratios of public companies in the sample fund’s industry of interest. We take a fund’s industry of interest to be the Venture Economics industry that accounts for the largest share of its portfolio, based on dollars invested. Venture Economics classifies portfolio companies into the following six industries: biotechnology, communications and media, computer related, medical/health/life science, semiconductors/other electronics, and non-high-technology. We map public-market P/E and B/M ratios to these industries based on four-digit SIC codes. The ratios are value-weighted averages measured over a sample fund’s first three years of existence, to control for investment opportunities during the fund’s most active investment phase.
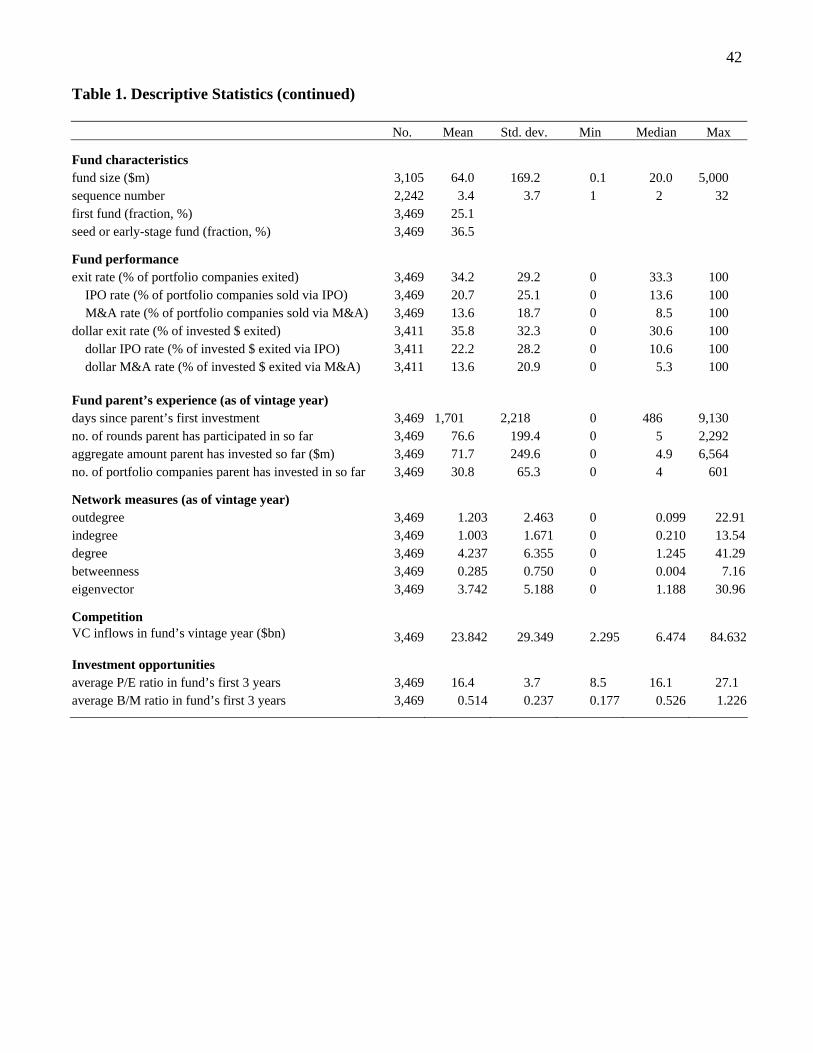
42
Table 1. Descriptive Statistics (continued) No. Mean Std. dev. Min Median Max
Fund characteristics fund size ($m) 3,105 64.0 169.2 0.1 20.0 5,000 sequence number 2,242 3.4 3.7 1 2 32 first fund (fraction, %) 3,469 25.1 seed or early-stage fund (fraction, %) 3,469 36.5
Fund performance exit rate (% of portfolio companies exited) 3,469 34.2 29.2 0 33.3 100 IPO rate (% of portfolio companies sold via IPO) 3,469 20.7 25.1 0 13.6 100 M&A rate (% of portfolio companies sold via M&A) 3,469 13.6 18.7 0 8.5 100 dollar exit rate (% of invested $ exited) 3,411 35.8 32.3 0 30.6 100 dollar IPO rate (% of invested $ exited via IPO) 3,411 22.2 28.2 0 10.6 100 dollar M&A rate (% of invested $ exited via M&A) 3,411 13.6 20.9 0 5.3 100 Fund parent’s experience (as of vintage year) days since parent’s first investment 3,469 1,701 2,218 0 486 9,130 no. of rounds parent has participated in so far 3,469 76.6 199.4 0 5 2,292 aggregate amount parent has invested so far ($m) 3,469 71.7 249.6 0 4.9 6,564 no. of portfolio companies parent has invested in so far 3,469 30.8 65.3 0 4 601
Network measures (as of vintage year) outdegree 3,469 1.203 2.463 0 0.099 22.91indegree 3,469 1.003 1.671 0 0.210 13.54degree 3,469 4.237 6.355 0 1.245 41.29betweenness 3,469 0.285 0.750 0 0.004 7.16eigenvector 3,469 3.742 5.188 0 1.188 30.96
Competition VC inflows in fund’s vintage year ($bn) 3,469 23.842 29.349 2.295 6.474 84.632
Investment opportunities average P/E ratio in fund’s first 3 years 3,469 16.4 3.7 8.5 16.1 27.1 average B/M ratio in fund’s first 3 years 3,469 0.514 0.237 0.177 0.526 1.226
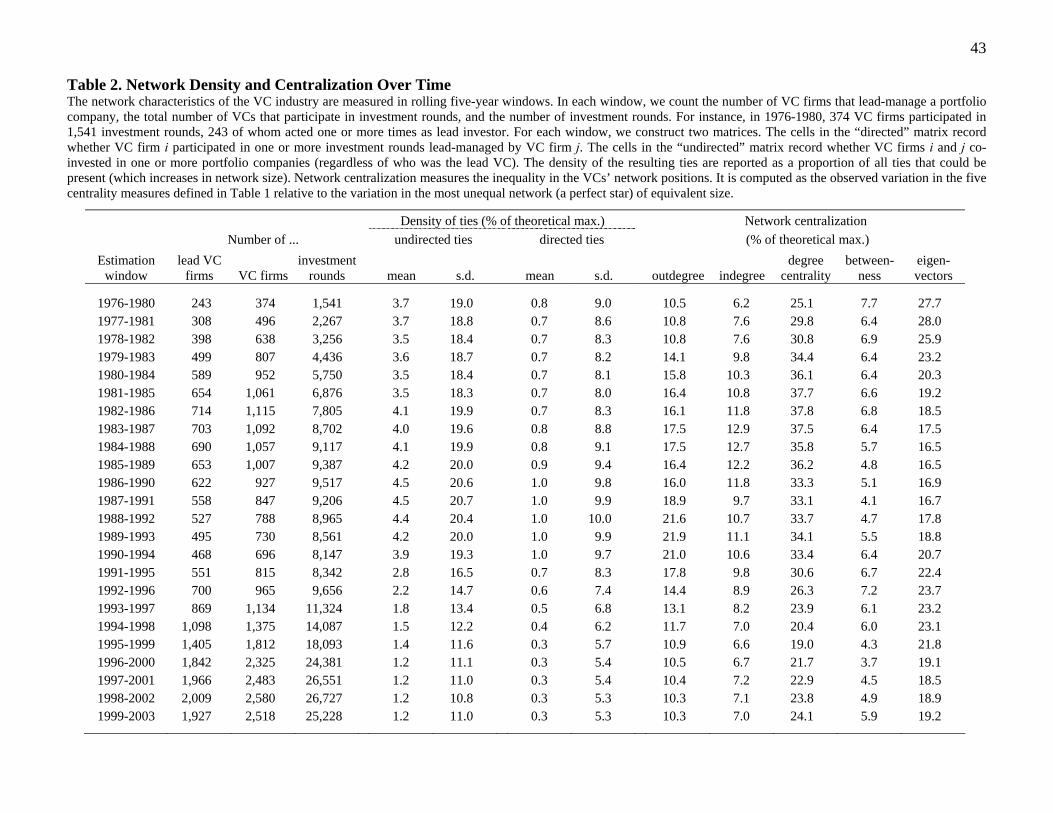
43
Table 2. Network Density and Centralization Over Time The network characteristics of the VC industry are measured in rolling five-year windows. In each window, we count the number of VC firms that lead-manage a portfolio company, the total number of VCs that participate in investment rounds, and the number of investment rounds. For instance, in 1976-1980, 374 VC firms participated in 1,541 investment rounds, 243 of whom acted one or more times as lead investor. For each window, we construct two matrices. The cells in the “directed” matrix record whether VC firm i participated in one or more investment rounds lead-managed by VC firm j. The cells in the “undirected” matrix record whether VC firms i and j co-invested in one or more portfolio companies (regardless of who was the lead VC). The density of the resulting ties are reported as a proportion of all ties that could be present (which increases in network size). Network centralization measures the inequality in the VCs’ network positions. It is computed as the observed variation in the five centrality measures defined in Table 1 relative to the variation in the most unequal network (a perfect star) of equivalent size.
Density of ties (% of theoretical max.) Network centralization Number of ... undirected ties directed ties (% of theoretical max.)
Estimation window
lead VC firms VC firms
investment rounds mean s.d. mean s.d. outdegree indegree
degree centrality
between-ness
eigen-vectors
1976-1980 243 374 1,541 3.7 19.0 0.8 9.0 10.5 6.2 25.1 7.7 27.7 1977-1981 308 496 2,267 3.7 18.8 0.7 8.6 10.8 7.6 29.8 6.4 28.0 1978-1982 398 638 3,256 3.5 18.4 0.7 8.3 10.8 7.6 30.8 6.9 25.9 1979-1983 499 807 4,436 3.6 18.7 0.7 8.2 14.1 9.8 34.4 6.4 23.2 1980-1984 589 952 5,750 3.5 18.4 0.7 8.1 15.8 10.3 36.1 6.4 20.3 1981-1985 654 1,061 6,876 3.5 18.3 0.7 8.0 16.4 10.8 37.7 6.6 19.2 1982-1986 714 1,115 7,805 4.1 19.9 0.7 8.3 16.1 11.8 37.8 6.8 18.5 1983-1987 703 1,092 8,702 4.0 19.6 0.8 8.8 17.5 12.9 37.5 6.4 17.5 1984-1988 690 1,057 9,117 4.1 19.9 0.8 9.1 17.5 12.7 35.8 5.7 16.5 1985-1989 653 1,007 9,387 4.2 20.0 0.9 9.4 16.4 12.2 36.2 4.8 16.5 1986-1990 622 927 9,517 4.5 20.6 1.0 9.8 16.0 11.8 33.3 5.1 16.9 1987-1991 558 847 9,206 4.5 20.7 1.0 9.9 18.9 9.7 33.1 4.1 16.7 1988-1992 527 788 8,965 4.4 20.4 1.0 10.0 21.6 10.7 33.7 4.7 17.8 1989-1993 495 730 8,561 4.2 20.0 1.0 9.9 21.9 11.1 34.1 5.5 18.8 1990-1994 468 696 8,147 3.9 19.3 1.0 9.7 21.0 10.6 33.4 6.4 20.7 1991-1995 551 815 8,342 2.8 16.5 0.7 8.3 17.8 9.8 30.6 6.7 22.4 1992-1996 700 965 9,656 2.2 14.7 0.6 7.4 14.4 8.9 26.3 7.2 23.7 1993-1997 869 1,134 11,324 1.8 13.4 0.5 6.8 13.1 8.2 23.9 6.1 23.2 1994-1998 1,098 1,375 14,087 1.5 12.2 0.4 6.2 11.7 7.0 20.4 6.0 23.1 1995-1999 1,405 1,812 18,093 1.4 11.6 0.3 5.7 10.9 6.6 19.0 4.3 21.8 1996-2000 1,842 2,325 24,381 1.2 11.1 0.3 5.4 10.5 6.7 21.7 3.7 19.1 1997-2001 1,966 2,483 26,551 1.2 11.0 0.3 5.4 10.4 7.2 22.9 4.5 18.5 1998-2002 2,009 2,580 26,727 1.2 10.8 0.3 5.3 10.3 7.1 23.8 4.9 18.9 1999-2003 1,927 2,518 25,228 1.2 11.0 0.3 5.3 10.3 7.0 24.1 5.9 19.2
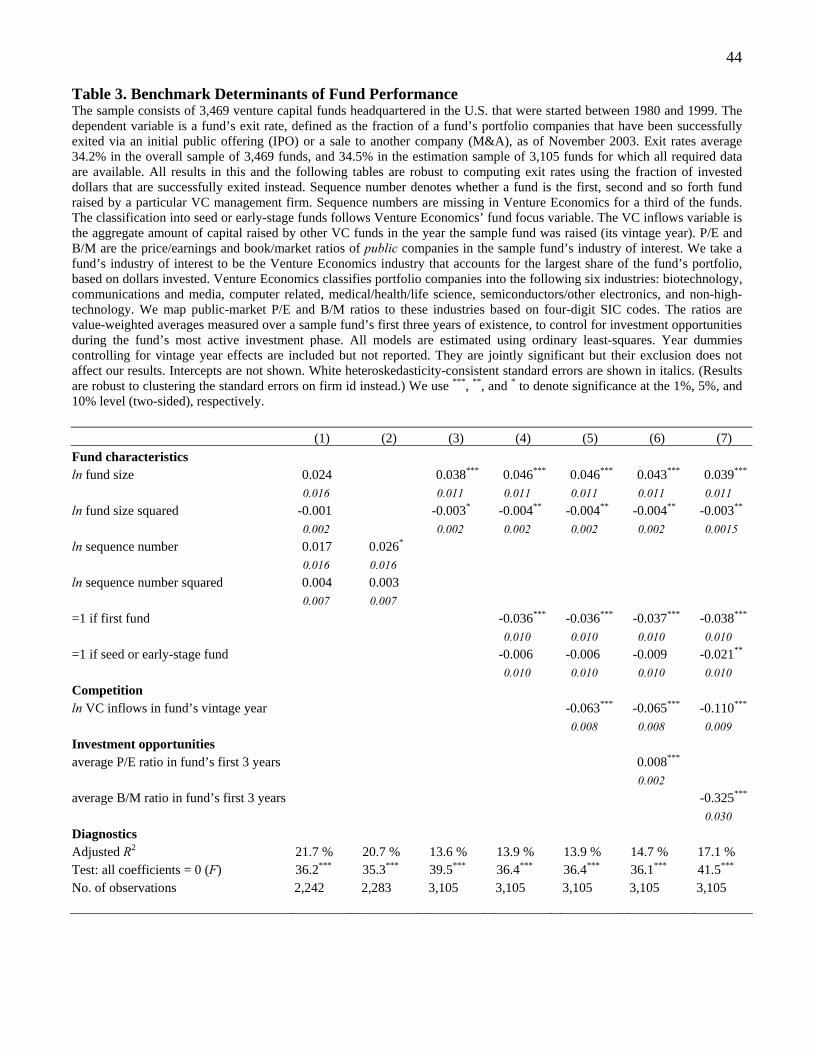
44
Table 3. Benchmark Determinants of Fund Performance The sample consists of 3,469 venture capital funds headquartered in the U.S. that were started between 1980 and 1999. The dependent variable is a fund’s exit rate, defined as the fraction of a fund’s portfolio companies that have been successfully exited via an initial public offering (IPO) or a sale to another company (M&A), as of November 2003. Exit rates average 34.2% in the overall sample of 3,469 funds, and 34.5% in the estimation sample of 3,105 funds for which all required data are available. All results in this and the following tables are robust to computing exit rates using the fraction of invested dollars that are successfully exited instead. Sequence number denotes whether a fund is the first, second and so forth fund raised by a particular VC management firm. Sequence numbers are missing in Venture Economics for a third of the funds. The classification into seed or early-stage funds follows Venture Economics’ fund focus variable. The VC inflows variable is the aggregate amount of capital raised by other VC funds in the year the sample fund was raised (its vintage year). P/E and B/M are the price/earnings and book/market ratios of public companies in the sample fund’s industry of interest. We take a fund’s industry of interest to be the Venture Economics industry that accounts for the largest share of the fund’s portfolio, based on dollars invested. Venture Economics classifies portfolio companies into the following six industries: biotechnology, communications and media, computer related, medical/health/life science, semiconductors/other electronics, and non-high-technology. We map public-market P/E and B/M ratios to these industries based on four-digit SIC codes. The ratios are value-weighted averages measured over a sample fund’s first three years of existence, to control for investment opportunities during the fund’s most active investment phase. All models are estimated using ordinary least-squares. Year dummies controlling for vintage year effects are included but not reported. They are jointly significant but their exclusion does not affect our results. Intercepts are not shown. White heteroskedasticity-consistent standard errors are shown in italics. (Results are robust to clustering the standard errors on firm id instead.) We use ***, **, and * to denote significance at the 1%, 5%, and 10% level (two-sided), respectively. (1) (2) (3) (4) (5) (6) (7) Fund characteristics ln fund size 0.024 0.038*** 0.046*** 0.046*** 0.043*** 0.039***
0.016 0.011 0.011 0.011 0.011 0.011 ln fund size squared -0.001 -0.003* -0.004** -0.004** -0.004** -0.003** 0.002 0.002 0.002 0.002 0.002 0.0015 ln sequence number 0.017 0.026* 0.016 0.016 ln sequence number squared 0.004 0.003 0.007 0.007 =1 if first fund -0.036*** -0.036*** -0.037*** -0.038***
0.010 0.010 0.010 0.010 =1 if seed or early-stage fund -0.006 -0.006 -0.009 -0.021** 0.010 0.010 0.010 0.010 Competition ln VC inflows in fund’s vintage year -0.063*** -0.065*** -0.110***
0.008 0.008 0.009 Investment opportunities average P/E ratio in fund’s first 3 years 0.008*** 0.002 average B/M ratio in fund’s first 3 years -0.325***
0.030 Diagnostics Adjusted R2 21.7 % 20.7 % 13.6 % 13.9 % 13.9 % 14.7 % 17.1 % Test: all coefficients = 0 (F) 36.2*** 35.3*** 39.5*** 36.4*** 36.4*** 36.1*** 41.5*** No. of observations 2,242 2,283 3,105 3,105 3,105 3,105 3,105
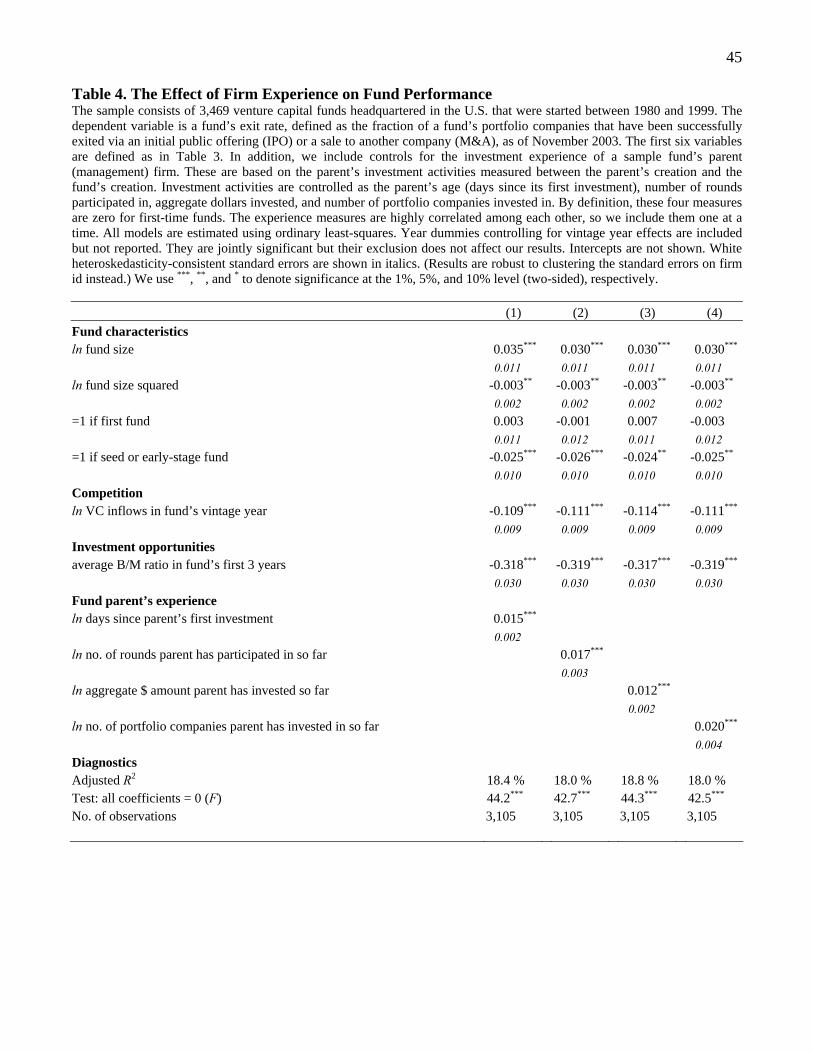
45
Table 4. The Effect of Firm Experience on Fund Performance The sample consists of 3,469 venture capital funds headquartered in the U.S. that were started between 1980 and 1999. The dependent variable is a fund’s exit rate, defined as the fraction of a fund’s portfolio companies that have been successfully exited via an initial public offering (IPO) or a sale to another company (M&A), as of November 2003. The first six variables are defined as in Table 3. In addition, we include controls for the investment experience of a sample fund’s parent (management) firm. These are based on the parent’s investment activities measured between the parent’s creation and the fund’s creation. Investment activities are controlled as the parent’s age (days since its first investment), number of rounds participated in, aggregate dollars invested, and number of portfolio companies invested in. By definition, these four measures are zero for first-time funds. The experience measures are highly correlated among each other, so we include them one at a time. All models are estimated using ordinary least-squares. Year dummies controlling for vintage year effects are included but not reported. They are jointly significant but their exclusion does not affect our results. Intercepts are not shown. White heteroskedasticity-consistent standard errors are shown in italics. (Results are robust to clustering the standard errors on firm id instead.) We use ***, **, and * to denote significance at the 1%, 5%, and 10% level (two-sided), respectively. (1) (2) (3) (4) Fund characteristics ln fund size 0.035*** 0.030*** 0.030*** 0.030***
0.011 0.011 0.011 0.011 ln fund size squared -0.003** -0.003** -0.003** -0.003** 0.002 0.002 0.002 0.002 =1 if first fund 0.003 -0.001 0.007 -0.003 0.011 0.012 0.011 0.012 =1 if seed or early-stage fund -0.025*** -0.026*** -0.024** -0.025** 0.010 0.010 0.010 0.010 Competition ln VC inflows in fund’s vintage year -0.109*** -0.111*** -0.114*** -0.111***
0.009 0.009 0.009 0.009 Investment opportunities average B/M ratio in fund’s first 3 years -0.318*** -0.319*** -0.317*** -0.319***
0.030 0.030 0.030 0.030 Fund parent’s experience ln days since parent’s first investment 0.015*** 0.002 ln no. of rounds parent has participated in so far 0.017*** 0.003 ln aggregate $ amount parent has invested so far 0.012*** 0.002 ln no. of portfolio companies parent has invested in so far 0.020***
0.004 Diagnostics Adjusted R2 18.4 % 18.0 % 18.8 % 18.0 % Test: all coefficients = 0 (F) 44.2*** 42.7*** 44.3*** 42.5*** No. of observations 3,105 3,105 3,105 3,105
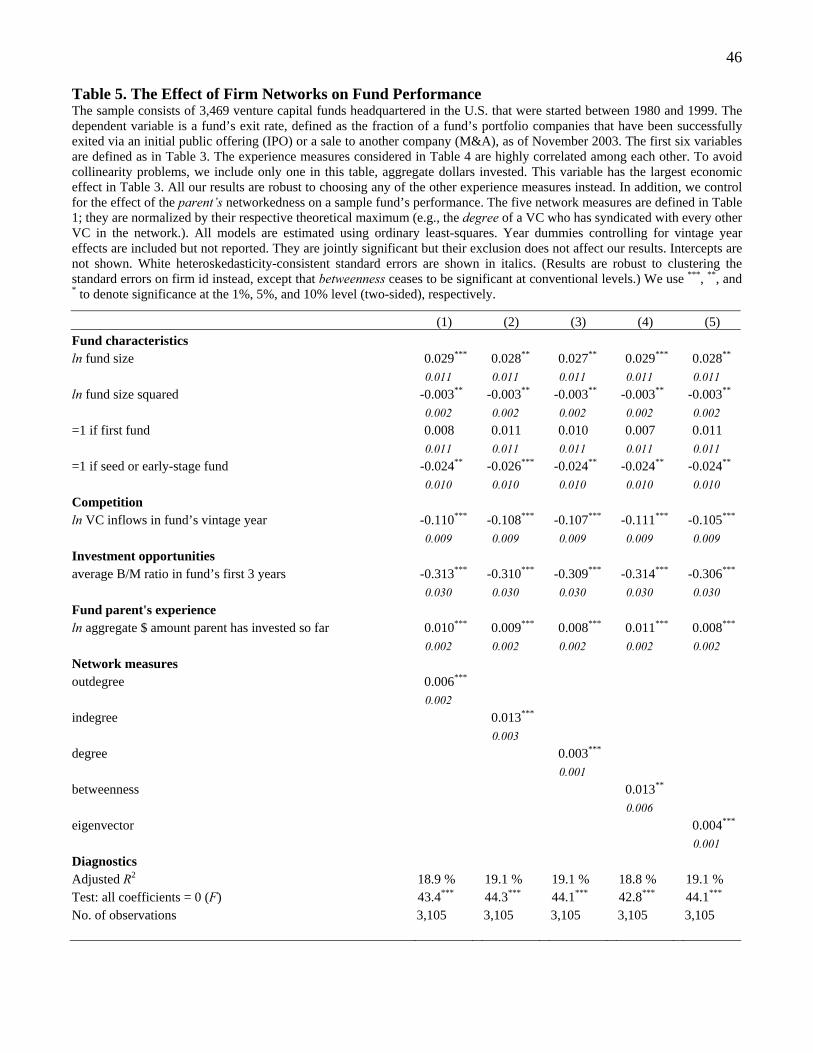
46
Table 5. The Effect of Firm Networks on Fund Performance The sample consists of 3,469 venture capital funds headquartered in the U.S. that were started between 1980 and 1999. The dependent variable is a fund’s exit rate, defined as the fraction of a fund’s portfolio companies that have been successfully exited via an initial public offering (IPO) or a sale to another company (M&A), as of November 2003. The first six variables are defined as in Table 3. The experience measures considered in Table 4 are highly correlated among each other. To avoid collinearity problems, we include only one in this table, aggregate dollars invested. This variable has the largest economic effect in Table 3. All our results are robust to choosing any of the other experience measures instead. In addition, we control for the effect of the parent’s networkedness on a sample fund’s performance. The five network measures are defined in Table 1; they are normalized by their respective theoretical maximum (e.g., the degree of a VC who has syndicated with every other VC in the network.). All models are estimated using ordinary least-squares. Year dummies controlling for vintage year effects are included but not reported. They are jointly significant but their exclusion does not affect our results. Intercepts are not shown. White heteroskedasticity-consistent standard errors are shown in italics. (Results are robust to clustering the standard errors on firm id instead, except that betweenness ceases to be significant at conventional levels.) We use ***, **, and * to denote significance at the 1%, 5%, and 10% level (two-sided), respectively.
(1) (2) (3) (4) (5) Fund characteristics ln fund size 0.029*** 0.028** 0.027** 0.029*** 0.028** 0.011 0.011 0.011 0.011 0.011 ln fund size squared -0.003** -0.003** -0.003** -0.003** -0.003** 0.002 0.002 0.002 0.002 0.002 =1 if first fund 0.008 0.011 0.010 0.007 0.011 0.011 0.011 0.011 0.011 0.011 =1 if seed or early-stage fund -0.024** -0.026*** -0.024** -0.024** -0.024** 0.010 0.010 0.010 0.010 0.010 Competition ln VC inflows in fund’s vintage year -0.110*** -0.108*** -0.107*** -0.111*** -0.105***
0.009 0.009 0.009 0.009 0.009 Investment opportunities average B/M ratio in fund’s first 3 years -0.313*** -0.310*** -0.309*** -0.314*** -0.306***
0.030 0.030 0.030 0.030 0.030 Fund parent's experience ln aggregate $ amount parent has invested so far 0.010*** 0.009*** 0.008*** 0.011*** 0.008***
0.002 0.002 0.002 0.002 0.002 Network measures outdegree 0.006*** 0.002 indegree 0.013*** 0.003 degree 0.003*** 0.001 betweenness 0.013** 0.006 eigenvector 0.004***
0.001 Diagnostics Adjusted R2 18.9 % 19.1 % 19.1 % 18.8 % 19.1 % Test: all coefficients = 0 (F) 43.4*** 44.3*** 44.1*** 42.8*** 44.1*** No. of observations 3,105 3,105 3,105 3,105 3,105
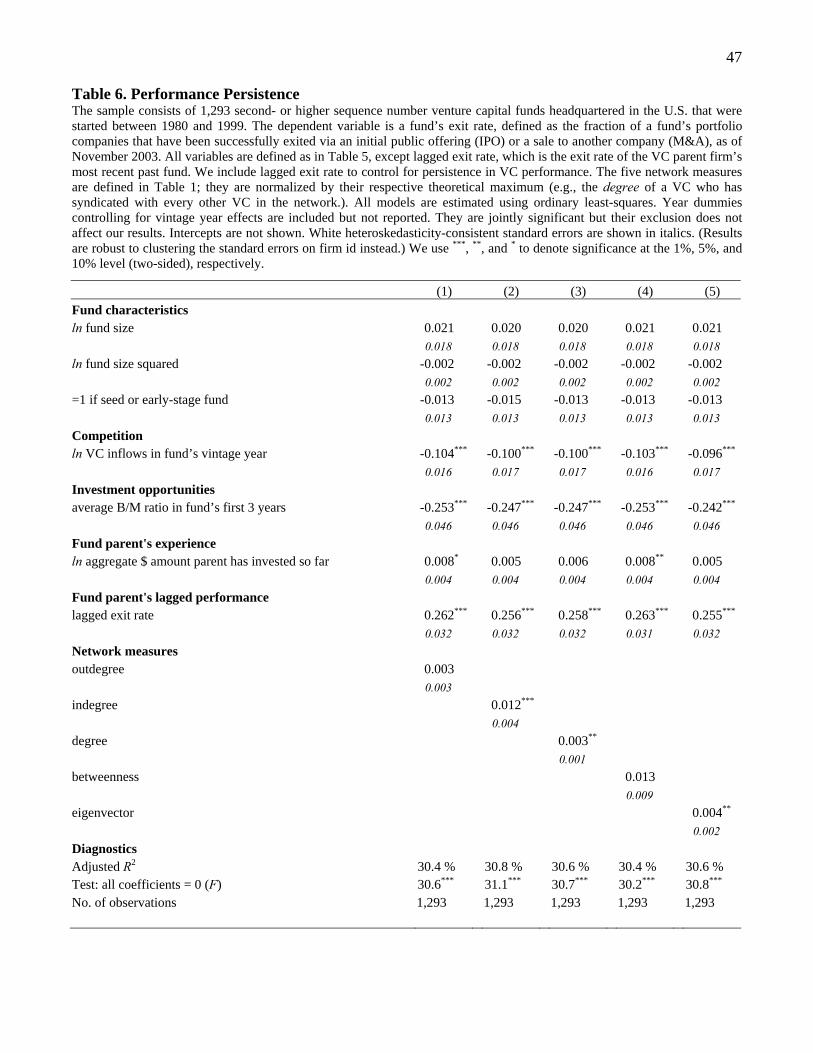
47
Table 6. Performance Persistence The sample consists of 1,293 second- or higher sequence number venture capital funds headquartered in the U.S. that were started between 1980 and 1999. The dependent variable is a fund’s exit rate, defined as the fraction of a fund’s portfolio companies that have been successfully exited via an initial public offering (IPO) or a sale to another company (M&A), as of November 2003. All variables are defined as in Table 5, except lagged exit rate, which is the exit rate of the VC parent firm’s most recent past fund. We include lagged exit rate to control for persistence in VC performance. The five network measures are defined in Table 1; they are normalized by their respective theoretical maximum (e.g., the degree of a VC who has syndicated with every other VC in the network.). All models are estimated using ordinary least-squares. Year dummies controlling for vintage year effects are included but not reported. They are jointly significant but their exclusion does not affect our results. Intercepts are not shown. White heteroskedasticity-consistent standard errors are shown in italics. (Results are robust to clustering the standard errors on firm id instead.) We use ***, **, and * to denote significance at the 1%, 5%, and 10% level (two-sided), respectively.
(1) (2) (3) (4) (5) Fund characteristics ln fund size 0.021 0.020 0.020 0.021 0.021 0.018 0.018 0.018 0.018 0.018 ln fund size squared -0.002 -0.002 -0.002 -0.002 -0.002 0.002 0.002 0.002 0.002 0.002 =1 if seed or early-stage fund -0.013 -0.015 -0.013 -0.013 -0.013 0.013 0.013 0.013 0.013 0.013 Competition ln VC inflows in fund’s vintage year -0.104*** -0.100*** -0.100*** -0.103*** -0.096***
0.016 0.017 0.017 0.016 0.017 Investment opportunities average B/M ratio in fund’s first 3 years -0.253*** -0.247*** -0.247*** -0.253*** -0.242***
0.046 0.046 0.046 0.046 0.046 Fund parent's experience ln aggregate $ amount parent has invested so far 0.008* 0.005 0.006 0.008** 0.005 0.004 0.004 0.004 0.004 0.004 Fund parent's lagged performance lagged exit rate 0.262*** 0.256*** 0.258*** 0.263*** 0.255***
0.032 0.032 0.032 0.031 0.032 Network measures outdegree 0.003 0.003 indegree 0.012*** 0.004 degree 0.003** 0.001 betweenness 0.013 0.009 eigenvector 0.004** 0.002 Diagnostics Adjusted R2 30.4 % 30.8 % 30.6 % 30.4 % 30.6 % Test: all coefficients = 0 (F) 30.6*** 31.1*** 30.7*** 30.2*** 30.8*** No. of observations 1,293 1,293 1,293 1,293 1,293
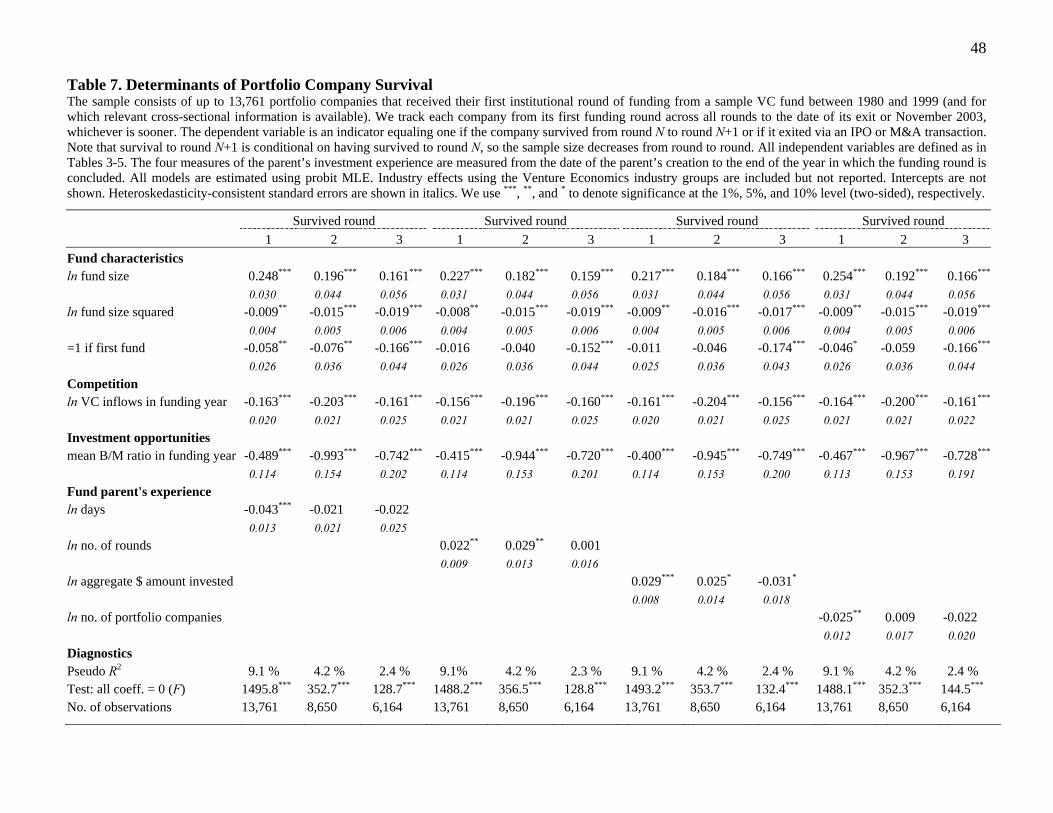
48
Table 7. Determinants of Portfolio Company Survival The sample consists of up to 13,761 portfolio companies that received their first institutional round of funding from a sample VC fund between 1980 and 1999 (and for which relevant cross-sectional information is available). We track each company from its first funding round across all rounds to the date of its exit or November 2003, whichever is sooner. The dependent variable is an indicator equaling one if the company survived from round N to round N+1 or if it exited via an IPO or M&A transaction. Note that survival to round N+1 is conditional on having survived to round N, so the sample size decreases from round to round. All independent variables are defined as in Tables 3-5. The four measures of the parent’s investment experience are measured from the date of the parent’s creation to the end of the year in which the funding round is concluded. All models are estimated using probit MLE. Industry effects using the Venture Economics industry groups are included but not reported. Intercepts are not shown. Heteroskedasticity-consistent standard errors are shown in italics. We use ***, **, and * to denote significance at the 1%, 5%, and 10% level (two-sided), respectively.
Survived round Survived round Survived round Survived round 1 2 3 1 2 3 1 2 3 1 2 3
Fund characteristics ln fund size 0.248*** 0.196*** 0.161*** 0.227*** 0.182*** 0.159*** 0.217*** 0.184*** 0.166*** 0.254*** 0.192*** 0.166*** 0.030 0.044 0.056 0.031 0.044 0.056 0.031 0.044 0.056 0.031 0.044 0.056 ln fund size squared -0.009** -0.015*** -0.019*** -0.008** -0.015*** -0.019*** -0.009** -0.016*** -0.017*** -0.009** -0.015*** -0.019*** 0.004 0.005 0.006 0.004 0.005 0.006 0.004 0.005 0.006 0.004 0.005 0.006 =1 if first fund -0.058** -0.076** -0.166*** -0.016 -0.040 -0.152*** -0.011 -0.046 -0.174*** -0.046* -0.059 -0.166*** 0.026 0.036 0.044 0.026 0.036 0.044 0.025 0.036 0.043 0.026 0.036 0.044 Competition ln VC inflows in funding year -0.163*** -0.203*** -0.161*** -0.156*** -0.196*** -0.160*** -0.161*** -0.204*** -0.156*** -0.164*** -0.200*** -0.161*** 0.020 0.021 0.025 0.021 0.021 0.025 0.020 0.021 0.025 0.021 0.021 0.022 Investment opportunities mean B/M ratio in funding year -0.489*** -0.993*** -0.742*** -0.415*** -0.944*** -0.720*** -0.400*** -0.945*** -0.749*** -0.467*** -0.967*** -0.728*** 0.114 0.154 0.202 0.114 0.153 0.201 0.114 0.153 0.200 0.113 0.153 0.191 Fund parent's experience ln days -0.043*** -0.021 -0.022 0.013 0.021 0.025 ln no. of rounds 0.022** 0.029** 0.001 0.009 0.013 0.016 ln aggregate $ amount invested 0.029*** 0.025* -0.031* 0.008 0.014 0.018 ln no. of portfolio companies -0.025** 0.009 -0.022 0.012 0.017 0.020 Diagnostics Pseudo R2 9.1 % 4.2 % 2.4 % 9.1% 4.2 % 2.3 % 9.1 % 4.2 % 2.4 % 9.1 % 4.2 % 2.4 % Test: all coeff. = 0 (F) 1495.8*** 352.7*** 128.7*** 1488.2*** 356.5*** 128.8*** 1493.2*** 353.7*** 132.4*** 1488.1*** 352.3*** 144.5*** No. of observations 13,761 8,650 6,164 13,761 8,650 6,164 13,761 8,650 6,164 13,761 8,650 6,164
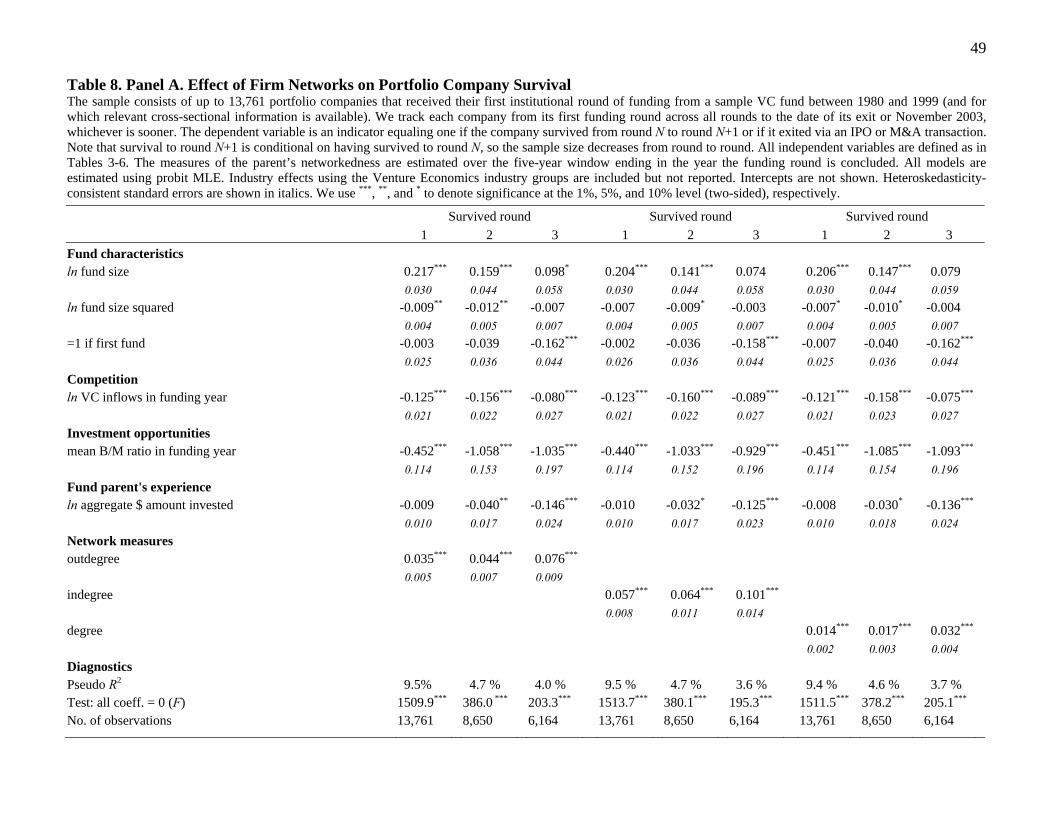
49
Table 8. Panel A. Effect of Firm Networks on Portfolio Company Survival The sample consists of up to 13,761 portfolio companies that received their first institutional round of funding from a sample VC fund between 1980 and 1999 (and for which relevant cross-sectional information is available). We track each company from its first funding round across all rounds to the date of its exit or November 2003, whichever is sooner. The dependent variable is an indicator equaling one if the company survived from round N to round N+1 or if it exited via an IPO or M&A transaction. Note that survival to round N+1 is conditional on having survived to round N, so the sample size decreases from round to round. All independent variables are defined as in Tables 3-6. The measures of the parent’s networkedness are estimated over the five-year window ending in the year the funding round is concluded. All models are estimated using probit MLE. Industry effects using the Venture Economics industry groups are included but not reported. Intercepts are not shown. Heteroskedasticity-consistent standard errors are shown in italics. We use ***, **, and * to denote significance at the 1%, 5%, and 10% level (two-sided), respectively.
Survived round Survived round Survived round 1 2 3 1 2 3 1 2 3
Fund characteristics ln fund size 0.217*** 0.159*** 0.098* 0.204*** 0.141*** 0.074 0.206*** 0.147*** 0.079 0.030 0.044 0.058 0.030 0.044 0.058 0.030 0.044 0.059 ln fund size squared -0.009** -0.012** -0.007 -0.007 -0.009* -0.003 -0.007* -0.010* -0.004 0.004 0.005 0.007 0.004 0.005 0.007 0.004 0.005 0.007 =1 if first fund -0.003 -0.039 -0.162*** -0.002 -0.036 -0.158*** -0.007 -0.040 -0.162*** 0.025 0.036 0.044 0.026 0.036 0.044 0.025 0.036 0.044 Competition ln VC inflows in funding year -0.125*** -0.156*** -0.080*** -0.123*** -0.160*** -0.089*** -0.121*** -0.158*** -0.075*** 0.021 0.022 0.027 0.021 0.022 0.027 0.021 0.023 0.027 Investment opportunities mean B/M ratio in funding year -0.452*** -1.058*** -1.035*** -0.440*** -1.033*** -0.929*** -0.451*** -1.085*** -1.093*** 0.114 0.153 0.197 0.114 0.152 0.196 0.114 0.154 0.196 Fund parent's experience ln aggregate $ amount invested -0.009 -0.040** -0.146*** -0.010 -0.032* -0.125*** -0.008 -0.030* -0.136*** 0.010 0.017 0.024 0.010 0.017 0.023 0.010 0.018 0.024 Network measures outdegree 0.035*** 0.044*** 0.076*** 0.005 0.007 0.009 indegree 0.057*** 0.064*** 0.101*** 0.008 0.011 0.014 degree 0.014*** 0.017*** 0.032*** 0.002 0.003 0.004 Diagnostics Pseudo R2 9.5% 4.7 % 4.0 % 9.5 % 4.7 % 3.6 % 9.4 % 4.6 % 3.7 % Test: all coeff. = 0 (F) 1509.9*** 386.0 *** 203.3*** 1513.7*** 380.1*** 195.3*** 1511.5*** 378.2*** 205.1*** No. of observations 13,761 8,650 6,164 13,761 8,650 6,164 13,761 8,650 6,164
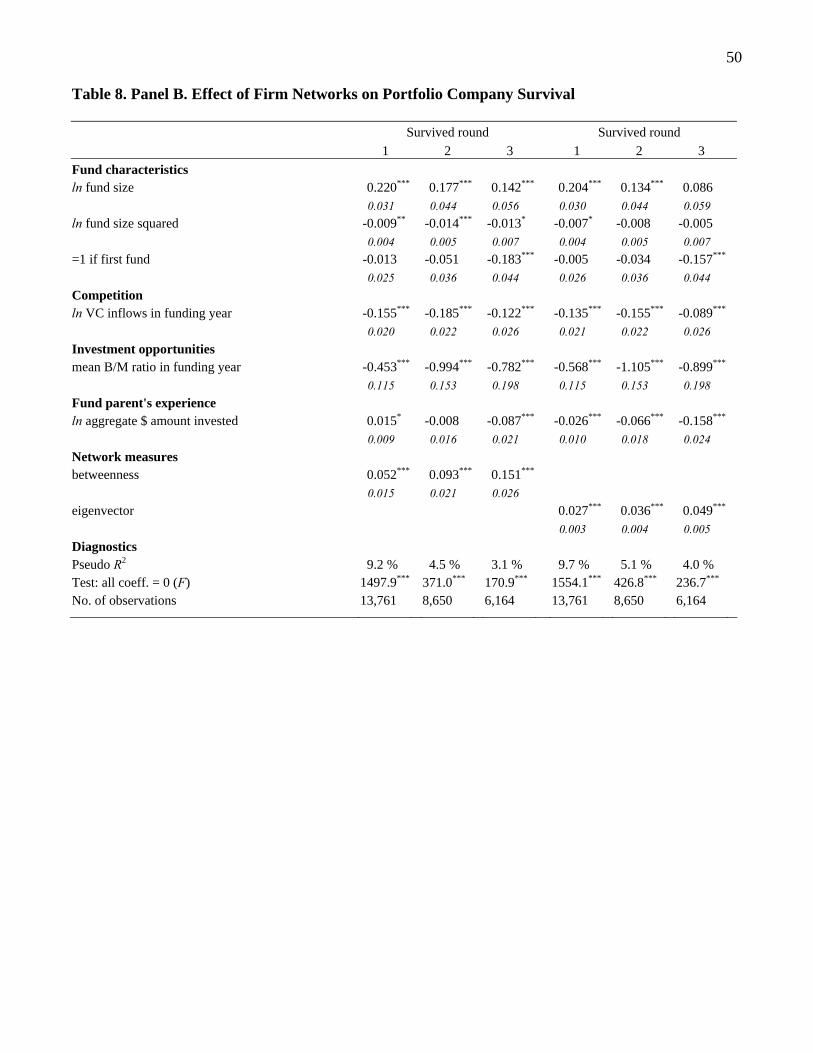
50
Table 8. Panel B. Effect of Firm Networks on Portfolio Company Survival
Survived round Survived round 1 2 3 1 2 3
Fund characteristics ln fund size 0.220*** 0.177*** 0.142*** 0.204*** 0.134*** 0.086 0.031 0.044 0.056 0.030 0.044 0.059 ln fund size squared -0.009** -0.014*** -0.013* -0.007* -0.008 -0.005 0.004 0.005 0.007 0.004 0.005 0.007 =1 if first fund -0.013 -0.051 -0.183*** -0.005 -0.034 -0.157***
0.025 0.036 0.044 0.026 0.036 0.044 Competition ln VC inflows in funding year -0.155*** -0.185*** -0.122*** -0.135*** -0.155*** -0.089***
0.020 0.022 0.026 0.021 0.022 0.026 Investment opportunities mean B/M ratio in funding year -0.453*** -0.994*** -0.782*** -0.568*** -1.105*** -0.899***
0.115 0.153 0.198 0.115 0.153 0.198 Fund parent's experience ln aggregate $ amount invested 0.015* -0.008 -0.087*** -0.026*** -0.066*** -0.158***
0.009 0.016 0.021 0.010 0.018 0.024 Network measures betweenness 0.052*** 0.093*** 0.151*** 0.015 0.021 0.026 eigenvector 0.027*** 0.036*** 0.049***
0.003 0.004 0.005 Diagnostics Pseudo R2 9.2 % 4.5 % 3.1 % 9.7 % 5.1 % 4.0 % Test: all coeff. = 0 (F) 1497.9*** 371.0*** 170.9*** 1554.1*** 426.8*** 236.7*** No. of observations 13,761 8,650 6,164 13,761 8,650 6,164
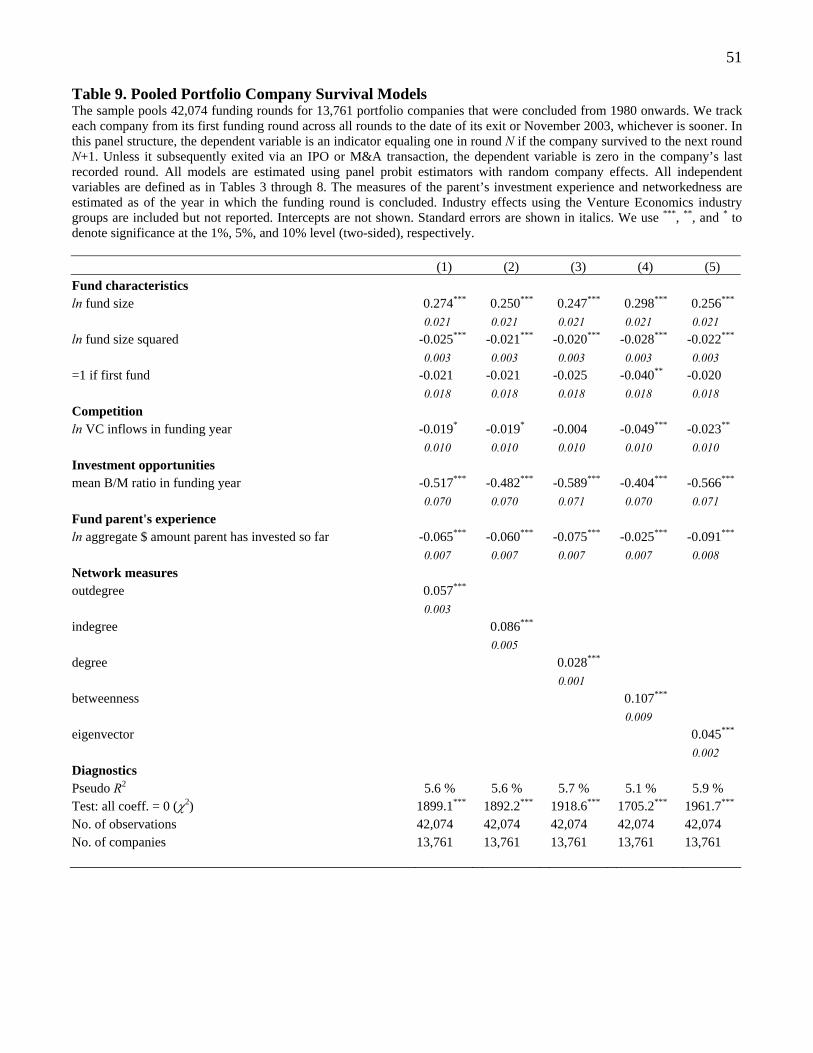
51
Table 9. Pooled Portfolio Company Survival Models The sample pools 42,074 funding rounds for 13,761 portfolio companies that were concluded from 1980 onwards. We track each company from its first funding round across all rounds to the date of its exit or November 2003, whichever is sooner. In this panel structure, the dependent variable is an indicator equaling one in round N if the company survived to the next round N+1. Unless it subsequently exited via an IPO or M&A transaction, the dependent variable is zero in the company’s last recorded round. All models are estimated using panel probit estimators with random company effects. All independent variables are defined as in Tables 3 through 8. The measures of the parent’s investment experience and networkedness are estimated as of the year in which the funding round is concluded. Industry effects using the Venture Economics industry groups are included but not reported. Intercepts are not shown. Standard errors are shown in italics. We use ***, **, and * to denote significance at the 1%, 5%, and 10% level (two-sided), respectively. (1) (2) (3) (4) (5) Fund characteristics ln fund size 0.274*** 0.250*** 0.247*** 0.298*** 0.256*** 0.021 0.021 0.021 0.021 0.021 ln fund size squared -0.025*** -0.021*** -0.020*** -0.028*** -0.022*** 0.003 0.003 0.003 0.003 0.003 =1 if first fund -0.021 -0.021 -0.025 -0.040** -0.020 0.018 0.018 0.018 0.018 0.018 Competition ln VC inflows in funding year -0.019* -0.019* -0.004 -0.049*** -0.023** 0.010 0.010 0.010 0.010 0.010 Investment opportunities mean B/M ratio in funding year -0.517*** -0.482*** -0.589*** -0.404*** -0.566*** 0.070 0.070 0.071 0.070 0.071 Fund parent's experience ln aggregate $ amount parent has invested so far -0.065*** -0.060*** -0.075*** -0.025*** -0.091*** 0.007 0.007 0.007 0.007 0.008 Network measures outdegree 0.057*** 0.003 indegree 0.086*** 0.005 degree 0.028*** 0.001 betweenness 0.107*** 0.009 eigenvector 0.045*** 0.002 Diagnostics Pseudo R2 5.6 % 5.6 % 5.7 % 5.1 % 5.9 % Test: all coeff. = 0 (χ2) 1899.1*** 1892.2*** 1918.6*** 1705.2*** 1961.7*** No. of observations 42,074 42,074 42,074 42,074 42,074 No. of companies 13,761 13,761 13,761 13,761 13,761

52
Table 10. Effect of Network Position on Portfolio Company Exit Duration The sample consists of 13,761 portfolio companies that received their first institutional round of funding (according to Venture Economics) from a sample VC fund between 1980 and 1999 (and for which relevant cross-sectional information is available). We estimate accelerated time-to-exit models (i.e., hazard models written with log time as the dependent variable) where log time is assumed to be normally distributed. (We obtain similar results using other distributions, such as the exponential, Gompertz, and Weibull. Our results are also robust to estimating semi-parametric Cox models.) Positive (negative) coefficients indicate that the covariate increases (decreases) the time a company takes to exit via an IPO or an M&A transaction. Companies that have not exited by the fund’s tenth anniversary are assumed to have been liquidated. Companies backed by funds that are in existence beyond November 2003 are treated as right-censored (to allow for the possibility that they may yet exit successfully after the end of our sample period), and the likelihood function is modified accordingly. The models allow for time-varying covariates. We treat market conditions as time-varying, that is, market conditions change every quarter between the first investment round and the final exit (or the fund’s tenth anniversary, or November 2003). All other independent variables are treated as time-invariant; they are defined as in Tables 3 through 9. The measures of the parent’s investment experience and network centrality are estimated as of the year in which the portfolio company received its first funding round. Intercepts are not shown. Heteroskedasticity-consistent standard errors are shown in italics. We use ***, **, and * to denote significance at the 1%, 5%, and 10% level (two-sided), respectively.
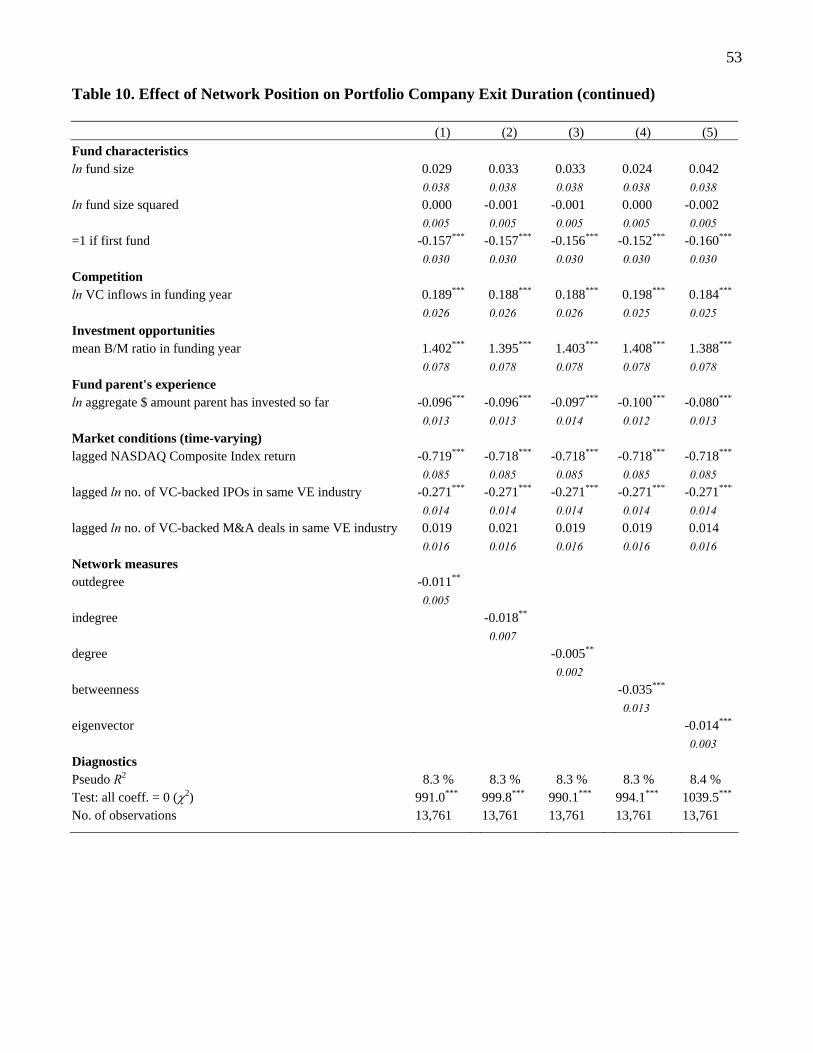
53
Table 10. Effect of Network Position on Portfolio Company Exit Duration (continued) (1) (2) (3) (4) (5) Fund characteristics ln fund size 0.029 0.033 0.033 0.024 0.042 0.038 0.038 0.038 0.038 0.038 ln fund size squared 0.000 -0.001 -0.001 0.000 -0.002 0.005 0.005 0.005 0.005 0.005 =1 if first fund -0.157*** -0.157*** -0.156*** -0.152*** -0.160***
0.030 0.030 0.030 0.030 0.030 Competition ln VC inflows in funding year 0.189*** 0.188*** 0.188*** 0.198*** 0.184*** 0.026 0.026 0.026 0.025 0.025 Investment opportunities mean B/M ratio in funding year 1.402*** 1.395*** 1.403*** 1.408*** 1.388*** 0.078 0.078 0.078 0.078 0.078 Fund parent's experience ln aggregate $ amount parent has invested so far -0.096*** -0.096*** -0.097*** -0.100*** -0.080***
0.013 0.013 0.014 0.012 0.013 Market conditions (time-varying) lagged NASDAQ Composite Index return -0.719*** -0.718*** -0.718*** -0.718*** -0.718***
0.085 0.085 0.085 0.085 0.085 lagged ln no. of VC-backed IPOs in same VE industry -0.271*** -0.271*** -0.271*** -0.271*** -0.271***
0.014 0.014 0.014 0.014 0.014 lagged ln no. of VC-backed M&A deals in same VE industry 0.019 0.021 0.019 0.019 0.014 0.016 0.016 0.016 0.016 0.016 Network measures outdegree -0.011** 0.005 indegree -0.018** 0.007 degree -0.005** 0.002 betweenness -0.035*** 0.013 eigenvector -0.014***
0.003 Diagnostics Pseudo R2 8.3 % 8.3 % 8.3 % 8.3 % 8.4 % Test: all coeff. = 0 (χ2) 991.0*** 999.8*** 990.1*** 994.1*** 1039.5*** No. of observations 13,761 13,761 13,761 13,761 13,761
Recommended