Who Creates Jobs? Small vs. Large vs. Young*
By
John Haltiwanger
University of Maryland and NBER
Ron S Jarmin
U.S. Census Bureau
Javier Miranda
U.S. Census Bureau
August 2011
Abstract: There’s been a long, sometimes heated, debate on the role of firm size in employment
growth. Despite skepticism in the academic community, the notion that growth is negatively
related to firm size remains appealing to policymakers and small business advocates. The
widespread and repeated claim from this community is that most new jobs are created by small
businesses. Using data from the Census Bureau Business Dynamics Statistics and Longitudinal
Business Database, we explore the many issues regarding the role of firm size and growth that
have been at the core of this ongoing debate (such as the role of regression to the mean). We
find that the relationship between firm size and employment growth is sensitive to these issues.
However, our main finding is that once we control for firm age there is no systematic
relationship between firm size and growth. Our findings highlight the important role of business
startups and young businesses in U.S. job creation. Business startups contribute substantially to
both gross and net job creation. In addition, we find an “up or out” dynamic of young firms.
These findings imply that it is critical to control for and understand the role of firm age in
explaining U.S. job creation.
* We thank Philippe Aghion, an anonymous referee, conference and seminar participants at the NBER
2009 Summer Institute Meeting of the Entrepreneurship Working Group, CAED 2009, World Bank 2009
Conference on Small Firms, NABE Economic Policy Conference 2010, OECD Conference on
Entrepreneurship 2010, Queens University and the 2010 WEA meetings for helpful comments. We thank
the Kauffman Foundation for financial support. Any opinions and conclusions expressed herein are those
of the author(s) and do not necessarily represent the views of the U.S. Census Bureau. All results have
been reviewed to ensure that no confidential information is disclosed.
1
1. Introduction
A common popular perception about the U.S. economy is that small businesses create
most private sector jobs. This perception is popular among politicians of different political
persuasions, small business advocates and the business press.1 While early empirical studies
(see, e.g., Birch (1979, 1981, and 1987)) provided support for this perception, a variety of
subsequent empirical studies have highlighted (see, in particular, Davis, Haltiwanger and Schuh
(1996)) statistical and measurement pitfalls underlying much of the evidence in support of this
perception. These include the lack of suitable data to study this issue, the failure to distinguish
between net and gross job creation and statistical problems associated with size classification
methods and regression to the mean.2 From a theoretical perspective the notion of an inverse
relationship between firm size and growth runs counter to that described by Gibrat’s Law (see
Sutton 1997). But in spite of these questions from the academic literature, given the lack of
definitive evidence to the contrary, the popular perception persists.
Neumark, Wall and Zhang (2009) (hereafter NWZ) recently performed a careful analysis
where they avoid the misleading interpretations of the data highlighted by Davis, Haltiwanger
and Schuh (1996 (hereafter DHS). Using the National Establishment Time Series (NETS) data
including coverage across the U.S. private sector from 1992 to 2004, they find an inverse
relationship between net growth rates and firm size. Their analysis indicates small firms
contribute disproportionately to net job growth.
1 Statements that small businesses create most net new jobs are ubiquitous by policymakers. A common claim by
policymakers is that small businesses create 2/3 or more of net new jobs. Every President since President Reagan
has included such statements in major addresses (often in the State of the Union addresses to Congress) and many
other leaders in the U.S. House and Senate have made similar remarks. A list of selected quotes from speeches is
available upon request. 2 Brown, Hamilton and Medoff (1990) raise many related statistical issues in considering statistics by firm size but
focus more on the impact of measurement issues for the employer size wage differential.

2
In this paper, we demonstrate there is an additional critical issue that clouds the
interpretation of previous analyses of the relationship between firm size and growth. Datasets
traditionally employed to examine this relationship contain limited or no information about firm
age. Our analysis emphasizes the role of firm age and especially firm births in this debate3 using
comprehensive data tracking all firms and establishments in the U.S. non-farm business sector
for the period 1976 to 2005 from the Census Bureau’s Longitudinal Business Database (LBD).
As will become clear, the LBD is uniquely well-suited to study these issues on an economy-wide
basis.
Our main findings are summarized as follows. First, consistent with NWZ, when we
only control for industry and year effects, we find an inverse relationship between net growth
rates and firm size, although we find this relationship is quite sensitive to regression to the mean
effects. Second, once we add controls for firm age, we find no systematic relationship between
net growth rates and firm size. A key role for firm age is associated with firm births. We find
that firm births contribute substantially to both gross and net job creation. Importantly, because
new firms tend to be small, the finding of a systematic inverse relationship between firm size and
net growth rates in prior analyses is entirely attributable to most new firms being classified in
small size classes.
3 An important early study that also emphasized the role of firm age for growth dynamics is Evans (1987) who
found an inverse relationship between firm growth and firm size (holding firm age constant) and between firm
growth and firm age (holding firm size constant) using firm level data for U.S. manufacturing firms. As Evans
points out, the work is based on data with substantial limitations for tracking startups and young firms but
interestingly some aspects of his findings hold for our data that does not suffer from the same limitations.
Specifically, the departures from Gibrat’s Law are primarily for young and small firms. A variety of other studies
have also examined the role of employer age for employer dynamics and employment growth including Dunne,
Roberts and Samuelson (1989), Haltiwanger and Krizan (1999), Acs, Armington and Robb (1999). These latter
studies focused on different aspect of the establishment-age establishment-growth relation including patterns of
growth and failure as well as the volatility of new establishments. All of these studies with the exclusion of Acs et al
(1999) are limited to the manufacturing sector.

3
Our findings emphasize the critical role played by startups in U.S. employment growth
dynamics. We document a rich “up or out” dynamic of young firms in the U.S. That is,
conditional on survival, young firms grow more rapidly than their more mature counterparts.
However, young firms have a much higher likelihood of exit so that job destruction from exit is
also disproportionately high among young firms. More generally, young firms are more volatile
and exhibit higher rates of gross job creation and destruction.
These findings highlight the importance of theoretical models and empirical analyses that
focus on the startup process – both the entry process and the subsequent post-entry dynamics
especially in the first ten years or so of a firm’s existence. This is not to deny the importance of
understanding and quantifying the ongoing dynamics of more mature firms but to highlight that
business startups and young firms are inherently different.
Using the rich data available from the LBD and its public use version the Business
Dynamics Statistics (BDS), we highlight how the complex dynamics underlying firm formation,
growth, decline and exit combine to determine net job creation in the economy. The formation
and execution of effective policies intended to increase net job creation require a rich and
nuanced understanding of these processes. A natural conclusion from our findings on the role of
firm size and age is that policies that target businesses of a certain size, while ignoring the role of
age, will likely have limited success in improving net job creation. Our findings show that small,
mature businesses have negative net job creation and economic theory suggests this is not where
job growth is likely to come from. Alternatively, our findings show that startups and young
firms are important sources of job creation but that young firms are inherently volatile with a
high exit rate. It may be that, even if the latter patterns are qualitatively consistent with healthy
business dynamics, the challenges that startups and young firms face (e.g., regulatory challenges

4
and market failures) warrant policy intervention. Exploring the latter is beyond the scope of this
paper, but our findings highlight that effective policy making in this area requires a rich
understanding of such business dynamics. We return to this theme in our concluding remarks.
The rest of paper proceeds as follows. In section 2, we provide further background on the
literature. Section 3 describes the data. Section 4 presents the main empirical results. Section 5
provides concluding remarks. In several places, we point interested readers to a web appendix4
containing several analyses not discussed in detail here.
2. Background
Much of the support for the hypothesis of an inverse relationship between employer size
and growth comes from interpreting patterns observed in public-use data products. An example
is the Census Bureau’s Statistics of U.S. Business (SUSB) that is released in partnership with the
Small Business Administration5. However, as demonstrated by NWZ and confirmed below, this
finding can also be obtained from a careful analysis of business micro data. In this section we
review the data and measurement issues in prior studies of firm size and growth and describe the
characteristics of datasets suited to such analyses. We then briefly highlight findings from the
Census Bureau’s new Business Dynamics Statistics (BDS). This new public-use product gives
data users a much richer window on the interactions of size, age and growth that was previously
only available to those with access to restricted-use data.
2.1 Review of Data and Measurement Issues
Analyses of the relationship between firm size and growth have been hampered by data
limitations and measurement issues. As a consequence these studies fail to emphasize a much
richer description of the firm dynamics associated with the creative destruction process prevalent
4 Available at http://econweb.umd.edu/~haltiwan/Web_Appendix_for_size_age_paper_august13.pdf
5 SUSB data are available at http://www.census.gov/econ/susb/index.html.

5
in market economies. Results from the new public-use BDS as well as from its underlying
source data, the LBD, reveal a more accurate picture of firm dynamics with a more limited role
for firm size per se. This section describes the basic characteristics of these data and how we
address some of the limitations of prior analysis.
The analytical power of the LBD and data products constructed from it for understanding
firm dynamics comes from its ability to accurately track both establishments and their parent
firms over time6. This is a critical feature of the data since it is very difficult to discern the
relationships of interest using only either firm or establishment level data. Measures of job
growth derived solely from establishment-level data have the virtue that they are well-defined;
when we observe an establishment grow we know there are net new jobs at that establishment.
In contrast, job growth observed in firm-level data may simply reflect changes in firm structure
brought about by mergers, acquisitions and divestitures. These activities clearly impact observed
employment at firms engaging in them and are ubiquitous features of market economies. For the
purposes of allocating employment growth across different classes of firms (e.g., by size, age,
industry etc.) we clearly want to abstract from changes that reflect only a reallocation of
employment across firms due to M&A activity.
Having only establishment-level data is inadequate as well. If the only data available are
at the establishment level, the relationship between growth and the size and age of the
establishment may not provide much information about the relevant firm size and firm age. A
large, national retail chain is a useful example. In retail trade, a firm’s primary margin of
expansion is opening new stores rather than the expansion of existing stores (see Doms, Jarmin
6 For purposes of this discussion as well as the subsequent empirical analysis, we use the definitions of
establishments and firms as defined by the U.S. Census Bureau. Specifically, an establishment is a specific physical
location where business activity occurs while a firm reflects all the establishments under common operational
control.

6
and Klimek (2004), Foster, Haltiwanger and Krizan (2006) and Jarmin, Klimek and Miranda
(2009)). This implies there are many new establishments of existing firms and for the core
issues in this paper, the growth from such new establishments should be classified based upon
the size and age of the parent firm, not the size and age of the establishment. Much of the
literature on employer size and net growth has primarily been based on establishment-level or
firm-level data but not both.7 Tracking the dynamics of both firms and their constituent
establishments permits clear and consistent measures of firm growth as well as firm entry and
exit.8
Even with rich source data, a key challenge in analyzing establishment and firm
dynamics is the construction and maintenance of high quality longitudinal linkages that allow
accurate measurement of establishment and firm births and deaths. Given the ubiquitous
changes in ownership among U.S. firms, a common feature observed in business micro data is
spurious firm entry and exit caused by purely legal and administrative actions. Early versions of
the D&B data used by Birch were plagued with these limitations which hampered the ability of
researchers to distinguish between real business dynamics and events triggered by legal actions
or business transactions such as credit applications (see, Birley (1984) and Alrdrich et. al. (1988)
for detailed discussion). The NETS data used by NZW is based on a much improved version of
the D&B data although there are some open questions about the nature of the coverage in
7 DHS analysis is restricted to U.S. manufacturing establishments although they were able to construct a measure of
firm size at the manufacturing level. Dunne, Roberts and Samuelson (1989) examine the role of establishment size
and age for the growth and failure of U.S. manufacturing plants. Evans (1987) used firm-level data for a sample of
firms in the U.S. manufacturing sector in continuous operation between 1976 and 1980. Birch (1979, 1981, 1997)
uses the D&B data that has both firm and establishment-level information although subject to the limitations of the
D&B data. NZW use the NETS data that has both firm and establishment-level information. 8 In our analysis, firm entry is defined when all of the establishments at that firm are de novo establishment entrants.
Likewise, firm exit is defined when all of the establishments at that firm cease operations.

7
NETS.9 For our analysis, we minimize the impact of these data quality issues by utilizing the
LBD’s high quality longitudinal establishment linkages and its within-year linkages of
establishments to their parent firms.
DHS recognized the statistical pitfalls in relating employer size and growth. One issue
they highlight is the role of regression to the mean effects. Businesses that recently experienced
negative transitory shocks (or even transitory measurement error) are more likely to grow while
businesses recently experiencing positive transitory shocks are more likely to shrink. This effect
alone will yield an inverse relationship between size and growth. Friedman (1992) states this
type of regression fallacy “is the most common fallacy in the statistical analysis of economic
data”. This issue is particularly relevant when studying the business size – growth relationship
and is manifest in the method used to classify businesses into size classes in many commonly
used data sources. The early work by Birch and others classified businesses into size classes
using base year employment; a method now known to yield results that suffer from regression to
the mean.
DHS propose an alternative classification method to mitigate the effects of regression to
the mean. They note that, while base year size classification yields a negative bias, using end
year size classification yields a positive bias. To avoid the bias, negative or positive, DHS
propose using a classification based on current average size where current average size is based
on the average of employment in year t-1 and t. Using current average size is a compromise
9 NWZ report about 13.1 million firms and 14.7 million establishments in a typical year. The LBD (and the closely
related County Business Patterns) report about 6 million firms and 7 million establishments in a typical year that
have at least one paid employee. The Census Bureau also reports more than 15 million additional nonemployer
businesses in a typical year. It appears that NETS is some combination of employer and nonemployer businesses
but does not reflect the universe of businesses. For our purposes, we focus on employer businesses. For discussion
of the importance of nonemployer businesses and the relationship between nonemployer and employer businesses
see Davis et. al. (2009). There also remain questions about how well NETS captures startups especially for small
businesses. These questions about coverage also raise questions about whether the type of analysis we conduct here
focusing on the role of firm age would be feasible with NETS. We provide a table comparing the major
characteristics of the principle datasets available to study the dynamics of U.S. businesses in our web appendix.

8
between using year t-1 (base) or year t (end) size to classify firms. In what follows, we refer to
current average size as simply average size.
Even though average size is a compromise, it has limitations as well. Firms that are
impacted by permanent shocks that move the firm across multiple size class boundaries between
t-1 and t will be classified into a size class that is in between the starting and ending size class.
Recognizing this potential limitation, the Bureau of Labor Statistics has developed a dynamic
size classification methodology (see Butani et. al. (2006)).10
Specifically, the methodology
attributes job gains or losses to each of the size classes that the firm passes through in its growth
or contraction. Interestingly, comparisons across size-classification methods show the average
(DHS) and dynamic (BLS) size classification methodologies yield very similar patterns. This is
not surprising since both are a form of averaging over time to deal with transitory shocks.
We prefer the average size class methodology as it is inherently more robust to regression
to the mean effects. However, we also report results using the base year methodology for our
core results and also to explore the sensitivity of the results to this methodological issue11
.
DHS also emphasize avoiding inferences that arise from the distinction between net and
gross job creation. Policy analysts are inherently tempted to want to make statements along the
lines that “small businesses account for X percent of net job creation”. The problem with
statements like this is that many different groupings of establishments can account for a large
share the net job creation since gross job flows dwarf net job flows. For example, the annual net
employment growth rate for U.S. nonfarm private sector business establishments between 1975
and 2005 averaged at 2.2 percent. Underlying this net employment growth rate were
10
Related evaluation work on alternative methodologies by BLS is found in Okolie (2004). We also note that the
BLS BED series releases net and gross job quarterly flows by this firm size measure. The firm size measure they
use is based on a taxpayer ID definition of the firm so that for multi-unit establishment firms that have multiple
taxpayer Ids their firm definition is somewhere between the establishment and overall firm. 11
The web appendix includes all results by base year size methodology.

9
establishment-level average annual rates of gross job creation and destruction of 17.6 percent and
15.4 percent, respectively (statistics from the BDS which are described below). Decomposing
net growth across groups of establishment or firms is problematic (at least in terms of
interpretation) when some shares are negative. We elaborate on these issues in the next
subsection by taking a closer look at the Census Bureau’s new BDS data.
2.2 Overcoming data and measurement issues with the BDS
To help illustrate these points before proceeding to the more formal analysis, we examine
some tabular output from the BDS on net job creation by firm size and firm age. The precise
definitions of firm size and firm age are discussed below (and are described on the BDS website
http://www.ces.census.gov/index.php/bds). Table 1 shows the number of net new jobs by firm
size and firm age class in 2005. The upper panel shows the tabulations using the base year size
method and the lower panel the average size method. The table yields a number of interesting
observations. About 2.5 million net new jobs were created in the U.S. private sector in 2005.
Strikingly, firm startups (firms with age 0) created about 3.5 million net new jobs. In contrast,
every other firm age class except for the oldest firms exhibited net declines in employment in
2005. However, it would be misleading to say that it is only firm startups and the most mature
firms that contributed to job gains. In both panels there are large positive numbers in many cells
but also large negative numbers in other cells. It is also clear that there are substantial
differences in these patterns depending on using the base year or average size method although
some common patterns emerge. For example, excluding startups, firms that have employment
between 5 and 99 workers consistently exhibit declines in net jobs.
The patterns reflect two basic ingredients. Obviously, whether the size/age class
contributes positively or negatively depends on whether that size/age class has a positive or

10
negative net growth rate. In addition, the magnitude of the positive or negative contribution
depends, not surprisingly, on how much employment is accounted for by that cell. That is, a
size/age class may have a large positive number not so much because it has an especially high
growth rate but because it accounts for a large fraction of employment (e.g., a 1 percent growth
rate on a large base yields many net new jobs).
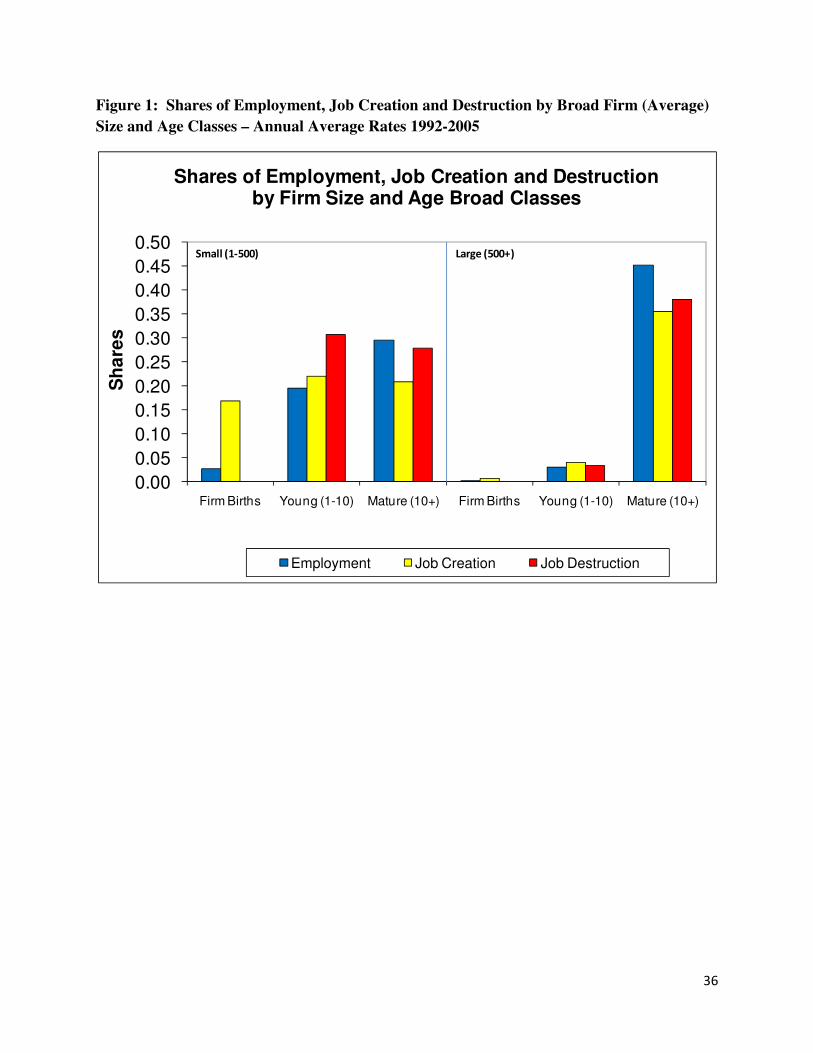
Figure 1 summarizes these patterns in the BDS over the 1992 to 2005 period by broad
size and age classes.12
Figure 1 shows the fraction of job creation and job destruction accounted
for by small (less than 500 workers) and large firms (500 workers and above) broken out by
whether they are firm births, young firms (less than 10 year old firm) or mature firms (10 years
and above). Also included is the share of employment accounted for by each of these groups.
We focus on gross job creation and destruction at the establishment-level but classified by the
characteristics of the firms that own them.
Several observations emerge. First, for the most part the fraction of job creation and
destruction accounted for by the various groups is roughly proportional to the share of
employment accounted for by each group. For example, it is the mature and large firms that
account for most employment (about 45 percent) and most job creation and destruction. This
observation, while not surprising, is important in the debate about what classes of businesses
create jobs. The basic insight is that the firms that have the most jobs create the most jobs – so if
a worker is looking for the places where the most jobs are being created they should go where
the jobs are – large and mature firms. This is not the whole story of course, as what we are
primarily interested in is whether any identifiable groups of firms disproportionately create or
destroy jobs. The rest of the paper is a rigorous examination of this issue. However, Figure 1
12
We use the base year size method in Figure 1. The results in Figure 1 are robust to using either of the size
classification methods discussed in the analysis below. Precise definitions of job creation and destruction are
provided below.

11
nicely previews some of our primary findings. Young firms disproportionately contribute to
both job creation and job destruction. Included among young firms are firm births which, by
definition, contribute only to job creation. Nearly all firm births are small.13
Before the BDS, all
publicly available data that could be used to look at the role of firm size in job creation were
silent on the age dimension. As such, it is easy to see how analysts perceived an inverse
relationship between size and growth in the data. Before proceeding, it is instructive to discuss
briefly the implications of focusing on March-to-March annual changes of employment at the
firm and establishment-level in our analysis of firm dynamics and job creation. One implication
is that we neglect high frequency within year firm and establishment dynamics – e.g., changes
that are transitory and reverse themselves within the year. We think that, for the most part,
neglecting such high frequency variation is not important for the issues of concern in this paper
but would be of more relevance in exploring cyclical volatility by firm size and age.
However, a related implication of focusing on March-to-March annual changes is that
very short lived firms that enter and exit between March of one year and March of the
subsequent year are not captured in our analysis. The neglect of the latter might be important in
the current context given our findings of the important role of firm births for job creation as is
evident in Table 1 and Figure 1. Fortunately, the LBD includes information that suggests that
such short-lived firm births are not especially important. That is, the LBD also includes annual
payroll for all establishments and firms. The payroll measure captures any positive activity of
establishments and firms including very short lived firms, whereas employment is only measured
as of March 12th. Using the same longitudinal links as used in the BDS and LBD, we calculated
the payroll-weighted firm entry rate as 1.72 percent of payroll. This compares to the
13
Some large births are present in the data. These are unusual but appear to be legitimate often operating as
professional employer organizations.

12
employment-weighted firm entry rate of 2.79 percent of employment in Figure 1. It is not
surprising that the payroll-weighted entry rate is lower than the employment-weighted entry rate
given that entrants are small and pay lower wages. Of more interest is how much of the payroll-
weighted entry rate is accounted for by very short lived entrants. Excluding the short lived
entrants (defined as firm startups that don’t survive until March), the payroll-weighted entry rate
is 1.64 percent. This negligible decline in the payroll-weighted entry rate from short-lived
entrants implies that such entrants account for very little of the activity even for startups.
Abstracting from such short-lived firms should not have a quantitatively important impact on our
analysis. It does, however, remind us of the highly volatile nature of startups, an issue that we
discuss further below.
3. Data and Measurement
The Longitudinal Business Database (LBD) underlies the public use statistics in the BDS
just discussed. As the last section suggested, many of the patterns we discuss in this paper can
be readily seen in the public domain BDS. However, we use the LBD micro data rather than the
BDS so we can control for detailed industry and firm age effects in our analysis. 14
The LBD (Jarmin and Miranda (2002)) covers all business establishments in the U.S.
private non-farm with at least one paid employee.15
The LBD begins in 1976 and currently
covers over 30 years of data including information on detailed industry and employment for
every establishment. For the analysis in this paper, we use 4-digit SIC codes through 2001 and
14
Current BDS data are available only at the broad sector level. The LBD micro data allow for us to control for
detailed industry (4-digit SIC or 6-digit NAICS as appropriate) in our analysis. We have replicated our main
findings using an extended version of the BDS with cell based regressions at the detailed industry, age and size level
of aggregation. We have also found that the basic patterns we report also hold using the public domain BDS
controlling only for broad sector. 15
This is one clear distinction with the NETS database which apparently includes both employer and nonemployer
businesses (but also apparently not the universe of both).

13
6-digit NAICS codes between 2002 and 2005.16
We note that the LBD (and in turn the BDS)
employment and job creation numbers track closely those of the County Business Patterns and
Statistics of U.S. Business programs of the U.S. Census Bureau (see Haltiwanger, Jarmin and
Miranda (2009)) as they all share the Census Bureau’s Business Register (BR) as their source
data. However, due to design features and differences in processing, in particular the correction
of longitudinal establishment and firm linkages, the statistics generated from the LBD diverge
slightly from those in CBP and SUSB.
The unit of observation in the LBD is the establishment defined as a single physical
location where business is conducted. Each establishment-year record in the LBD has a firm
identifier associated with it so it is possible to track the ownership structure of firms in any given
year as well as changes over time. Firms can own a single establishment or many
establishments. In some cases these firms span multiple geographic areas and industries.
Establishments can be acquired, divested or spun off into new firms so the ownership structure of
firms can be very dynamic and complex. We use these firm level identifiers to construct firm
level characteristics for each establishment in the LBD
3.1 Measuring Firm Age and Firm Size
The construction of firm size measures is relatively straightforward. Firm size is constructed
by aggregating employment across all establishments that belong to the firm. As discussed
above, we measure firm size using both the base year and average size methodologies. For base
year firm size, we use the firm size for year t-1 for all businesses except for new firms. For new
16
The research analytical database we developed for this paper runs through 2005. The LBD is periodically updated
as are the public domain BDS statistics. As of July 2010, the LBD and BDS include data through reference year
2009. Note, however, that the base LBD does not yet include the firm level links and methods we use in this paper
that permit to easily abstract from M&A activity and measuring firm births, firm exits, net firm growth and firm job
creation and destruction. Future versions of the LBD will incorporate this methodology so that these statistics can
become part of the BDS release.

14
firms, we follow the approach used by Birch and others and allocate establishments belonging to
firm startups to the firm size class in year t. For average size, we use the average of firm size in
year t-1 and year t. We use the same approach for new, existing and exiting firms when using
average size.
The construction of firm age presents more difficult conceptual and measurement
challenges. We follow the approach adopted for the BDS and based on our prior work (see, e.g.,
Becker et. al. (2006) and Davis et. al. (2007)). The firm identifiers in the LBD are not explicitly
longitudinal. Nevertheless, they are useful for tracking firms and their changing structure over
time. A new firm identifier can appear in the LBD either due to a de novo firm birth or due to
changes in existing firms. For example, a single location firm opening additional locations is the
most common reason for a continuing firm in the LBD to experience a change in firm ID. Other
reasons include ownership changes through M&A activity. When a new firm identifier appears
in the LBD, for whatever reason, we assign the firm an age based upon the age of the oldest
establishment that the firm owns in the first year the new firm ID is observed. The firm is then
allowed to age naturally (by one year for each additional year the firm ID is observed in the data)
regardless of mergers or acquisitions and as long as the firm ownership and control does not
change. An advantage of this approach is that firm births as well as firm deaths are readily and
consistently defined. That is, a firm birth is defined as a new firm ID where all the
establishments at the firm are new (entering) establishments. Similarly, a firm death is defined
as when a firm ID disappears and all of the establishments associated with that firm ID cease
operations and exit. If a new firm identifier arises through a merger of two pre-existing firms,
we don’t treat it as a “firm birth”. Rather the new firm entity associated with the new identifier

15
is given a firm age equal to the age of the oldest continuing establishment of the newly combined
entity.
Thus, our firm size and age measures are robust to ownership changes. For a pure
ownership change with no change in activity, there will be no spurious changes in firm size or
firm age. When there are mergers, acquisitions, or divestitures, firm age will reflect the age of
the appropriate components of the firm. Firm size will change but in a manner also consistent
with the change in the scope of activity.
Before proceeding, we note that we focus on growth dynamics of establishments and
firms over the 1992 to 2005 period. We limit our analysis to this period so that we can define
firm age consistently over the period for all establishments with firm age less than 15 years. We
also include a category for establishments belonging to firms that are 16 years or older (in 1992
these are the firms with establishments in operation in 1976 and for which we can not give a
precise measure of firm or establishment age).
3.2 The Establishment-Level and Aggregate Growth Rate Concepts
This section describes the establishment and firm-level growth rate measures we use in
the paper in more detail. Let itE be employment in year t for establishment i. In the LBD,
establishment employment is a point-in-time measure reflecting the number of workers on the
payroll for the payroll period that includes March 12th. We measure the establishment-level
employment growth rate as follows:
itititit XEEg /)( 1−−= ,
where
)(*5. 1−+= ititit EEX .
16
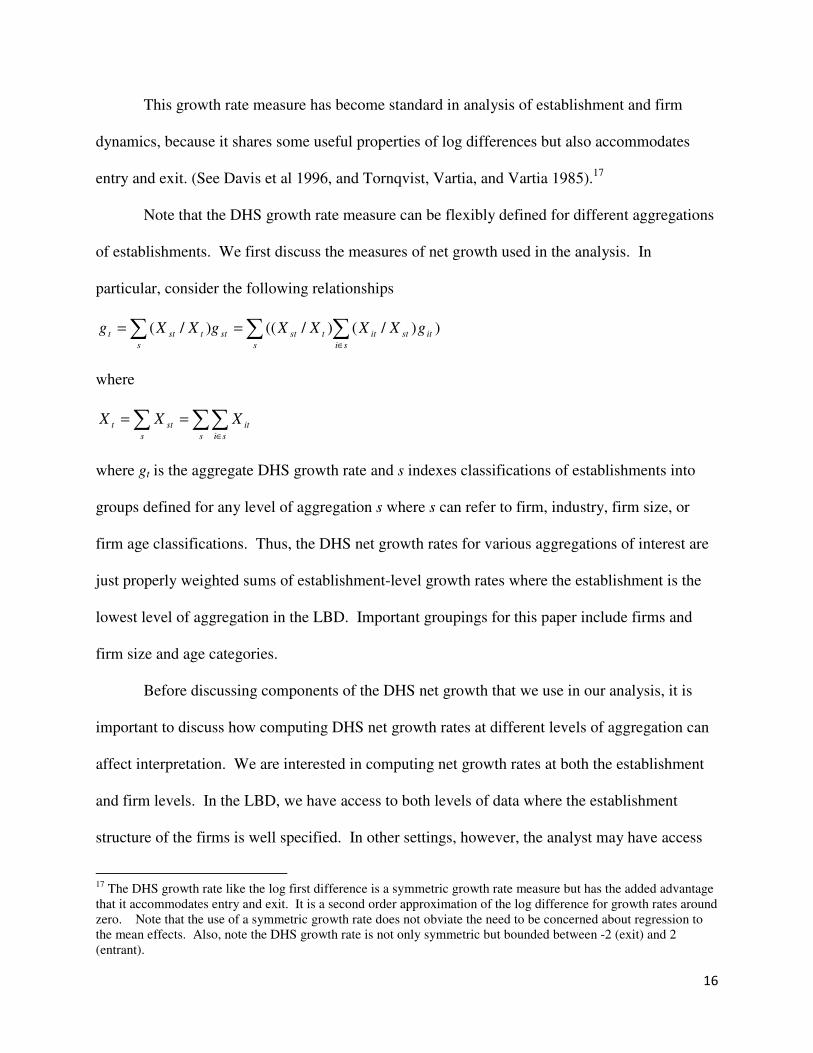
This growth rate measure has become standard in analysis of establishment and firm
dynamics, because it shares some useful properties of log differences but also accommodates
entry and exit. (See Davis et al 1996, and Tornqvist, Vartia, and Vartia 1985).17
Note that the DHS growth rate measure can be flexibly defined for different aggregations
of establishments. We first discuss the measures of net growth used in the analysis. In
particular, consider the following relationships
))/()/(()/( it
si
stit
s
tstst
s
tstt gXXXXgXXg ∑∑∑∈
==
where
∑∑∑∈
==
s si
it
s
stt XXX
where gt is the aggregate DHS growth rate and s indexes classifications of establishments into
groups defined for any level of aggregation s where s can refer to firm, industry, firm size, or
firm age classifications. Thus, the DHS net growth rates for various aggregations of interest are
just properly weighted sums of establishment-level growth rates where the establishment is the
lowest level of aggregation in the LBD. Important groupings for this paper include firms and
firm size and age categories.
Before discussing components of the DHS net growth that we use in our analysis, it is
important to discuss how computing DHS net growth rates at different levels of aggregation can
affect interpretation. We are interested in computing net growth rates at both the establishment
and firm levels. In the LBD, we have access to both levels of data where the establishment
structure of the firms is well specified. In other settings, however, the analyst may have access
17
The DHS growth rate like the log first difference is a symmetric growth rate measure but has the added advantage
that it accommodates entry and exit. It is a second order approximation of the log difference for growth rates around
zero. Note that the use of a symmetric growth rate does not obviate the need to be concerned about regression to
the mean effects. Also, note the DHS growth rate is not only symmetric but bounded between -2 (exit) and 2
(entrant).
17
to only establishment, or only firm-level data. Thus, it is critical to understand how using one or
the other can affect interpretation.
An important difference in computation and interpretation arises when establishments
undergo changes in ownership due to mergers, divestitures or acquisitions. In these instances,
net growth rates computed from firm-level data alone will reflect changes in firm employment
due to adding and/or shedding continuing establishments. This occurs even if the added and/or
shed establishments experience no employment changes themselves.
To avoid this problem we compute firm growth rates as suggested in the expressions
above. Namely, the period t-1 to period t net growth rate for a firm is the sum of the
appropriately weighted DHS net growth rate of all establishments owned by the firm in period t,
including acquisitions, plus the net growth attributed to establishments owned by the firm in
period t-1 that it has closed before period t. For any continuing establishment that changes
ownership, this method attributes any net employment growth to the acquiring firm. Note,
however, if the acquired establishment exhibits no change in employment there will be no
accompanying change in firm level employment induced by this ownership change. The general
point is that this method for computing firm-level growth captures only “organic” growth at the
establishment-level and abstracts from changes in firm-level employment due to M&A activity.18
We use the establishment and firm-level growth rate measures to compute not only net
growth but also job creation and job destruction. At the establishment-level, job creation is
measured as the employment gains from all new and expanding establishments and job
destruction as the employment losses from all contracting and closing establishments. At the
firm-level, job creation is measured as the employment gains from all expanding and new firms
18
In the web appendix, we provide a detailed hypothetical example to clarify how in practice we handle M&A
activity. This example is useful to understand the details as well as for practitioners who want to implement our
methodology.
18
and job destruction as the employment losses from all contracting and exiting firms. By
construction, our methods of computing growth imply that firm level measures of job creation
and destruction are lower than establishment level measures since the latter includes within firm
reallocation of jobs across establishments. For these measures, we follow the approach
developed by DHS. Details of the measurement of these concepts are provided in the web
appendix.19
4. The Relationship between Employment Growth, Firm Size and Firm Age
Our primary objective is to understand the relationship between net employment growth,
and its components, and firm size and age. In this section, we use a non-parametric regression
approach to quantify these relationships. In our main specification, we regress net employment
growth at the firm-level on firm size classes by themselves, on firm age classes by themselves
and by firm size and age together. We focus on employment-weighted specifications since this
enables the coefficients to be interpreted in terms of the impact on net employment growth rates
at the aggregate level for the specified category. Since firm size and firm age distributions vary
by industry as do net growth rate patterns, we control for detailed industry fixed effects.20
In
addition, to abstract from cyclical or secular aggregate considerations we control for year effects.
Given our non-parametric approach with firm size, firm age, industry and year fixed effects, our
results are readily interpretable as employment-weighted conditional means. As such, we can
19
The web appendix also includes depictions of the distribution of firm and establishment level net growth rates
underlying the job creation and destruction statistics. 20
Detailed industry effects are at the 4-digit SIC level for years through 2001 and at the 6-digit NAICS level for
years after 2001. For the firm-level regressions, we classify firms into the industry with the largest employment
share. This requires aggregating up establishment level employment for each firm across production lines (industry
codes) To avoid spuriously allocating a firm to a broad industry that it has little overall activity but a relatively large
detailed industry share, we classify firms hierarchically. That is, we first find the 2-digit industry with the most
activity, then within the 2-digit the 3-digit industry and so on. Note that we also estimate the main specifications at
the establishment-level where industry misclassification is not an issue and obtain virtually identical results (see
Table W.1 in the web appendix).
19
replicate all of the results in what follows using a cell-based regression approach where net
growth rates are measured at the industry, firm size, firm age, and year level of aggregation.
4.1. Net Employment Growth and Firm Size
We report our base set of results on the role of firm size and firm age for net firm level
job creation in Table 2. Note that the results reported in Table 2 are based on regressions
including more than 70 million firm-year observations and consequently the standard errors for
the estimates are very small. Rather than report individual standard errors we simply note that
the largest standard error in the table is less than 0.0005. This pattern holds throughout the
results reported in the remainder of the paper and the web appendix so we do not repeat the
reporting of standard errors.
There are a large number of coefficients reported in Table 2 given the alternative
specifications and the detailed non-parametric size and age classes. We find it easier to discuss
the results with the aid of figures that illustrate the patterns of estimated coefficients. In
interpreting the figures that follow it is important to recall that the estimated coefficients in Table
2 represent differences relative to an omitted group. To facilitate the interpretation of the
magnitudes, we report the omitted group at its unconditional mean rather than zero. In turn, we
simply rescale the other estimated coefficients by adding the value of the unconditional mean for
the omitted category (e.g., the 10,000+ firm size class). Adding the unconditional mean to all
categories does not distort the relative differences but provides perspective about the magnitude
of the effects.
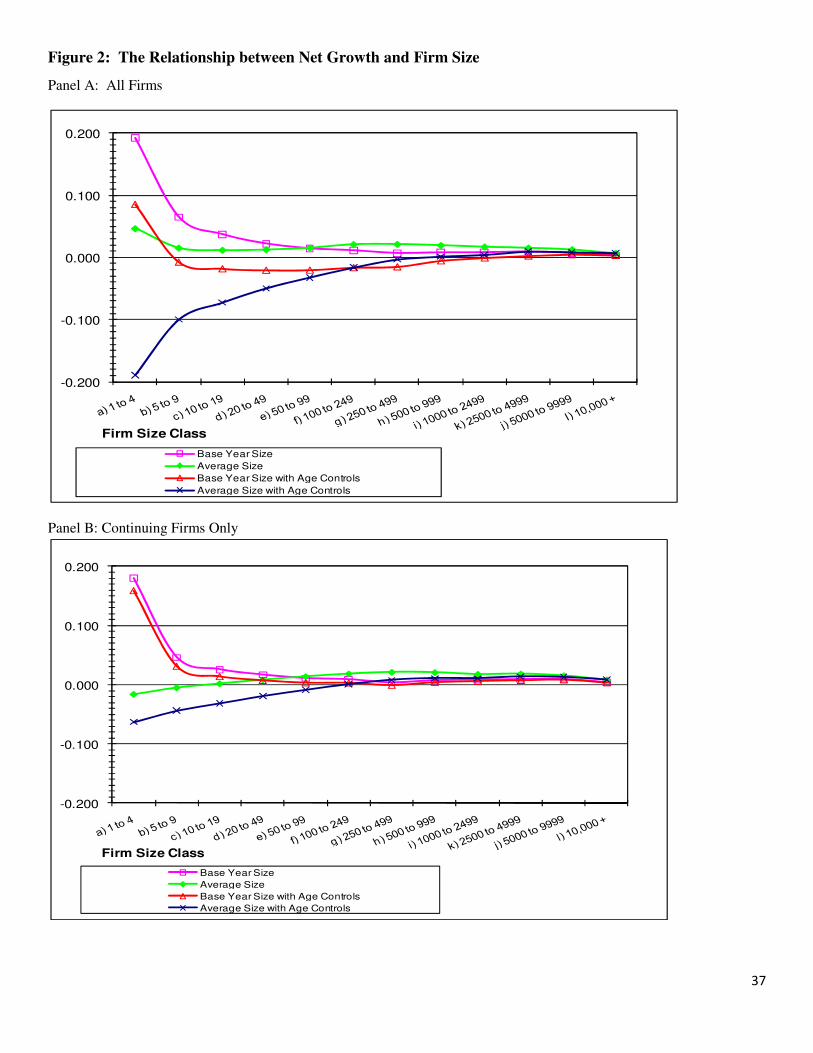
Figure 2 shows the relationship between net employment growth and firm size for the
specifications estimated in Table 2. The upper panel displays results from the regressions in
Table 2 for all firms. The lower panel displays the size coefficients from the same regressions

20
where we limited the sample to continuing firms only. Beginning with the main results in the
upper panel, the plotted curve for the base-year size specification without age controls (column 1
of Table 2) shows a strong inverse relationship between firm size and net employment growth.
The average annual rate of net employment growth in the smallest size class is 18.9 percentage
points higher than that for the largest size firms (10,000 or more employees). The effect declines
more or less monotonically as the size of the firm increases. The relative net employment growth
premium for being small declines to 6.2 percent, 3.4 percent and 1.9 percent for size classes 5-9,
10-19 and 20-49 respectively. It remains less than 1 percent for the larger size classes.
As argued above, however, the base-year measure of firm size has several undesirable
attributes for examining firm size and growth. The curve plotting the estimated coefficients from
our preferred average size specification with no age controls (column 2 of Table 2) shows the
inverse relationship remains, but the quantitative relationship is substantially muted. Comparing
the base and average size results suggests the effects of regression to the mean are quite strong in
the smallest size classes. In the web appendix, we show that, consistent with these patterns, the
negative serial correlation of firm level net employment growth rates is especially large in
absolute value for small firms. But the more general point is that, in the absence of controls for
firm age, we obtain similar qualitative results as those in NZW. That is, size classification
methodology matters but there still is a small inverse relationship between net employment
growth and firm size when not controlling for firm age.
Controlling for firm age, however, has a dramatic impact on these patterns (columns 4
and 5 of Table 2). Regardless of the size classification methodology, once we control for firm
age we observe no systematic relationship between net growth and firm size. When we use base
year size, the smallest size class has the largest positive coefficient but the size classes in the

21
range from 5 to 499 have the most negative coefficients. This implies that firms in the 5 to 499
range have lower net growth rates on average than the largest businesses, once we control for
firm age. When we use average size we do find a positive relationship between net growth and
firm size for all the size classes up through 500 workers. While the details differ non-trivially
depending on which size class method we use, the main point is that, once we control for firm
age, there is no evidence that small firms systematically have higher net growth rates than larger
businesses.21
In the lower panel of Figure 2 we show the results when we restrict the analysis to
continuing firms only.22
The first thing to note is that there is a less dramatic impact of
controlling for firm age since there is, by construction, no role for startups.23
Exploring this
more deeply, we find there is a strong inverse relationship between net growth and firm size for
continuing firms when we use the base size methodology. This is the case whether or not we
control for firm age. However, using average size, there is a positive relationship between net
firm growth and firm size regardless of whether one controls for firm age. Hence, for continuing
firms, it is primarily the size class methodology that matters. The stark differences for small
continuing firms between the base size and average size results are consistent with the strong
regression to the mean effects for these firms.
Some of the differences between the patterns across the two panels of Figure 2 reflect the
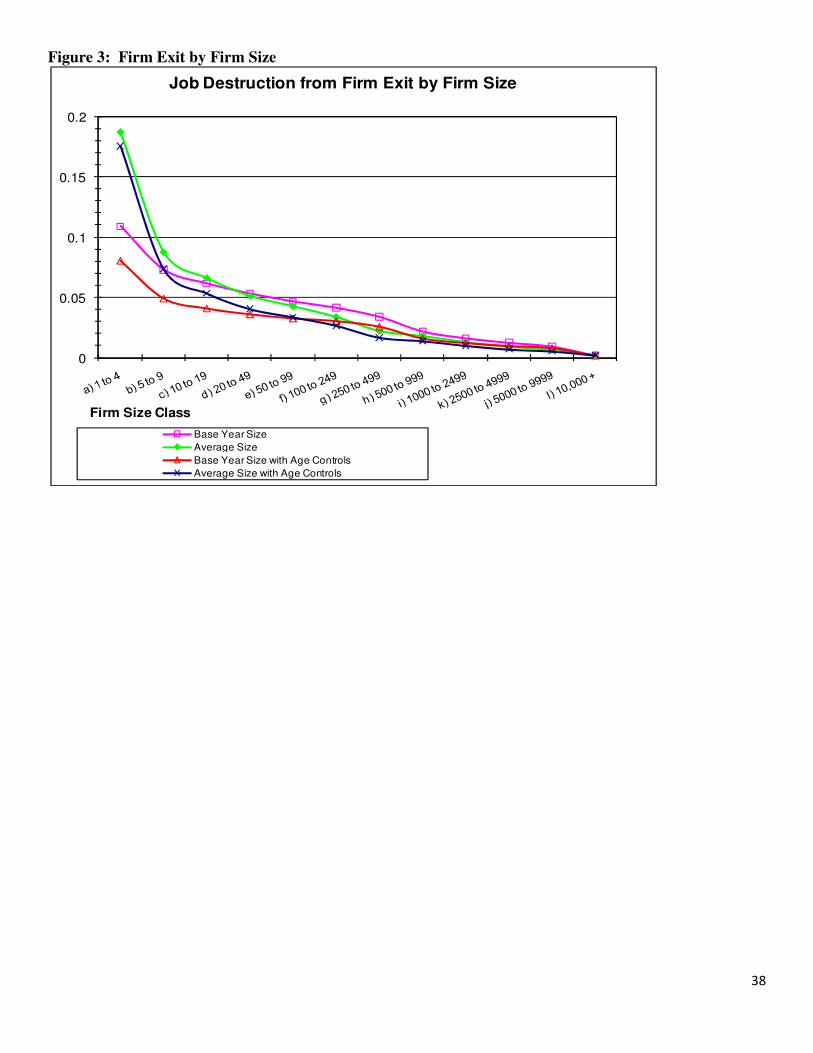
role of firm exits. We explore this further in Figure 3 that shows the patterns of job destruction
21
The patterns in Table 2 are, not surprisingly, roughly consistent with the simple tabulations from the BDS in Table
1 where we observed many negative net job cells for smaller businesses abstracting from startups. We also note that
in the web appendix we show the patterns in Table 2 are robust to estimating employment-weighted establishment
level results. 22
A supplemental file available electronically includes all regression coefficients underlying Figures 2 through 5 and
Figures 7 through 9. All figures are constructed in the same manner. We start with a non-parametric regression of
the form in Table 2. The same RHS variables are used as in Table 2. What changes across these figures is the LHS
variable (e.g., net growth, net growth for continuing firms, job creation from firm entry, etc.). 23
NWZ briefly discuss a similar result they obtained using the NETS data when they exclude startups.

22
from firm exit by firm size with and without age controls. Job destruction from firm exit is
directly interpretable as an employment-weighted firm exit rate. The firm exit rate falls
monotonically with firm size regardless of size class methodology and with or without firm age
controls. Controlling for firm age yields somewhat higher exit rates for small businesses but this
effect is quite modest when using average size class methodology. Thus, a robust finding is that
small firms are more likely to exit than larger firms even controlling for age.
Combining Figure 3 with the lower panel of Figure 2 helps account for the patterns in the
upper panel of Figure 2 especially for the results controlling for firm age. The lower panel of
Figure 2 shows that when controlling for firm age that there is a modest but increasing
relationship between net growth and average size for continuing firms. Combining this effect
with the patterns in Figure 3 where small firms (controlling for firm age) have much higher exit
rates yields that net growth rates are strongly increasing in average firm size controlling for firm
age.
Figures 2 and 3 also shed light on Gibrat’s law. Figure 2 suggests that Gibrat’s law (the
prediction that firm growth should be independent of size) holds approximately if we exclude the
smallest firms especially if we use the average size measure and we don’t control for firm age.
That is, departures arise for the smallest firms (where regression to the mean effects are
especially an issue), and for entering and young firms which as we will see below have their own
interesting dynamic not well captured by the models underlying the predictions of Gibrat’s law
(see, e.g., Sutton (1997)).
An appropriate measure of firm age is critical for obtaining the patterns in Figures 2 and
3. As we noted above, Table 2 and the upper panel of Figure 2 can also be obtained by
estimating employment-weighted establishment-level regressions on firm size and age

23
characteristics. This implies that we can check the robustness of controlling for establishment as
opposed to firm-level characteristics. For brevity, we only summarize the results looking at
establishment characteristics and point the interested reader to the web appendix. We find that
controlling for establishment as opposed to firm age does not yield the same stark patterns of
Figures 2 and 3. That is, when controlling for only establishment age, the relationship between
firm size and net growth remains strongly negative when using base size unlike the pattern in
Figure 2 that shows a non-monotonic relationship between firm size and net growth when we
control for firm age. Moreover, the positive relationship between average size and net growth in
Figure 2 when controlling for firm age becomes notably weaker when controlling for
establishment age. These findings highlight the important distinction between firm and
establishment age that comes about because there are many young, small establishments of large,
mature firms.
4.2. Net Employment Growth and Firm Age
We now turn to exploring the patterns of net employment growth for firm age. Table 2
shows the patterns for firm age are robust to whether or not we control for firm size and also how
we control for firm size (base or average). This pattern holds for all of our analysis on firm
dynamics by firm age which is much of our focus for the remainder of the paper. For ease of
exposition, in what follows we only show in figures the results for firm age by itself and
controlling for firm size using our preferred average size measure. For completeness, we provide
the results controlling for base year size in the web appendix.
The top panel of Figure 4 shows the results for firm age from columns 3 and 5 in Table
2. In the figure, we omit the estimated coefficient for startups since it is much higher (essentially

24
2).24
The panel reveals a relatively weak relationship between firm age and net growth when we
exclude startups. However, in the lower panel of Figure 4, we find that conditional on survival,
young firms exhibit substantially higher growth than more mature firms. This pattern is robust to
controlling for firm size and it clearly indicates that the fastest growing continuing firms are
young firms under the age of five.
Reconciling the patterns of the upper and lower panel requires investigating the
relationship between firm age and firm exit. That is, the firms not included in the lower panel of
Figure 4 relative to the upper panel are firm exits. Note that firm entrants are not driving the
large difference in patterns across the upper and lower panel of Figure 4 since they are not
included in either panel. The relationship between firm age and job destruction from firm exit is
reported in Figure 5 where it is apparent that young firms have much higher firm exit rates than
more mature firms.
Taken together, Figures 4 and 5 describe an “up or out” pattern for young firms that is
robust to controlling for firm size (and robust to whichever size class method is used). This “up
or out” pattern highlights that the net patterns by firm age depicted in the top panel of Figure 4
mask the rich dynamics of young firms. This dynamic is an important feature of market based
economies and is consistent with predictions in models of market selection and learning (e.g., see
Jovanovic (1982), Hopenhayn (1992) and Ericson and Pakes (1995)). It is also consistent with
models where it takes time for firms to build up demand capital (e.g., Foster, Haltiwanger and
Syverson (2010)) or firms to build up reputation in credit markets (e.g., Evans and Jovanovic
(1989)).
24
Recall that at the firm-level the net growth rate for a firm startup is equal to 2 using the DHS methodology. The
estimated coefficient in Table 2 for all startups is close to 2 but not identical to 2 in all cases since this is a relative
coefficient to the most mature firms after also controlling for industry and year effects.

25
The “up or out” pattern of young firms also helps put the job creation from startups in
perspective. Each wave of firm startups creates a substantial number of jobs. In the first years
following entry, many startups fail (the cumulative employment weighted exit rate derived from
Figure 5 implies that about 40 percent of the jobs created by startups are eliminated by firm exits
in the first five years) but the surviving young businesses grow very fast.25
In this respect, the
startups are a critical component of the experimentation process that contributes to restructuring
and growth in the U.S. on an ongoing basis.
We check the robustness of the results in Figure 4 by considering whether the patterns are
potentially driven by large, young businesses. Although our measurement methods avoid
creating new firms as the outcome of M&A activity, there are some large, young firms creating
jobs as seen in Table 1.26
As seen in Figure 1, the latter don’t account for much of the
contribution of firm births but it is possible they are high growth firms contributing to the
patterns in Figure 4. To check on the contribution of such large firms to the analysis, we
estimated the specifications underlying Figures 2 through 5 restricting attention to firms that
have less than 500 workers. We find the patterns in Figures 2 through 5 are robust to
considering only such firms in the analysis.27
.
4.3. Firm Entry and Up or Out Dynamics By Sector
One question raised by the striking patterns in Figures 4 and 5 is whether the up or out
dynamics are driven by specific industries. It might be that the factors that yield such young
25
The growth from the survivors does not fully compensate for the exits. The cumulative net growth rate implied by
Figure 4 is about -7 percent in the first five years after entry. Note however that this still implies five years after
entry a typical cohort has contributed a substantial number of jobs. 26
These large firm births are often associated with the appearance of a new U.S. affiliate of a foreign owned firm or
changes in employment arrangements like the use employee leasing firms.. 27
The results for this robustness check are in the web appendix.

26
firm dynamics are more important in some sectors than others. Moreover, firm entry rates vary
across sectors and the pace of entry may influence the nature of young firm dynamics.
Figure 6 shows employment-weighted firm entry rates by selected broad sectors.28
Not
surprisingly, sectors such as Services and Wholesale and Retail Trade have much higher entry
rates than either Durable or Non-durable Goods Manufacturing. Firm entry rates are especially
low in Durable Goods Manufacturing.
Figure 7 shows the up or out patterns by industry. It is striking that in spite of the large
differences in entry rates the patterns are so similar across industries. In all of the broad sectors,
young businesses either grow fast or they exit. There are some interesting differences in the
magnitudes of the patterns by sector. Young, continuing firms in the Service Sector have
especially high growth relative to firms in the Wholesale and Retail Trade Sector. In addition,
there is a notable hump shaped exit pattern for young firms in Manufacturing Durable and Non-
Durable Goods. That is, the peak exit rate is not in the first year but in the second year after
entry. The pattern suggests that the nature of the learning and selection dynamics differ in the
Manufacturing Sector. Still, it is striking how similar the qualitative patterns are by sector. The
implication of Figures 6 and 7 is that while entry rates vary substantially across sectors,
conditional on entry the same rich up or out dynamics are present in every sector.
4.4. The Entry and Exit Margins: Establishment vs. Firm
The focus thus far has been on firm entry and exit. In this section, we compare and
contrast the patterns of firm entry and exit with the patterns of establishment entry and exit.
Figure 8 shows establishment entry and exit by firm age. The upper panel shows that
establishment entry exhibits a slight tendency to increase with firm age that is mitigated after
28
A supplemental file available electronically includes all sectors but we focus on selected sectors in the main text
for the sake of brevity.

27
controlling for firm size. By contrast, the lower panel shows job destruction from establishment
exit falling monotonically with firm age. Taking these patterns together with those of Figures 4
and 5 above implies that young firms create jobs by expanding existing establishments rather
than opening new ones.29
Additionally, in comparing the establishment-level patterns in Figure
8 to the firm-level patterns in Figure 5, we see that job destruction from establishment exit
declines less rapidly with firm age than does job destruction from firm exit. Mature firms are
much less likely to exit than young firms but establishments of mature firms have relatively high
exit rates compared to establishments of young firms conditional on other observable factors
(Dunne et. al. (1989) also found this result for U.S. manufacturing).
Figure 9 shows relationships of establishment entry and exit by firm size. Establishment
entry tends to fall with firm size when not controlling for firm age and this reflects the obvious
relationship between firm entry and establishment entry. However, after controlling for firm age,
we observe establishment entry rising with firm size. The lower panel of Figure 9 shows that job
destruction from establishment exit tends to decline with firm size. These patterns are quite
similar to those for firm exit in Figure 3.
To sum up, there are notable differences in the patterns of firm vs. establishment entry
and exit by firm age and firm size. First, looking at establishments we find young firms are less
likely to exhibit job creation from opening new establishment than are mature firms. Young
firms, however, disproportionally create jobs by expanding existing establishments. Large firms
are more likely to open new establishments when we control for firm age. Second, firm entry
rates are much higher for the smallest size classes, but this simply reflects the fact that new firms
tend to be small. Once we control for firm age, large firms are more likely to open new
29
In the web appendix, we also compare job creation by firm age with job creation by establishment entry by firm
age which makes this point more transparent.

28
establishments than small firms. Establishment exit is also more likely for smaller firms and this
holds even after controlling for firm age.
5. Concluding Remarks
There is a widespread popular perception that small businesses create most jobs in the
U.S. This perception has basis in empirical observation, but we demonstrate that the inverse
relationship between net job growth and firm size disappears after controlling for firm age. To
draw this conclusion, we take advantage of newly developed economy-wide longitudinal firm
and establishment data available at the U.S. Census Bureau that permits accurate tracking of
business startups, business exits and continuing firms.
Our analysis focused on measurement not policy. However, measurement issues clearly
can influence policy discussions and our findings give those charged with policies aimed at the
business community much to consider. For example, to the extent that policy interventions
aimed at small businesses ignore the important role of firm age, we should not expect much of an
impact on the pace of job creation. Effective policy design in this area requires a richer
understanding of business dynamics as well as any relevant market failures. Our analysis
addresses only the first issue.
We find some evidence in support of the popular perception that small businesses create
most jobs along the following lines. If one looks at the simple relationship between firm size and
net growth rates, there is evidence that net growth rates tend to be higher for smaller as opposed
to larger businesses. This is the case using widely available data such as the Census Bureau’s
SUSB, but can also be obtained through careful analysis of micro data as both NWZ and we
demonstrate. Of course, the caveats raised over years, such as the role of regression to the mean
still apply. Using our preferred firm size classification that we argue is more robust to such
29
concerns, the inverse relationship between net growth rates and size remains but is not
overwhelming.
Our results show that the more important and robust finding is the role of firm age and its
relationship with firm growth dynamics. We find that once we control for firm age, the negative
relationship between firm size and net growth disappears and may even reverse sign as a result of
relatively high rates of exit amongst the smallest firms. Our findings suggest that it is
particularly important to account for business startups. Business startups account for roughly 3
percent of U.S. total employment in any given year. While this is a reasonably small share of the
stock, it is large relative to the net flow which averages around 2.2 percent per year. We also
find rich dynamics among young firms that help put the contribution and role of startups into
perspective. Young firms exhibit high rates of gross job creation and destruction. Consistent
with this pattern, we find that young firms have very high job destruction rates from exit so that
after five years about 40 percent of the jobs initially created by startups have been eliminated by
exit. However, we also find that, conditional on survival, young firms grow more rapidly than
their more mature counterparts.
Most of our focus is on the net growth rate patterns by firm size and firm age (along with
the underlying different margins of adjustment). However, we also show that large, mature
businesses account for a large fraction of jobs. Firms over 10 years old and have more than 500
workers account for about 45 percent of all jobs in the U.S. private sector. In turn, we show that
these large, mature firms account for almost 40 percent of job creation and destruction. The
share of jobs created and destroyed by different groups of firms is roughly their share of total
employment. An important exception in this context is the contribution of firm startups. Firm
startups account for only 3 percent of employment but almost 20 percent of gross job creation.

30
We think our findings help interpret the popular perception of the role of small businesses
as job creators in a manner that is consistent with theories that highlight the role of business
formation, experimentation, selection and learning as important features of the U.S. economy.
Viewed from this perspective, the role of business startups and young firms is part of an ongoing
dynamic of U.S. businesses that needs to be accurately tracked and measured on an ongoing
basis. Measuring and understanding the activities of startups and young businesses, the frictions
they face, their role in innovation and productivity growth, how they fare in economic downturns
and credit crunches all are clearly interesting areas of inquiry given our findings. To the extent
that market failures are found to underlie these frictions, there might be a role for well designed
corrective policies that help entrepreneurs start and grow dynamic young firms that in turn boost
overall net job creation.
More broadly, our findings suggest the policy debate about encouraging private sector
job creation should be refocused. The job creating prowess of small businesses is often used by
policymakers to motivate and justify specific policies. Our findings suggest that policies
targeting firms based on size without taking account of the role firm age are unlikely to have the
desired impact on overall job creation. Taking the patterns of firm dynamics we show here into
account may help identify the specific market failures that prevent entrepreneurs from starting
and growing new businesses.
In a related manner, it is important to not focus only on jobs per se but also on the role
these dynamics play productivity and earnings growth in the U.S. Similarly we need to develop
the data and associated analyses that will permit investigating the complex relationships between
young and mature businesses. It may be, for example, that the volatility and apparent
experimentation of young businesses that we have identified is critical for the development of

31
new products and processes that are in turn used by (and perhaps acquired by) the large and
mature businesses that account for most economic activity. Viewed from this perspective, our
findings show that the LBD and the BDS are rich databases to track U.S. business dynamics but
it is also clear that additional information about the productivity and earnings dynamics as well
as business-to-business relationships need to be added to these databases and related analyses.

32
References
Acs, Zoltan J., Catherine Armington, and Alicia Robb, 1999, "Measures of Job Flow Dynamics
in the U.S. Economy" U.S. Small Business Administration, January.
Aldrich, Howard, Arne Kalleberg, Peter Marsden and James Casell, 1988, "In Pursuit of
Evidence: Five Sampling Procedures for Locating New Businesses", Journal of Business
Venturing, 4, 367-386.
Becker. Randy A., John Haltiwanger, Ron S. Jarmin, Shawn D. Klimek and Daniel J. Wilson,
2006, “Micro and Macro Data Integration: the Case of Capital”, in A New Architecture
for the U.S. National Accounts, (Jorgenson, Landefeld and Nordhaus eds),
NBER/University of Chicago Press,
Birch, David L., 1979, The Job Generation Process, unpublished report prepared by the MIT
Program on Neighborhood and Regional Change for the Economic Development
Administration, U.S. Department of Commerce, Washington, DC,
Birch, David L., 1981, “Who Creates Jobs?” The Public Interest 65, 3-14.
Birch, David L., 1987, Job Creation in America: How Our Smallest Companies Put the Most
People to Work, Free Press, New York.
Birley, Sue, 1984, "Find the Firm", Proceedings of the Academy of Management Meetings.
Brown, Charles, James Hamilton, and James Medoff, 1990, Employers Large and Small,
Cambridge: Harvard University Press.
Butani, Shail, Richard Clayton, Vinod Kapani, James Spletzer, David Talan, and George
Werking, 2006, “Business Employment Dynamics: Tabulations by Employer Size”
Monthly Labor Review, February 2006

33
Davis, Steven J., John Haltiwanger and Scott Schuh, 1996, Job Creation and Destruction, MIT
Press.
Davis, Steven J., John Haltiwanger, Ron S. Jarmin and Javier Miranda, 2007, “Volatility and
Dispersion in Business Growth Rates: Publicly Traded vs. Privately Held Firms.” NBER
Macroeconomics Annual 2006, vol. 21.
Davis, Steven J., John Haltiwanger, C.J. Krizan, Ron Jarmin, Javier Miranda, Al Nucci, and
Kristin Sandusky, 2009, "Measuring the Dynamics of Young and Small Businesses:
Integrating the Employer and Non-Employer Businesses” in Producer Dynamics: New
Evidence from Micro Data, (Dunne, Jensen and Roberts, eds.) NBER/University of
Chicago Press.
Doms, Mark E., Ron S. Jarmin, and Shawn D. Klimek, 2004, “Information technology
investment and firm performance in US retail trade.” Economics of Innovation and New
Technology, vol. 13(7), pp. 595-613.
Dunne, Timothy, Mark Roberts and Larry Samuelson, 1989, “The Growth and Failure of U.S.
Manufacturing Plants,” Quarterly Journal of Economics, vol. 104 (4), pp. 671-98.
Ericson, Richard and Ariel Pakes, 1995, “ Markov-Perfect Industry Dynamics: A Framework for
Empirical Work”, The Review of Economic Studies, Vol. 62, No. 1. pp. 53-82
Evans, David S., 1987, “The Relationship between Firm Growth, Size, and Age: Estimates for
100 Manufacturing Industries,” Journal of Industrial Economics 35, pp. 567-581.
Evans, David S. and Boyan Jovanovic, 1989, “An Estimated Model of Entrepreneurial Choice
under Liquidity Constraints” The Journal of Political Economy, Vol. 97, No., pp. 808-
827

34
Foster, Lucia, John Haltiwanger, and C.J. Krizan, 2006, “Market Selection, Reallocation and
Restructuring in the U.S. Retail Trade Sector in the 1990s,” The Review of Economics
and Statistics, vol. 88(4), pp. 748-758.
Foster, Lucia, John Haltiwanger and Chad Syverson, 2010, “The Slow Growth of New Plants:
Learning About Demand?,” mimeo.
Friedman, Milton, 1992, "Do Old Fallacies Ever Die?,” Journal of Economic Literature ,30(4),
2139-2132.
Haltiwanger, John, Ron Jarmin and Javier Miranda, 2009 “Business Dynamics Statistics: An
Overview” Marion Ewing Kauffman Foundation BDS Briefs.
http://www.kauffman.org/uploadedFiles/BDS_handout_011209.pdf
Haltiwanger, John and C.J. Krizan, 1999 “Small Business and Job Creation in the United States:
The Role of New and Young Businesses” in Are Small Firms Important?: Their Role and
Impact, edited by Zoltan Acs, Kluwer Academic Publishing Company.
Hopenhayn, Hugo. 1992. “Entry, Exit, and Firm Dynamics in Long Run Equilibrium”,
Econometrica, 60(5): 1127-50.
Jarmin, Ron S., Shawn D. Klimek and Javier Miranda, 2009, “The Role of Retail Chains:
National, Regional and Industry Results,” in Dunne, Jensen and Roberts (eds.), Producer
Dynamics: New Results from Micro Data, University of Chicago Press for the NBER.
Jarmin, Ron S., and Javier Miranda, 2002, “The Longitudinal Business Database”, CES Working
Paper 02-17.
Jovanovic, Boyan. 1982. “Selection and the Evolution of Industry”, Econometrica, 50(3): 649-
670.
35
Neumark, David, Brandon Wall, and Junfu Zhang, 2009, "Do Small Businesses Create More Jobs?
New Evidence for the United States from the National Establishment Time Series",
Review of Economics and Statistics, (forthcoming).
Okolie, Cordelia, 2004, "Why Size Class Methodology Matters in Analyses of Net and Gross
Job Flows." Monthly Labor Review, July.
Olley, Steven and Ariel Pakes, 1996, The Dynamics of Productivity in the Telecommunications
Equipment Industry, Econometrica, 64(6): 1263-1310.
Sutton, John, 1997 “Gibrat’s Legacy,” Journal of Economic Literature 35, 40-59.
Tornqvist, Leo, Pentti Vartia and Yrjo Vartia, 1985, “How Should Relative Change Be
Measured?” American Statistician, February, 39:1, pp. 43-46.
36
Figure 1: Shares of Employment, Job Creation and Destruction by Broad Firm (Average)
Size and Age Classes – Annual Average Rates 1992-2005
0.00
0.05
0.10
0.15
0.20
0.25
0.30
0.35
0.40
0.45
0.50
Firm Births Young (1-10) Mature (10+) Firm Births Young (1-10) Mature (10+)
Sh
are
s
Shares of Employment, Job Creation and Destruction by Firm Size and Age Broad Classes
Employment Job Creation Job Destruction
Small (1-500) Large (500+)
37
Figure 2: The Relationship between Net Growth and Firm Size
Panel A: All Firms
Panel B: Continuing Firms Only
-0.200
-0.100
0.000
0.100
0.200
Firm Size Class
Base Year Size
Average Size
Base Year Size with Age Controls
Average Size with Age Controls
-0.200
-0.100
0.000
0.100
0.200
Firm Size Class
Base Year Size
Average Size
Base Year Size with Age Controls
Average Size with Age Controls
38
Figure 3: Firm Exit by Firm Size
0
0.05
0.1
0.15
0.2
Firm Size Class
Job Destruction from Firm Exit by Firm Size
Base Year Size
Average Size
Base Year Size with Age Controls
Average Size with Age Controls
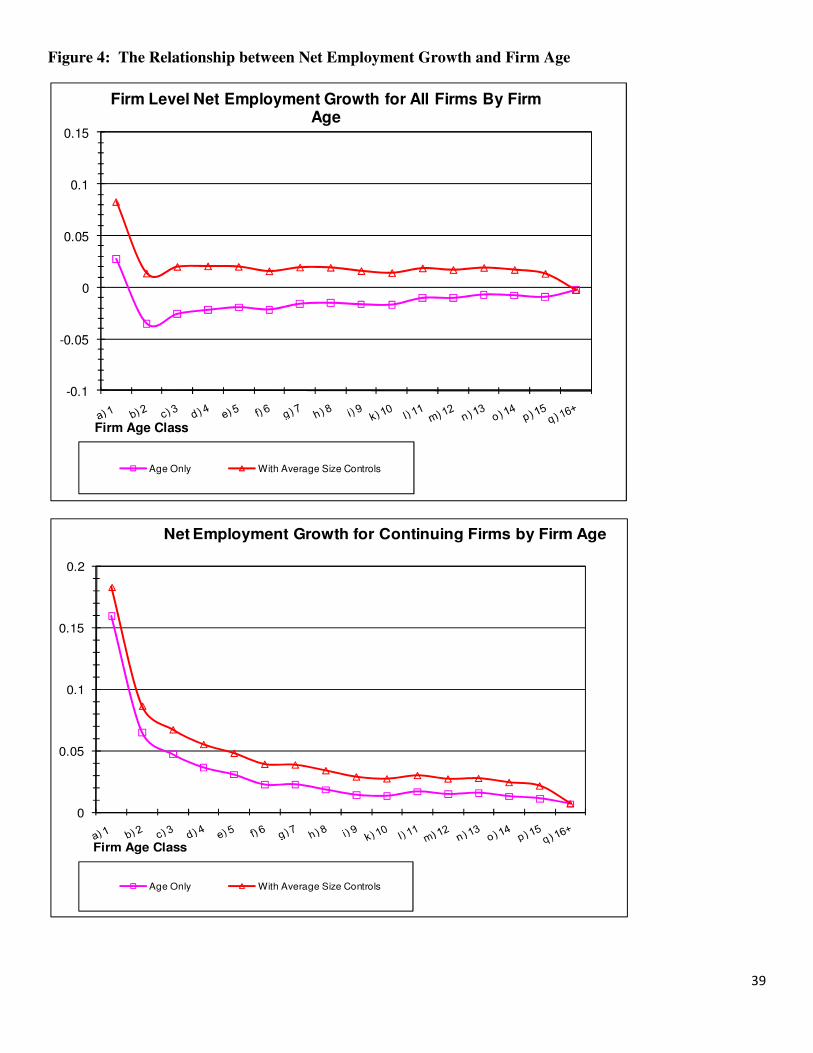
39
Figure 4: The Relationship between Net Employment Growth and Firm Age
-0.1
-0.05
0
0.05
0.1
0.15
Firm Age Class
Firm Level Net Employment Growth for All Firms By Firm Age
Age Only With Average Size Controls
0
0.05
0.1
0.15
0.2
Firm Age Class
Net Employment Growth for Continuing Firms by Firm Age
Age Only With Average Size Controls
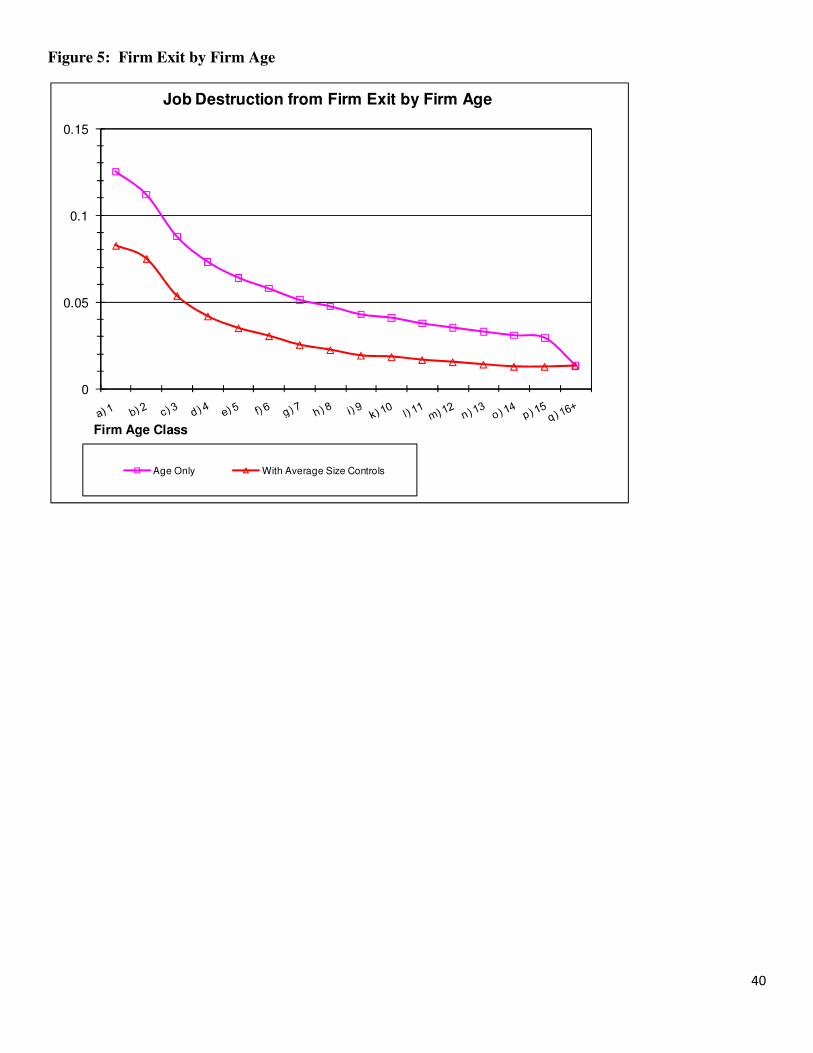
40
Figure 5: Firm Exit by Firm Age
0
0.05
0.1
0.15
Firm Age Class
Job Destruction from Firm Exit by Firm Age
Age Only With Average Size Controls
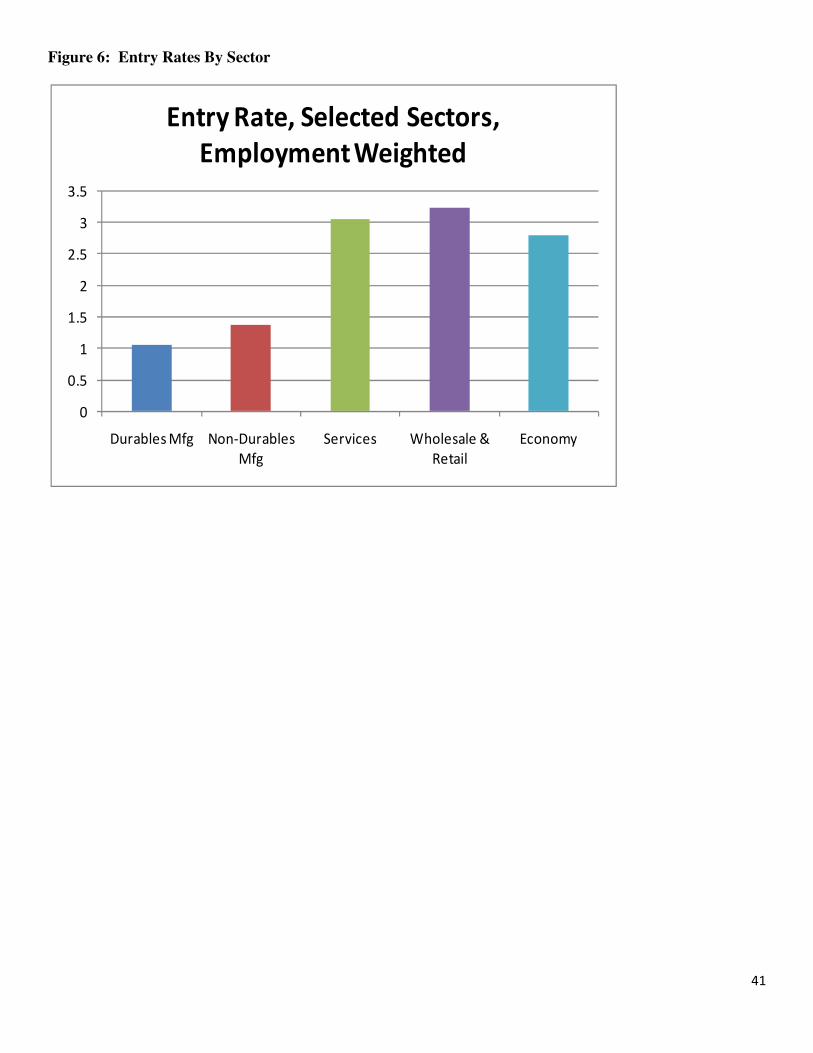
41
Figure 6: Entry Rates By Sector
0
0.5
1
1.5
2
2.5
3
3.5
Durables Mfg Non-Durables
Mfg
Services Wholesale &
Retail
Economy
Entry Rate, Selected Sectors,
Employment Weighted
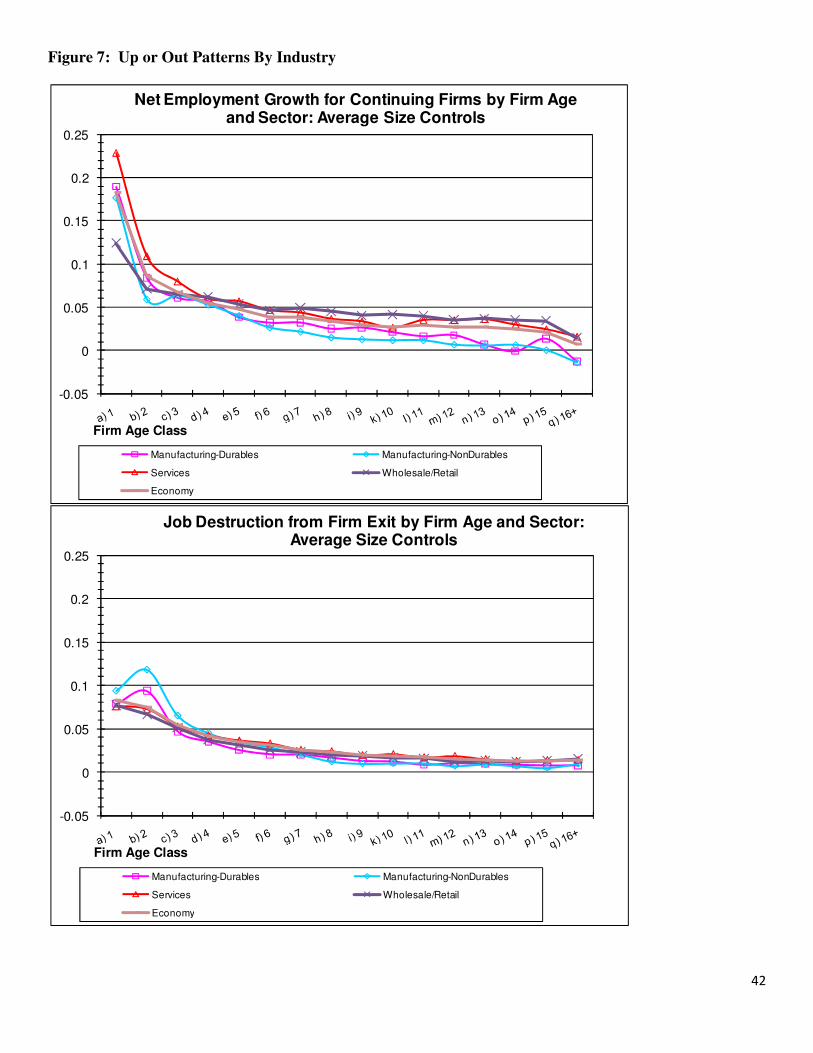
42
Figure 7: Up or Out Patterns By Industry
-0.05
0
0.05
0.1
0.15
0.2
0.25
Firm Age Class
Net Employment Growth for Continuing Firms by Firm Age and Sector: Average Size Controls
Manufacturing-Durables Manufacturing-NonDurables
Services Wholesale/Retail
Economy
-0.05
0
0.05
0.1
0.15
0.2
0.25
Firm Age Class
Job Destruction from Firm Exit by Firm Age and Sector: Average Size Controls
Manufacturing-Durables Manufacturing-NonDurables
Services Wholesale/Retail
Economy
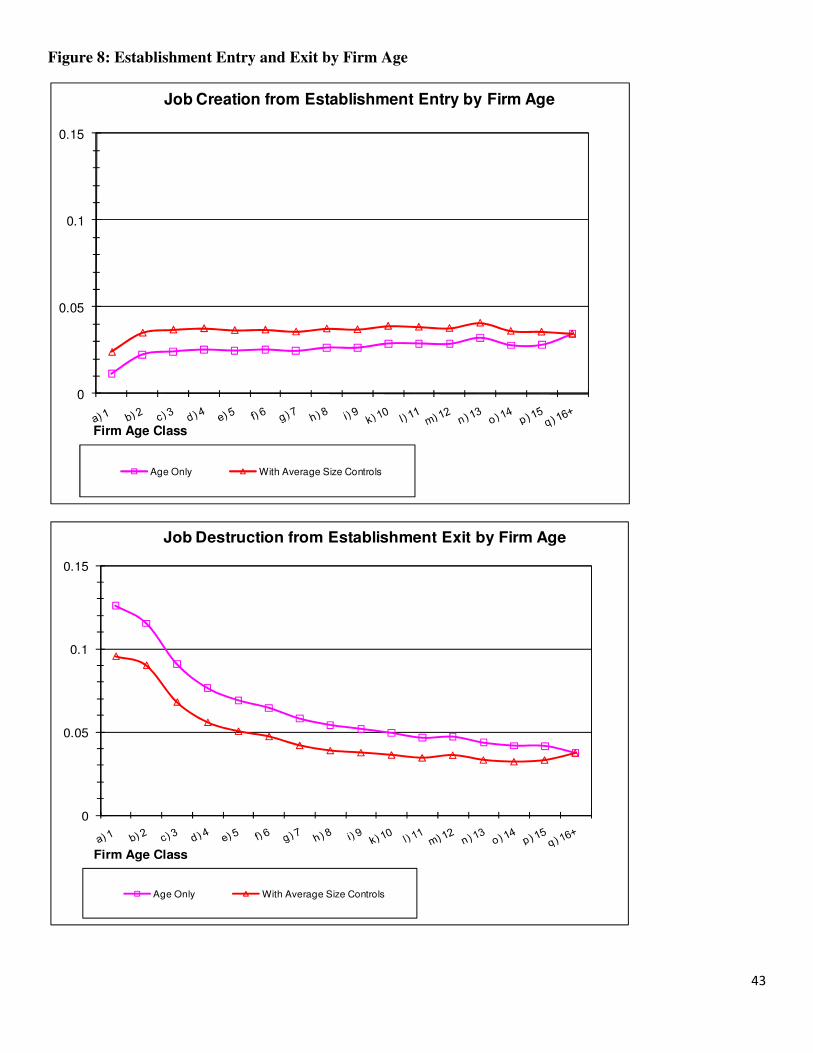
43
Figure 8: Establishment Entry and Exit by Firm Age
0
0.05
0.1
0.15
Firm Age Class
Job Creation from Establishment Entry by Firm Age
Age Only With Average Size Controls
0
0.05
0.1
0.15
Firm Age Class
Job Destruction from Establishment Exit by Firm Age
Age Only With Average Size Controls
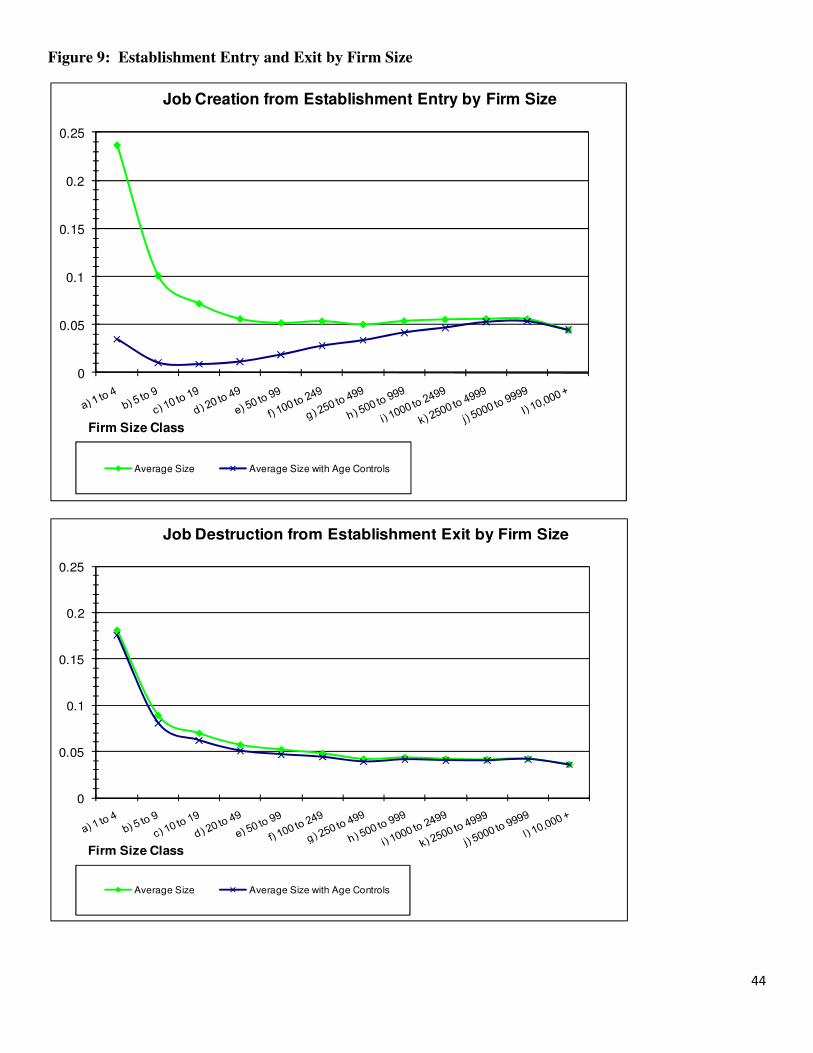
44
Figure 9: Establishment Entry and Exit by Firm Size
0
0.05
0.1
0.15
0.2
0.25
Firm Size Class
Job Creation from Establishment Entry by Firm Size
Average Size Average Size with Age Controls
0
0.05
0.1
0.15
0.2
0.25
Firm Size Class
Job Destruction from Establishment Exit by Firm Size
Average Size Average Size with Age Controls
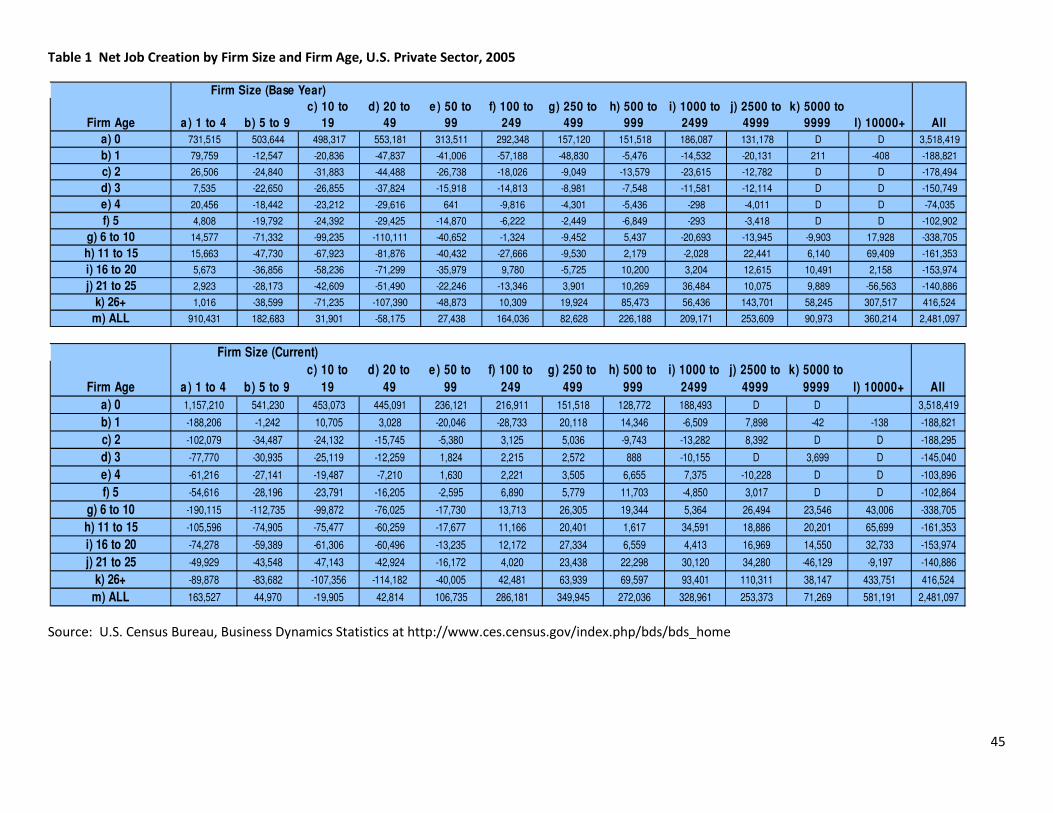
45
Table 1 Net Job Creation by Firm Size and Firm Age, U.S. Private Sector, 2005
Source: U.S. Census Bureau, Business Dynamics Statistics at http://www.ces.census.gov/index.php/bds/bds_home
Firm Size (Base Year)
Firm Age a) 1 to 4 b) 5 to 9
c) 10 to
19
d) 20 to
49
e ) 50 to
99
f) 100 to
249
g) 250 to
499
h) 500 to
999
i) 1000 to
2499
j) 2500 to
4999
k) 5000 to
9999 l) 10000+ All
a) 0 731,515 503,644 498,317 553,181 313,511 292,348 157,120 151,518 186,087 131,178 D D 3,518,419
b) 1 79,759 -12,547 -20,836 -47,837 -41,006 -57,188 -48,830 -5,476 -14,532 -20,131 211 -408 -188,821
c) 2 26,506 -24,840 -31,883 -44,488 -26,738 -18,026 -9,049 -13,579 -23,615 -12,782 D D -178,494
d) 3 7,535 -22,650 -26,855 -37,824 -15,918 -14,813 -8,981 -7,548 -11,581 -12,114 D D -150,749
e) 4 20,456 -18,442 -23,212 -29,616 641 -9,816 -4,301 -5,436 -298 -4,011 D D -74,035
f) 5 4,808 -19,792 -24,392 -29,425 -14,870 -6,222 -2,449 -6,849 -293 -3,418 D D -102,902
g) 6 to 10 14,577 -71,332 -99,235 -110,111 -40,652 -1,324 -9,452 5,437 -20,693 -13,945 -9,903 17,928 -338,705
h) 11 to 15 15,663 -47,730 -67,923 -81,876 -40,432 -27,666 -9,530 2,179 -2,028 22,441 6,140 69,409 -161,353
i) 16 to 20 5,673 -36,856 -58,236 -71,299 -35,979 9,780 -5,725 10,200 3,204 12,615 10,491 2,158 -153,974
j) 21 to 25 2,923 -28,173 -42,609 -51,490 -22,246 -13,346 3,901 10,269 36,484 10,075 9,889 -56,563 -140,886
k) 26+ 1,016 -38,599 -71,235 -107,390 -48,873 10,309 19,924 85,473 56,436 143,701 58,245 307,517 416,524
m) ALL 910,431 182,683 31,901 -58,175 27,438 164,036 82,628 226,188 209,171 253,609 90,973 360,214 2,481,097
Firm Size (Current)
Firm Age a) 1 to 4 b) 5 to 9
c) 10 to
19
d) 20 to
49
e ) 50 to
99
f) 100 to
249
g) 250 to
499
h) 500 to
999
i) 1000 to
2499
j) 2500 to
4999
k) 5000 to
9999 l) 10000+ All
a) 0 1,157,210 541,230 453,073 445,091 236,121 216,911 151,518 128,772 188,493 D D 3,518,419
b) 1 -188,206 -1,242 10,705 3,028 -20,046 -28,733 20,118 14,346 -6,509 7,898 -42 -138 -188,821
c) 2 -102,079 -34,487 -24,132 -15,745 -5,380 3,125 5,036 -9,743 -13,282 8,392 D D -188,295
d) 3 -77,770 -30,935 -25,119 -12,259 1,824 2,215 2,572 888 -10,155 D 3,699 D -145,040
e) 4 -61,216 -27,141 -19,487 -7,210 1,630 2,221 3,505 6,655 7,375 -10,228 D D -103,896
f) 5 -54,616 -28,196 -23,791 -16,205 -2,595 6,890 5,779 11,703 -4,850 3,017 D D -102,864
g) 6 to 10 -190,115 -112,735 -99,872 -76,025 -17,730 13,713 26,305 19,344 5,364 26,494 23,546 43,006 -338,705
h) 11 to 15 -105,596 -74,905 -75,477 -60,259 -17,677 11,166 20,401 1,617 34,591 18,886 20,201 65,699 -161,353
i) 16 to 20 -74,278 -59,389 -61,306 -60,496 -13,235 12,172 27,334 6,559 4,413 16,969 14,550 32,733 -153,974
j) 21 to 25 -49,929 -43,548 -47,143 -42,924 -16,172 4,020 23,438 22,298 30,120 34,280 -46,129 -9,197 -140,886
k) 26+ -89,878 -83,682 -107,356 -114,182 -40,005 42,481 63,939 69,597 93,401 110,311 38,147 433,751 416,524
m) ALL 163,527 44,970 -19,905 42,814 106,735 286,181 349,945 272,036 328,961 253,373 71,269 581,191 2,481,097

46
Table 2: Firm-Level Net Employment Growth Regressions
Parameter Base Size Average Size Age Only Base Size + Age Average Size + Age
Intercept
Size a) 1 to 4 0.189 0.040 0.082 -0.196
Size b) 5 to 9 0.062 0.009 -0.011 -0.107
Size c) 10 to 19 0.034 0.005 -0.021 -0.080
Size d) 20 to 49 0.019 0.006 -0.024 -0.057
Size e) 50 to 99 0.011 0.009 -0.024 -0.039
Size f) 100 to 249 0.008 0.014 -0.020 -0.023
Size g) 250 to 499 0.004 0.014 -0.018 -0.010
Size h) 500 to 999 0.005 0.013 -0.009 -0.006
Size i) 1000 to 2499 0.005 0.010 -0.004 -0.003
Size j) 2500 to 4999 0.006 0.009 -0.001 0.002
Size k) 5000 to 9999 0.004 0.006 0.001 0.001
Size l) 10000+
Age a. 0 2.000 1.990 2.079
Age b. 1 0.030 0.018 0.086
Age c. 2 -0.033 -0.039 0.016
Age d. 3 -0.023 -0.027 0.023
Age e. 4 -0.019 -0.022 0.023
Age f. 5 -0.017 -0.018 0.023
Age g. 6 -0.019 -0.020 0.018
Age h. 7 -0.013 -0.014 0.022
Age i. 8 -0.012 -0.012 0.022
Age j. 9 -0.014 -0.013 0.018
Age k. 10 -0.014 -0.013 0.017
Age l. 11 -0.008 -0.006 0.021
Age m. 12 -0.008 -0.006 0.019
Age n. 13 -0.004 -0.002 0.022
Age o. 14 -0.005 -0.003 0.020
Age p. 15 -0.007 -0.004 0.016
Age u. 16+
R2 0.036 0.029 0.280 0.282 0.286
Obs 73,396,545 73,396,545 73,396,545 73,396,545 73,396,545
Notes: Standard Errors for all estimates are below 0.0005
Recommended