DurabilityofStructuralPlateCorrugatedSteelPipeandDeepCorrugatedStructuralPlateStructures,February27,2012
Page 1 of 16
White Paper Performance Guideline for Buried Steel Structures
Introduction
Historically, structural plate corrugated steel pipe structures have been fabricated from galvanized steel.
Galvanized steel has a history of long life when installed in proper environments; however durability
remains a concern in installations with more challenging environmental conditions. Since 1974,
corrugated metal products have been manufactured from polymer coated sheet in order to improve
durability in these challenging installations. Recently, similar polymer coatings have been applied to
structural plate corrugated steel pipe and deep corrugated structural plate.
The Corrugated Steel Pipe Institute (CSPI) developed a Guideline to assist practitioners in selecting
appropriate structure type, end protection details and the optimum coating and plate thickness
combination to enable corrugated steel plate structures to meet design service life specifications.
Consideration of the application exposure, location and the site specific environmental conditions are
key parameters when estimating the material service life of buried flexible steel structures. The
guideline is intended to supplement local knowledge of the performance of buried plate structures.
This white paper provides technical data and assumptions which support the Estimated Material Service
Life (EMSL) approach presented in the CSPI Guideline. The EMSL approach uses established models to
estimate metal loss in soil, water and atmospheric environments. Models considered and selected for
each of the environments are discussed in the following sections of this white paper.
This white paper was prepared by Elzly Technology Corporation under contract to CSPI. Elzly is a
consulting engineering firm specializing in corrosion and corrosion control for civil works, industrial
structures and military equipment. Their experience includes more than 20 years studying the durability
of corrugated metal structures and the benefits of various coatings. Elzly has a broad technical
perspective on the use of protective coatings, metal plating, corrosion resistant metal alloys and
chemical corrosion inhibitors.
Estimated Material Service Life (EMSL) Approach
The Canadian Highway Bridge Design Code1 does not dictate a specific durability estimation procedure.
Rather, the code provides minimum corrosion protection requirements and references a variety of
durability estimation procedures in the commentary. The commentary discusses coatings, cathodic
protection, engineered backfill and increased metal thickness as approaches to improving structural
durability. For durability estimation, the commentary refers the reader to the California Method2 and
1 CAN/CSA‐S6‐06 ‐ Canadian Highway Bridge Design Code 2 California Test 643, Method for Estimating the Service Life of Steel Culverts (http://www.dot.ca.gov)
DurabilityofStructuralPlateCorrugatedSteelPipeandDeepCorrugatedStructuralPlateStructures,February27,2012
Page 2 of 16
variants thereof. For loss models, the reader is referred to those proposed by the University of British
Columbia and AASHTO. In addition to the metal loss models which are compatible with the AASHTO
LFRD (Load and Resistance Factor Design) Bridge Design Specifications3 and that proposed in a study by
the University of British Columbia4 the UK Design Manual for Roads and Bridges5 also provides a metal
loss model.
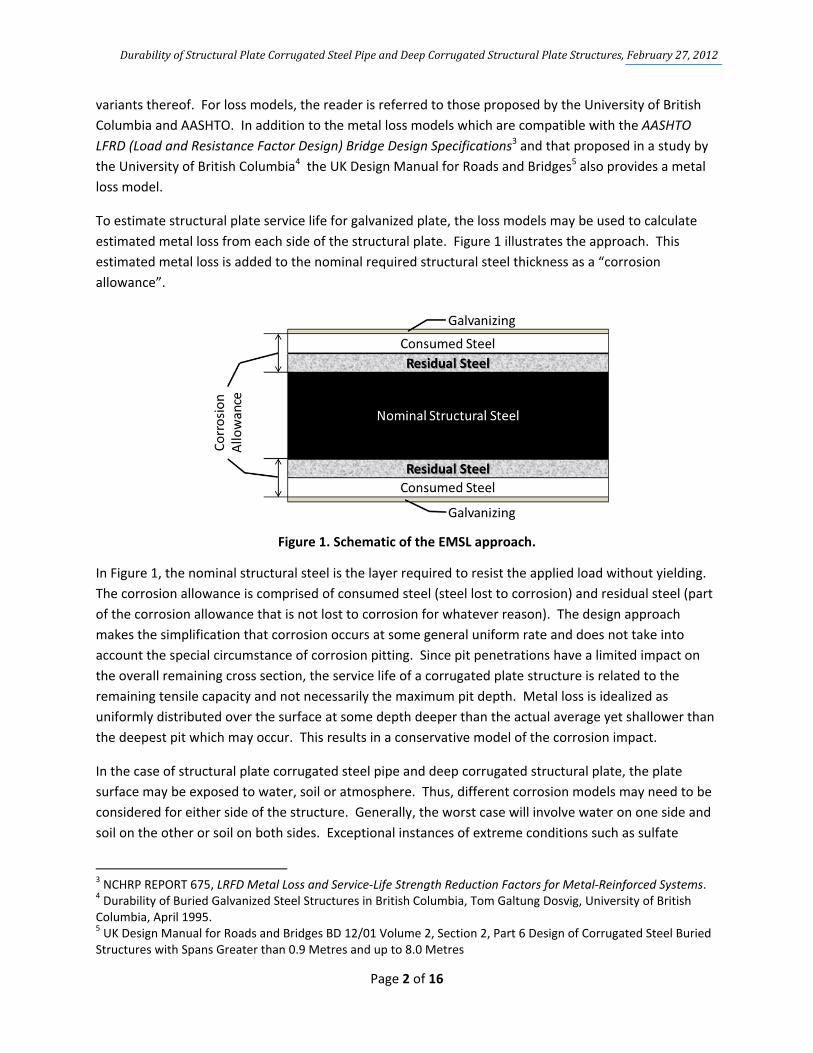
To estimate structural plate service life for galvanized plate, the loss models may be used to calculate
estimated metal loss from each side of the structural plate. Figure 1 illustrates the approach. This
estimated metal loss is added to the nominal required structural steel thickness as a “corrosion
allowance”.
Figure 1. Schematic of the EMSL approach.
In Figure 1, the nominal structural steel is the layer required to resist the applied load without yielding.
The corrosion allowance is comprised of consumed steel (steel lost to corrosion) and residual steel (part
of the corrosion allowance that is not lost to corrosion for whatever reason). The design approach
makes the simplification that corrosion occurs at some general uniform rate and does not take into
account the special circumstance of corrosion pitting. Since pit penetrations have a limited impact on
the overall remaining cross section, the service life of a corrugated plate structure is related to the
remaining tensile capacity and not necessarily the maximum pit depth. Metal loss is idealized as
uniformly distributed over the surface at some depth deeper than the actual average yet shallower than
the deepest pit which may occur. This results in a conservative model of the corrosion impact.
In the case of structural plate corrugated steel pipe and deep corrugated structural plate, the plate
surface may be exposed to water, soil or atmosphere. Thus, different corrosion models may need to be
considered for either side of the structure. Generally, the worst case will involve water on one side and
soil on the other or soil on both sides. Exceptional instances of extreme conditions such as sulfate
3 NCHRP REPORT 675, LRFD Metal Loss and Service‐Life Strength Reduction Factors for Metal‐Reinforced Systems. 4 Durability of Buried Galvanized Steel Structures in British Columbia, Tom Galtung Dosvig, University of British Columbia, April 1995. 5 UK Design Manual for Roads and Bridges BD 12/01 Volume 2, Section 2, Part 6 Design of Corrugated Steel Buried Structures with Spans Greater than 0.9 Metres and up to 8.0 Metres
DurabilityofStructuralPlateCorrugatedSteelPipeandDeepCorrugatedStructuralPlateStructures,February27,2012
Page 3 of 16
reducing bacteria (SRB) or highly corrosive chemistries would result in higher corrosion. The model does
not determine corrosion rates for these extreme conditions. Instead, the model includes environmental
limits within which the extreme conditions are unlikely.
The corrosion allowance is a calculated estimate of the average metal loss expected over the Design
Service Life (DSL). By adding a corrosion allowance to the thickness required to resist applied dead and
live loads we can ensure the structure meets the design requirements throughout the DSL. A protective
coating can be added to the structure, or portions of the structure, to reduce the estimated corrosion
allowance. If applicable, the guideline recommends the designer assume no metal loss for a period of
time on polymer coated pipe (this period of time is referred to as the add‐on life).
A corrosion allowance is calculated for each environment (water, soil and atmosphere) to which the
structure is exposed. Corrosion acts from both the inside and outside of a structure; only one corrosion
allowance for each side of a plate is to be summed to determine the required total corrosion allowance.
For example, for submerged plates on a creek crossing, it may be appropriate to use the water corrosion
allowance inside and soil allowance outside.
Water‐side Corrosion
Water side corrosion is the most complicated of the environments in which a corrugated structural plate
structure must perform. For water side corrosion, the engineer must consider water chemistry (pH,
resistivity, chlorides, sulfates, and hardness) and flow rate (aeration and abrasion).
pH level – pH is a measure of the acidity or alkalinity of the water. In acidic solutions, pH is less
than 7 (pH < 7) and for basic solutions pH is greater than 7 (pH > 7). A solution with pH = 7 is
considered neutral. As pH becomes more acidic, metallic corrosion generally increases. Caustic
(basic) pH is generally not corrosive to steel but can be corrosive to other materials such as
aluminum or zinc.
Resistivity (ohm‐cm) – resistivity is an indication of water’s inability to carry an electrical current.
It is a function of the concentration of Total Dissolved Solids (TDS) or salt ions in the water.
ASTM D‐1125 can be used to measure resistivity of water.
Chlorides (Cl) – chlorides are highly soluble compounds commonly found in deicing salts,
seawater and evaporation pools. Chloride ions are the most likely contributor to low resistivity
values. Chlorides promote the corrosion of unprotected steel because of their effect on
resistivity, depassivating effect and hygroscopic nature (in atmospheric exposures). ASTM D‐512
can be used to measure chloride ion content in water.
Sulfates (SO4) – soluble sulfates occur naturally. They are also commonly found in polluted air
and are deposited on soil and in water. They contribute to lower pH levels in water (acid rain).
Sulfate may decrease resistivity and support sulfate reducing bacteria in anaerobic conditions,
both of which promote the corrosion of unprotected steel. ASTM D‐516 can be used to measure
soluble sulfate in water.
DurabilityofStructuralPlateCorrugatedSteelPipeandDeepCorrugatedStructuralPlateStructures,February27,2012
Page 4 of 16
Total Hardness – hardness is indicated by the amount of calcium carbonate (CaCO3) dissolved in
the water and will determine the buffering capacity or ability of the water to neutralize acidity
from rainwater and other sources. Natural soft water has a low concentration of CaCO3 which,
despite high resistivity, may indicate a corrosive potential for galvanized steel. Hard water is
rich in CaCO3 which neutralizes acidity and forms a protective scale on galvanized steel. ASTM
D‐1126 can be used to measure total hardness of water.
Aeration & Flow – Well aerated, flowing water increases the corrosion rate of metals because it
(1) ensures that the maximum possible amount of oxygen is available to support the corrosion
reaction and (2) tends to prevent stable protective oxide films from forming on the surface. The
higher flow rates associated with higher abrasion levels will tend to increase metallic corrosion.
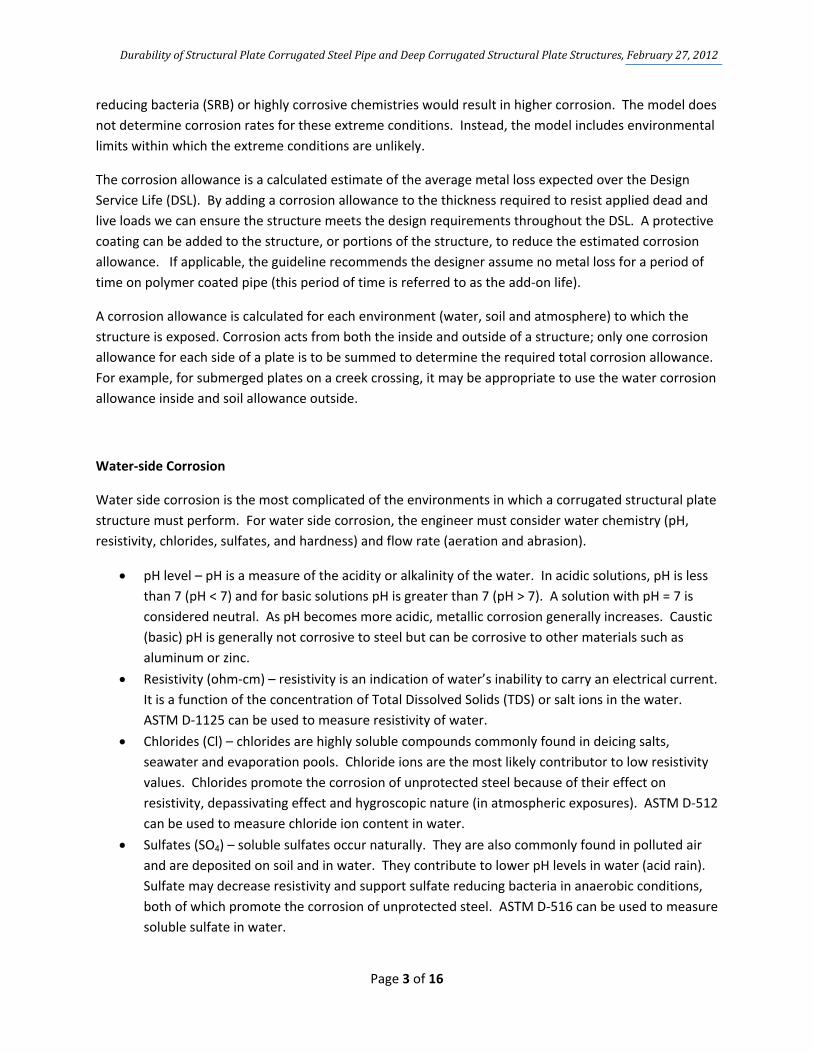
Abrasion – Table 1 shows four abrasion levels which have been defined based on the type of
bedload present and the anticipated maximum flow velocity.6
Table 1 – Abrasion Flow Parameters
Abrasion
Level
Bedload Description
Anticipated Flow
Velocity (m/s)
1
Non Abrasive – No bedload (e.g. storm sewers, stormwater
detention systems, arches)
Negligible
2
Low Abrasive – Minor bedloads of sand and gravel
0 ‐ 1.5
3
Moderately Abrasive –
Moderate bedloads of sand and gravel
1.5 ‐ 4.5
4
Severely Abrasive –
Heavy bedloads of sand, gravel and rock
1.5 ‐ 4.5
Flowing bedload will wear the soft zinc coating through to the hard “alloy layer” which is an
alloy of steel and zinc that is actually harder than the underlying steel. Abrasion velocities
should be evaluated on the basis of frequency and duration. Consideration should be given to a
frequent storm such as a two year event or mean annual discharge. Choosing a less
conservative (i.e., less frequent) flow condition for a design basis may extend the calculated
service life but will also increase the risk of erosion failure in the bottom of the structure.
Selection of the correct abrasion level is less critical for structures without a metal invert.
Table 2 shows a number of existing guidelines for water side corrosion of galvanized corrugated steel
pipe. The first three are from the UK Design Manual for Roads and Bridges. The fourth is guidance from
the New Mexico DOT and the fifth is guidance provided by the Corrugated Steel Pipe Institute. The UK
Design Manual is the only source that provides a quantitative calculation of corrosion allowance.
However, the UK Design Manual does not take into account water conditions which are known to be
6 Pipe Selection Guide, available from National Corrugated Steel Pipe Association, Washington, DC.

DurabilityofStructuralPlateCorrugatedSteelPipeandDeepCorrugatedStructuralPlateStructures,February27,2012
Page 5 of 16
corrosive in Canadian installations of galvanized pipe. Specifically, experience has shown that water
hardness less than 80 ppm or water resistivities greater than 8000 Ω‐cm can significantly shorten the life
of galvanized structures. Furthermore, moderate levels of abrasion (defined as moderate bedloads of
sand and gravel with an anticipated maximum flow velocity above 4.5 m/s) are not considered suitable
for uncoated galvanized structures.
Table 3 shows the effluent corrosivity classification scheme developed by modifying the UK models with
hardness parameters and upper resistivity bounds. The scheme includes three classifications based on
five characteristics. The overall classification should be based on the most severe condition and limiting
property. For example, if the chloride ion is 125 ppm and the soluble sulfates are 10 ppm, the
environment would be rated as “aggressive.”
For non‐aggressive and aggressive corrosivity classifications, galvanizing and steel corrosion rates can be
estimated using the equations in Table 4. Galvanized steel is not recommended for use in very
aggressive environments.
Table 2 ‐ Guidelines for Water Side Corrosion of Galvanized Corrugated Steel Pipe
Source pH Chloride, ppm
Sulfate, ppm
Hardness, ppm
Resistivity, Ω‐cm*
Corrosion Loss or Service Life
UK non‐aggressive
6.0‐9.0 ≤50 ≤240 N/A N/A (>2000)
Galvanizing – 4 µm/yr Steel – 22.5*t0.67 µm/yr
UK aggressive
5.0‐6.0 50‐250 240‐600
N/A N/A (667‐2000)
Galvanizing – 14 µm/yr Steel – 40.0*t0.80 µm/yr
UK very aggressive
<5.0 or >9.0
>250 >600 N/A N/A (<667)
Not Recommended without coating
New Mexico DOT
6.0‐8.5 <250 <250 N/A >1000 50 years
CSPI guidelines
5.8‐9.8 <150 <200 >80 2000‐8000 25 to 100 years (Varies with steel thickness and environment)
N/A – information not provided * Resistivity values for the UK criteria are not provided in the document but were estimated by the author based on the specified chemistry limits.
Table 3 ‐ Corrosivity Classification for Water and Effluent
Corrosivity Classification
pH Chloride ion (ppm)
Soluble sulfates (ppm)
Hardness ppm
Resistivity (ohm‐cm)
Non‐Aggressive
6 ≤pH≤9 ≤50 ≤240 >80 2000‐8000
Aggressive 5≤pH<6 >50 and ≤250 >240 and ≤600 >80 2000‐8000
Very Aggressive
<5 or >9 >250 >600 <80 <2000 or >8000

DurabilityofStructuralPlateCorrugatedSteelPipeandDeepCorrugatedStructuralPlateStructures,February27,2012
Page 6 of 16
Table 4 – Zinc and Steel Corrosion Rates for Non‐Aggressive and Aggressive Waters
Rate of corrosion of zinc (µm/year) Calculation for thickness of sacrificial steel (M, µm)(1)
Non‐Aggressive Aggressive Non‐Aggressive Aggressive
4 14 M = 22.5*(t‐16 years)0.67 M = 40.0*(t‐4.57 years)0.80
Note (1): t= Design Service Life in years. These formulae assume a zinc thickness of 64 µm per side (coating mass of 915 )
Table 5 provides the calculated steel corrosion allowance for various DSLs. Note that these loss rates assume that the inside surface of the galvanized steel is continuously immersed. For plates which are only seasonally exposed to water, this corrosion allowance is conservative. For the soil side surface of plates exposed to water via saturated soil, the soil side corrosion rates discussed in Table 7 shall be used as the water associated with saturated soil is not rich in oxygen, a key component of the water side corrosion process.
Table 5 – Calculated Water Side Steel Corrosion Allowance
DSL (years)
Steel Corrosion Allowance (µm)(1)
Non‐Aggressive Aggressive
25 98 447
50 239 847
75 346 1203
75(2) 66 145 Notes:
(1) The steel corrosion allowance is the thickness of steel that must be
considered as an add‐on to the thickness calculated as a structural
requirement
(2) The steel corrosion allowance for a 75 year DSL when polymer
coated is used at a Level 3 (Moderate) abrasion condition.
Soil‐side Corrosion
Corrosion of steel in soils has been studied extensively. Most models of soil corrosion are based on data
from a National Bureau of Standards (NBS) study of metal loss from steel and galvanized specimens that
were buried under a variety of soil conditions for more than 50 years. There is broad agreement with
the observation by Romanoff7 that metal loss rates follow an exponential rate of the form X=Ktn. This
equation implies that corrosion rate decreases with time. There are a number of models for projecting
soil corrosion for steel structures. Table 6 summarizes several of the models.
The models vary in their assumptions. Models 1 & 2 employ an exponential equation which accounts
for the beneficial effects of galvanizing. For simplicity, models 9 through 15 replace the exponential
equation with a linear rate and delay the initiation of corrosion to account for the life of the galvanizing.
Models 17 and 18 incorporate both delayed initiation and an exponential corrosion rate. As noted in
the table, most of the models have been developed for galvanized steel. However, models 3, 4, 9 and
7 M. Romanoff, "Underground Corrosion," NBS Circular 579, U.S. Dept. of Commerce, 1957.

DurabilityofStructuralPlateCorrugatedSteelPipeandDeepCorrugatedStructuralPlateStructures,February27,2012
Page 7 of 16
10 are for uncoated steel and would thus require modification (such as an initial offset) to be relevant
for galvanized steel.
Table 6 – Summary of Corrosion Loss Models from the Literature
Key Corrosion Loss (X) Formula Ref8 Notes
1 X (µm) = 25*t(years)0.65 (1) Average loss for galvanized steel based on NBS work
2 X (µm) = 50*t(years)0.65 (1) Maximum loss for galvanized steel based on NBS work
3 X (µm) = 40*t(years)0.80 (1) Average loss for carbon steels based on NBS work
4 X (µm) = 80*t(years)0.80 (1) Maximum loss for carbon steels based on NBS work
5 X (µm) = 25*t(years)0.65 (1) Maximum loss from Electrochemical Test Cell Data at 25% Saturation. (Darbin et al, 1988)
6 X (µm) = 2.8*t(years)0.65 (1) Minimum loss from Electrochemical Test Cell Data at 25% Saturation. (Darbin et al, 1988)
7 X (µm) = 50*t(years)0.60 (1) Maximum loss from Electrochemical Test Cell Data at 50% and 100% Saturation. (Darbin et al, 1988)
8 X (µm) = 5.5*t(years)0.60 (1) Minimum loss from Electrochemical Test Cell Data at 50%and 100% Saturation. (Darbin et al, 1988)
9 X (µm) = 80*t(years)0.80 (3) Nominal sacrificial steel requirement for plain steel in good quality fill
10 X (µm) = 13*t(years) (3) Nominal sacrificial steel requirement for plain steel in high quality fill
11 X (µm) = (tf‐10 years)*28 (3) Nominal sacrificial steel requirement for marginal quality fill. Assumes 86 µm galvanizing is present and tf is a design life less than 50 years.
12 X (µm) = (tf‐10 years)*28 (3) Caltrans guidance for “Neutral & Alkaline” fills (minimum resistivity > 1,000 Ω‐cm; pH > 7) with 86 µm galvanizing
13 X (µm) = (tf‐10 years)*33 (3) Caltrans guidance for “Acidic” fills (minimum resistivity > 1,000 Ω‐cm; pH < 7) with 86 µm galvanizing
14 X (µm) = (tf‐6 years)*71 (3) Caltrans guidance for “Corrosive” fills (minimum resistivity < 1,000 Ω‐cm) with 86 µm galvanizing
15 X (µm) = (tf‐30 years)*13 (3) Caltrans guidance for “Select Granular” fills (clean, free draining gravels with less than 5% fines and resistivity > 1,000 Ω‐cm) with 86 µm galvanizing
16 X (µm) = (t‐10.5 years)*12 (6) AASHTO model assuming 64 µm galvanizing
17 X (µm) = 22.5*(t‐16 years)0.67 (7) UK guidance for Non‐Aggressive soils; 64 µm galvanizing
18 X (µm) = 40.0*(t‐4.6 years)0.80 (7) UK for Aggressive soils and 64 µm galvanizing
CSPI Technical Bulletin 13 recommends the more conservative AASHTO method (Model 16) designed for
buried MSE retaining wall soil mats.9 This method applies assumed loss rates to the zinc coating and
carbon steel to determine the steel corrosion allowance required for a given design service life. As a
point of comparison, Technical Bulletin 13 also incorporates the UK loss rate for non‐aggressive soils
8 References can be found at the end of this white paper 9 AASHTO LRFD Bridge Construction Specifications, Article 7.6.4.2, Soil Reinforcements
DurabilityofStructuralPlateCorrugatedSteelPipeandDeepCorrugatedStructuralPlateStructures,February27,2012
Page 8 of 16
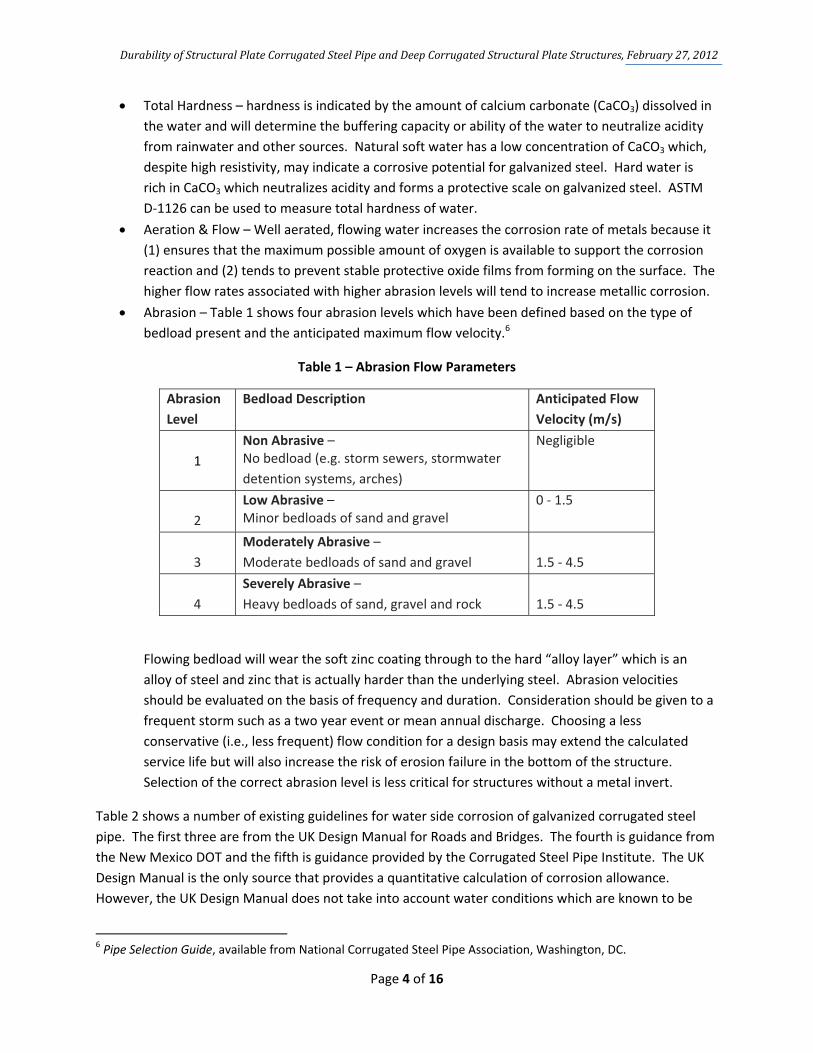
(Model 17). The less conservative UK model results in a smaller corrosion allowance than the AASHTO
model.10 The two corrosion allowance criteria represent a range of valid engineering models which may
be used for soil side corrosion. Table 7 shows basis for the loss rate calculation while Table 8 shows the
resulting corrosion allowance for common design lives.
Table 7 – Zinc and Carbon Steel Soil Side Loss Rates
Material Period AASHTO Standard Loss Rate/year/side (µm)3
UK Non‐Aggressive Loss Rate/year/side (µm)4
Zinc Coating First 2 years 15 4
Subsequently 4 4
Carbon Steel After Zinc Depletion 12 M=22.5 ts0.67
Note: M is the UK steel corrosion allowance, after zinc depletion, per side in µm (rather than a loss rate / year / side).
M is calculated as M = 22.5 * ts0.67, where ts is the additional design service life in years after zinc depletion (for a zinc
thickness of 64 µm per side, ts = design service life – 16 years)
Table 8 – Calculated Soil Side Steel Corrosion Allowance per Side
DSL (years)
AASHTO Steel Corrosion Allowance (µm per side)
UK Steel Corrosion Allowance (µm per side)
25 174 98
50 474 239
75 774 346 Note: The steel corrosion allowance is the thickness of steel that must be considered as an add‐on to the
thickness calculated as a structural requirement.
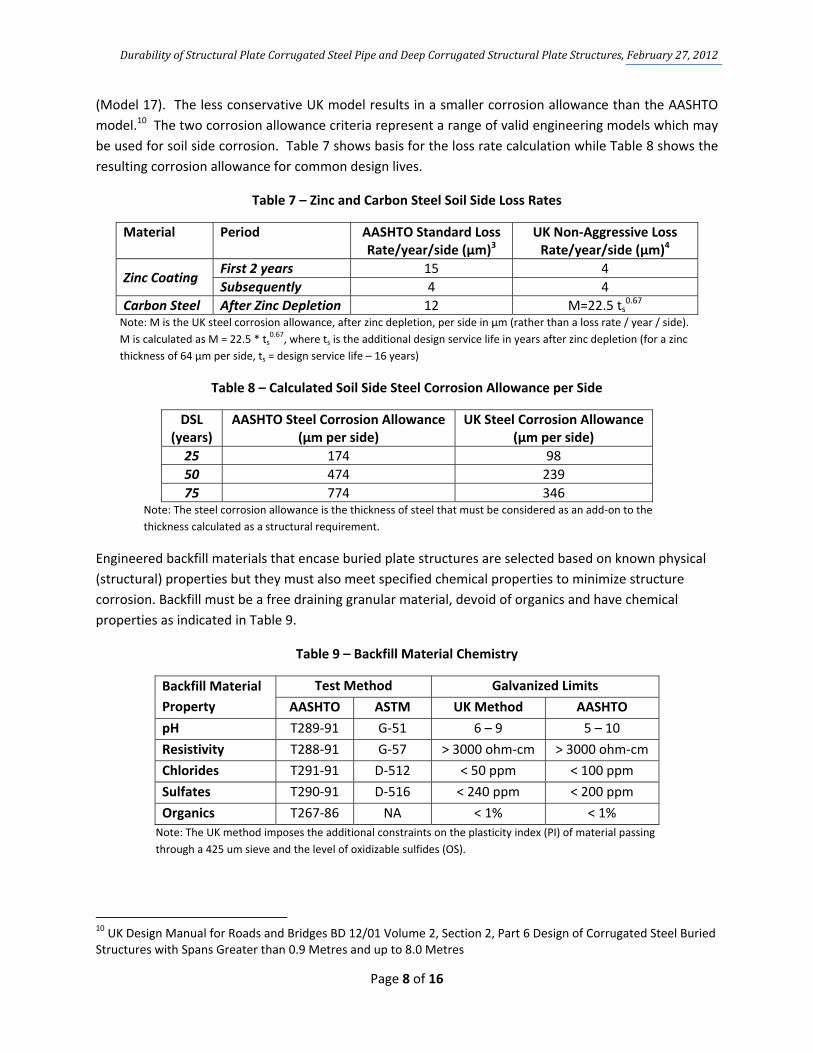
Engineered backfill materials that encase buried plate structures are selected based on known physical
(structural) properties but they must also meet specified chemical properties to minimize structure
corrosion. Backfill must be a free draining granular material, devoid of organics and have chemical
properties as indicated in Table 9.
Table 9 – Backfill Material Chemistry
Backfill Material
Property
Test Method Galvanized Limits
AASHTO ASTM UK Method AASHTO
pH T289‐91 G‐51 6 – 9 5 – 10
Resistivity T288‐91 G‐57 > 3000 ohm‐cm > 3000 ohm‐cm
Chlorides T291‐91 D‐512 < 50 ppm < 100 ppm
Sulfates T290‐91 D‐516 < 240 ppm < 200 ppm
Organics T267‐86 NA < 1% < 1% Note: The UK method imposes the additional constraints on the plasticity index (PI) of material passing
through a 425 um sieve and the level of oxidizable sulfides (OS).
10 UK Design Manual for Roads and Bridges BD 12/01 Volume 2, Section 2, Part 6 Design of Corrugated Steel Buried Structures with Spans Greater than 0.9 Metres and up to 8.0 Metres
DurabilityofStructuralPlateCorrugatedSteelPipeandDeepCorrugatedStructuralPlateStructures,February27,2012
Page 9 of 16
The pH of soil is used as an indicator of the soil corrosivity. Some metals are more sensitive to the pH of
their environment than others. As pH becomes more acidic, metallic corrosion generally increases.
Caustic (basic) pH is generally not corrosive to steel but can be corrosive to other materials such as
aluminum or zinc. The referenced test methods cover procedures for determining the pH of a soil using
conventional pH meters and probes.
Soil resistivity is a measure of a soil’s ability to support electrochemical corrosion by migration of
charged species necessary to balance corrosion reactions. Lower resistivity generally correlates to
higher corrosion rates. The referenced test methods cover the equipment and procedures for
measurement of soil resistivity both in‐situ and on samples removed from the ground.
Chloride ions are the most likely contributor to low resistivity values and will promote the corrosion of
unprotected steel. Sulfates (SO4) are generally considered to be more benign than chloride ions for
metallic corrosion. However, the presence of sulfates does pose a risk for metallic materials in the sense
that sulfates can be converted to highly corrosive sulfides by anaerobic sulfate reducing bacteria.
Because sulfate represents only one of the fractions in which sulfur can exist in the soil, the extraction
and quantification of soil sulfur can be a complex process. AASHTO Method T‐290‐91 describes a
chemical titration method for measuring water soluble sulfate concentrations.
Organic material in the backfill can initiate the formation of anaerobic pockets of soil which could be
contaminated with sulfate‐reducing bacteria, thereby initiating microbial attack in the form of severe
pitting. Low organic content is also required for structural purposes. Total organic content should be
limited to 1 percent by weight of the total soil fraction as determined in accordance with AASHTO T‐267.
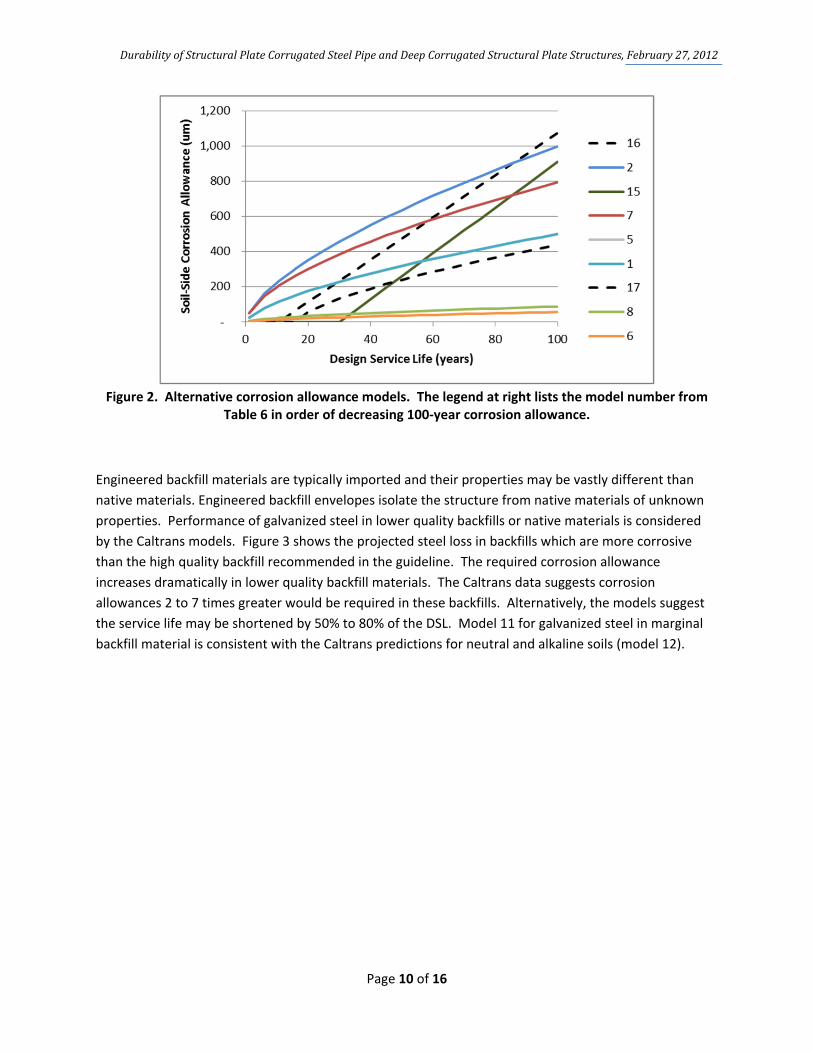
Figure 2 shows seven of the models for corrosion of galvanized steel in clean backfills (solid lines) as well
as the two models recommended in the design guidance for calculating the required steel corrosion
allowance (dashed lines). The data suggest the models recommended by the guideline bracket the high
and low levels of estimated steel loss in clean backfill.
DurabilityofStructuralPlateCorrugatedSteelPipeandDeepCorrugatedStructuralPlateStructures,February27,2012
Page 10 of 16
Figure 2. Alternative corrosion allowance models. The legend at right lists the model number from
Table 6 in order of decreasing 100‐year corrosion allowance.
Engineered backfill materials are typically imported and their properties may be vastly different than
native materials. Engineered backfill envelopes isolate the structure from native materials of unknown
properties. Performance of galvanized steel in lower quality backfills or native materials is considered
by the Caltrans models. Figure 3 shows the projected steel loss in backfills which are more corrosive
than the high quality backfill recommended in the guideline. The required corrosion allowance
increases dramatically in lower quality backfill materials. The Caltrans data suggests corrosion
allowances 2 to 7 times greater would be required in these backfills. Alternatively, the models suggest
the service life may be shortened by 50% to 80% of the DSL. Model 11 for galvanized steel in marginal
backfill material is consistent with the Caltrans predictions for neutral and alkaline soils (model 12).

DurabilityofStructuralPlateCorrugatedSteelPipeandDeepCorrugatedStructuralPlateStructures,February27,2012
Page 11 of 16
Figure 3. Corrosion allowance models for a range of soil conditions including select backfill.
Atmospheric Corrosion
Atmospheric corrosion of steel and zinc has been extensively studied. Experience suggests that
atmospheric corrosion is generally not a significant concern for corrugated plate products in installations
where the soil and water conditions are suitable for service. However, atmospheric corrosion may be
considered for structures subject to concentrated industrial gases or coastal areas with high levels of
airborne salinity. ISO standards for classification of environments11, 12 and data from the ISO CORRAG
program13 are useful if the designer wishes to quantify atmospheric corrosion in the EMSL approach.
Atmospheric corrosion categories are specified in International Standard ISO 9223.11 They are based on
Time of Wetness (TOW), sulfur dioxide concentration, and chloride concentration. To determine the
atmospheric corrosion category (designated as C1, C2, C3, C4 or C5), a table is consulted which relates
the TOW class (designated T1 through T5, based on hours per year of surface wetness), sulfur dioxide
class (designated P0 through P3, based on sulfation plate measurements) and chloride class (designated
S0 through S3 based on chloride candle measurement).
Based on this methodology, TOW is the major influence in atmospheric corrosivity. The harshest
environments (C4 and C5) have TOW classes of T4 and T5, which corresponds to greater than 30% of the
time, which is usually not the case.
11 ISO 9223:1992 Corrosion of metals and alloys ‐‐ Corrosivity of atmospheres – Classification. 12 ISO 9224: Corrosion of metals and alloys‐ Corrosivity of atmospheres‐ Guiding values for the corrosivity categories. 13 ISOCORRAG International Atmospheric Exposure Program: Summary of Results, 2010 ASTM International, West Conshocken, PA.

DurabilityofStructuralPlateCorrugatedSteelPipeandDeepCorrugatedStructuralPlateStructures,February27,2012
Page 12 of 16
Increasing classifications for sulfur dioxide and chlorides also increase the corrosion category. In
addition to high TOW, C4 and C5 classifications are associated with chloride deposition rates above 61
mg/m2/day, typically found in marine environments. Finally, C4 and C5 classifications are associated
with sulfur dioxide concentrations above 41 mg/m2. Such concentrations would be associated with
close proximity to industrial pollution sources. For reference, typical ambient air quality guidelines for
sulfur dioxide would be an annual average on the order of 0.03 mg/m3. Point source emissions (e.g.,
power plant stack emissions) might have on the order of 2,000 mg/m3.
Based on an ISOCORRAG study “International Atmospheric Exposure Program”, corrosion allowances
have been calculated for various environments in each of the corrosivity categories.14 Table 10
calculates the corrosion allowance which would be required for atmospheric corrosion to meet various
DSL in varying environmental corrosivity classifications. Note that applications which are neither marine
nor industrial would probably have a classification of C1, C2, or C3 and thus not require a corrosion
allowance.
Table 10 – Atmospheric Side Corrosion Allowance for Various Environments
C1 C2 C3 C4 C5
Steel Corrosion Rate (um/yr)
<=0.3 0.3‐4.9 4.9‐10 10‐16 16‐39
Zinc Corrosion Rate (um/yr)
<=0.05 0.05‐0.4 0.4‐1.1 1.1‐2.2 2.2‐4.4
Steel Corrosion Allowance to reach DSL (µm)15
25 years 0 0 0 0 0‐410
50 years 0 0 0 0‐330 330‐1,400
75 years 0 0 0‐170 170‐730 730‐2,400
100 years 0 0 0‐420 420‐1,100 1,100‐3,300
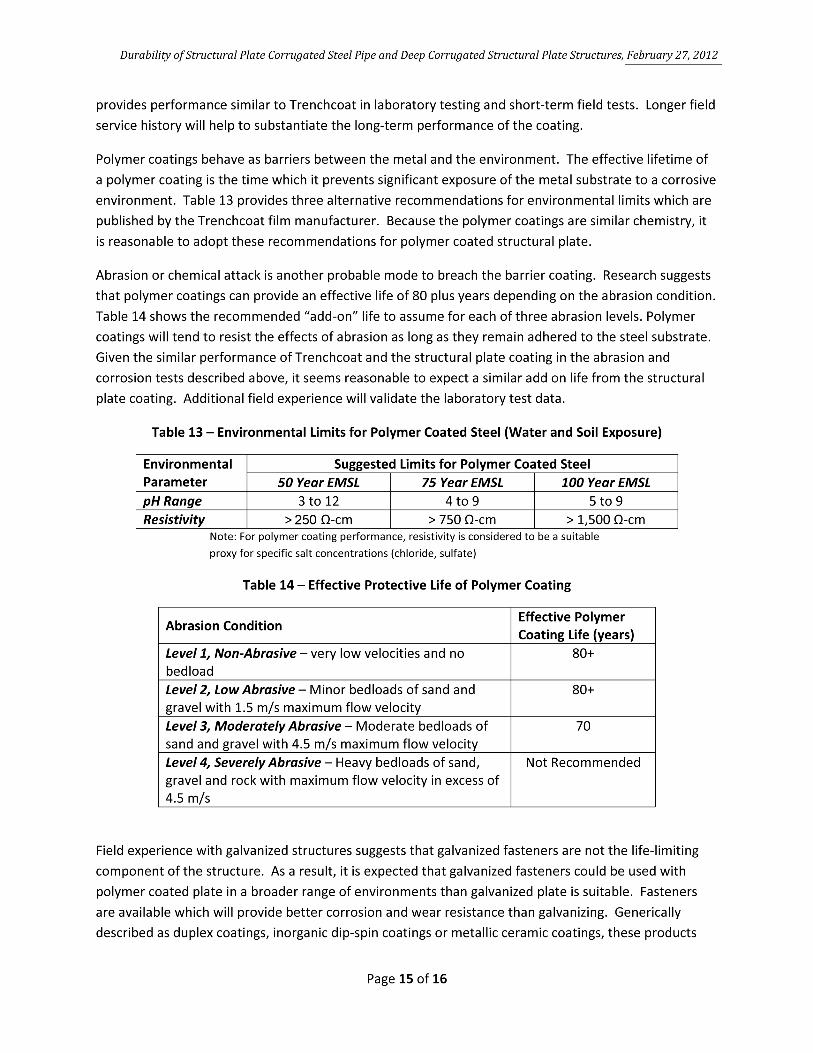
Polymer Coated Structural Plate
Polymer coatings were first introduced for corrugated steel pipe (CSP) applications in the 1970's. These
coatings offered a promising means of increasing the corrosion and abrasion resistance of CSP. At the
time several different types of polymer coatings were available. Of these polymer coatings, Dow
"Trenchcoat" proved to be the best performing and presently is the only polymer coating remaining in
production for CSP. The heavy gauge protective film is a tough, rugged film that is laminated to the
inside and outside of galvanized sheet metal prior to forming CSP, providing a corrosion and abrasion
barrier on the finished product. The film is comprised of two layers that have an overall nominal
thickness of 250 µm (10 mils). The product is fully described in ASTM A742, Polymer Precoated Sheet for
Sewers and Drains and included in CSA G401, Corrugated Steel Pipe Products.
14 Dagmar Knotkova, Kreislova, Katerina, Dean, Jr. Sheldon W. ISOCORRAG International Atmospheric Exposure Program: Summary of Results. ASTM International. May 2010. 15 Corrosion allowances assume 86µm galvanizing.

DurabilityofStructuralPlateCorrugatedSteelPipeandDeepCorrugatedStructuralPlateStructures,February27,2012
Page 13 of 16
Numerous laboratory and field studies have been conducted on this product.16 These studies have been
conducted by independent engineering firms, DOT's, CSP Fabricators, NCSPA members and the coating
suppliers. Field experience since 1974 has been documented to validate service life projections in
excess of 80 years for the product.16
As the Trenchcoat product is not designed for application on corrugated plate products, considerable
effort was put into the development of a similar product. The corrugated plate coating is a similar
chemistry as the Trenchcoat product. Both products are EAA (ethylene acrylic acid copolymer) materials
with comparable material characteristics. The corrugated plate coating is applied at a slightly higher film
thickness (400 µm versus 250 µm). The materials also have similar performance characteristics. Table
11 shows some of the material characteristics based on manufacturers’ data.
Table 11 – Material Data for Alternative EAA Coatings
Property Structural Plate Coating Trenchcoat
Chemistry Thermoplastic ethylene acrylic
acid copolymer ethylene acrylic acid copolymer Cured Film Thickness 250µm minimum, 400µm average 250µm Condensing Humidity Resistance 5000+ hours
6 months (~4300 hours), no attack or loss of adhesion
Salt Spray Resistance 3000+ hours 1000 hours Color Black Black Tensile Yield, Mpa 8 10.7 Tensile Strength, Mpa 20 20.7 Percent Elongation 610 470 Shore D Hardness 54 46
Comparative testing of polymer coated structural plate has been performed by Transports Québec,
Service des Matériaux d'Infrastructures in accordance with Méthode LC 21‐102, “Aggregates’ Resistance
To Polishing: Sand‐Blasting Method.” The test involves subjecting test panels to abrasive impact from
Ottawa sand. The sand was blasted on the surface at a rate of 570 g/minute for four cycles at 43.3
minutes per cycle. Figure 4 shows the measured coating thickness loss during the course of the testing.
As can be seen, the EAA copolymer on the corrugated plate product outperformed the Trenchcoat.
Both EAA materials out‐performed the metallic coatings (galvanized and aluminized).
16 For example, see Ault “Performance of Polymer Coated Corrugated Steel Pipe” 2003 Transportation Research Board, Washington, D.C.

DurabilityofStructuralPlateCorrugatedSteelPipeandDeepCorrugatedStructuralPlateStructures,February27,2012
Page 14 of 16
Figure 4. Performance of coatings in sand‐blasting test.
Acceptance test methods for polymer coated sheet quality described in ASTM A742 are applicable to
polymer coated plate with the exception of adhesion testing. The adhesion test method described in
ASTM A742 relies on bending coated sheet which is not practical for most coated structural plate (due to
the increased thickness). An alternative knife cut adhesion test would be more suitable for structural
plate. The adhesion test requirement has been modified to include the Transports Québec abrasion
resistance test described above. Table 12 contains a preliminary list of acceptance tests required for
polymer coated structural plate. These are included for guidance only; a full performance specification
was under development at the time this white paper was prepared.
Table 12 ‐ Guidance for Structural Plate Coating Acceptance Testing
Property Test Method Requirement Adhesion ASTM D3359 Rating of “5A” or better
Impact ASTM D2794 No break after a 4.0J impact on a 15.88
mm punch Thickness ASTM D1005 250µm minimum, 400µm average Holidays ASTM G62 Less than 22 holidays per square meter Abrasion Resistance LC 21-102 Max 0.43 g Imperviousness ASTM D543 No loosening or separation Freeze-Thaw Resistance ASTM A742 No effect after 100 cycles Weatherability ASTM G23 No effect after 100 hours Resistance to Microbial Attack ASTM G22 No Effect
It is critical to note product performance is dependent on coating chemistry and application process.
Simply selecting a generically similar coating does not guarantee success. However, the combination of
primer, protective coating and processing steps does seem to provide a structural plate coating which
DurabilityofStructuralPlateCorrugatedSteelPipeandDeepCorrugatedStructuralPlateStructures,February27,2012
Page 16 of 16
have found widespread acceptance in manufacturing industries. Use of coated fasteners is
recommended in the most extreme environments.
Summary
The durability of galvanized structural steel plate is adequate to provide a long life in the proper
environment. Polymer coated structural plate has been developed for use in more challenging
environments. CSPI has developed a guideline which provides a methodology for identifying
environments where polymer coated structural plate is a cost‐effective material to meet the desired
DSL. This white paper describes the technical background for the CSPI guideline, allowing the engineer
to perform additional detailed analysis or consider uniquely challenging applications.
References
1. Corrosion/Degradation of Soil Reinforcements for Mechanically Stabilized Earth Walls and
Reinforced Soil Slopes, FHWA Publication No. FHWA‐NHI‐09‐087. November 2009
2. Durability of Buried Galvanized Steel Structures in British Columbia, Tom Galtung Dosvig,
University of British Columbia, April 1995.
3. NCHRP Report 675: LRFD Metal Loss and Service Life Strength Reduction Factors for Metal‐
Reinforced Systems, Transportation Research Board, 2011.
4. CAN/CSA‐S6‐06. Canadian Highway Bridge Design Code. November 2006
5. Modern Sewer Design. American Iron and Steel Institute. Fourth Edition 1999
6. AASHTO LRFD Bridge Construction Specifications, Article 7.6.4.2, Soil Reinforcements
7. UK Design Manual for Roads and Bridges BD 12/01 Volume 2, Section 2, Part 6 Design of
Corrugated Steel Buried Structures with Spans Greater than 0.9 Metres and up to 8.0 Metres
Recommended