
What we observe is not nature herself,
But nature exposed to our method of questioning.
--Werner Heisenberg
Lord, grant me the Serenity to accept the things I cannot change,
Courage to change the things I can,
and Wisdom to know the difference.
--Reinhold Niebuhr
University of Alberta
Study of Anisotropic Surface Property of Phyllosilicates by
Atomic Force Microscopy
by
Lujie Yan
A thesis submitted to the Faculty of Graduate Studies and Research
in partial fulfillment of the requirements for the degree of
Doctor of Philosophy
in
Chemical Engineering
Department of Chemical and Materials Engineering
© Lujie Yan
Fall 2013
Edmonton, Alberta
Permission is hereby granted to the University of Alberta Libraries to reproduce single copies of this thesis
and to lend or sell such copies for private, scholarly or scientific research purposes only. Where the thesis is
converted to, or otherwise made available in digital form, the University of Alberta will advise potential users
of the thesis of these terms.
The author reserves all other publication and other rights in association with the copyright in the thesis and,
except as herein before provided, neither the thesis nor any substantial portion thereof may be printed or
otherwise reproduced in any material form whatsoever without the author's prior written permission.
Abstract
The phyllosilicates are an important class of valuable industrial minerals and play
an essential role in many disciplines. The surface properties of phyllosilicate
minerals are a topic of crucial importance as they directly affect all industrial
aspects in mineral processing. The objective of this research is to investigate the
anisotropic surface properties of selected phyllosilicate minerals, focuing on
surface charging properties of their basal planes and edge surfaces, and their
related particle interactions and rheological properties of particle suspensions.
An ultramicrotome cutting technique was developed to prepare molecularly smooth
edge surfaces of phyllosilicates, which allows direct measurement of interaction
forces between AFM tips and the prepared surfaces in various electrolyte solutions.
A theoretical model based on the geometry of AFM tip was used to fit the measured
force profiles to the classical DLVO theory at different boundary conditions, which
allows direct determination of Stern potentials of different phyllosilicate surfaces.
The surface charging behavior of muscovite and talc basal planes and edge
surfaces was determined as a function of pH. The basal planes of both muscovite
and talc were found to carry a pH-independent permanent negative charge, while
the charges on their edge surfaces were highly pH-dependent. The effect of the
concentration of two divalent cations: Mg2+
and Ca2+
on the Stern potential of
different surfaces of phyllosilicate minerals was investigated. The interaction
energies of various associations between talc surfaces, such as basal plane-basal
plane, edge-edge and basal plane-edge were calculated using the Stern potential
values of talc basal planes and edge surfaces obtained from fitting the measured
force profiles to the classical DLVO theory. The attractive interaction between talc
basal planes and edge surfaces was found to dominate the rheological behavior of
talc suspensions.
The findings from this dissertation are anticipated to provide a basis for
understanding the colloidal behavior of phyllosilicates in mineral processing and
hence better control their process performance.
Acknowledgements
I would like to express my sincere gratitude and appreciation to my supervisors Professor
Zhenghe Xu and Professor Jacob H. Masliyah for providing me this great opportunity to
fulfill my PhD study overseas. Their invaluable guidance and insistence on excellence
enabled me to attain my research goals. It is such a privilege for me to be one of their
students.
Many thanks go to Dr. Helmut Gnägi at Diatome Ltd in Switzerland, a guru in microtome
cutting technique, for his willingness to test my mineral samples and provide valuable
technical advice and discussion on sample preparation and microtome cutting procedure
which really facilitated the progress of this project.
I would like to thank Dr. Ming Chen of University of Alberta for his generously sharing
the recipe of resin used in sample preparation for microtome cutting and giving the glass
knifemaker equipment to our lab to make knifes used in microtome cutting.
My gratitude goes to Dr. Shihong Xu for his assistance in SEM imaging and his
willingness to help me out when I came to him with some problems of Matlab program in
developing the theoretical model and data fitting.
My appreciation goes to Dr. Jingyi Wang for her assistance in contact angle measurement,
Dr. Alexander Englert, Dr. Hongying Zhao and Ms. Shaiu-yin Wu for sharing their
experiences with AFM at the first stage of my research.
Thanks are also extended to Professor Jan D. Miller at the University of Utah and
Professor John Ralston at the University of South Australia for their insightful
suggestions during our discussions about my project.
I acknowledge Ms. Lisa Carreiro and Mr. Jim Skwarok for their assistance in managing
facilities and recourses.
The financial support from Natural Sciences and Engineering Research Council (NSERC)
industrial Research Chair in Oil Sands Engineering is acknowledged.
My deepest gratitude goes to my parents in China. Thanks for their understanding and
support on all decisions I have made in my life. Their precious love and absolute faith in
me are always my motivation to move forward. Thanks for all friends I met here after I
arrived in Canada, especially one of my best, Wei Guo for sharing with me over these
years and helping pull me through when the going was tough.
Table of Contents
Chapter 1 Introduction ............................................................................ 1
1.1 Mineralogy of phyllosilicates.......................................................................... 1
1.2 Anisotropic surface properties of phyllosilicates ............................................ 4
1.3 Aims and objectives ........................................................................................ 6
1.4 Organization of the dissertation ...................................................................... 7
1.5 References ..................................................................................................... 10
Chapter 2 Literature review................................................................... 11
2.1 Interactions between two surfaces ................................................................ 11
2.1.1 DLVO theory .................................................................................... 11
2.1.2 Van der Waals interactions ............................................................... 12
2.1.3 Electrostatic double layer interaction ............................................... 12
2.1.4 Derjaguin approximation ................................................................. 16
2.1.5 The effect of surface roughness ....................................................... 20
2.2 Particle association and rheological property ............................................... 19
2.3 Surface charging characteristic of phyllosilicates ......................................... 23
2.3.1 Zeta potential measurement ............................................................. 24
2.3.2 Potentiometric titration .................................................................... 26
2.3.3 Sum frequency generation spectroscopy.......................................... 27
2.3.4 Atomic force microscopy ................................................................. 28
2.4 References ..................................................................................................... 32
Chapter 3 Materials, characterization and methods ........................... 37
3.1 Materials ....................................................................................................... 37
3.2 Preparation of different phyllosilicate surfaces ............................................ 37
3.2.1 Ultramicrotome cutting technique ................................................... 37
3.2.2 Characterization of prepared surfaces .............................................. 39
3.3 AFM .............................................................................................................. 41
3.3.1 The principle of the AFM ................................................................ 41
3.3.2 AFM imaging ................................................................................... 42
3.3.3 AFM force measurement ................................................................. 43
3.3.4 AFM tip evaluation .......................................................................... 46
3.4 Theoretical model for DLVO calculation ..................................................... 48
3.5 References ..................................................................................................... 53
Chapter 4 Determination of anisotropic surface charging
characteristics of different phyllosilicates by direct
force measurements: Effect of pH ....................................... 54
4.1 Introduction ................................................................................................... 54
4.2 Results and discussion .................................................................................. 56
4.2.1 Interactions between AFM tip and silica surfaces............................... 56
4.2.2 Interactions between AFM tip and talc surfaces ................................. 59
4.2.3 Interactions between AFM tip and muscovite surfaces ...................... 64
4.2.4 PZC and protonation reactions of different phyllosilicate edge
surfaces……………….. .................................................................. 69
4.3 Summary ....................................................................................................... 74
4.4 References ..................................................................................................... 75
Chapter 5 Interaction of divalent cations with basal planes and
edge surfaces of phyllosilicate minerals .............................. 78
5.1 Introduction ................................................................................................... 78
5.2 Results and discussion .................................................................................. 81
5.2.1 Interactions between AFM tip and silica surfaces ........................... 81
5.2.2 Interactions between AFM tip and different muscovite surfaces .... 86
5.2.3 Interactions between AFM tip and different talc surfaces ............... 89
5.2.4 Stern potentials of different muscovite and talc surfaces ................ 93
5.2.5 Anisotropic surface character of phyllosilicates .............................. 95
5.2.6 Effect of different divalent cations ................................................... 98
5.3 Summary ..................................................................................................... 100
5.4 References ................................................................................................... 102
Chapter 6 Understanding suspension rheology of phyllosilicates
from direct force measurement using AFM ................... 104
6.1 Introduction ................................................................................................. 104
6.2 Results and discussion ................................................................................ 107
6.2.1 Tip calibration ................................................................................ 107
6.2.2 Interactions between AFM tip and different talc surfaces ............. 109
6.2.3 Interaction energy between different talc surfaces ......................... 112
6.2.4 Predicting rheology of talc suspensions ......................................... 115
6.3 Summary ..................................................................................................... 117
6.4 References ................................................................................................... 119
Chapter 7 Adsorption and conformation of polysaccharide on
anisotropic phyllosilicates: Effect of ionic strength ......... 120
7.1 Introduction .................................................................................................. 120
7.2 Experimental ................................................................................................ 125
7.2.1 Polysaccharide solution. ................................................................... 125
7.2.2 AFM imaging .................................................................................... 126
7.3 Results and discussion ................................................................................. 128
7.3.1 Characteristics of CMC ..................................................................... 128
7.3.2 CMC adsorption on talc basal planes ................................................ 130
7.3.3 CMC adsorption on talc edge surfaces ............................................. 135
7.3.4 CMC adsorption on silica surfaces ................................................... 138
7.4 Summary ...................................................................................................... 143
7.5 References .................................................................................................... 144
Chapter 8 Summary ............................................................................. 147
8.1 General conclusions .................................................................................... 147
8.2 Contributions to original knowledge .......................................................... 149
8.3 Recommendations for further work ............................................................ 150
Appendix A Deposition of phyllosilicate particle suspensions .......... 151
Appendix B Estimation of surface energy of different
phyllosilicate surfaces ............................................... 155
B.1 Good & Van Oss model .............................................................................. 155
B.2 Three-probe-liquid contact angle measurement .......................................... 155
B.3 References ................................................................................................... 157
Appendix C AFM images of CMC adsorbed onto muscovite
basal planes .................................................................. 158
List of Figures
Figure 1.1 Crystalline structures of typical phyllosilicates: (a) kaolinite; (b)
talc and (c) muscovite ............................................................................... 3
Figure 1.2 Schematics of anisotropic phyllosilicate surfaces ..................................... 4
Figure 1.3 Schematics of the surface groups populating on (a) muscovite and
(b) talc basal planes and edge surfaces ..................................................... 5
Figure 2.1 Schematics of an electrical double layer of a charged surface. ............... 13
Figure 2.2 Schematics of the Derjaguin approximation ........................................... 17
Figure 2.3 Schematics of applying the SEI method to a smooth colloidal probe
and rough plate in AFM colloidal probe technique................................. 19
Figure 2.4 Modes of particle association in phyllosilicate suspensions: (a)
dispersed; (b) face-to-face (FF); (c) edge-to-face (EF) and (d)
edge-to-edge (EE) ................................................................................... 22
Figure 2.5 Schematics of the effect of pH on the yield stress in terms of
particle associations of phyllosilicate minerals ..................................... 23
Figure 3.1 Schematics of preparing the phyllosilicate edge surfaces by the
ultramicrotome cutting technique ......................................................... 37
Figure 3.2 Typical FE-SEM images of the talc edge surface prepared by the
ultramicrotome cutting technique: (a) taken with lower area
resolution but larger scanning area; and (b) taken by zooming in on
a small smooth area at a high resolution. ................................................ 40
Figure 3.3 XPS spectra of talc and muscovite (a) basal plane and (b) edge
surface ..................................................................................................... 41
Figure 3.4 Schematics of the components in an AFM experiment ........................... 42
Figure 3.5 Typical AFM force curves: (a) “force vs. piezo displacement”
curves recorded by AFM and (b) “force vs. separation distance”
force profiles converted from (a). ........................................................... 44
Figure 3.6 Typical FE-SEM images of an AFM silicon nitride tip used in this
study: (a) plane view; (b) oblique view; and (b1) scanning auger
electron spectroscopy analysis on the top end of the tip. ........................ 47
Figure 3.7 Geometry of a model conical AFM tip with spherical apex used for
DLVO calculations. ................................................................................. 50
Figure 4.1 Typical (a) AFM image of silica wafer and (b) interaction forces
measured between a silicon nitride tip and silica wafer in 1 mM
KCl solutions at pH 5.6, 7.9 and 9.9. ...................................................... 56
Figure 4.2 Comparison of Stern potential values of silicon nitride, determined
by fitting of AFM-force profiles, with ζ potential values
determined by electrophoresis method ................................................... 59
Figure 4.3 Typical AFM images of a prepared hydrophobic talc basal plane
and an edge surface: (a) Talc basal plane with a mean roughness of
0.355 nm (Rq) over 4 µm2; (b) Talc edge surface with a mean
roughness of 0.723 nm (Rq) over 4 µm2 ................................................. 60
Figure 4.4 Typical interaction force curves (a) between AFM tip and
hydrophobic talc basal plane, and (b) between the tip and
hydrophilic talc edge surface, measured in 1 mM KCl solutions of
different pH values. ............................................................................... 61
Figure 4.5 Comparison of Stern potential values determined in this study by
AFM with ζ potential values from Reference for talc (a) basal
plane and (b) edge surface. ..................................................................... 63
Figure 4.6 Typical AFM images of phyllosilicate planes prepared by
microtome cutting technique: (a) muscovite basal plane with a
mean roughness of 0.221 nm (Rq) over 4 µm2; (b) muscovite edge
surface with a mean roughness of 0.569 nm (Rq) over 4 µm2. ............. 65
Figure 4.7 Typical AFM interaction force curves measured between a tip and
muscovite (a) basal plane and (b) edge surface in 1 mM KCl
solutions of various pH values. ............................................................... 68
Figure 5.1 ζ potential of silica particles in 1 mM KCl solutions containing
various concentrations of (a) Ca2+
and (b) Mg2+
at around pH 8.5,
determined by electrophoresis method. .................................................. 82
Figure 5.2 Typical AFM interaction force profiles measured between the AFM
silicon nitride tip and the silica wafer surface in 1 mM KCl
solutions containing various concentrations of (a) Ca2+
and (b)
Mg2+
at pH 8.5 ......................................................................................... 83
Figure 5.3 Comparison of the Stern potential values of AFM silicon nitride tip
determined by fitting of AFM-force profiles with ζ potential values
determined for silicon nitride nano particles by electrophoresis
method in 1 mM KCl solutions containing various concentrations
of (a) Ca2+
and (b) Mg2+
at pH 8.5. .......................................................... 85
Figure 5.4 Typical AFM interaction force profiles measured between AFM tip
and muscovite basal planes in 1 mM KCl solution of various (a)
Ca2+
and (b) Mg2+
concentrations at pH 8.5 ............................................ 87
Figure 5.5 Typical AFM interaction force profiles measured between AFM tip
and muscovite edge planes in 1 mM KCl solutions containing (a)
Ca2+
and (b) Mg2+
at pH 8.5 .................................................................... 88
Figure 5.6 Typical AFM interaction force profiles measured between AFM tip
and talc basal planes in 1 mM KCl solutions of various (a) Ca2+
and
(b) Mg2+
concentrations at pH 8.5. ......................................................... 91
Figure 5.7 Typical AFM interaction force profiles measured between AFM tip
and talc edge surfaces in 1 mM KCl solutions of various (a)
Ca2+
and (b) Mg2+
concentrations at pH 8.5 ............................................ 92
Figure 5.8 Stern potentials of (a) muscovite and (b) talc basal plane and edge
surfaces in 1 mM KCl solution of different Ca2+
and Mg2+
concentrations at pH 8.5, obtained by fitting the measured AFM
force profiles to the classical DLVO theory. ........................................... 94
Figure 6.1 (a) Average zeta potential values of talc particles in KCl solutions
measured by electrophoresis methods taken from literature; (b)
The total interaction energy per unit area of talc particles at
different pH in 1 mM KCl solutions calculated using DLVO theory
and measured average zeta potential values; (c) The yield stress
data of talc particles at different pH in KCl solutions taken from
literature ................................................................................................ 106
Figure 6.2 Typical interaction force profiles measured between AFM tip and
silica wafer in 1 mM KCl solutions of different pH values ................ 108
Figure 6.3 Typical force profiles measured between tip and talc (a) basal
planes and (b) edge surfaces in 1 mM KCl solutions as a function
of aqueous solution pH ........................................................................ 111
Figure 6.4 Stern potentials of talc basal planes and edge surfaces extracted by
fitting the measured force profiles to the classical DLVO theory. ........ 112
Figure 6.5 The calculated total interaction energy per unit area of various
associations of talc surfaces in 1 mM KCl solutions at different pH
using Stern potential values derived from AFM colloid probe force
measurement and DLVO fit. ................................................................. 113
Figure 7.1 Image processing for determination of CMC coverage on the
surface by using Image J: (a) the original AFM image and (b) the
corresponding binary (black and white) image for calculation of
surface coverage. ................................................................................. 127
Figure 7.2 The structure of CMC ............................................................................ 128
Figure 7.3 (a) potentialsand (b) corresponding radius of gyration of
CMC solutions of different ionic strengths at pH 9. ......................... 130
Figure 7.4 In situ AFM images of CMC (50 ppm) adsorbed onto talc basal
planes in KCl solutions at pH 9 of different ionic strengths: (a) 1
mM; (b) 10 mM and (c) 100 mM. ......................................................... 133
Figure 7.5 In situ AFM images of CMC (50 ppm) adsorbed onto talc edge
surfaces in solutions at pH 9 of different ionic strengths: (a) 1 mM;
(b) 10 mM and (c) 100 mM. ................................................................. 136
Figure 7.6 In situ AFM images of CMC (50 ppm) adsorbed onto the silica
surface in solutions of pH 9 at different ionic strengths: (a) 1 mM
KCl; (b) 10 mM KCl and (c) 100 mM KCl. ......................................... 141
Figure 7.7 Summary of surface coverage and apparent layer thickness of
adsorbed CMC on different surfaces in KCl solutions of different
ionic strengths at pH 9. ......................................................................... 142
Figure A.1 Schematics of muscovite sheet coated with phyllosilicate particles
for microtome cutting and the proposed view of cross section............. 151
Figure A.2 SEM images of kaolinite particles deposited on muscovite
substrate: (a) large area at low resolution and (b) small area at
high resolution. ................................................................................. 152
Figure A.3 SEM images of illite particles deposited on muscovite substrate: (a)
large area at low resolution and (b) small area at high resolution. ....... 153

Figure A.4 SEM images of montmorillonite particles deposited on muscovite
substrate: (a) large area at low resolution and (b) small area at high
resolution. .............................................................................................. 154
Figure C.1 In situ AFM images of CMC (50 ppm) adsorbed onto muscovite
basal planes in KCl solutions at pH 9 of different ionic strengths:
(a) 1 mM; (b) 10 mM and (c) 100 mM ................................................. 158
List of Tables
Table 1.1 Classification of phyllosilicate minerals. ............................................... 2
Table 2.1 Summary of reported IEP (determined by ζ potential measurements),
PZC (determined by potentiometric titration method) and maximum
yield stress of phyllosilicates. .............................................................. 21
Table 3.1 The values used for calculation of Hamaker constant AH .................... 48
Table 4.1 Comparison of best-fitted Stern potential values of silica obtained in
this study with corresponding literature values obtained by
microelectrophoresis (MEP), streaming potential (SP) and fitting of
AFM force profiles. ............................................................................. 58
Table 4.2 Comparison of best-fitted Stern potential values of the muscovite
basal plane with literature values of mica obtained by
microelectrophoresis (MEP) and streaming potential (SP)
measurements, and AFM fitting ......................................................... 69
Table 4.3 Possible surface groups on muscovite and talc edgesurfaces and
corresponding protonation constants (log KH). .................................. 71
Table 6.1 Comparison of Stern potential, obtained by best-fit of interaction
force profiles between a silicon nitrate tip and silica wafer
measured using AFM colloid probe force technique with the
classical DLVO theory, with corresponding literature values
obtained by microelectrophoresis (MEP), streaming potential (SP)
and AFM force curve fitting. ........................................................... 109
Table 7.1 Rq surface roughness, apparent layer thickness (PTV distance) and
surface coverage of adsorbed CMC (50 ppm) on talc basal planes in
KCl solutions of different ionic strengths at pH 9 ............................. 134
Table 7.2 Contact angles of bare talc basal planes and in the presence of
adsorbed CMC (50 ppm) in KCl solutions of different ionic
strengths at pH 9. ............................................................................... 134
Table 7.3 Rq surface roughness, apparent layer thickness (PTV distance) and
surface coverage of adsorbed CMC (50 ppm) on talc edge surfaces
in KCl solutions of different ionic strengths at pH 9 ......................... 137
Table 7.4 Rq surface roughness, apparent layer thickness (PTV distance) and
surface coverage of adsorbed CMC (50 ppm) on silica surfaces in
KCl solutions of different ionic strengths at pH 9 ............................. 142
Table B.1 Three probe liquids for measuring the surface energy of
phyllosilicates. ............................................................................... 142
Table B.2 Contact angles of three probe liquids on different surfaces. ............. 156
Table B.3 Surface energy of different surfaces .................................................. 156
Table C.1 Rq surface roughness, apparent layer thickness (PTV distance) and
surface coverage of adsorbed CMC (50 ppm) on muscovite basal
planes in KCl solutions of different ionic strengths at pH 9 .............. 159
Nomenclature
TotalU total interaction energy per unit area, J/m2
VDWU Van der waals interaction energy per unit area, J/m2
EDLU electrostatic interaction energy per unit area, J/m2
HA
Hamaker constant, J
i static dielectric constant for materials i
in
refractive index for materials i
h
Planck's constant, 6.63× 10⁻³⁴
J S
e electronic absorption frequency of material, Hz
s surface potential, V
d Stern potential, V
zeta potential, V
electronic potential, V
e
elementary charge, 1.6 × 10⁻¹⁹
C
Bk Boltzmann constant, 1.38 × 10⁻²³
J/K
T absolute temperature, K
1
Debye length, m
D distance, m
EDLF
electrostatic interaction force, N
U interaction energy per unit area between two bodies of arbitrary
shape, J/m2
UA (x)
interaction energy between two planar plates separated by a gap x,
J/m2
knkn / angle of the curved surface of the body
Y yield stress, Pa
strucK network structural factor
relative permittivity of a medium, C/mV
0 permittivity of vacuum, 8.85× 10⁻¹²
C/mV
surface charge density, C/m2
aF Faraday’s constant, 9.65× 10⁻⁴
C/mol
ac amount of acid titrant, mol/L
bc
amount of base titrant, mol/L
0c
number density of the ions in the bulk
F interaction force, N
-1-
Chapter 1
Introduction
Silicate minerals are the most abundant rock-forming minerals on earth. The
phyllosilicates (sheet silicates), as an important class of valuable industrial minerals,
play an essential role in many disciplines such as biotechnology, paper making,
cosmetics, food processing, tailings management, and processing and utilization of
natural resources.
To fundamentally understand the colloidal behaviour of phyllosilicate minerals, it
is necessary to study the surface properties of phyllosilicates under various
physicochemical conditions of practical relevance. During the past decades, many
efforts have been devoted to understanding surface properties of phyllosilicates in
relation to their mineral processing. However, due to their small sizes and distinct
anisotropic surface character, some of crucial surface properties of phyllosilicates,
especially in terms of specific faces, remain unclear.
1.1 Mineralogy of phyllosilicates
The principal structural elements of phyllosilicate are tetrahedral sheet (T) and
octahedral sheet (O). T is composed of silicon-oxygen tetrahedron linked to the
neighboring tetrahedron by sharing three corners to form a hexagonal network
while the fourth corner of each tetrahedron (the apical oxygen) points into and
forms part of the adjacent octahedral sheet. O is in the sixfold coordination with
oxygens from the tetrahedral sheet and hydroxyl group while individual octahedral
is linked laterally by sharing edges.
Chapter 1 -2-
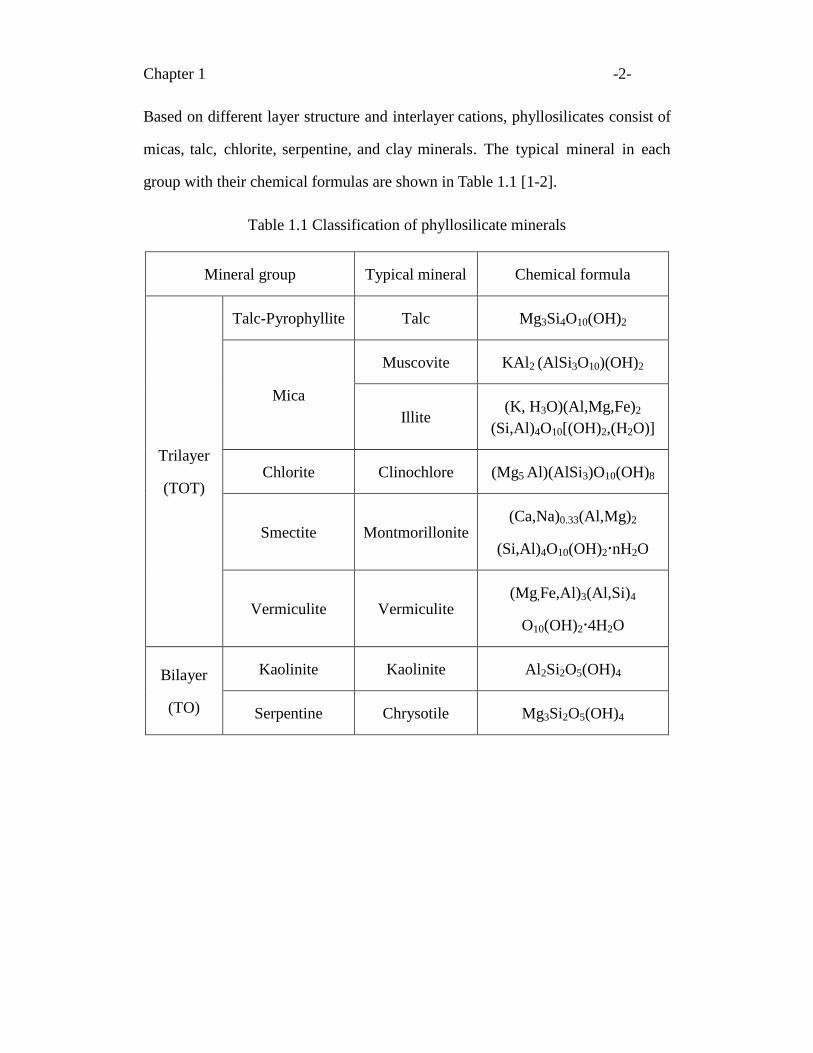
Based on different layer structure and interlayer cations, phyllosilicates consist of
micas, talc, chlorite, serpentine, and clay minerals. The typical mineral in each
group with their chemical formulas are shown in Table 1.1 [1-2].
Table 1.1 Classification of phyllosilicate minerals
Mineral group Typical mineral Chemical formula
Trilayer
(TOT)
Talc-Pyrophyllite Talc Mg3Si4O10(OH)2
Mica
Muscovite KAl2 (AlSi3O10)(OH)2
Illite (K, H3O)(Al,Mg,Fe)2
(Si,Al)4O10[(OH)2,(H2O)]
Chlorite Clinochlore (Mg5 Al)(AlSi3)O10(OH)8
Smectite Montmorillonite (Ca,Na)0.33(Al,Mg)2
(Si,Al)4O10(OH)2nH2O
Vermiculite Vermiculite (Mg,Fe,Al)3(Al,Si)4
O10(OH)24H2O
Bilayer
(TO)
Kaolinite Kaolinite Al2Si2O5(OH)4
Serpentine Chrysotile Mg3Si2O5(OH)4
Chapter 1 -3-
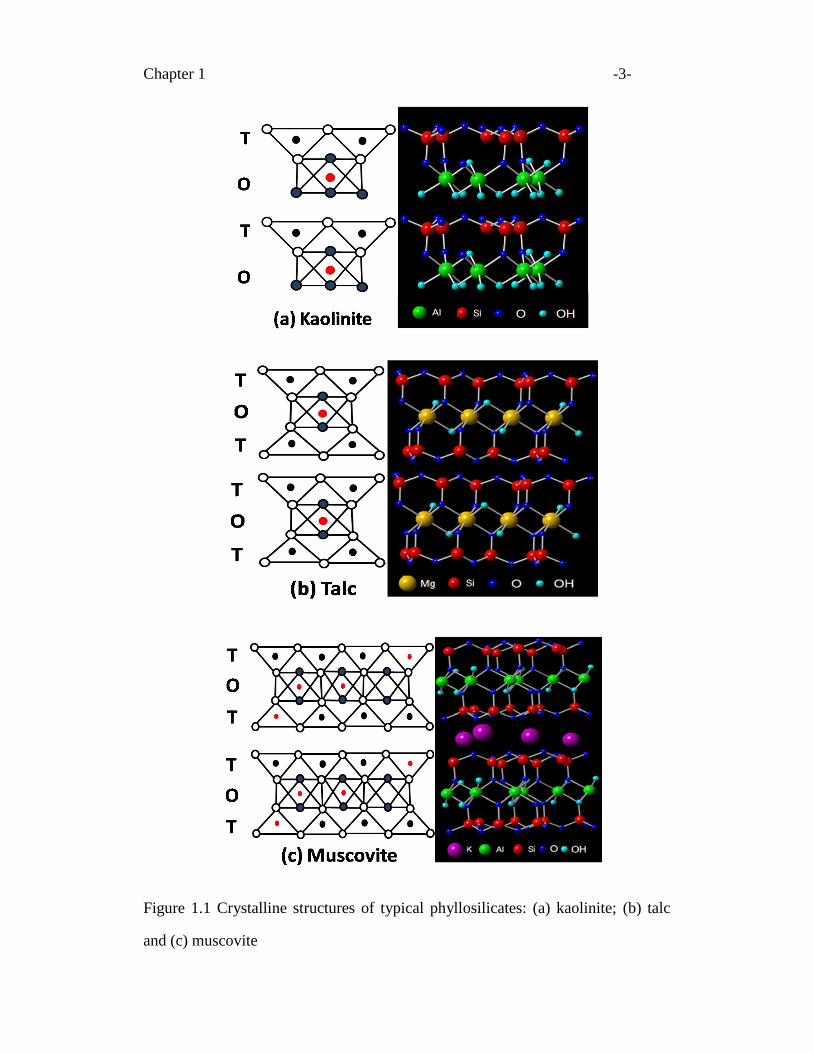
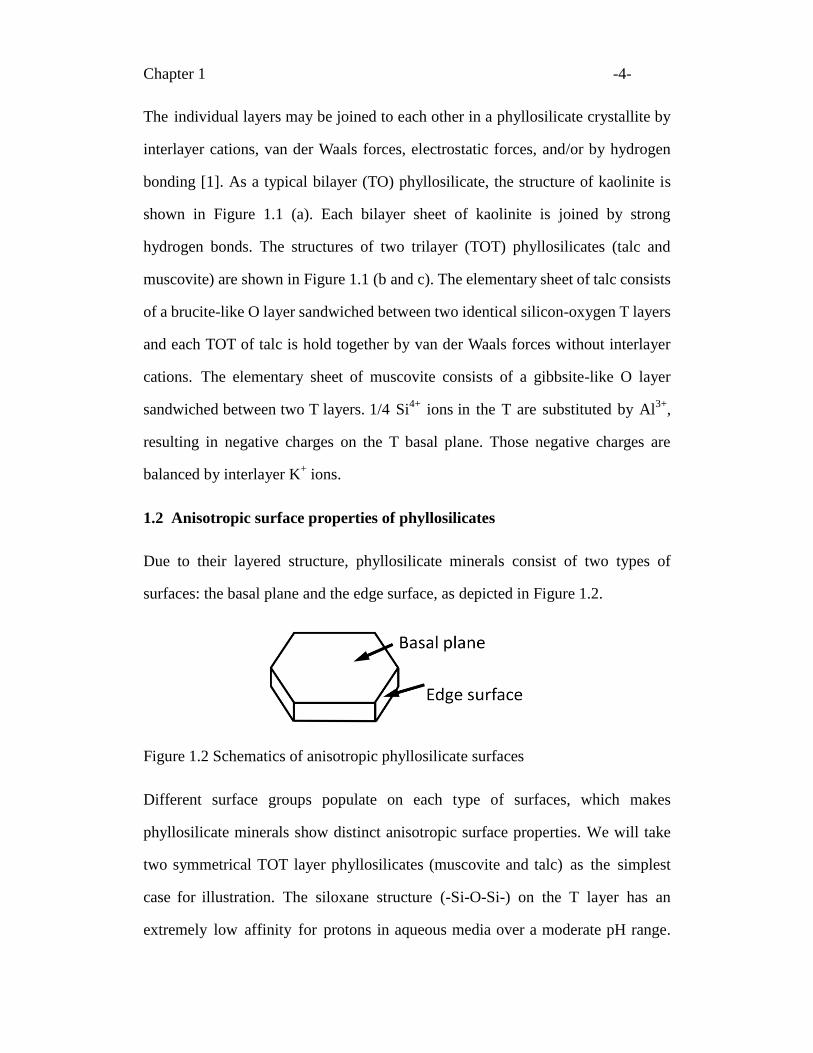
Figure 1.1 Crystalline structures of typical phyllosilicates: (a) kaolinite; (b) talc
and (c) muscovite
Chapter 1 -4-
The individual layers may be joined to each other in a phyllosilicate crystallite by
interlayer cations, van der Waals forces, electrostatic forces, and/or by hydrogen
bonding [1]. As a typical bilayer (TO) phyllosilicate, the structure of kaolinite is
shown in Figure 1.1 (a). Each bilayer sheet of kaolinite is joined by strong
hydrogen bonds. The structures of two trilayer (TOT) phyllosilicates (talc and
muscovite) are shown in Figure 1.1 (b and c). The elementary sheet of talc consists
of a brucite-like O layer sandwiched between two identical silicon-oxygen T layers
and each TOT of talc is hold together by van der Waals forces without interlayer
cations. The elementary sheet of muscovite consists of a gibbsite-like O layer
sandwiched between two T layers. 1/4 Si4+
ions in the T are substituted by Al3+
,
resulting in negative charges on the T basal plane. Those negative charges are
balanced by interlayer K+ ions.
1.2 Anisotropic surface properties of phyllosilicates
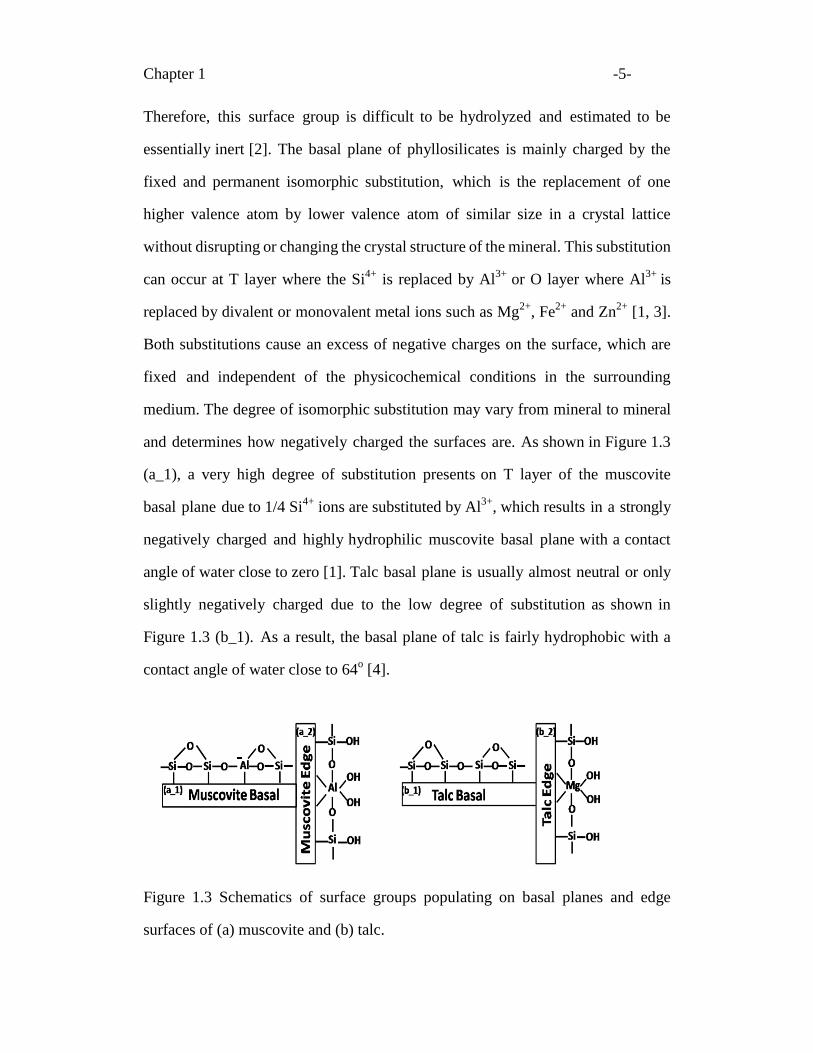
Due to their layered structure, phyllosilicate minerals consist of two types of
surfaces: the basal plane and the edge surface, as depicted in Figure 1.2.
Figure 1.2 Schematics of anisotropic phyllosilicate surfaces
Different surface groups populate on each type of surfaces, which makes
phyllosilicate minerals show distinct anisotropic surface properties. We will take
two symmetrical TOT layer phyllosilicates (muscovite and talc) as the simplest
case for illustration. The siloxane structure (-Si-O-Si-) on the T layer has an
extremely low affinity for protons in aqueous media over a moderate pH range.
Chapter 1 -5-
Therefore, this surface group is difficult to be hydrolyzed and estimated to be
essentially inert [2]. The basal plane of phyllosilicates is mainly charged by the
fixed and permanent isomorphic substitution, which is the replacement of one
higher valence atom by lower valence atom of similar size in a crystal lattice
without disrupting or changing the crystal structure of the mineral. This substitution
can occur at T layer where the Si4+
is replaced by Al3+
or O layer where Al3+
is
replaced by divalent or monovalent metal ions such as Mg2+
, Fe2+
and Zn2+
[1, 3].
Both substitutions cause an excess of negative charges on the surface, which are
fixed and independent of the physicochemical conditions in the surrounding
medium. The degree of isomorphic substitution may vary from mineral to mineral
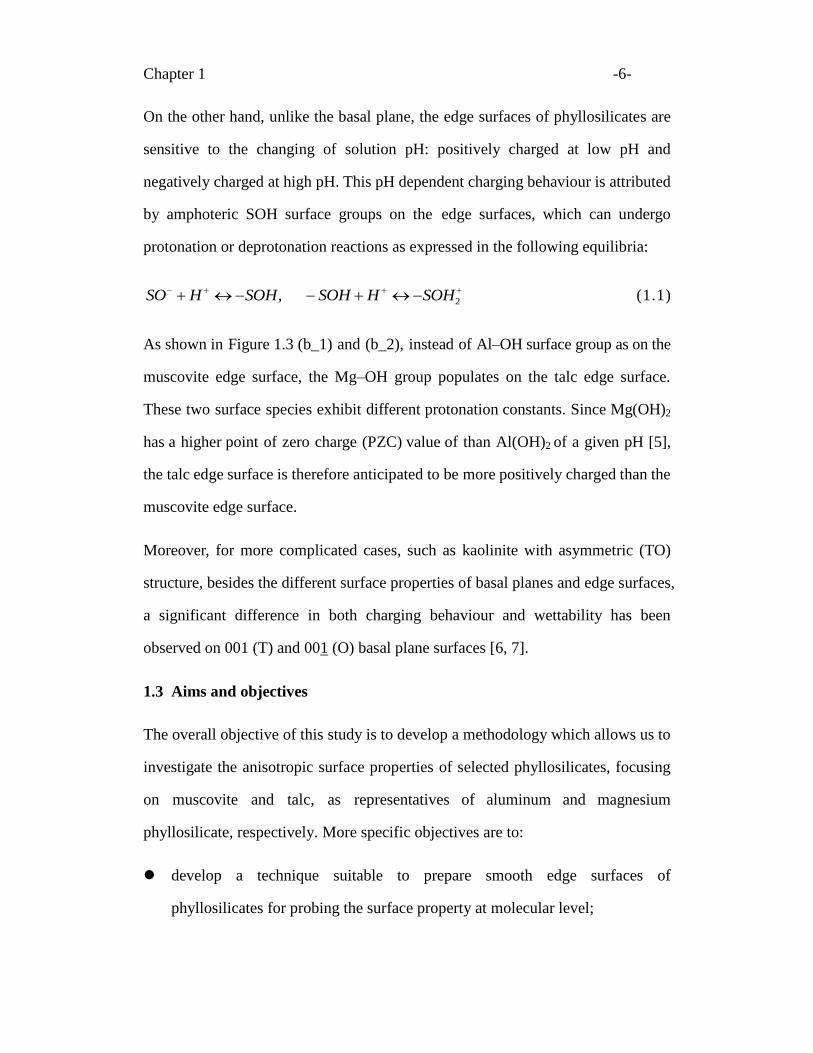
and determines how negatively charged the surfaces are. As shown in Figure 1.3
(a_1), a very high degree of substitution presents on T layer of the muscovite
basal plane due to 1/4 Si4+
ions are substituted by Al3+
, which results in a strongly
negatively charged and highly hydrophilic muscovite basal plane with a contact
angle of water close to zero [1]. Talc basal plane is usually almost neutral or only
slightly negatively charged due to the low degree of substitution as shown in
Figure 1.3 (b_1). As a result, the basal plane of talc is fairly hydrophobic with a
contact angle of water close to 64o [4].
Figure 1.3 Schematics of surface groups populating on basal planes and edge
surfaces of (a) muscovite and (b) talc.
Chapter 1 -6-
On the other hand, unlike the basal plane, the edge surfaces of phyllosilicates are
sensitive to the changing of solution pH: positively charged at low pH and
negatively charged at high pH. This pH dependent charging behaviour is attributed
by amphoteric SOH surface groups on the edge surfaces, which can undergo
protonation or deprotonation reactions as expressed in the following equilibria:
2, SOHHSOHSOHHSO (1.1)
As shown in Figure 1.3 (b_1) and (b_2), instead of Al–OH surface group as on the
muscovite edge surface, the Mg–OH group populates on the talc edge surface.
These two surface species exhibit different protonation constants. Since Mg(OH)2
has a higher point of zero charge (PZC) value of than Al(OH)2 of a given pH [5],
the talc edge surface is therefore anticipated to be more positively charged than the
muscovite edge surface.
Moreover, for more complicated cases, such as kaolinite with asymmetric (TO)
structure, besides the different surface properties of basal planes and edge surfaces,
a significant difference in both charging behaviour and wettability has been
observed on 001 (T) and 001 (O) basal plane surfaces [6, 7].
1.3 Aims and objectives
The overall objective of this study is to develop a methodology which allows us to
investigate the anisotropic surface properties of selected phyllosilicates, focusing
on muscovite and talc, as representatives of aluminum and magnesium
phyllosilicate, respectively. More specific objectives are to:
develop a technique suitable to prepare smooth edge surfaces of
phyllosilicates for probing the surface property at molecular level;
Chapter 1 -7-
directly measure the colloidal interaction forces between the probe and basal
or edge surfaces of different phyllosilicates using atomic force microscopy
(AFM);
quantitatively evaluate surface charge characteristics of phyllosilicate basal
planes and edge surfaces by developing a suitable model to fit the measured
interaction forces to theory at different boundary conditions (BC);
investigate the effect of water chemistry of solutions, including pH and
divalent cation concentration on the surface charging behaviour of different
phyllosilicates basal planes and edge surfaces;
predict the interaction energies for various associations between different
phyllosilicate surfaces based on the AFM derived electrical surface (Stern)
potential of each surface and to interpret the rheology properties of
phyllosilicate mineral suspensions;
It is expected that this fundamental research on anisotropic surface properties of
phyllosilicates will provide a basis for understanding their colloidal behaviour in
mineral processing.
1.4 Organization of the dissertation
The next chapter (Chapter 2) includes a literature review on background and
recent research reported in literature on anisotropic surface charge properties of
phyllosilicates. The first part concentrates on reviewing theories and governing
equations of interactions in colloidal systems, including classical DLVO
(Derjaguin -Landau-Verwey - Overbeek) theory, the origin and quantitative
expressions of colloidal interactions. The second part focuses on reviewing the
previous published work on anisotropic surface charge properties of
Chapter 1 -8-
phyllosilicates, based on analytical techniques such as electrophoresis, titration,
sum frequency generation (SFG) spectroscopy and AFM.
Chapter 3 gives a description on materials and principal methods used during this
study. The method to prepare sufficiently smooth edge surfaces of phyllosilicates
employing ultramicrotome cutting technique is introduced. As a predominantly
adopted experimental technique to investigate the surface property of
phyllosilicate surfaces in this study, AFM is introduced in detail in the context of
its principles and major functions. The theoretical model developed for
interpreting the measured interaction force profiles to surface (Stern) potential of
phyllosilicate surfaces is presented as well.
In Chapter 4, followed the methodology presented in Chapter 3, a systematic study
on the effect of solution pH on the interaction forces between AFM tip and different
phyllosilicate surfaces is discussed. The colloidal forces between the silicon nitride
tip and basal planes or edge surfaces are measured using an AFM in simple
electrolyte (1 mM KCl) solutions as a function of pH. The Stern potential of the
basal planes and edge surfaces in each case is obtained by fitting the measured force
profiles with the classical DLVO theory.
Chapter 5 presents a systematic study on the interaction of divalent cations, both
Ca2+
and Mg2+
with basal planes and edge surfaces of phyllosilicate minerals. The
colloidal interaction forces between AFM tip and basal planes or edge surfaces are
measured using AFM in simple electrolyte (1 mM KCl) solutions of pH 8.5 as a
function of divalent cation concentrations. The Stern potential of the basal plane
and edge surface in each case is obtained by fitting the measured force profiles with
the classical DLVO theory.
Chapter 1 -9-
In Chapter 6, interaction energies of various associations between anisotropic talc
surfaces are calculated using AFM-derived Stern potential values of talc basal
planes and edge surfaces. The different interactions between talc basal planes and
edge surfaces are discussed in the context of understanding rheological behaviour
of talc suspensions.
Chapter 7 presents some preliminary results on polymer adsorption on different
talc surfaces.
Chapter 8 summaries the work presented in the dissertation and gives suggestions
of future work.
Chapter 1 -10-
1.5 References
[1] Bergaya, F., Theng, B. K. G., Lagaly, G., 2006, "Handbook of Clay Science,"
Elsevier, Amsterdam, London.
[2] Bleam, W., Welhouse, G., Janowiak, M., 1993, "The Surface Coulomb Energy
and Proton Coulomb Potentials of Pyrophyllite (010), (110), (100), and (130)
Edges," Clays and Clay Minerals, 41(3) pp. 305-316.
[3] Van Olphen, H., 1963, "An Introduction to Clay Colloid Chemistry, for Clay
Technologists, Geologists, and Soil Scientists," Interscience Publishers, New
York.
[4] Nalaskowski, J., Abdul, B., Du, H., Miller, J. D., 2007, "Anisotropic Character
of Talc Surfaces as Revealed by Streaming Potential Measurements, Atomic
Force Microscopy, Molecular Dynamics Simulations and Contact Angle
Measurements," Canadian Metallurgical Quarterly, 46(3) pp. 227-235.
[5] Parks, G. A., 1965, "The Isoelectric Points of Solid Oxides, Solid Hydroxides,
and Aqueous Hydroxo Complex Systems," Chemical Reviews, 65(2) pp.
177-198.
[6] Gupta, V., Miller, J. D., 2010, "Surface Force Measurements at the Basal
Planes of Ordered Kaolinite Particles," Journal of Colloid and Interface
Science, 344(2) pp. 362-371.
[7] Yin, X., Gupta, V., Du, H., Miller, J. D., 2012, "Surface Charge and Wetting
Characteristics of Layered Silicate Minerals," Advances in Colloid and
Interface Science, 179-182 pp. 43-50.
-11-
Chapter 2
Literature review
The surface properties of phyllosilicates are very important in minerals processing.
For instance, the electrical surface charges of phyllosilicate can significantly
influence the separation efficiency in mineral flotation. In this chapter, the
background of fundamental colloidal interaction principles and their respective
governing equations related to this dissertation work are introduced first, followed
by a review on recent study on phyllosilicate minerals with regard to their surface
charge characteristics.
2.1 Interactions between two surfaces
The stability of fine-grained mineral suspensions is determined largely by the
colloidal interactions between mineral particles. The long range colloidal force is
in control when two surfaces approaching each other while the adhesive force
(pull off force) corresponds to the strength where the two surfaces are attached to
each other.
2.1.1 DLVO theory
The overall interaction ( TotalU ) between two macroscopic bodies is usually
determined in terms of interaction free energies. In classical DLVO theory, the
fundamental colloidal interactions consist of two terms: the van der Waals ( VDWU )
interactions and the electrostatic double layer ( EDLU ) interaction as [1]:
EDLVDWTotal UUU (2.1)
Chapter 2 -12-
2.1.2 Van der Waals interactions
The molecular van der Waals (VDW) interactions which exist between any
surfaces in any medium are the combination of three long range interaction terms:
dispersion (London) between two induced dipoles created by fluctuation of
electronic charges, orientation (Keesom) between two permanent dipoles and
induction (Debye) between a permanent dipole and an induced dipole. These three
interaction energies are all decaying with distance between two surfaces. The
VDW interaction energy per unit area between two parallel surfaces at separation
distance D, VDWU
can be calculated by [1, 2]:
212 D
AU H
VDW
(2.2)
The characteristic constant HA , also known as the Hamaker constant, can be
calculated from the dielectric properties of interacting surfaces and the intervening
medium. In the macroscopic method, AH can be determined by non-retarded
Lifshitz formula for material 1 interacting with material 2 across medium 3 as [3]:
)(28
3
4
32
3
2
2
2
3
2
1
2
3
2
2
2
3
2
1
2
3
2
2
2
3
2
1
32
32
31
31
nnnnnnnn
nnnnhVTkA e
BH
(2.3)
where i and ni are the static dielectric constant and the refractive index for
materials i, respectively. h is Planck's constant and Ve is the main electronic
absorption frequency in the UV region.
2.1.3 Electrostatic double layer interaction
When a surface is immersed in an electrolyte solution, it usually can be charged
by various charging mechanisms such as ionization or dissociation of surface
functional groups, isomorphic substitution, or specific adsorption. Taking
muscovite as an example, as mentioned in Chapter 1, the basal plane of muscovite
Chapter 2 -13-
is highly negatively charged due to 1/4 Si4+
ions in the T are substituted by Al3+
.
On the other hand, the charges of the edge surface can be attributed by the
amphoteric Si-OH or Al-OH surface groups on the surface, which can take up a
proton to be positively charged or release a proton to be negatively charged.
In the solution, a negatively charged surface is balanced by positively charged
counterions and can influence the ion distribution close to it to form a double
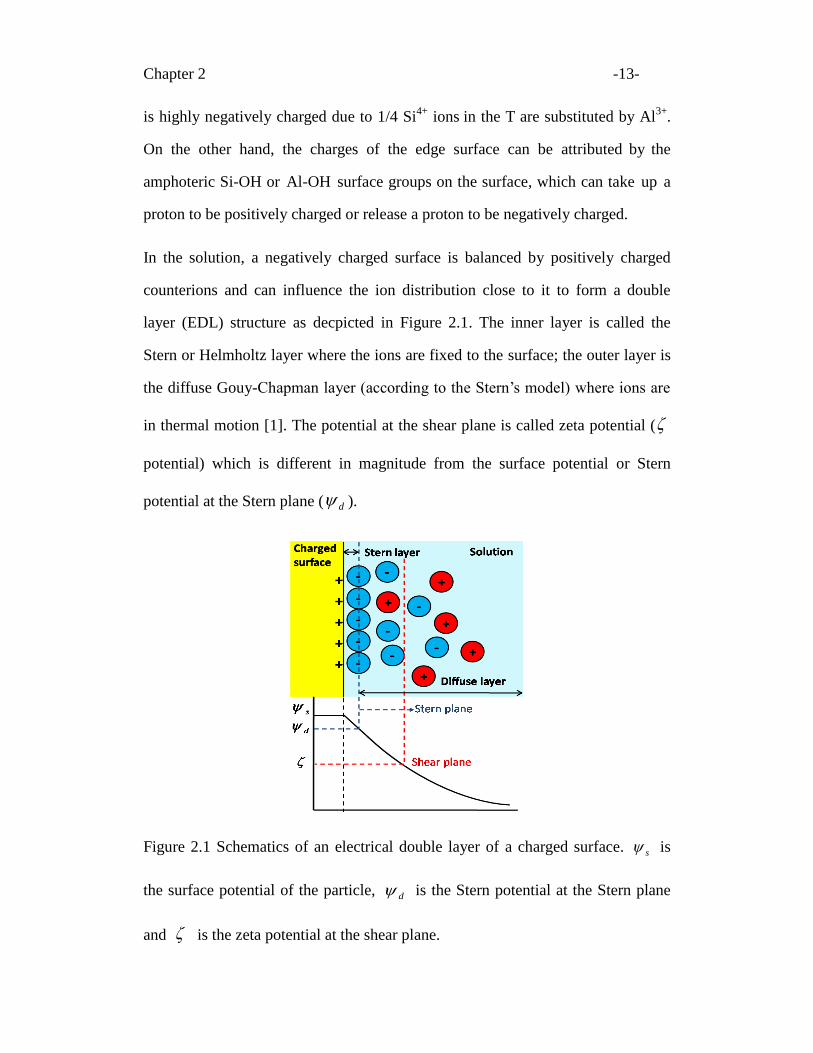
layer (EDL) structure as decpicted in Figure 2.1. The inner layer is called the
Stern or Helmholtz layer where the ions are fixed to the surface; the outer layer is
the diffuse Gouy-Chapman layer (according to the Stern’s model) where ions are
in thermal motion [1]. The potential at the shear plane is called zeta potential (
potential) which is different in magnitude from the surface potential or Stern
potential at the Stern plane ( d ).
Figure 2.1 Schematics of an electrical double layer of a charged surface. s is
the surface potential of the particle, d is the Stern potential at the Stern plane
and is the zeta potential at the shear plane.
Chapter 2 -14-
The distribution of electrolyte ions in the diffuse layer obeys Boltzmann’s
distribution [1]:
Tk
eznn
B
iii
exp (2.4)
where in is the number density of ith ions with valence iz , in is the number
density of ith ions in the bulk, is the potential in the EDL, e is the electron
charge, Bk is the Boltzmann constant (1.38 × 10⁻²³
J/K) and T is the absolute
temperature in Kelvin.
Combining this ion distribution equation (2.4) with the expression of the surface
potentials of the electric field originally derived from Maxwell’s equation, we can
obtain so-called Poisson-Boltzmann (PB) equation:
i B
iii
Tk
eznze
exp2
0 (2.5)
where and 0 are relative permittivity of the medium and the permittivity of
vacuum, respectively.
If the potential is small ( 1Tk
ez
B
i ), we can assumeTk
ez
Tk
ez
B
i
B
i
sinh ,
therefore, the non-linear PB equation can be simplified to linearized PB equation
which is generally referred to as the Debye-Hückel approximation:
22 (2.6)
where
2/1
22
01
i
ii
B
zen
Tk (2.7)
Chapter 2 -15-
The 1 , known as the Debye length, is a characteristic parameter describing the
thickness of the EDL or decay of the electric potential.
When two charged surfaces approach each other, the EDL surrounding each
surface starts to overlap which induces the osmotic pressure between two surfaces.
The interaction energy )(DUEDL or force )(DFEDL between two parallel surfaces
at separation distance D can be expressed by [1]:
dhhFDUD
EDLEDL )()( per unit area (2.8)
2
0
21exp)(
dx
d
Tk
eznTkDF
B
i
i
iBEDL
per unit area (2.9)
In general, surface potential profile, interaction energy and force can be obtained
by numerical solution of Equations (2.8) and (2.9) with proper BC.
The selection of BC for the numerical solution depends on charging mechanism of
each interacting surface. For example, if the surface charge arises from
irreversible adsorption of charged species, dissociation of strong acid/base surface
groups or lattice imperfections (such as the isomorphic substitution in
phyllosilicates), the surface charge density is independent of the surface potential
and the separation distance between two interacting surfaces. In this case, the
constant surface charge density BC is more appropriate as the
potential-determining ions do not have sufficient time to re-arrange during
approaching of two surfaces [4]. On the other hand, if the surface charge arises
from reversible ion adsorption, the potential determining ions are able to
re-arrange quickly to suit every configuration of interacting surfaces. Therefore,
the surface potentials would remain constant when two surfaces approach each
other at a slow rate [5]. In this case, the constant surface potential BC is more
Chapter 2 -16-
appropriate. However, in reality, the surface charge density of ionizable surface is
a function of separation distance as the two interacting surfaces approach each
other. The assumption of constant charge density and constant surface potential
BC constitutes the upper and lower limits of the interaction, respectively.
Therefore, a realistic description of the interaction would fall in between these
two limits.
2.1.4 Derjaguin approximation
Theoretically, due to its simple geometry, the interaction between two
semi-infinite parallel flat surfaces is evaluated in terms of interaction energy using
above given equations. However, the actual measurements of interaction forces
are conducted with a given geometry other than two semi-infinite parallel plates.
Therefore, the influence of geometry on the interaction energy is derived by
Dejaguin approximation (DA), which scales the two flat-plates interaction energy
per unit area to the corresponding interaction energy between two curved surfaces.
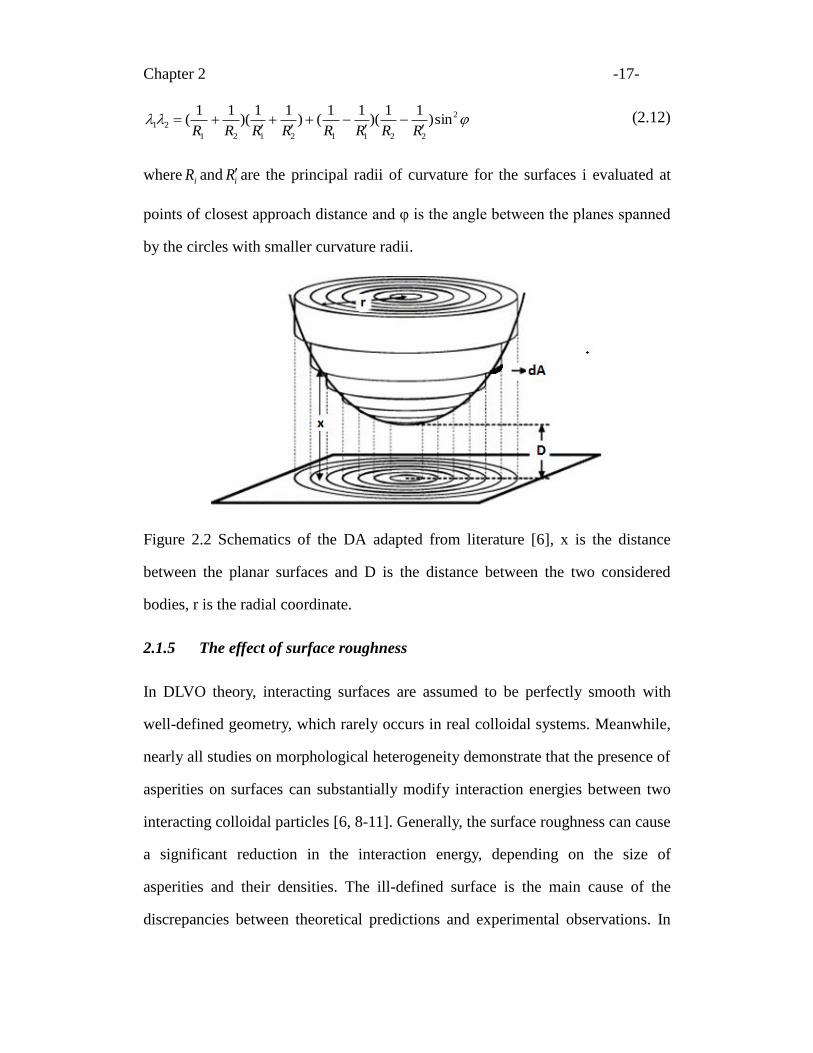
As shown in Figure 2.2, the interaction energy per unit area between two bodies
of arbitrary shape U (D) at a distance D (distance of closest approach between two
surfaces) can be related to the interaction energy UA (x) between two planar plates
which separated by a gap x by equation [6]:
dAxUDU A )()( (2.10)
where dA is the variation of the cross-section area of two real surfaces with
increasing separation, and the integration runs over entire cross-sectional area.
White [7] generalized the expression of DA to:
dxxUDUD
)(2
)(21
(2.11)
Chapter 2 -17-
2
22112121
21 sin)11
)(11
()11
)(11
(RRRRRRRR
(2.12)
where iR and iRare the principal radii of curvature for the surfaces i evaluated at
points of closest approach distance and φ is the angle between the planes spanned
by the circles with smaller curvature radii.
Figure 2.2 Schematics of the DA adapted from literature [6], x is the distance
between the planar surfaces and D is the distance between the two considered
bodies, r is the radial coordinate.
2.1.5 The effect of surface roughness
In DLVO theory, interacting surfaces are assumed to be perfectly smooth with
well-defined geometry, which rarely occurs in real colloidal systems. Meanwhile,
nearly all studies on morphological heterogeneity demonstrate that the presence of
asperities on surfaces can substantially modify interaction energies between two
interacting colloidal particles [6, 8-11]. Generally, the surface roughness can cause
a significant reduction in the interaction energy, depending on the size of
asperities and their densities. The ill-defined surface is the main cause of the
discrepancies between theoretical predictions and experimental observations. In
Chapter 2 -18-
order to avoid the erroneous interpretation from the theory, many efforts have
been made to develop some calculation models to incorporate the effect of surface
roughness in the calculation of the interaction energy between rough surfaces [6,
8-11].
A common approach for modeling roughness involves random placement of
geometrically regular asperities on a smooth surface [8, 11]. Recently surface
element integration (SEI) method was developed as an extension of DA to apply to
the exact geometry of interacting surfaces [1, 9-12]. By dividing the interacting
surface into numerous small elements, SEI computes the total interaction energy
between two bodies by numerically integrating the interaction energy per unit area
between opposing differential planar elements over the entire surfaces as [1]:
dAkn
kn
A
HUDU
A
p
)()( (2.13)
where AHU p /)( is the interaction energy per unit area between two bodies, A is
the projected area of the body normal to the line of closest distance between the
bodies. knkn / provides a measure of the angle made by the curved surface of
the body with the projected normal area A, which is assumed a value of 1 or -1,
depending on whether the surfaces of the bodies face each other or they face away
from each other.
In this manner, the interaction energy is evaluated in conjunction with realistic
geometrical models of surface roughness. Let us takes the application of SEI
method to AFM colloidal probe technique as an example [12], which is one of
most frequently used methods to probe interactions between two surfaces. As
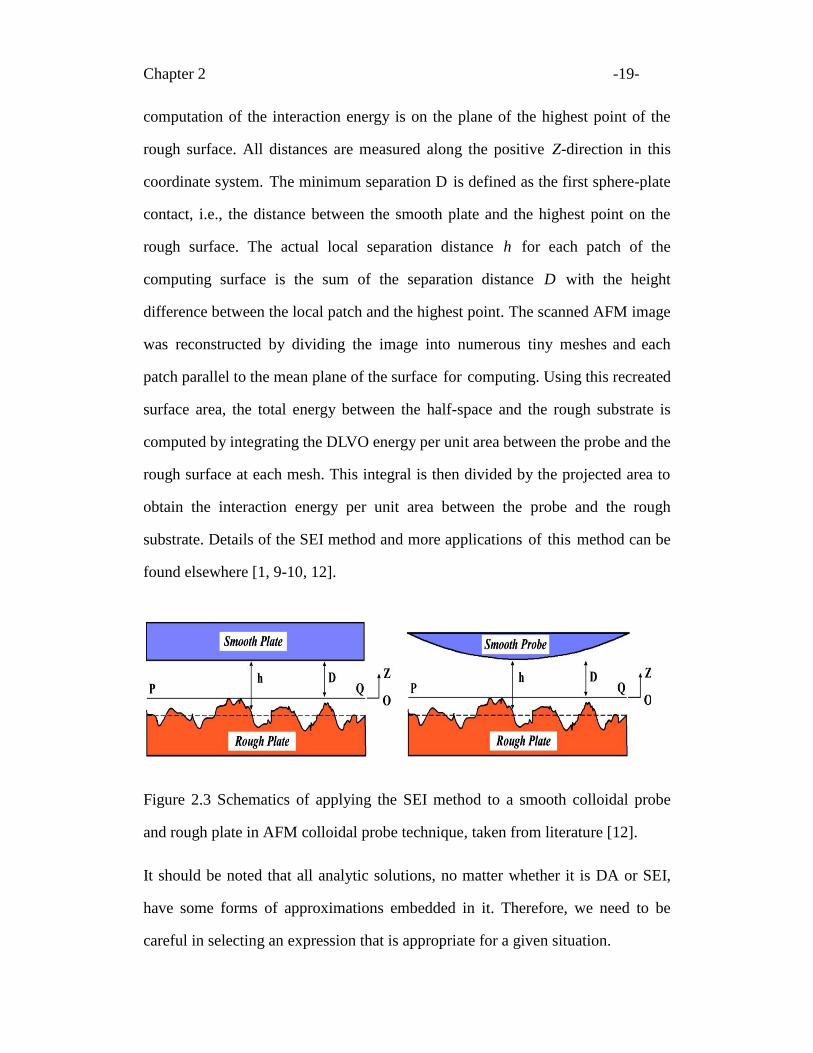
depicted in Figure 2.3, the origin of the coordinate system (O) used for
Chapter 2 -19-
computation of the interaction energy is on the plane of the highest point of the
rough surface. All distances are measured along the positive Z-direction in this
coordinate system. The minimum separation D is defined as the first sphere-plate
contact, i.e., the distance between the smooth plate and the highest point on the
rough surface. The actual local separation distance h for each patch of the
computing surface is the sum of the separation distance D with the height
difference between the local patch and the highest point. The scanned AFM image
was reconstructed by dividing the image into numerous tiny meshes and each
patch parallel to the mean plane of the surface for computing. Using this recreated
surface area, the total energy between the half-space and the rough substrate is
computed by integrating the DLVO energy per unit area between the probe and the
rough surface at each mesh. This integral is then divided by the projected area to
obtain the interaction energy per unit area between the probe and the rough
substrate. Details of the SEI method and more applications of this method can be
found elsewhere [1, 9-10, 12].
Figure 2.3 Schematics of applying the SEI method to a smooth colloidal probe
and rough plate in AFM colloidal probe technique, taken from literature [12].
It should be noted that all analytic solutions, no matter whether it is DA or SEI,
have some forms of approximations embedded in it. Therefore, we need to be
careful in selecting an expression that is appropriate for a given situation.
Chapter 2 -20-
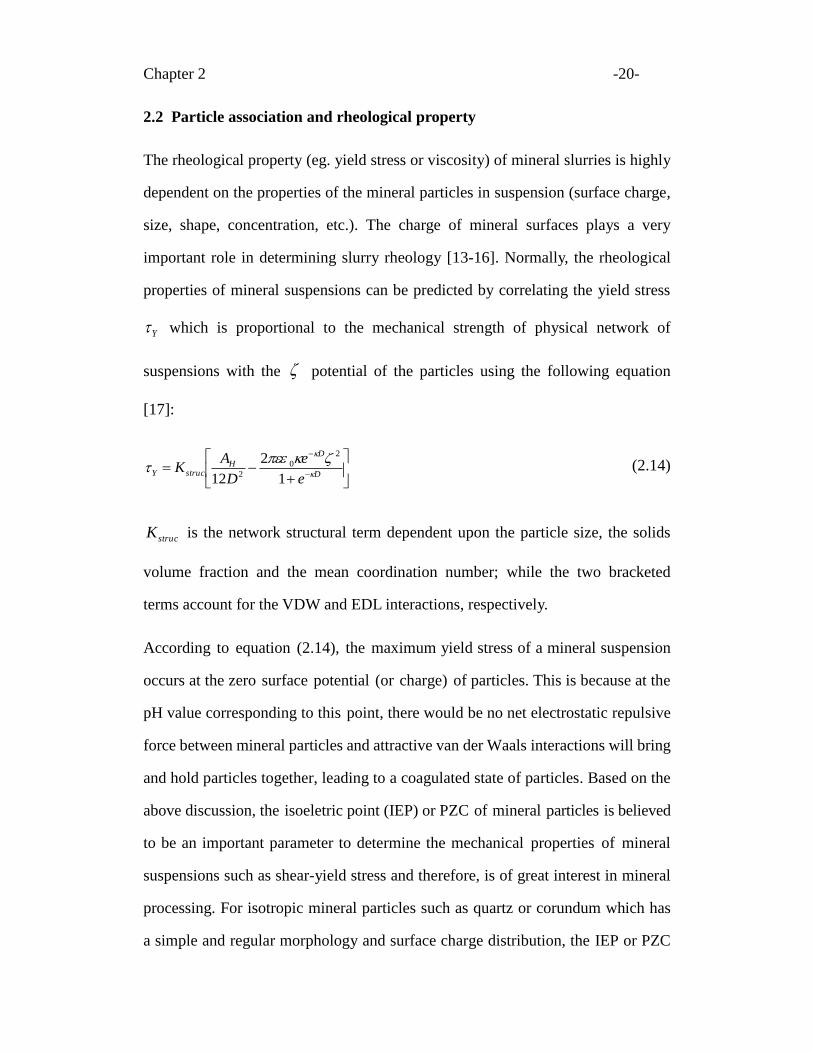
2.2 Particle association and rheological property
The rheological property (eg. yield stress or viscosity) of mineral slurries is highly
dependent on the properties of the mineral particles in suspension (surface charge,
size, shape, concentration, etc.). The charge of mineral surfaces plays a very
important role in determining slurry rheology [13-16]. Normally, the rheological
properties of mineral suspensions can be predicted by correlating the yield stress
Y which is proportional to the mechanical strength of physical network of
suspensions with the potential of the particles using the following equation
[17]:
D
D
HstrucY
e
e
D
AK
1
2
12
2
0
2 (2.14)
strucK is the network structural term dependent upon the particle size, the solids
volume fraction and the mean coordination number; while the two bracketed
terms account for the VDW and EDL interactions, respectively.
According to equation (2.14), the maximum yield stress of a mineral suspension
occurs at the zero surface potential (or charge) of particles. This is because at the
pH value corresponding to this point, there would be no net electrostatic repulsive
force between mineral particles and attractive van der Waals interactions will bring
and hold particles together, leading to a coagulated state of particles. Based on the
above discussion, the isoeletric point (IEP) or PZC of mineral particles is believed
to be an important parameter to determine the mechanical properties of mineral
suspensions such as shear-yield stress and therefore, is of great interest in mineral
processing. For isotropic mineral particles such as quartz or corundum which has
a simple and regular morphology and surface charge distribution, the IEP or PZC
Chapter 2 -21-
across the entire surface of particle is almost identical and occur at the same value.
As a result, these values predict to the maximum yield stress of mineral
suspensions quiet well as well documented in literature [17, 18]. However, the
rheological properties of phyllosilicate minerals are hard to be correlated to their
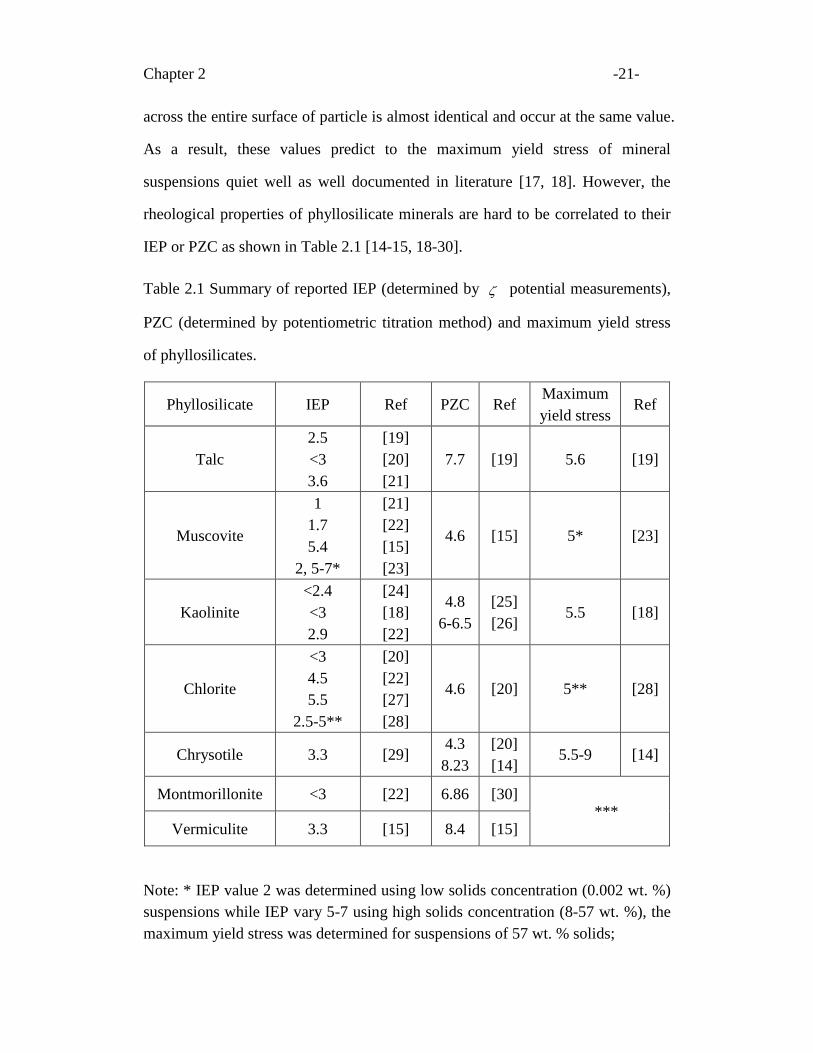
IEP or PZC as shown in Table 2.1 [14-15, 18-30].
Table 2.1 Summary of reported IEP (determined by potential measurements),
PZC (determined by potentiometric titration method) and maximum yield stress
of phyllosilicates.
Phyllosilicate IEP Ref PZC Ref Maximum
yield stress Ref
Talc
2.5
<3
3.6
[19]
[20]
[21]
7.7 [19] 5.6 [19]
Muscovite
1
1.7
5.4
2, 5-7*
[21]
[22]
[15]
[23]
4.6 [15] 5* [23]
Kaolinite
<2.4
<3
2.9
[24]
[18]
[22]
4.8
6-6.5
[25]
[26] 5.5 [18]
Chlorite
<3
4.5
5.5
2.5-5**
[20]
[22]
[27]
[28]
4.6 [20] 5** [28]
Chrysotile 3.3 [29] 4.3
8.23
[20]
[14] 5.5-9 [14]
Montmorillonite <3 [22] 6.86 [30] ***
Vermiculite 3.3 [15] 8.4 [15]
Note: * IEP value 2 was determined using low solids concentration (0.002 wt. %)
suspensions while IEP vary 5-7 using high solids concentration (8-57 wt. %), the
maximum yield stress was determined for suspensions of 57 wt. % solids;
Chapter 2 -22-
**: IEP value 2.5 for low solids concentration 0.05 wt.%, 5 for high solids
concentration 8-57 wt.%, the maximum yield stress was determined for
suspension of 57 wt.% solids;
***: For swelling phyllosilicates (smecite or vermiculite), the hydration also plays
a dominant role in rheology performance. These two groups usually have
relatively low yield stresses as the particles absorb water; therefore, their yield
stress data are not included and discussed here.
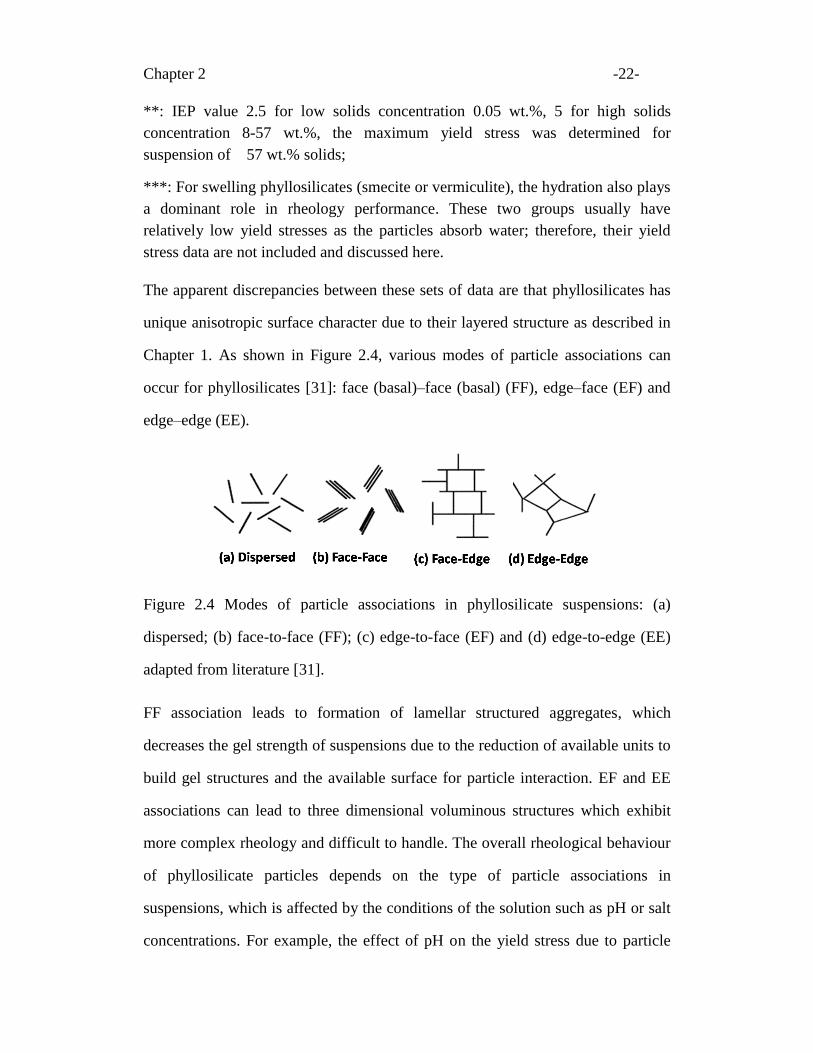
The apparent discrepancies between these sets of data are that phyllosilicates has
unique anisotropic surface character due to their layered structure as described in
Chapter 1. As shown in Figure 2.4, various modes of particle associations can
occur for phyllosilicates [31]: face (basal)–face (basal) (FF), edge–face (EF) and
edge–edge (EE).
Figure 2.4 Modes of particle associations in phyllosilicate suspensions: (a)
dispersed; (b) face-to-face (FF); (c) edge-to-face (EF) and (d) edge-to-edge (EE)
adapted from literature [31].
FF association leads to formation of lamellar structured aggregates, which
decreases the gel strength of suspensions due to the reduction of available units to
build gel structures and the available surface for particle interaction. EF and EE
associations can lead to three dimensional voluminous structures which exhibit
more complex rheology and difficult to handle. The overall rheological behaviour
of phyllosilicate particles depends on the type of particle associations in
suspensions, which is affected by the conditions of the solution such as pH or salt
concentrations. For example, the effect of pH on the yield stress due to particle
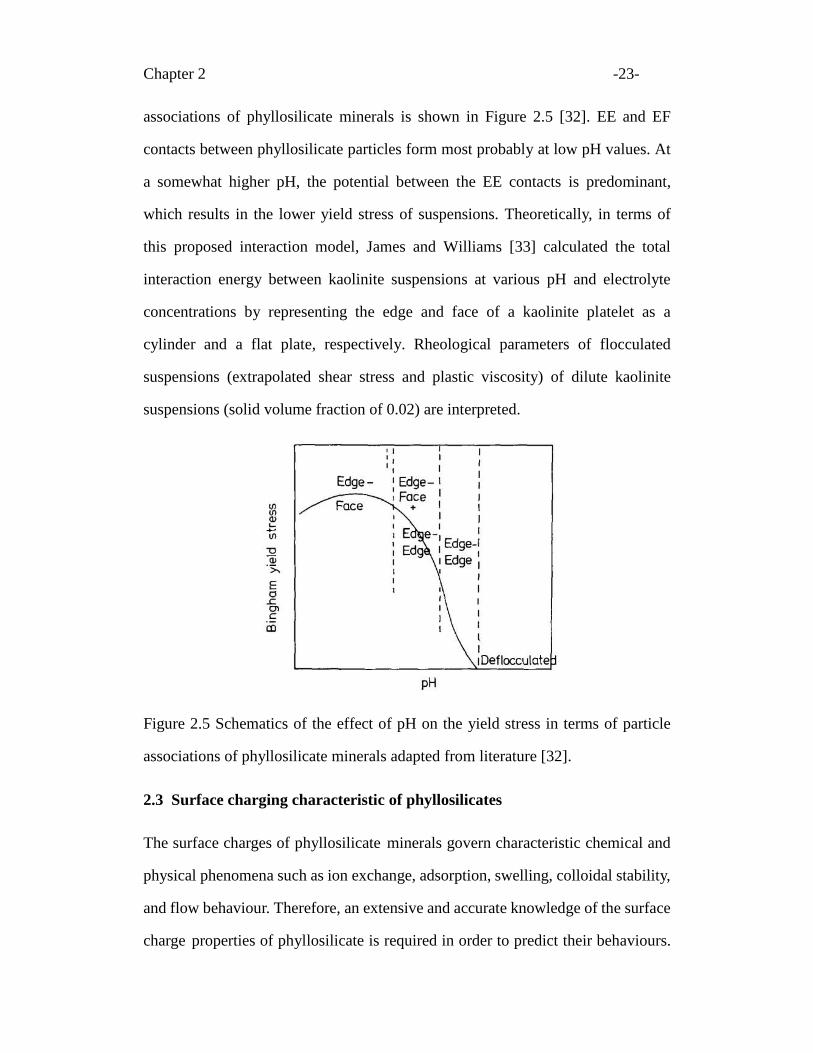
Chapter 2 -23-
associations of phyllosilicate minerals is shown in Figure 2.5 [32]. EE and EF
contacts between phyllosilicate particles form most probably at low pH values. At
a somewhat higher pH, the potential between the EE contacts is predominant,
which results in the lower yield stress of suspensions. Theoretically, in terms of
this proposed interaction model, James and Williams [33] calculated the total
interaction energy between kaolinite suspensions at various pH and electrolyte
concentrations by representing the edge and face of a kaolinite platelet as a
cylinder and a flat plate, respectively. Rheological parameters of flocculated
suspensions (extrapolated shear stress and plastic viscosity) of dilute kaolinite
suspensions (solid volume fraction of 0.02) are interpreted.
Figure 2.5 Schematics of the effect of pH on the yield stress in terms of particle
associations of phyllosilicate minerals adapted from literature [32].
2.3 Surface charging characteristic of phyllosilicates
The surface charges of phyllosilicate minerals govern characteristic chemical and
physical phenomena such as ion exchange, adsorption, swelling, colloidal stability,
and flow behaviour. Therefore, an extensive and accurate knowledge of the surface
charge properties of phyllosilicate is required in order to predict their behaviours.
Chapter 2 -24-
For the past decades, a number of efforts were made to determine or model the
surface charging behaviour of phyllosilicates.
As mentioned in Chapter 1, phyllosilicate minerals exhibit different charge
characteristics on different surfaces, being attributed to different prevailing
charging mechanisms: fixed and permanent isomorphic substitution on basal plane
and hydrolysis reactions of broken primary bonds, mostly on the edge surfaces.
The total surface charge of phyllosilicate particle is a combination of charges from
both basal planes and edge surfaces. The surface charge properties of phyllosilicate
minerals have been extensively investigated using various experimental methods
and modeling. In view of the experimental studies, Zeta potential measurements
and potentiometric titration are two conventional methods extensively used to
investigate the surface charging character of phyllosilicates.
2.3.1 Zeta potential measurement
The zeta potential measurements by electrophoresis are widely used to determine
the electrokinetic potentials of minerals. As already shown in Figure 2.1, the
potential of particles is the electrical potential at the shear plane when the particles
are moving in an aqueous solution under the influence of a given electric field. In
electrophoresis method, the electrophoretic mobility of dilute suspensions is
measured, which is then converted to potential values by mathematical
models. The pH where the potential is zero refers to the IEP.
In early years, Parks compiled the IEP of most metal oxides and hydroxides,
which has been commonly used as the reference in the later studies of IEP for
many materials [34]. Fuerstenau and Pradip reviewed the study of potential
Chapter 2 -25-
measurements in the context of the flotation of oxide and silicate minerals [21].
By reviewing studies reported in recent years, Kosmulski updated the data not
only on metal oxides and hydroxides but also on lots of pH-dependent charging
materials [22, 35]. He pointed out that many publications clearly indicate that
IEP≠PZC for specific materials other than metal oxides. Compared with the PZC,
IEP values reported for the same materials (corresponding to certain chemical
formula and crystallographic structure) are more consistent, which makes it more
suitable to characterize the pH-dependent surface charges of materials.
In most conventional methods of electrophoretic measurements, highly dilute
dispersions are required. Recently the dynamic mobility measurement using
electroacoustic method was developed. This method can measure potential of
concentrated dispersions and has been applied to investigating charge
characteristics of the kaolinite and montmorillonite suspensions [17, 36-37]
though the theoretical background is still under development [38].
In all electrokinetic methods, the mathematical models used to convert the
determined electrophoretic mobility of suspensions to potential values of the
surface were derived for spherical or near-spherical particles with a basic
assumption that the charges are uniformly distributed on the particle. Until now,
there is no well developed theory that can properly describe the movement of
platy particles with anisotropic charge characteristics under the influence of a
given electric field. Therefore, in the case of phyllosilicate, interpretation of
colloidal behaviour based on the potential values determined by the exiting
electrophoretic measurements could be misleading.
Chapter 2 -26-
2.3.2 Potentiometric titration
Unlike the electrophoretic method which is affected by the shape of particles,
potentiometric titration method is based on the principle of ion exchange in
solution, which is independent to the shape of particles. Therefore, this method
has been chosen as another main approach to study the electrical surface
properties of minerals, especially the phyllosilicates.
By adding a certain amount of acid or base titrant, the surface charge density
(C/m2) can be calculated, if the surface area A (m
2/litre) is known, by:
OHHCCA
Fba
a (2.15)
where Fa is the Faraday’s constant, Ca and Cb are the amounts of acid and base
titrant added (mol/litre). However, this titration method demands that the surface
area A of the sample to be precisely known, which is highly unlikely in the case of
phyllosilicates [39]. In simplified Mular–Roberts (M–R) method, by adjusting the
ionic strength (given by an indifferent electrolyte), the difference between the
initial and final pH values pH is plotted against the final pH. The PZC is then
referred to the pH point of zero salt effect ( pH is zero). In this manner, PZC of
many phyllosilicates were determined. Duc, et al. [40] reviewed many literature
devoted to probing the acid-base properties of clays by this method. He pointed
out that many technical and theoretical difficulties are still encountered, which
results in highly scattered potentiometric data. Meanwhile, this method cannot
provide a numerical estimate of the magnitude of the surface charge. Also, it
should be noted that the accurate determination of true PZC of minerals by
potentiometric titration method is very much limited to the systems without specific
adsorbing ions in the solution. The potential-determining ions should only be H+
Chapter 2 -27-
and OH-, which induce pH changes. If other ions are also proved to act as pdi in the
system, such as Mg2+
being potential-determining ions in the case of talc, this
method cannot be applied successfully [20].
Moreover, similar to the results from potential measurements, this method can
only give a combination of charges from both the basal planes and edge surfaces of
phyllosilicates, which can vary with the basal/edge ratio of particles. Clearly, a
more thorough understanding of the charging behaviour of specific surface of
phyllosilicate minerals to better investigate their corresponding colloidal
behaviours is needed.
In addition to above two conventional techniques which can only give the average
surface charge characteristics of phyllosilicates, SFG and AFM are used to probe
the surface charging behaviour of minerals at molecular level by fitting the SF
spectral and interaction forces, respectively. By investigating the spectral change
of the interfacial molecular species using SFG or probing interaction forces using
AFM on relatively small sampling area, these two methods provide the possibility
to examine the individual face of phyllosilicate minerals.
2.3.3 Sum frequency generation spectroscopy
Opposed to the titration method, Sum frequency generation (SFG) is independent
of interpreting the electrical potential based on acid-base titration stoichiometry in
electrolyte. In SFG method [41-42], two laser beams at frequencies of 1 and 2
mix at a surface and generate an output beam picked up by a detector with the sum
frequency 21 . One of the laser beams is a visible wavelength laser held
at a constant frequency and the other is a tunable infrared laser. By tuning the IR
beam across a vibrational resonance, the molecules at the interface will interact
with the electric field by generating a new field that oscillates at the sum of the
Chapter 2 -28-
incident frequencies. For example, when protonation/deprotonation reaction
dominates at the surface, the water is dominated by different interfacial water
species such as the tetrahedrally coordinated and weakly bound water molecules.
Their relative intensities of frequency peaks and orientation will be changed as a
function of the solution pH. Therefore, by analyzing SFG results of different water
species at different pH values, the estimation of the PZC can be obtained.
Yeganeh et al. [41] first employed SFG to probe OH stretch vibrations of a typical
water/oxide (alumina) interfaces. This method was chosen as an alternative
method to study the charging behaviour and the PZC of metal oxide and related
minerals. Hopkins [42] reviewed recently reported work on the solid/aqueous
interface using this method, which included the neat non-metal aqueous interfaces,
self-assembled monolayers, surfactants, adsorbates and polymers. Stack et al. [43]
studied the charging behaviour of water/ sapphire interfaces at different pH values.
The edge of sapphire is a sharing AlO6 octahedral structure which is also seen in
many other minerals, especially the mica group. By using this method, the PZC of
the sapphire was found to be around pH 6.3, much lower than the well-reported
PZC at pH 9.
However, as a nascent technique, due to certain limitations, there is still no
common agreement regarding the experimental setup or interpretation of the
results [41-43]. Quiet few studies on investigating surface character of
phyllosilicates using this method were reported [42].
2.3.4 Atomic force microscopy
Atomic force microscopy (AFM) is a well developed technique and widely used
to study the surface properties of phyllosilicates [44-51]. Various phyllosilicate
surfaces such as kaolinite [45], illite [46], talc [47-50] and mica [12, 51] have
Chapter 2 -29-
been studied by AFM using colloid probe technique. In this technique, the
interaction forces between an AFM probe and phyllosilicate surfaces are directly
measured and then fitted with the DLVO theory. By solving equations that
correlate the surface potential with interaction force profiles, the AFM derived
Stern potential can be obtained. As the principal technique used in this study, the
details about the working principles of AFM will be introduced in Chapter 3.
Although AFM method has been well established to study the surface property of
minerals, quiet few studies were reported on using AFM colloid probe technique
to investigate the anisotropic character of specific faces of phyllosilicates. The
biggest challenge of applying this technique to determine the surface charge
characteristics of phyllosilicate minerals is the preparation of sufficiently smooth
surfaces. For this reason, most AFM colloid probe studies of phyllosilicate
minerals had been performed on cleavage basal planes or simply rough surfaces
of phyllosilicate minerals.
By depositing kaolinite basal planes on differently charged substrates, Gupta and
Miller [45] investigated the anisotropic character of different kaolinite basal
planes (T or O) by measuring surface forces on each basal plane. The different
charging behaviour, wetting characteristics and the surface hydrophobicity of two
kaolinite basal planes have been observed. The PZC, or more precisely the point
of zero Stern potential of silica-like T basal plane of kaolinite was determined to
be at pH > 4, while the PZC of alumina-like O basal plane of kaolinite was found
between pH 6-8.
Regarding to phyllosilicate edge surfaces, Nalaskowski et al. [50] used a talc
particle (around 20 µm) as an AFM probe to measure the forces between this talc
particle and talc basal planes or edge surfaces in aqueous solutions of varying pH
Chapter 2 -30-
values. Although their study showed different electric properties between basal
planes and edge surfaces, their AFM force curves could only be analyzed
semi-quantitatively at the best due to the ill-defined geometry of the talc particles
glued on AFM cantilevers and high roughness of prepared edge surfaces.
Zhao et al. [12] probed the interaction forces on muscovite basal planes and edge
surfaces using a silica sphere of 8 µm diameter, glued on an AFM cantilever. In
order to quantitatively analyze the measured force curves, a microtome cutting
technique was employed for the first time with the purpose of obtaining a suitably
smooth edge surface. Although the surface smoothness of muscovite edge surface
was greatly improved by microtome cutting technique, the obtained edge surface
was still not sufficiently smooth, especially compared with its basal plane. The
roughness over the contact area for silica colloid probe remains too high, as
indicated by significantly weaker forces measured. Eventually, the surface
topology was reconstructed by obtained AFM image of the surface and SEI was
employed by these authors in their analysis to account for the effect of surface
roughness.
By fitting the interactions between the silica probe and muscovite surfaces with
DLVO theory, the AFM-derived surface potentials of muscovite basal plane were
found to be pH-insensitive, while the mica edges were highly pH-dependent with
the estimated PZC to be around pH 7.5±0.5. Although this innovative study
demonstrated the possibility of using AFM colloidal probe technique to study
anisotropic surface charge properties of phyllosilicate minerals, it was still limited
to obtain accurate result by some shortcomings. One problem in their study is that
the colloidal interaction forces were measured with a micron size silica probe,
while an AFM cantilever with a sharp tip was used to obtain a good AFM image
Chapter 2 -31-
with detailed morphological characteristics of the surface. This switching of the
probe particle to the sharp tip means that the recreated image used in SEI
calculation may not be the exact spot where the force profile was measured. To
resolve this uncertainty, those authors used several representative images to carry
out the SEI calculations and the average potentials of muscovite edge surfaces
were determined. However, due to the prepared surface remains too rough, the
determined surface potentials of muscovite edge surfaces cannot be considered to
be accurate but rather semi quantitative. Therefore, establishing a suitable
technique to improve the quality of the prepared edge surface to minimize the
uncertainties of SEI calculations is of great importance.
Chapter 2 -32-
2.4 References
[1] Masliyah. J. H., Bhattacharjee, S., 2006, "Electrokinetic and Colloid Transport
Phenomena," Wiley Interscience, Hoboken, New Jersey.
[2] Hamaker, H. C., 1937, "The London-Van Der Waals Attraction between
Spherical Particles," Physica, 4 (10) pp. 1058-1072.
[3] Bergström, L., 1997, "Hamaker Constants of Inorganic Materials," Advances
in Colloid and Interface Science, 70(1) pp. 125-169.
[4] Hunter, R. J., 2001, "Foundations of Colloid Science: Second Ed., Clarendon
Press, Oxford.
[5] Warszyński, P., Adamczyk, Z., 1997, "Calculations of Double Layer
Electrostatic Interactions for the Sphere/Plane Geometry," Journal of Colloid
and Interface Science, 187(2) pp. 283-295.
[6] Butt, H., Cappella, B., Kappl, M., 2005, "Force Measurements with the
Atomic Force Microscope: Technique, Interpretation and Applications,"
Surface Science Reports, 59(1-6) pp. 1-152.
[7] White, L. R., 1983, "On the Derjaguin Approximation for the Interaction of
Macrobodies," Journal of Colloid and Interface Science, 95(1) pp. 286-288.
[8] Suresh, L., Walz, J. Y., 1996, "Effect of Surface Roughness on the Interaction
Energy between a Colloidal Sphere and a Flat Plate," Journal of Colloid and
Interface Science, 183(1) pp. 199-213.
[9] Bhattacharjee, S., Elimelech, M., 1997, "Surface Element Integration: A Novel
Technique for Evaluation of DLVO Interaction between a Particle and a Flat
Plate," Journal of Colloid and Interface Science, 193(2) pp. 273-285.
[10] Bhattacharjee, S., Ko, C. H., Elimelech, M., 1998, "DLVO Interaction
between Rough Surfaces," Langmuir, 14(12) pp. 3365-3375.
[11] Huang, X., Bhattacharjee, S., Hoek, E. M. V., 2010, "Is Surface Roughness a
"Scapegoat" Or a Primary Factor when Defining Particle-Substrate
Interactions?" Langmuir, 26(4) pp. 2528-2537.
[12] Zhao, H., Bhattacharjee, S., Chow, R., Wallace, D., Masliyah, J. H., Xu, Z.,
2008, "Probing Surface Charge Potentials of Clay Basal Planes and Edges by
Direct Force Measurements," Langmuir, 24(22) pp. 12899-12910.
Chapter 2 -33-
[13] Laskowski, J. S., 2010, "Rheological Properties of Aqueous Suspensions of
Anisotropic Minerals," 8th UBC-McGill-UA symposium, M. Pawlik, ed.
Vancouver, BC,Canada.
[14] Ndlovu, B. N., Forbes, E., Becker, M., Deglon, D. A., Franzidis, J. P.,
Laskowski, J. S., 2011, "The Effects of Chrysotile Mineralogical Properties
on the Rheology of Chrysotile Suspensions," Minerals Engineering, 24(9) pp.
1004-1009.
[15] Ndlovu, B., Becker, M., Forbes, E., Deglon, D., Franzidis, J., 2011,"The
Influence of Phyllosilicate Mineralogy on the Rheology of Mineral Slurries,"
Minerals Engineering, 24(12) pp. 1314-1322.
[16] Leong, Y. K., Boger, D. V., Parris, D., 1991, "Surface and Rheological
Properties of Zirconia Suspensions," Chemical Engineering Research and
Design, 69(5) pp. 381-385.
[17] Johnson, S. B., Franks, G. V., Scales, P. J., Boger, D. V., Healy, T. W., 2000,
"Surface chemistry–rheology Relationships in Concentrated Mineral
Suspensions," International Journal of Mineral Processing, 58(1-4) pp.
267-304.
[18] Johnson, S. B., Russell, A. S., Scales, P. J., 1998, "Volume Fraction Effects
in Shear Rheology and Electroacoustic Studies of Concentrated Alumina and
Kaolin Suspensions," Colloids and Surfaces A-Physicochemical and
Engineering Aspects, 141(1) pp. 119-130.
[19] Burdukova, E., Becker, M., Bradshaw, D. J., Laskowski, J. S., 2007,
"Presence of Negative Charge on the Basal Planes of New York Talc,"
Journal of Colloid and Interface Science, 315(1) pp. 337-342.
[20] Alvarez-Silva, M., Uribe-Salas, A., Mirnezami, M., Finch, J. A., 2010, "The
Point of Zero Charge of Phyllosilicate Minerals using the Mular-Roberts
Titration Technique," Minerals Engineering, 23(5) pp. 383-389.
[21] Fuerstenau, D. W., Pradip, 2005, "Zeta Potentials in the Flotation of Oxide
and Silicate Minerals," Advances in Colloid and Interface Science, 114-115
pp. 9-26.
[22] Kosmulski, M., 2012, "IEP as a Parameter Characterizing the pH-Dependent
Surface Charging of Materials Other than Metal Oxides," Advances in
Colloid and Interface Science, 171–172 pp. 77-86.
Chapter 2 -34-
[23] Nosrati, A., Addai-Mensah, J., and Skinner, W., 2012, "Rheological
Behaviour of Muscovite Clay Slurries: Effect of Water Quality and Solution
Speciation," International Journal of Mineral Processing, 102-103 pp. 89-98.
[24] Alkan, M., Demirbaş, O., and Doǧan, M., 2005, "Electrokinetic Properties of
Kaolinite in Mono-and Multivalent Electrolyte Solutions," Microporous and
Mesoporous Materials, 83(1-3) pp. 51-59.
[25] Taubaso, C., Afonso, M. D., Sanchez, R. M. T., 2004, "Modelling Soil
Surface Charge Density using Mineral Composition," Geoderma, 121(1-2)
pp. 123-133.
[26] Tombácz, E., and Szekeres, M., 2006, "Surface Charge Heterogeneity of
Kaolinite in Aqueous Suspension in Comparison with Montmorillonite,"
Applied Clay Science, 34(1-4) pp. 105-124.
[27] Fornasiero, D., Ralston, J., 2005, "Cu (II) and Ni (II) Activation in the
Flotation of Quartz, Lizardite and Chlorite," International Journal of Mineral
Processing, 76(1-2) pp. 75-81.
[28] Tan, H., Skinner, W., and Addai-Mensah, J., 2012, "pH-Mediated Interfacial
Chemistry and Particle Interactions in Aqueous Chlorite Dispersions,"
Chemical Engineering Research and Design, 91(3) pp. 448-456.
[29] Alvarez-Silva, M., Mirnezami, M., Uribe-Salas, A., Finch, J. A., 2010, "Point
of Zero Charge, Isoelectric Point and Aggregation of Phyllosilicate
Minerals," Canadian Metallurgical Quarterly, 49(4) pp. 405-410.
[30] Tombacz, E., Csanaky, C., Illes, E., 2001, "Polydisperse Fractal Aggregate
Formation in Clay Mineral and Iron Oxide Suspensions, pH and Ionic
Strength Dependence," Colloid and Polymer Science, 279(5) pp. 484-492.
[31] Luckham, P. F., and Rossi, S., 1999, "The Colloidal and Rheological
Properties of Bentonite Suspensions," Advances in Colloid and Interface
Science, 82(1-3) pp. 43-92.
[32] Rand, B., Melton, I. E., 1977, "Particle Interactions in Aqueous Kaolinite
Suspensions. I. Effect of pH and Electrolyte upon the Mode of Particle
Interaction in Homoionic Sodium Kaolinite Suspensions," Journal of Colloid
and Interface Science, 60(2) pp. 308-320.
[33] James, A., Williams, D., 1982, "Flocculation and Rheology of Kaolinite
Quartz Suspensions," Rheologica Acta, 21(2) pp. 176-183.
Chapter 2 -35-
[34] Parks, G. A., 1965, "The Isoelectric Points of Solid Oxides, Solid Hydroxides,
and Aqueous Hydroxo Complex Systems," Chemical Reviews, 65(2) pp.
177-198.
[35] Kosmulski, M., 2009, "Compilation of PZC and IEP of Sparingly Soluble
Metal Oxides and Hydroxides from Literature," Advances in Colloid and
Interface Science, 152(1-2) pp. 14-25.
[36] Rasmusson, M., Rowlands, W., O'Brien, R. W., Hunter, R. J., 1997, "The
Dynamic Mobility and Dielectric Response of Sodium Bentonite," Journal of
Colloid and Interface Science, 189(1) pp. 92-100.
[37] Rowlands, W. N., O'Brien, R. W., 1995, "The Dynamic Mobility and
Dielectric Response of Kaolinite Particles," Journal of Colloid and Interface
Science, 175(1) pp. 190-200.
[38] Hunter, R. J., 1998, "Recent Developments in the Electroacoustic
Characterization of Colloidal Suspensions and Emulsions," Colloids and
Surfaces A: Physicochemical and Engineering Aspects, 141(1) pp. 37-66.
[39] Hunter, R. J., 1982, "The Flow Behaviour of Coagulated Colloidal
Dispersions," Advances in Colloid and Interface Science, 17(1) pp. 197-211.
[40] Duc, M., Gaboriaud, F., Thomas, F., 2005, "Sensitivity of the Acid-Base
Properties of Clays to the Methods of Preparation and Measurement: 2.
Evidence from Continuous Potentiometric Titrations," Journal of Colloid and
Interface Science, 289(1) pp. 148-156.
[41] Yeganeh, M. S., Dougal, S. M., Pink, H. S., 1999, "Vibrational Spectroscopy
of Water at liquid/solid Interfaces: Crossing the Isoelectric Point of a Solid
Surface," Physical Review Letters, 83(6) pp. 1179-1182.
[42] Hopkins, A. J., McFearin, C. L., and Richmond, G. L., 2005, "Investigations
of the Solid-Aqueous Interface with Vibrational Sum-Frequency
Spectroscopy," Current Opinion in Solid State and Materials Science, 9(1-2)
pp. 19-27.
[43] Stack, A., Higgins, S., Eggleston, C., 2001, "Point of Zero Charge of a
Corundum-Water Interface Probed with Optical Second Harmonic
Generation (SHG) and Atomic Force Microscopy (AFM): New Approaches
to Oxide Surface Charge," Geochimica Et Cosmochimica Acta, 65(18) pp.
3055-3063.
Chapter 2 -36-
[44] Ducker, W., Senden, T., Pashley R., 1991, "Direct Measurement of Colloidal
Forces using an Atomic Force Microscope," Nature, 353(6341) pp. 239-241.
[45] Gupta, V., Miller, J. D., 2010, "Surface Force Measurements at the Basal
Planes of Ordered Kaolinite Particles," Journal of Colloid and Interface
Science, 344(2) pp. 362-371.
[46] Long, J., Xu, Z., Mashyah, J. H., 2006, "Role of Illite-Illite Interactions in Oil
Sands Processing," Colloids and Surfaces A-Physicochemical and
Engineering Aspects, 281(1-3) pp. 202-214.
[47] Wallqvist, V., Claesson, P. M., Swerin, A., 2006, "Interaction Forces
between Talc and Hydrophobic Particles Probed by AFM," Colloids and
Surfaces A: Physicochemical and Engineering Aspects, 277(1-3) pp.
183-190.
[48] Wallqvist, V., Claesson, P. M., Swerin, A., Schoelkopf, J., Gane, P. A. C.,
2007, "Interaction Forces between Talc and Pitch Probed by Atomic Force
Microscopy," Langmuir, 23(8) pp. 4248-4256.
[49] Chi, R., Xu, Z., DiFeo, T., Finch, J. A., Yordan, J. L., 2001, "Measurement
of Interaction Forces between Talc and Toner Particles," Journal of Pulp and
Paper Science, 27(5) pp. 152-157.
[50] Nalaskowski, J., Abdul, B., Du, H., Miller, J. D., 2007, "Anisotropic
Character of Talc Surfaces as Revealed by Streaming Potential
Measurements, Atomic Force Microscopy, Molecular Dynamics Simulations
and Contact Angle Measurements," Canadian Metallurgical Quarterly, 46(3)
pp. 227-235.
[51] Hartley, P. G., Larson, I., Scales, P. J., 1997, "Electrokinetic and Direct Force
Measurements between Silica and Mica Surfaces in Dilute Electrolyte,
Solutions," Langmuir, 13(8) pp. 2207-2214.
-37-
Chapter 3
Materials, characterization and methods
3.1 Materials
Talc obtained from Luzmenac America (Englewood, CO, USA) and muscovite
supplied by S & J Trading (Glen Oaks, NY, USA) were used throughout this
study. Silica wafers with one side polished were purchased from Nanofab
(University of Alberta, Canada). KCl (Aldrich Inc.) was used as supporting
electrolyte.HCl and NaOH (Fisher Inc.) were used as pH modifiers. CaCl2·2H2O
and MgCl2·6H2O (Aldrich Inc.) were used as sources of Ca2+
and Mg2+
,
respectively. All the reagents used were of ACS analytical grade. High purity
Milli-Q water with a resistivity of 18.2 MΩ cm-1
, prepared with an Elix 5
followed by a Millipore-UV Plus Ultra water purification system (Millipore Inc.),
was used for preparation of solutions used throughout this study.
3.2 Preparation of different phyllosilicate surfaces
Since both talc and muscovite have perfect cleavages along their basal planes, the
basal planes of these two phyllosilicates are freshly cleaved using a sticky tape in
a dust-free, horizontal laminar flow hood (NuAire, Inc., Plymouth, MN, USA).
3.2.1 Ultramicrotome cutting technique
In the case of edge surfaces, an ultramicrotome cutting procedure was developed
to obtain suitable smooth edge surfaces for further study at molecular level using
AFM. As shown in Figure 3.1, a very small and thin piece of phyllosilicate
mineral was first embedded in an epoxy resin (Electron Microscopy Sciences,
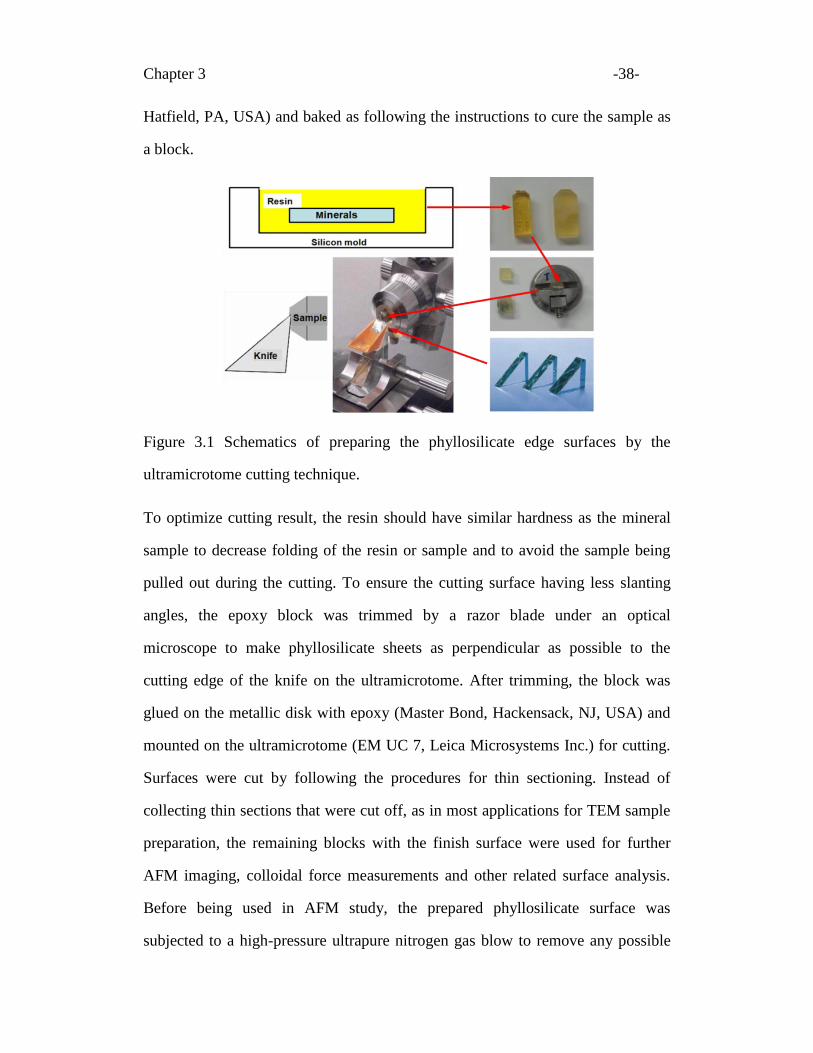
Chapter 3 -38-
Hatfield, PA, USA) and baked as following the instructions to cure the sample as
a block.
Figure 3.1 Schematics of preparing the phyllosilicate edge surfaces by the
ultramicrotome cutting technique.
To optimize cutting result, the resin should have similar hardness as the mineral
sample to decrease folding of the resin or sample and to avoid the sample being
pulled out during the cutting. To ensure the cutting surface having less slanting
angles, the epoxy block was trimmed by a razor blade under an optical
microscope to make phyllosilicate sheets as perpendicular as possible to the
cutting edge of the knife on the ultramicrotome. After trimming, the block was
glued on the metallic disk with epoxy (Master Bond, Hackensack, NJ, USA) and
mounted on the ultramicrotome (EM UC 7, Leica Microsystems Inc.) for cutting.
Surfaces were cut by following the procedures for thin sectioning. Instead of
collecting thin sections that were cut off, as in most applications for TEM sample
preparation, the remaining blocks with the finish surface were used for further
AFM imaging, colloidal force measurements and other related surface analysis.
Before being used in AFM study, the prepared phyllosilicate surface was
subjected to a high-pressure ultrapure nitrogen gas blow to remove any possible
Chapter 3 -39-
flakes and dust on the surface, and rinsed with Milli-Q water and ethanol. Finally,
the prepared surface was cleaned by UV-ozone immediately prior to its use to
remove any organic contaminants.
3.2.2 Characterization of prepared surfaces
3.2.2.1 Field emission secondary electron microscopy imaging
The morphology of the obtained edge surface prepared by ultramicrotome cutting
technique was examined by Field emission secondary electron microscopy
(FE-SEM) equipped with a scanning Auger microprobe (JAMP-9500F, Oxford
Instruments). To prevent a poor quality image caused by surface charging, low
voltage was applied during the imaging to minimize the charge effects. Typical
FE-SEM images of edge surfaces prepared by ultramicrotome cutting technique
are shown in Figure 3.2. Figure 3.2 (a) shows a large scale image of the prepared
edge surface at lower magnification and Figure 3.2 (b) shows a high resolution
image after zooming in to a small smooth area. The resin appeared to be darker
than the edge surface due to its low electron scattering yield. Some pitch lines and
tiny debris were observed on the edge surfaces. These pitch lines are possibly due
to pull off and carryover of tiny phyllosilicate debris which stick on the cutting
knife by electrostatic adhesion and are hard to be removed during the cutting
process.
3.2.2.2 X-ray photoelectron spectroscopic analysis
The surface elemental composition of both basal planes and edge surfaces of each
mineral was obtained by performing X-ray photoelectron spectroscopic (XPS)
analysis with an Axis 165 spectrometer (Kratos Analytical). As shown in Figure
3.3, the presence of different cations is seen in the spectra of different
phyllosilicate minerals studied. The dominated cationic elements of both basal
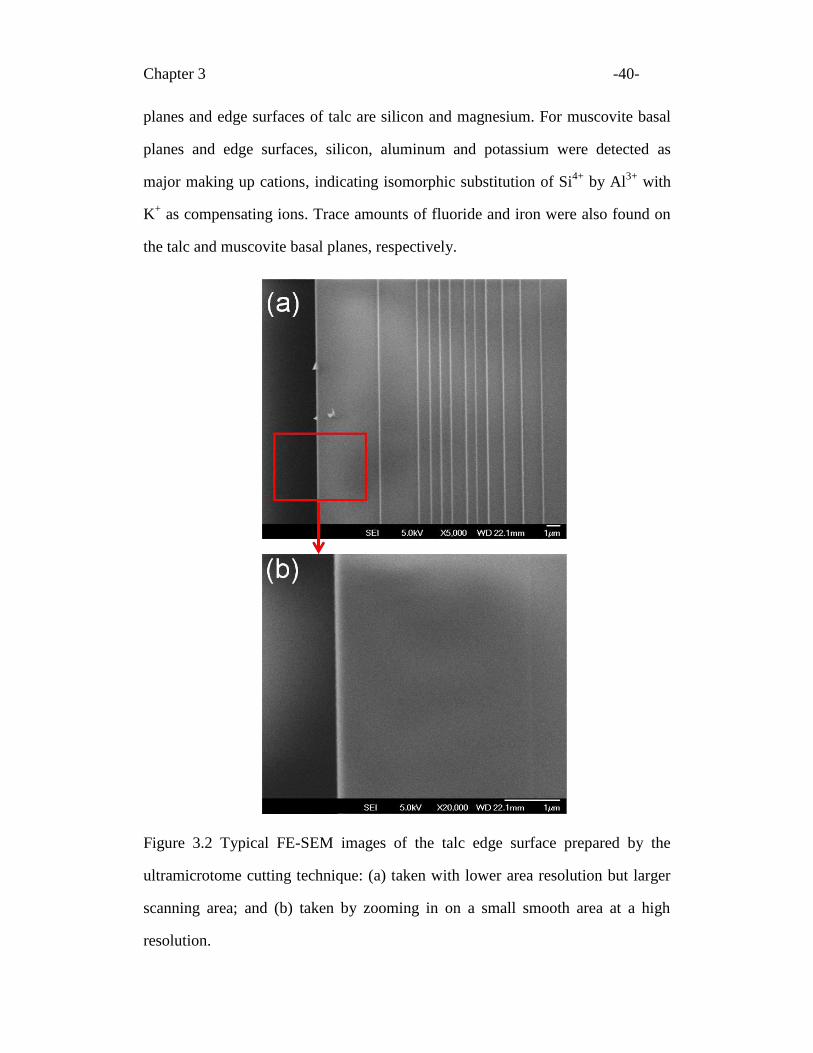
Chapter 3 -40-
planes and edge surfaces of talc are silicon and magnesium. For muscovite basal
planes and edge surfaces, silicon, aluminum and potassium were detected as
major making up cations, indicating isomorphic substitution of Si4+
by Al3+
with
K+ as compensating ions. Trace amounts of fluoride and iron were also found on
the talc and muscovite basal planes, respectively.
Figure 3.2 Typical FE-SEM images of the talc edge surface prepared by the
ultramicrotome cutting technique: (a) taken with lower area resolution but larger
scanning area; and (b) taken by zooming in on a small smooth area at a high
resolution.
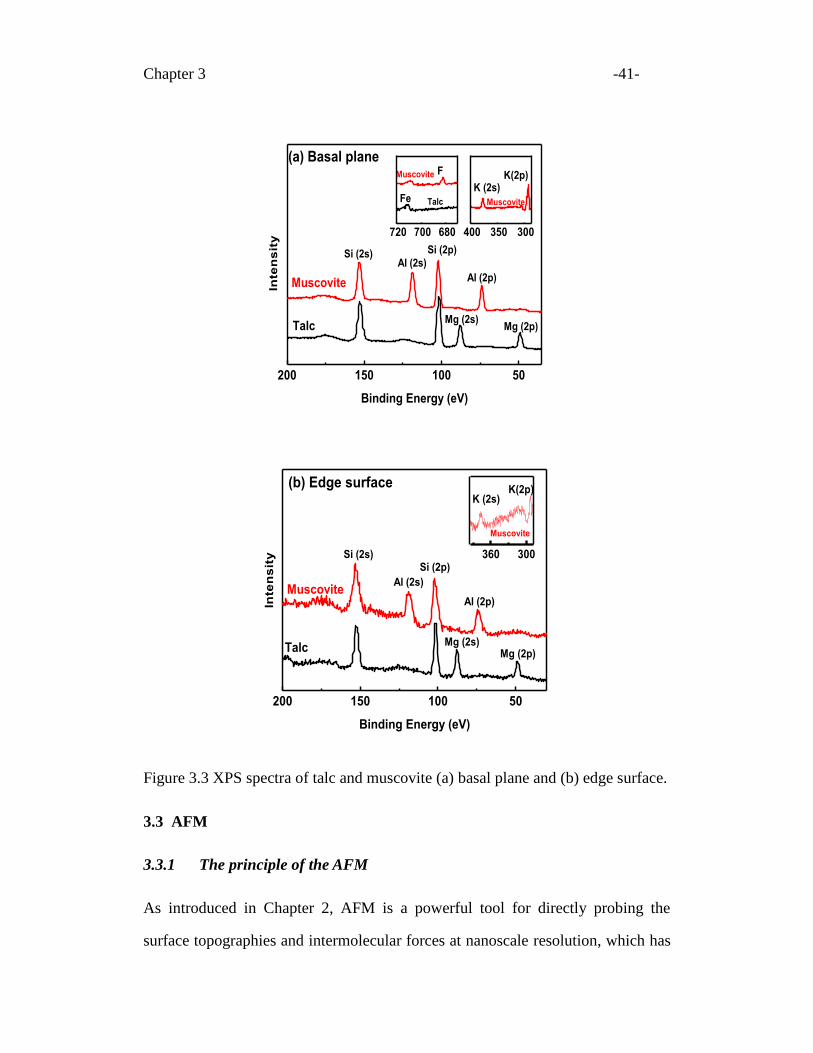
Chapter 3 -41-
200 150 100 50
Muscovite
Muscovite FeK (2s)
Talc
(a) Basal plane
Inte
ns
ity
Binding Energy (eV)
Muscovite
Talc
Si (2s)Al (2s)
Si (2p)
Al (2p)
Mg (2s)Mg (2p)
F K(2p)
400 350 300
720 700 680
200 150 100 50
Muscovite
Muscovite
Inte
ns
ity
Binding Energy (eV)
Si (2s)Si (2p)
Al (2s)
Al (2p)
Mg (2p)Mg (2s)
Talc
(b) Edge surfaceK(2p)
K (2s)
360 300
Figure 3.3 XPS spectra of talc and muscovite (a) basal plane and (b) edge surface.
3.3 AFM
3.3.1 The principle of the AFM
As introduced in Chapter 2, AFM is a powerful tool for directly probing the
surface topographies and intermolecular forces at nanoscale resolution, which has
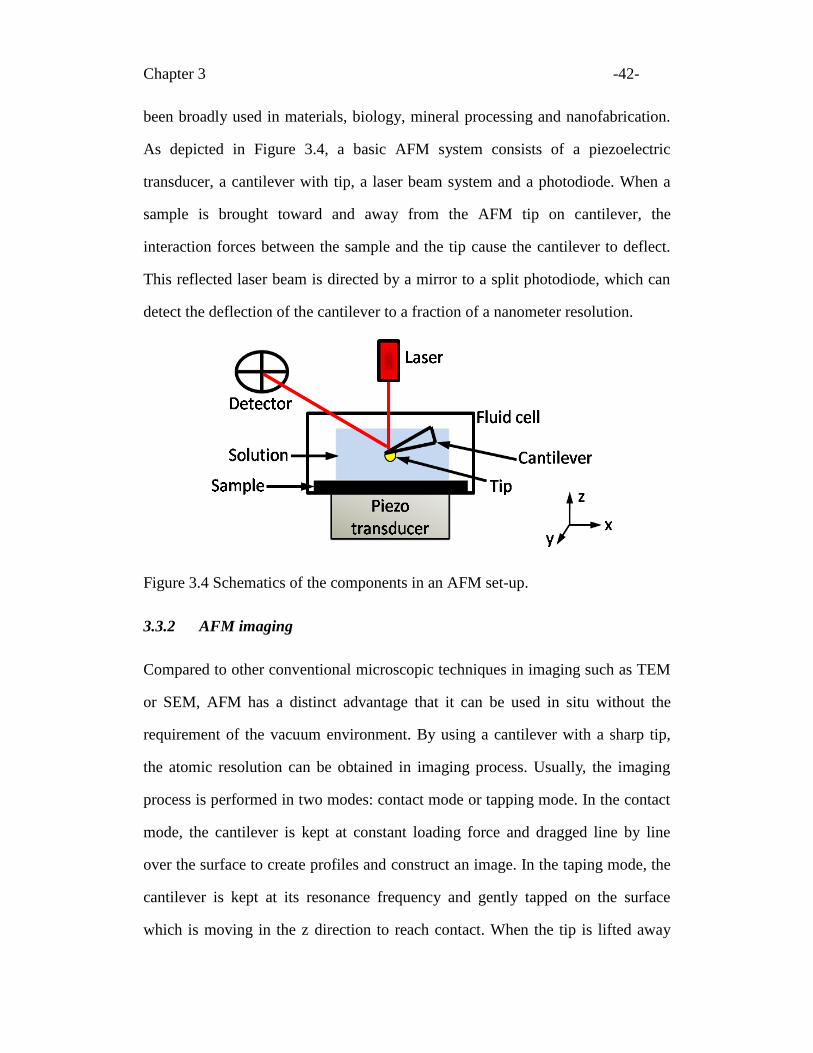
Chapter 3 -42-
been broadly used in materials, biology, mineral processing and nanofabrication.
As depicted in Figure 3.4, a basic AFM system consists of a piezoelectric
transducer, a cantilever with tip, a laser beam system and a photodiode. When a
sample is brought toward and away from the AFM tip on cantilever, the
interaction forces between the sample and the tip cause the cantilever to deflect.
This reflected laser beam is directed by a mirror to a split photodiode, which can
detect the deflection of the cantilever to a fraction of a nanometer resolution.
Figure 3.4 Schematics of the components in an AFM set-up.
3.3.2 AFM imaging
Compared to other conventional microscopic techniques in imaging such as TEM
or SEM, AFM has a distinct advantage that it can be used in situ without the
requirement of the vacuum environment. By using a cantilever with a sharp tip,
the atomic resolution can be obtained in imaging process. Usually, the imaging
process is performed in two modes: contact mode or tapping mode. In the contact
mode, the cantilever is kept at constant loading force and dragged line by line
over the surface to create profiles and construct an image. In the taping mode, the
cantilever is kept at its resonance frequency and gently tapped on the surface
which is moving in the z direction to reach contact. When the tip is lifted away
Chapter 3 -43-
from the contact, the surface is moved in the x-y directions, avoiding the drag of
the tip on the surface.
3.3.3 AFM force measurement
In addition to mapping the surface topography, AFM can also probe the
interaction forces between a flat surface and an AFM tip. For one AFM force
measurement cycle, both the long range attractive or repulsive forces between two
surfaces when they are approaching each other and the adhesion (pull off) force
when one surface is retracted from the other can be recorded.
A typical “force vs piezo displacement” curve recorded by AFM is shown in
Figure 3.5 (a). When the sample on the piezo transducer stage start to move
toward the tip on the cantilever, at the beginning, there is no deflection of the
cantilever due to zero interaction force between the two surfaces at large
separation distances. Therefore, a constant output signals is obtained initially in
this zero deflection region (Figure 3.5 (a): a0-a1). As the sample moves closer to
the tip, the change of the output signal is observed (Figure 3.5 (a): a1-a2). An
increase in the output signal indicates the cantilever being pushed away by the
repulsion between the two surfaces while a decrease in the output signal indicates
the cantilever moving towards the lower sample surface corresponding to an
attraction between the two surfaces. Eventually, the sample will be brought by the
translation stage into the contact with the tip and then a constant compliance is
observed. In this constant compliance region, though the surface is in contact with
the probe, the surface is still moving with the probe. The cantilever displacement
(deflection) can be calibrated in terms of output signals from the known
displacement of the piezo to which the surface is attached. The slope of this linear
part of the curve (Figure 3.5 (a): a2-a3) is estimated as the compliance gradient
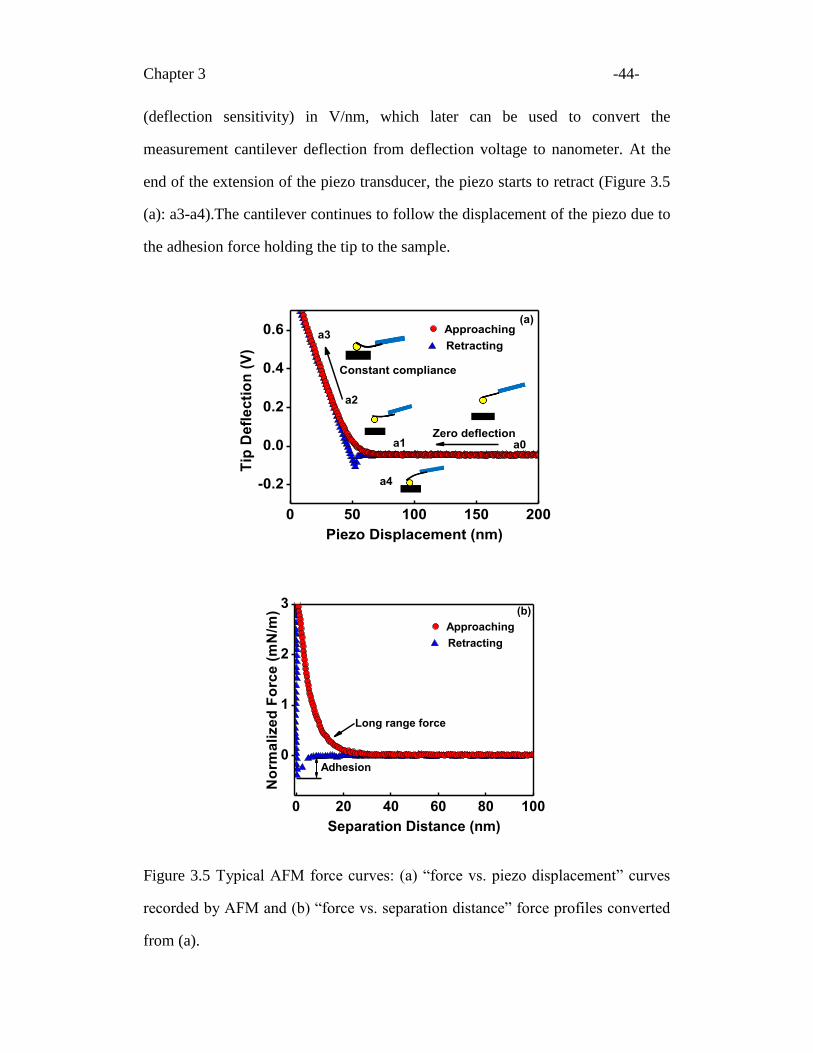
Chapter 3 -44-
(deflection sensitivity) in V/nm, which later can be used to convert the
measurement cantilever deflection from deflection voltage to nanometer. At the
end of the extension of the piezo transducer, the piezo starts to retract (Figure 3.5
(a): a3-a4).The cantilever continues to follow the displacement of the piezo due to
the adhesion force holding the tip to the sample.
0 50 100 150 200
-0.2
0.0
0.2
0.4
0.6 a3
Zero deflectiona1
a4
Constant compliance
a0
a2
Tip
De
fle
cti
on
(V
)
Piezo Displacement (nm)
(a)Approaching
Retracting
0 20 40 60 80 100
0
1
2
3
(b)
Adhesion
Long range force
Approaching
Retracting
No
rma
lize
d F
orc
e (
mN
/m)
Separation Distance (nm)
Figure 3.5 Typical AFM force curves: (a) “force vs. piezo displacement” curves
recorded by AFM and (b) “force vs. separation distance” force profiles converted
from (a).
Chapter 3 -45-
The force acting between the tip and the sample is determined from the deflection
of the cantilever and its spring constant using Hooke’s law ),( kxF where x
represents the deflection and k is the spring constant of the cantilever. Finally, in
this manner, the “force vs. piezo displacement” is converted to the “force vs.
separation distance” force profile as shown in Figure 3.5 (b). More detailed
description on the principles of the AFM can be found in literature [1-2].
In this dissertation, AFM technique was employed to probe the colloidal
interaction as well as to image surface topographies. A Multimode AFM with
Nanoscope IIIa controller, equipped with PicoForce or E scanner and
vendor-provided liquid cell, all supplied by Veeco Instruments Inc., (Santa
Barbara, CA, USA) was used throughout this study.
In experiments reported in Chapters 4-6, AFM measurements were carried out in
1 mM KCl solutions as the supporting electrolyte. After filling the liquid cell with
the test aqueous solutions, the system was allowed to stabilize for at least 30
minutes before each measurement. At least three pairs of tip-surface were used for
each surface type and the measurements were conducted at various locations on
one surface for each condition of the solution. For force measurement, at each
location, continuous approaching and retracting force curves were taken and the
data was only recorded when the force curve was stable. All experiments were
conducted at room temperature (20 ± 2o C). The raw force profiles were analyzed
with SPIP software (Image Metrology) which converts the deflection-distance
data to force-separation curves, including baseline and hysteresis correction. The
spring constant of each cantilever was measured by the thermal tune method using
the built-in option in the Veeco AFM software version 8.10, with values obtained
Chapter 3 -46-
varying from 0.12 to 0.19 N/m. The maximum loading force used in the force
measurement was controlled within the same range.
3.3.4 AFM tip evaluation
In Chapters 4-6, silicon nitride tips (NP, Veeco Inc., Santa Barbara, CA, USA)
were used in AFM experiments. It has been reported that compared to micron
sized probe particles, the use of sharp AFM tips allows mapping of surface charge
or Stern potential at a spatial resolution of 20-100 nm which is about 20-100 fold
higher than the colloidal probe technique [3]. One possible disadvantage of using
the sharp tip is its lower sensitivity for force measurements due to weaker
interaction forces from small interacting surfaces. However, the high surface
charge reported for this type of tip as a probe offsets some negative effects of
weak interaction forces [4]. In order to obtain its geometry and apex curvature, the
morphology of the tip was examined with a field emission scanning Auger
microprobe (JAMP-9500F, Jeol, Japan). A pyramid-like shape tip is shown in
Figure 3.6 (a and b). As shown by the scanning Auger electron spectrum in Figure
3.6 (b1), the tip consists of 49.4% silicon and 42.5% nitrogen with a small amount
of oxygen (8.1%) on the top end of the tip which interacts with the phyllosilicate
surface during the AFM force measurements.
The tip geometry was also evaluated with the Nanoscope software (Veeco Inc.,
Santa Barbara, CA, USA) by analyzing the image of a polycrystalline titanium
“tip-check” sample (RS, Veeco Inc., Santa Barbara, CA, USA) taken by the tip.
This “tip-check” sample contains extremely sharp features. The effective tip
diameter and aspect ratio at a selected distance from the tip apex were calculated
from the width and height of the image taken. A detailed description of the tip
geometry evaluation can be found elsewhere [5]. By using this software program,
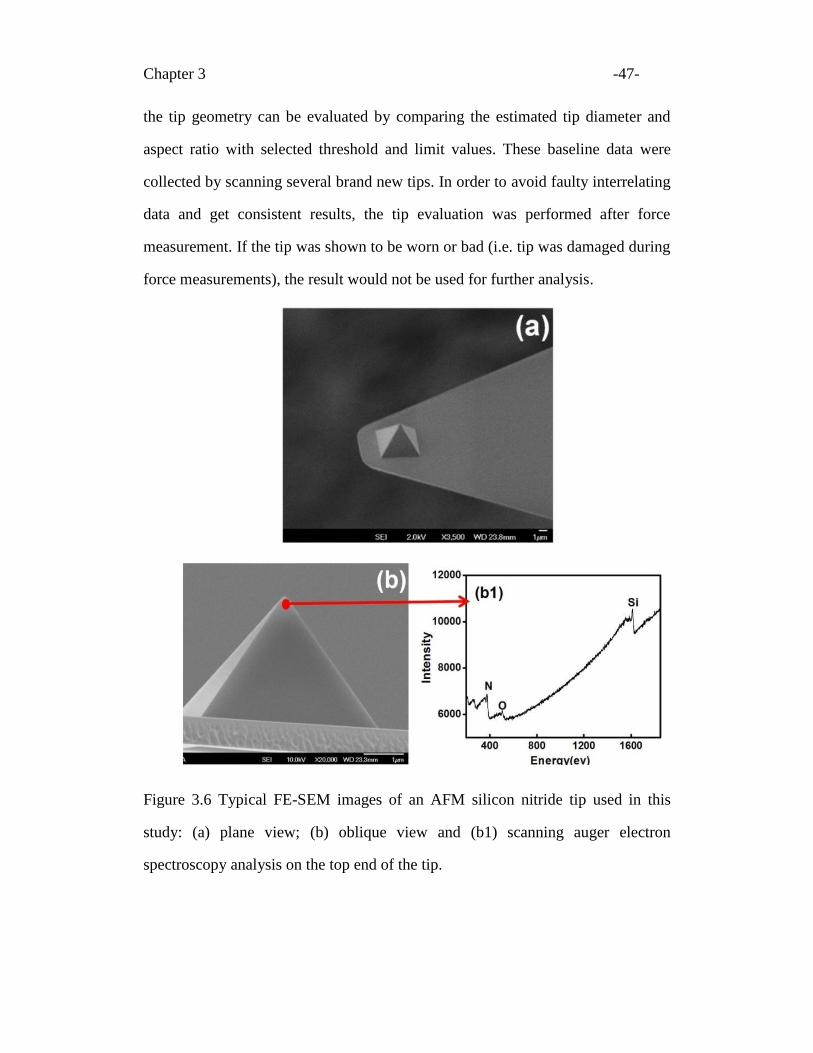
Chapter 3 -47-
the tip geometry can be evaluated by comparing the estimated tip diameter and
aspect ratio with selected threshold and limit values. These baseline data were
collected by scanning several brand new tips. In order to avoid faulty interrelating
data and get consistent results, the tip evaluation was performed after force
measurement. If the tip was shown to be worn or bad (i.e. tip was damaged during
force measurements), the result would not be used for further analysis.
Figure 3.6 Typical FE-SEM images of an AFM silicon nitride tip used in this
study: (a) plane view; (b) oblique view and (b1) scanning auger electron
spectroscopy analysis on the top end of the tip.
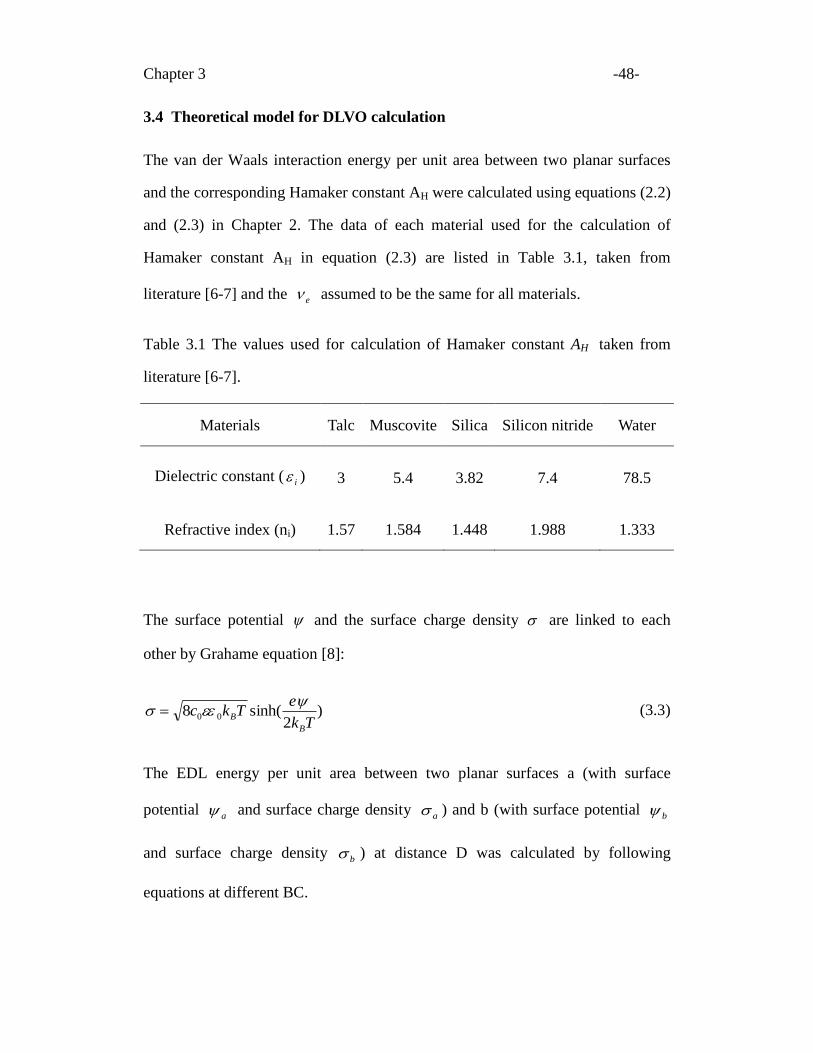
Chapter 3 -48-
3.4 Theoretical model for DLVO calculation
The van der Waals interaction energy per unit area between two planar surfaces
and the corresponding Hamaker constant AH were calculated using equations (2.2)
and (2.3) in Chapter 2. The data of each material used for the calculation of
Hamaker constant AH in equation (2.3) are listed in Table 3.1, taken from
literature [6-7] and the e assumed to be the same for all materials.
Table 3.1 The values used for calculation of Hamaker constant AH taken from
literature [6-7].
Materials Talc Muscovite Silica Silicon nitride Water
Dielectric constant ( i ) 3 5.4 3.82 7.4 78.5
Refractive index (ni) 1.57 1.584 1.448 1.988 1.333
The surface potential and the surface charge density are linked to each
other by Grahame equation [8]:
)2
sinh(8 00Tk
eTkc
B
B
(3.3)
The EDL energy per unit area between two planar surfaces a (with surface
potential a and surface charge density
a ) and b (with surface potential b
and surface charge density b ) at distance D was calculated by following
equations at different BC.
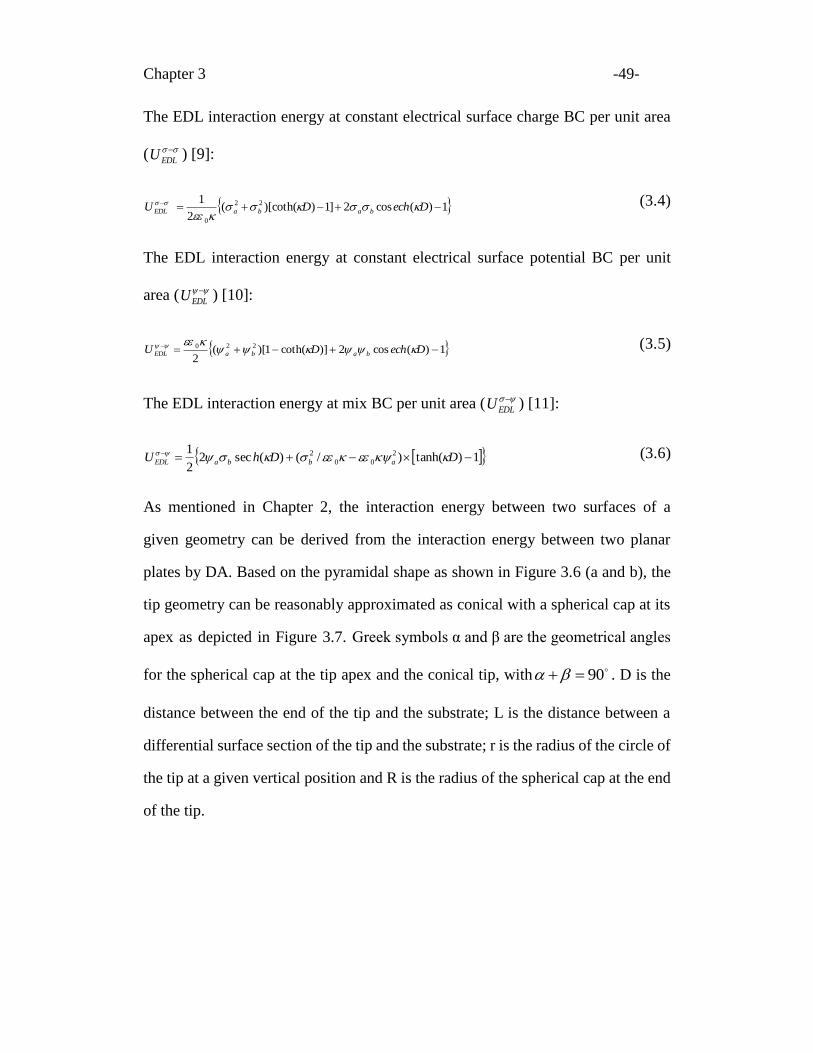
Chapter 3 -49-
The EDL interaction energy at constant electrical surface charge BC per unit area
(
EDLU ) [9]:
1)(cos2]1))[coth((2
1 22
0
DechDU babaEDL
(3.4)
The EDL interaction energy at constant electrical surface potential BC per unit
area (
EDLU ) [10]:
1)(cos2)]coth(1)[(2
220 DechDU babaEDL (3.5)
The EDL interaction energy at mix BC per unit area (
EDLU ) [11]:
1)tanh()/()(sec22
1 2
00
2 DDhU abbaEDL (3.6)
As mentioned in Chapter 2, the interaction energy between two surfaces of a
given geometry can be derived from the interaction energy between two planar
plates by DA. Based on the pyramidal shape as shown in Figure 3.6 (a and b), the
tip geometry can be reasonably approximated as conical with a spherical cap at its
apex as depicted in Figure 3.7. Greek symbols α and β are the geometrical angles
for the spherical cap at the tip apex and the conical tip, with 90 . D is the
distance between the end of the tip and the substrate; L is the distance between a
differential surface section of the tip and the substrate; r is the radius of the circle of
the tip at a given vertical position and R is the radius of the spherical cap at the end
of the tip.
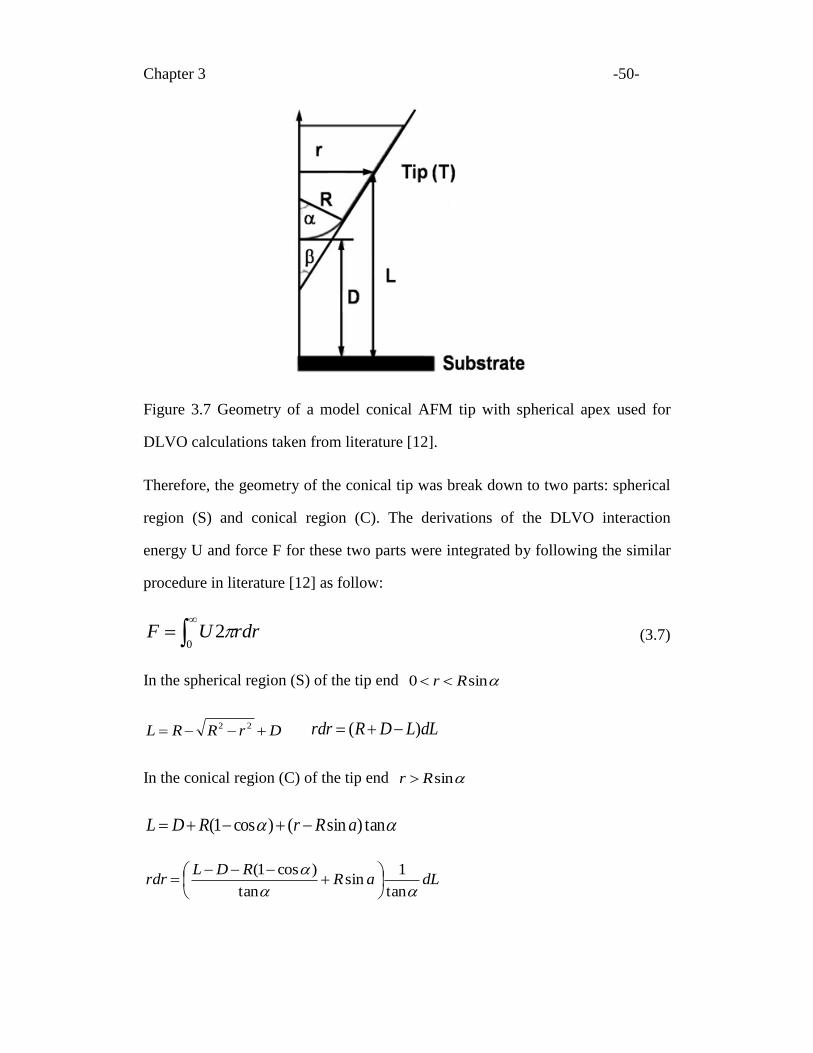
Chapter 3 -50-
Figure 3.7 Geometry of a model conical AFM tip with spherical apex used for
DLVO calculations taken from literature [12].
Therefore, the geometry of the conical tip was break down to two parts: spherical
region (S) and conical region (C). The derivations of the DLVO interaction
energy U and force F for these two parts were integrated by following the similar
procedure in literature [12] as follow:
rdrUF 20
(3.7)
In the spherical region (S) of the tip end sin0 Rr
DrRRL 22 dLLDRrdr )(
In the conical region (C) of the tip end sinRr
tan)sin()cos1( aRrRDL
dLaRRDL
rdr
tan
1sin
tan
)cos1(
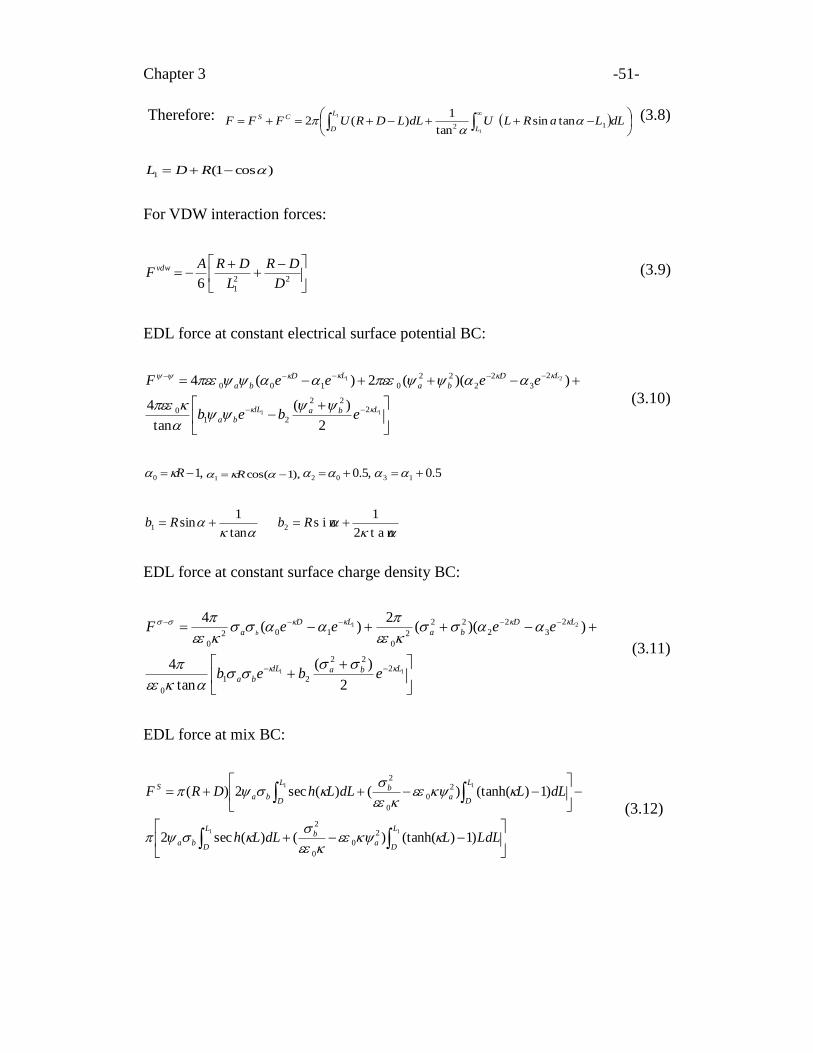
Chapter 3 -51-
Therefore:
dLLaRLUdLLDRUFFFL
L
D
CS
12tansin
tan
1)(2
1
1
(3.8)
)cos1(1 RDL
For VDW interaction forces:
22
16 D
DR
L
DRAF vdw (3.9)
EDL force at constant electrical surface potential BC:
11
21
222
210
2
3
2
2
22
0100
2
)(
tan
4
))((2)(4
LbalL
ba
LD
ba
LD
ba
ebeb
eeeeF
(3.10)
,10 R ),1cos(1 R ,5.002 5.013
tan
1sin1 Rb
t a n2
1s i n2 Rb
EDL force at constant surface charge density BC:
11
21
222
21
0
2
3
2
2
22
2
0
102
0
2
)(
tan
4
))((2
)(4
LbalL
ba
LD
ba
LD
a
ebeb
eeeeFb
(3.11)
EDL force at mix BC:
1 1
1 1
)1)(tanh()()(sec2
)1)(tanh()()(sec2)(
2
0
0
2
2
0
0
2
L
D
L
Da
bba
L
D
L
Da
bba
S
LdLLdLLh
dLLdLLhDRF
(3.12)
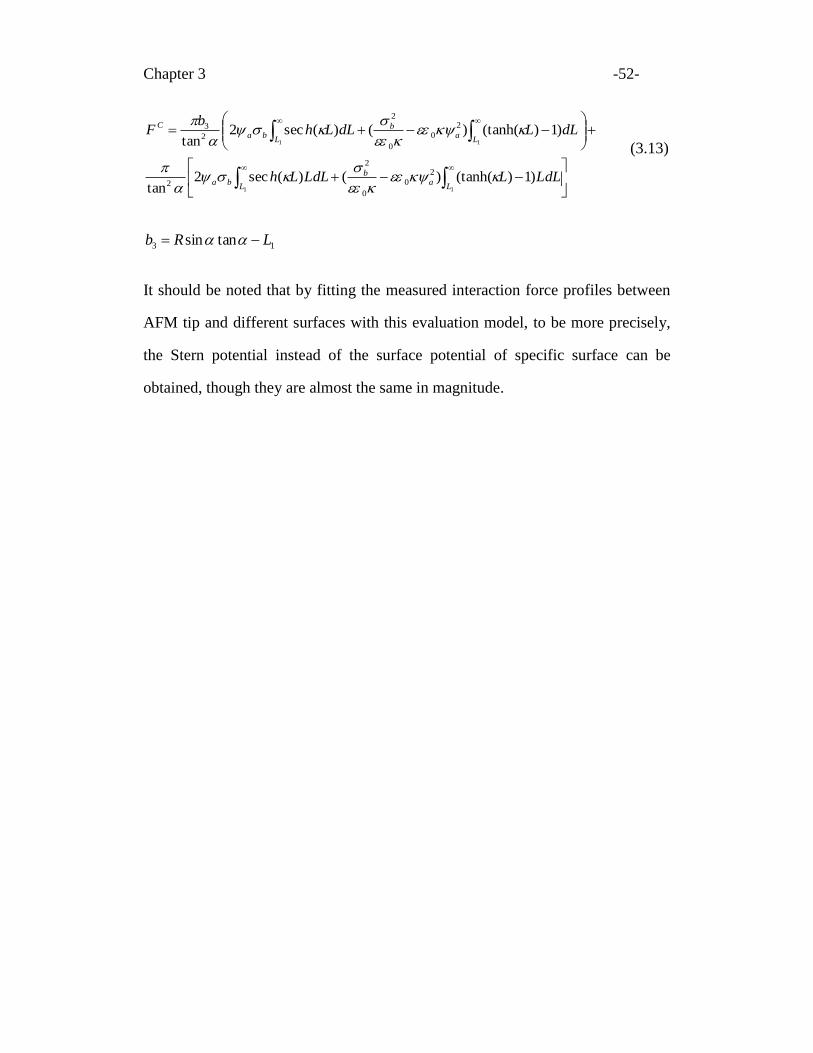
Chapter 3 -52-
1 1
1 1
)1)(tanh()()(sec2tan
)1)(tanh()()(sec2tan
2
0
0
2
2
2
0
0
2
2
3
L La
bba
L La
bba
C
LdLLLdLLh
dLLdLLhb
F
(3.13)
13 tansin LRb
It should be noted that by fitting the measured interaction force profiles between
AFM tip and different surfaces with this evaluation model, to be more precisely,
the Stern potential instead of the surface potential of specific surface can be
obtained, though they are almost the same in magnitude.
Chapter 3 -53-
3.5 References
[1] Butt, H., Cappella, B., Kappl, M., 2005, "Force Measurements with the
Atomic Force Microscope: Technique, Interpretation and Applications,"
Surface Science Reports, 59(1-6) pp. 1-152.
[2] Cappella, B., Dietler, G., 1999, "Force-Distance Curves by Atomic Force
Microscopy," Surface Science Reports, 34(1-3) pp. 1-104.
[3] Gupta, V., Miller, J. D., 2010, "Surface Force Measurements at the Basal
Planes of Ordered Kaolinite Particles," Journal of Colloid and Interface
Science, 344(2) pp. 362-371.
[4] Yin, X., Drelich, J., 2008, "Surface Charge Microscopy: Novel Technique for
Mapping Charge-Mosaic Surfaces in Electrolyte Solutions," Langmuir, 24(15)
pp. 8013-8020.
[5] Veeco Metrology Group, 2002, "Support Note 250, Revision C," Digital
Instruments, Santa Barbara, CA.
[6] Bergström, L., 1997, "Hamaker Constants of Inorganic Materials," Advances
in Colloid and Interface Science, 70pp. 125-169.
[7] Wallqvist, V., Claesson, P. M., Swerin, A., Schoelkopf, J., Gane, P. A. C.,
2007, "Interaction Forces between Talc and Pitch Probed by Atomic Force
Microscopy," Langmuir, 23(8) pp. 4248-4256.
[8] Butt, H., Graf, K., Kappl, M., 2006, "Physics and Chemistry of Interfaces,"
John Wiley & Sons, KGaA, Weinheim.
[9] Usui, S., 1973, "Interaction of Electrical Double Layers at Constant Surface
Charge," Journal of Colloid and Interface Science, 44(1) pp. 107-113.
[10] Hogg, R., Healy, T. W., Fuerstenau, D. W., 1966, "Mutual Coagulation of
Colloidal Dispersions," Transactions of the Faraday Society, 62pp.
1638-1651.
[11] Kar, G., Chander, S., Mika, T. S., 1973, "The Potential Energy of Interaction
between Dissimilar Electrical Double Layers," Journal of Colloid and
Interface Science, 44(2) pp. 347-355.
[12] Drelich, J., Long, J., Yeung, A., 2007, "Determining Surface Potential of the
Bitumen-Water Interface at Nanoscale Resolution using Atomic Force
Microscopy," Canadian Journal of Chemical Engineering, 85(5) pp. 625-634.
-54-
*Published work: Yan, L., Englert, A. H., Masliyah, J. H., Xu, Z., 2011, Langmuir, 27(21).
Chapter 4
Determination of anisotropic surface charging
characteristics of different phyllosilicates by direct force
measurements: Effect of pH*
The work presented in this chapter comprise a detailed study of the effect of pH
on the anisotropic surface charge characteristic of two 2:1 layer (TOT) natural
minerals, talc and muscovite, as representatives of magnesium and aluminum
phyllosilicate minerals, respectively.
In this study, following the methodology described in Chapter 3 to prepare
smooth edge surface by the ultramicrotome cutting technique, probe the
interaction forces between the AFM tip and phyllosilicate basal/edge surfaces
using AFM and fit the measured force profiles with the classical DLVO theory,
the electrical surface potentials, or more precisely Stern potential of different talc
and muscovite surfaces in aqueous solutions of various pH values were
determined. The Stern potential of muscovite basal planes was found to be
significantly more negative than the basal plane of talc, both being pH insensitive.
In contrast, the Stern potential of edge surfaces was highly pH-dependent,
exhibiting a PZC of pH 7.5 and 8.1 for edges of muscovite and talc, respectively.
4.1 Introduction
To fundamentally understand the electrokinetic behaviour of phyllosilicate
minerals, it is necessary to study the anisotropic surface charge properties of
phyllosilicate surfaces.
Chapter 4 -55-
The stability of fine-grained phyllosilicate suspensions is determined largely by
the colloidal interactions between phyllosilicate particles. In order to accurately
predict phyllosilicates behaviour in industrial applications, an extensive
knowledge on anisotropic surface properties of phyllosilicates is essential.
As introduced in Chapter 2, AFM has been widely used to study surface
properties of phyllosilicate minerals. Various probe and flat phyllosilicate surface
systems such as illite-illite [1], talc-talc [2], silica-mica [3-4], pitch-talc [5] and
toner-talc [6] have been studied. AFM force measurements provide the possibility
to determine the Stern potential of minerals by fitting the force profiles obtained
in aqueous solutions with the DLVO theory. Normally the radius of the colloid
probe is around several micrometers, which is too large to allow for accurate
imaging of the surface where the force profiles are measured. On the other hand,
only very smooth surfaces of the root-mean-square (Rq) roughness less than l nm
can be studied using the AFM probe techniques [7]. To our knowledge, there are
quiet few investigations reported on using AFM colloid probe technique to study
the anisotropic character of phyllosilicates on specific basal planes and edge
surfaces [2, 4]. In the present study, the effect of pH on the anisotropic surface
charge properties of different phyllosilicate surfaces by direct interaction force
measurements are investigated, aiming to understand how these anisotropic
surface charge properties influence phyllosilicate behaviour in aqueous solutions.
In this study, an AFM tip instead of micron size particles is used as probe to
explore the mapping of heterogeneous surface charges on edge surfaces.
Commercial AFM tips have been widely used for probing the interactions on
various surfaces such as multiphase rock [8], kaolinite particles [9], silica plate
[10], bitumen [11] or nano particles [12]. The theoretical model for obtaining
Stern potential, from the measured force profiles is well developed and verified.
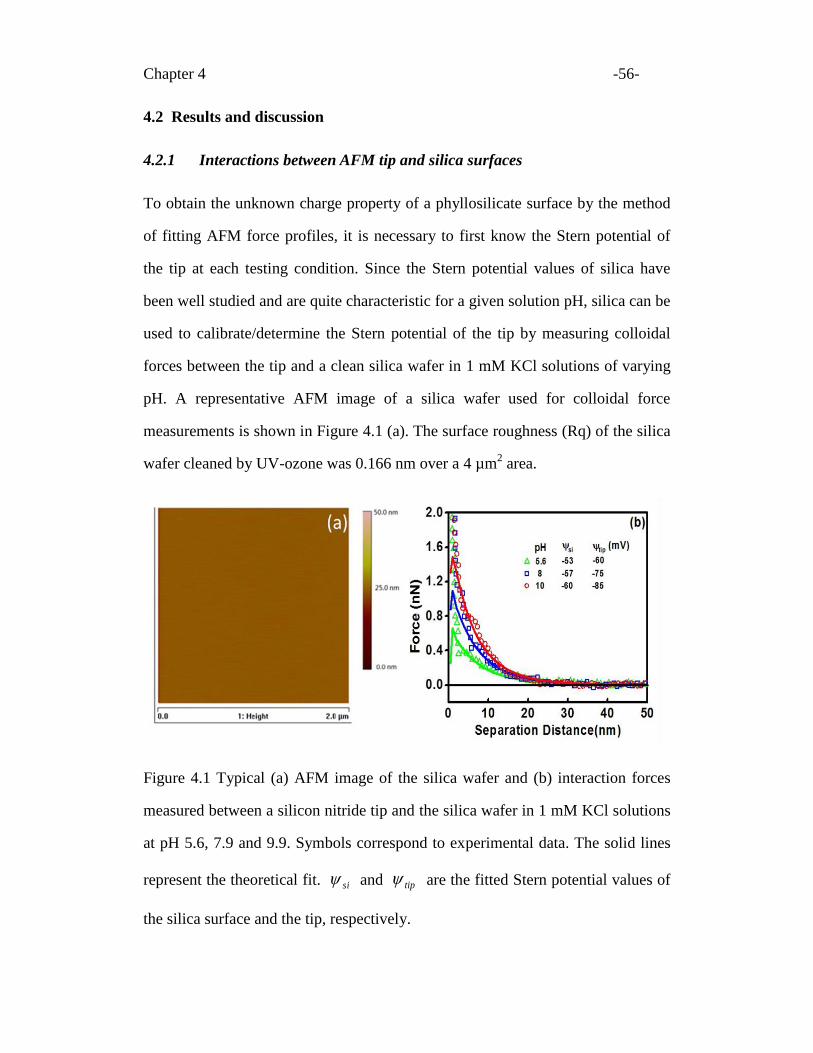
Chapter 4 -56-
4.2 Results and discussion
4.2.1 Interactions between AFM tip and silica surfaces
To obtain the unknown charge property of a phyllosilicate surface by the method
of fitting AFM force profiles, it is necessary to first know the Stern potential of
the tip at each testing condition. Since the Stern potential values of silica have
been well studied and are quite characteristic for a given solution pH, silica can be
used to calibrate/determine the Stern potential of the tip by measuring colloidal
forces between the tip and a clean silica wafer in 1 mM KCl solutions of varying
pH. A representative AFM image of a silica wafer used for colloidal force
measurements is shown in Figure 4.1 (a). The surface roughness (Rq) of the silica
wafer cleaned by UV-ozone was 0.166 nm over a 4 µm2 area.
Figure 4.1 Typical (a) AFM image of the silica wafer and (b) interaction forces
measured between a silicon nitride tip and the silica wafer in 1 mM KCl solutions
at pH 5.6, 7.9 and 9.9. Symbols correspond to experimental data. The solid lines
represent the theoretical fit. si and tip are the fitted Stern potential values of
the silica surface and the tip, respectively.
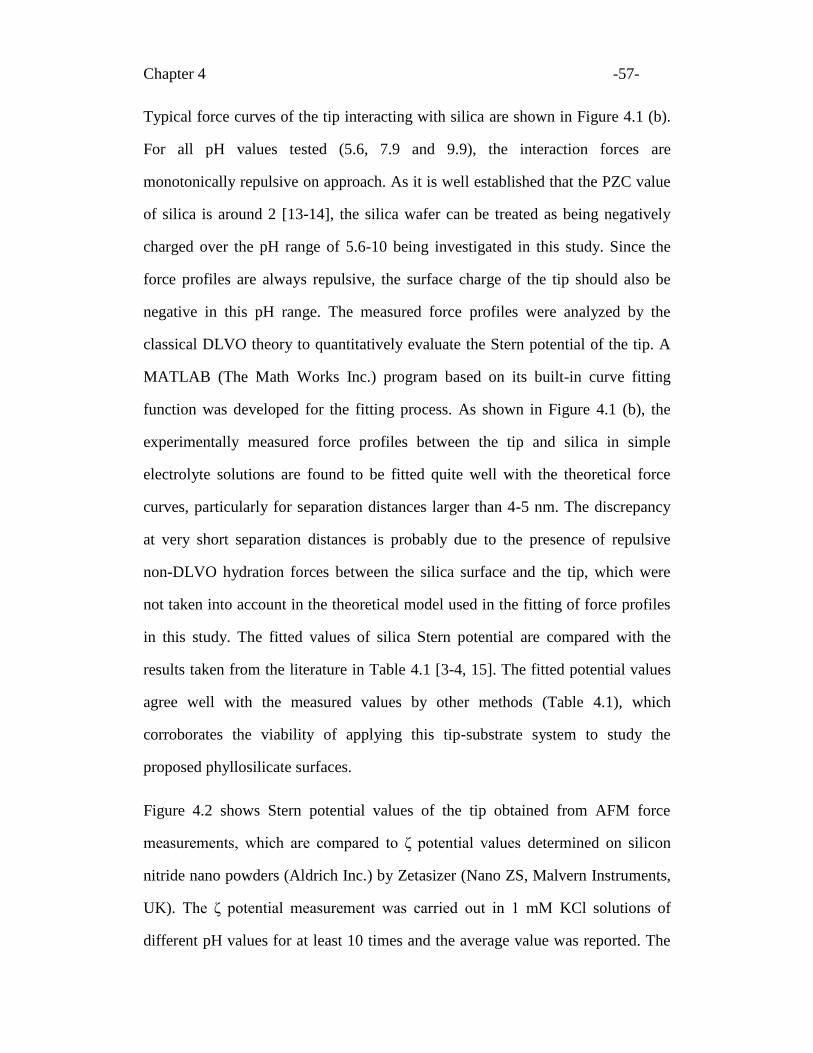
Chapter 4 -57-
Typical force curves of the tip interacting with silica are shown in Figure 4.1 (b).
For all pH values tested (5.6, 7.9 and 9.9), the interaction forces are
monotonically repulsive on approach. As it is well established that the PZC value
of silica is around 2 [13-14], the silica wafer can be treated as being negatively
charged over the pH range of 5.6-10 being investigated in this study. Since the
force profiles are always repulsive, the surface charge of the tip should also be
negative in this pH range. The measured force profiles were analyzed by the
classical DLVO theory to quantitatively evaluate the Stern potential of the tip. A
MATLAB (The Math Works Inc.) program based on its built-in curve fitting
function was developed for the fitting process. As shown in Figure 4.1 (b), the
experimentally measured force profiles between the tip and silica in simple
electrolyte solutions are found to be fitted quite well with the theoretical force
curves, particularly for separation distances larger than 4-5 nm. The discrepancy
at very short separation distances is probably due to the presence of repulsive
non-DLVO hydration forces between the silica surface and the tip, which were
not taken into account in the theoretical model used in the fitting of force profiles
in this study. The fitted values of silica Stern potential are compared with the
results taken from the literature in Table 4.1 [3-4, 15]. The fitted potential values
agree well with the measured values by other methods (Table 4.1), which
corroborates the viability of applying this tip-substrate system to study the
proposed phyllosilicate surfaces.
Figure 4.2 shows Stern potential values of the tip obtained from AFM force
measurements, which are compared to ζ potential values determined on silicon
nitride nano powders (Aldrich Inc.) by Zetasizer (Nano ZS, Malvern Instruments,
UK). The ζ potential measurement was carried out in 1 mM KCl solutions of
different pH values for at least 10 times and the average value was reported. The
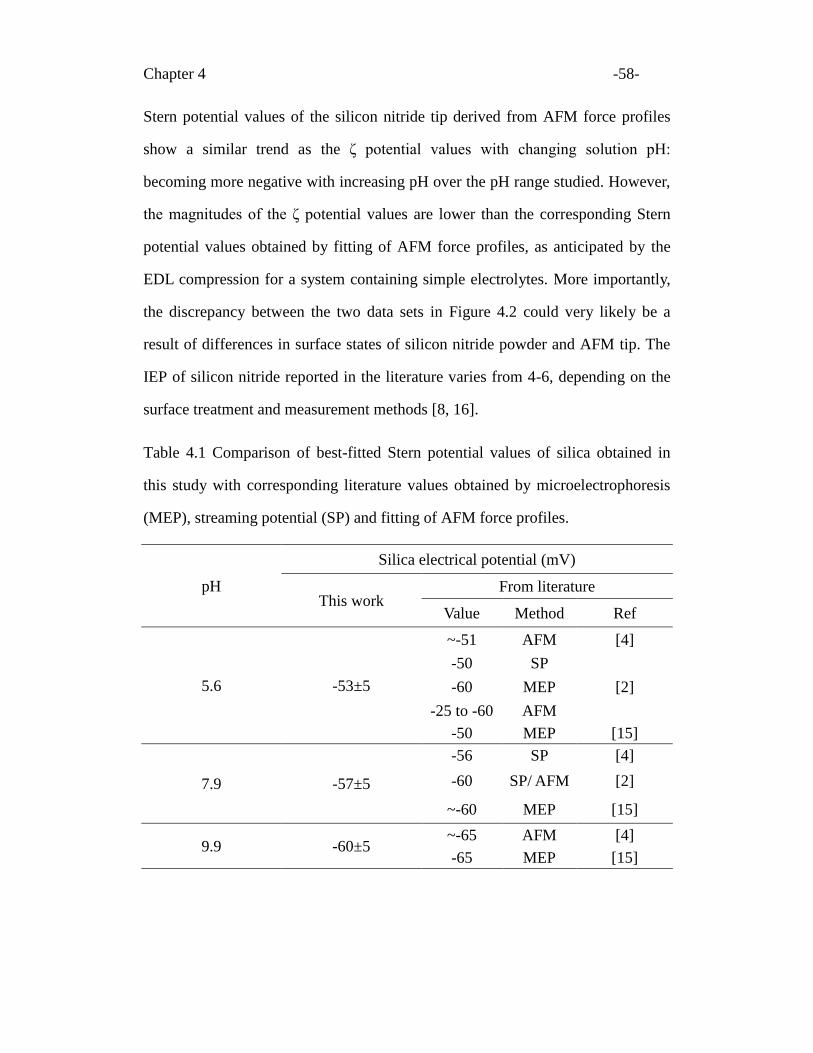
Chapter 4 -58-
Stern potential values of the silicon nitride tip derived from AFM force profiles
show a similar trend as the ζ potential values with changing solution pH:
becoming more negative with increasing pH over the pH range studied. However,
the magnitudes of the ζ potential values are lower than the corresponding Stern
potential values obtained by fitting of AFM force profiles, as anticipated by the
EDL compression for a system containing simple electrolytes. More importantly,
the discrepancy between the two data sets in Figure 4.2 could very likely be a
result of differences in surface states of silicon nitride powder and AFM tip. The
IEP of silicon nitride reported in the literature varies from 4-6, depending on the
surface treatment and measurement methods [8, 16].
Table 4.1 Comparison of best-fitted Stern potential values of silica obtained in
this study with corresponding literature values obtained by microelectrophoresis
(MEP), streaming potential (SP) and fitting of AFM force profiles.
pH
Silica electrical potential (mV)
This work From literature
Value Method Ref
5.6 -53±5
~-51 AFM [4]
-50 SP
[2] -60 MEP
-25 to -60 AFM
-50 MEP [15]
7.9 -57±5
-56 SP [4]
-60 SP/ AFM [2]
~-60 MEP [15]
9.9 -60±5 ~-65 AFM [4]
-65 MEP [15]
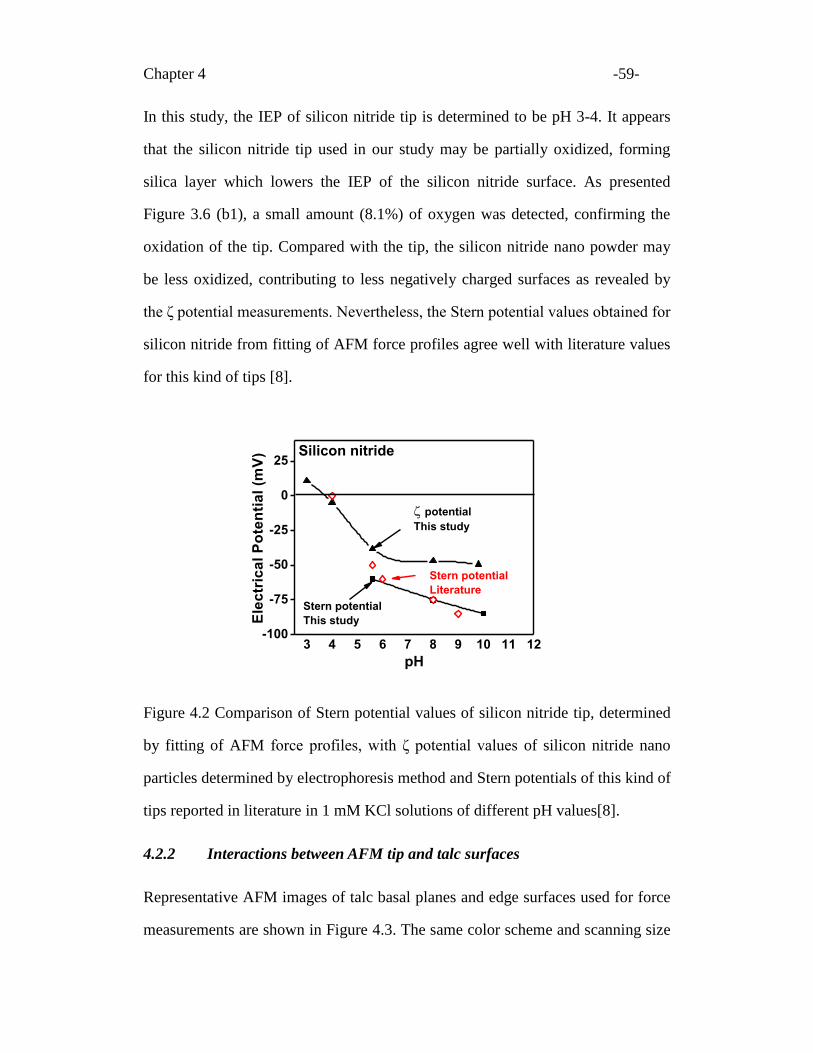
Chapter 4 -59-
In this study, the IEP of silicon nitride tip is determined to be pH 3-4. It appears
that the silicon nitride tip used in our study may be partially oxidized, forming
silica layer which lowers the IEP of the silicon nitride surface. As presented
Figure 3.6 (b1), a small amount (8.1%) of oxygen was detected, confirming the
oxidation of the tip. Compared with the tip, the silicon nitride nano powder may
be less oxidized, contributing to less negatively charged surfaces as revealed by
the ζ potential measurements. Nevertheless, the Stern potential values obtained for
silicon nitride from fitting of AFM force profiles agree well with literature values
for this kind of tips [8].
3 4 5 6 7 8 9 10 11 12-100
-75
-50
-25
0
25Silicon nitride
potential
This study
Stern potential
This studyEle
ctr
ica
l P
ote
nti
al
(mV
)
pH
Stern potential
Literature
Figure 4.2 Comparison of Stern potential values of silicon nitride tip, determined
by fitting of AFM force profiles, with ζ potential values of silicon nitride nano
particles determined by electrophoresis method and Stern potentials of this kind of
tips reported in literature in 1 mM KCl solutions of different pH values[8].
4.2.2 Interactions between AFM tip and talc surfaces
Representative AFM images of talc basal planes and edge surfaces used for force
measurements are shown in Figure 4.3. The same color scheme and scanning size
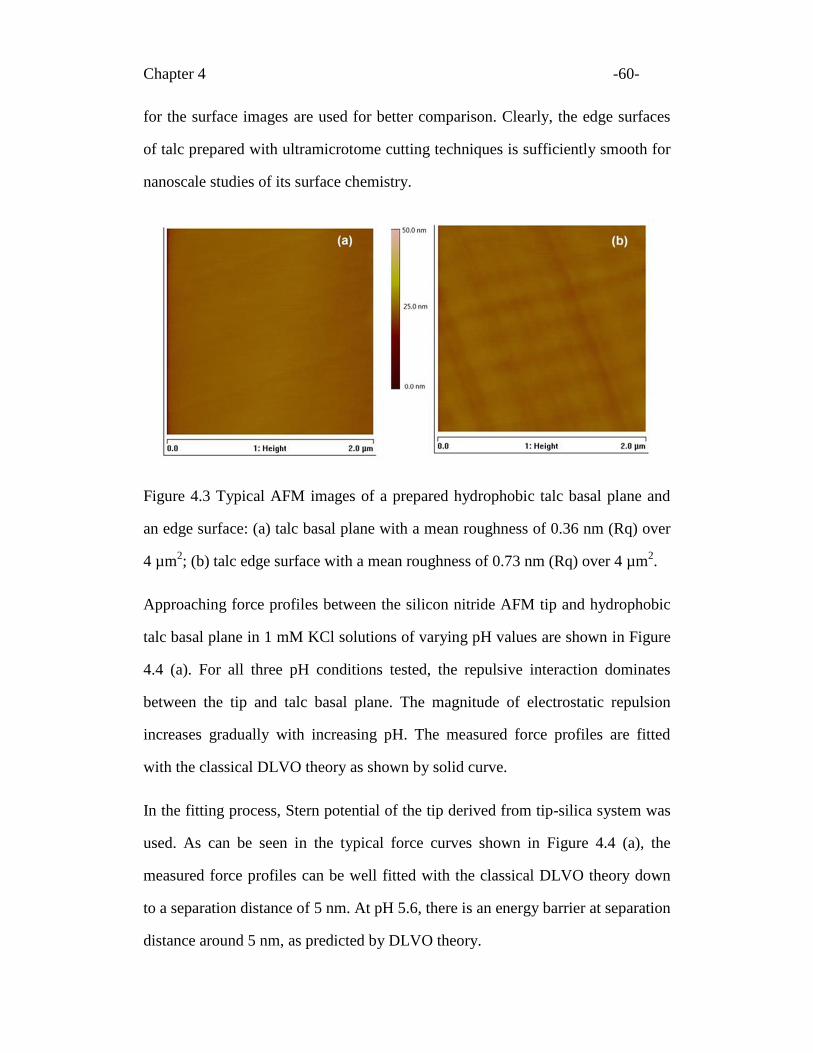
Chapter 4 -60-
for the surface images are used for better comparison. Clearly, the edge surfaces
of talc prepared with ultramicrotome cutting techniques is sufficiently smooth for
nanoscale studies of its surface chemistry.
Figure 4.3 Typical AFM images of a prepared hydrophobic talc basal plane and
an edge surface: (a) talc basal plane with a mean roughness of 0.36 nm (Rq) over
4 µm2; (b) talc edge surface with a mean roughness of 0.73 nm (Rq) over 4 µm
2.
Approaching force profiles between the silicon nitride AFM tip and hydrophobic
talc basal plane in 1 mM KCl solutions of varying pH values are shown in Figure
4.4 (a). For all three pH conditions tested, the repulsive interaction dominates
between the tip and talc basal plane. The magnitude of electrostatic repulsion
increases gradually with increasing pH. The measured force profiles are fitted
with the classical DLVO theory as shown by solid curve.
In the fitting process, Stern potential of the tip derived from tip-silica system was
used. As can be seen in the typical force curves shown in Figure 4.4 (a), the
measured force profiles can be well fitted with the classical DLVO theory down
to a separation distance of 5 nm. At pH 5.6, there is an energy barrier at separation
distance around 5 nm, as predicted by DLVO theory.
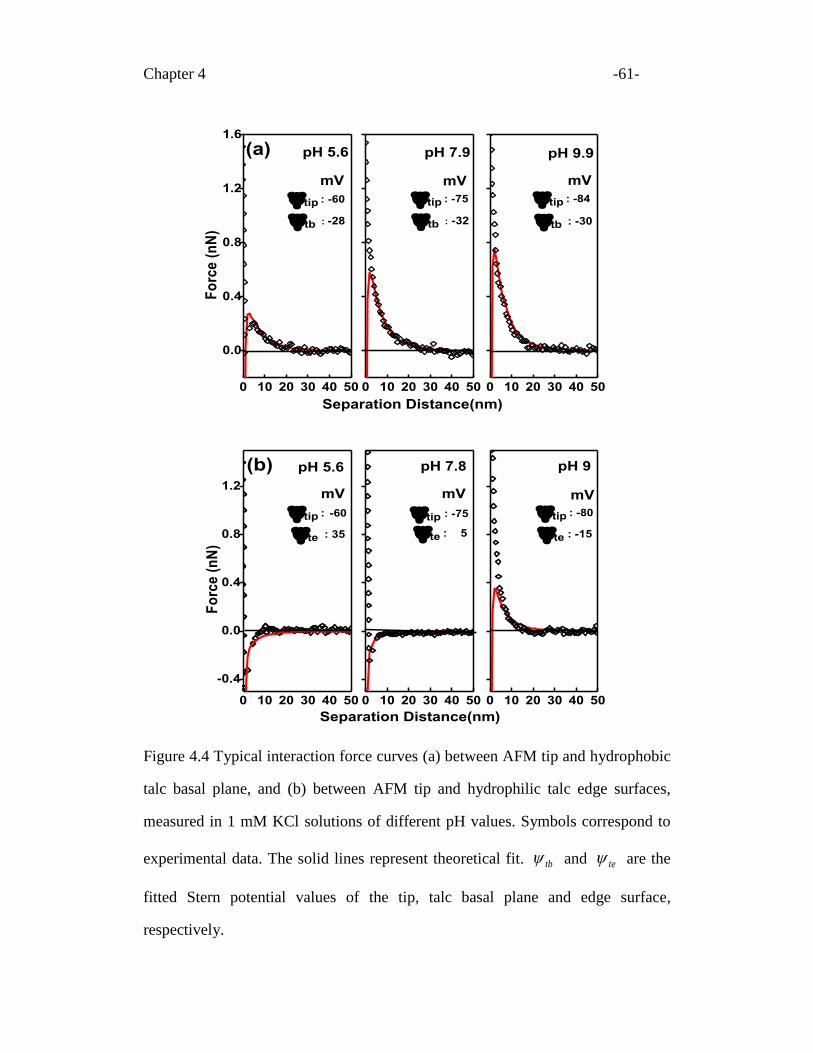
Chapter 4 -61-
0 10 20 30 40 50
0.0
0.4
0.8
1.2
1.6
0 10 20 30 40 500 10 20 30 40 50
tip : -60
pH 5.6
Fo
rce
(n
N)
tb : -28
mV
(a)
mV
pH 9.9
Separation Distance(nm)
tb : -30tb : -32
mV
tip : -84tip : -75
pH 7.9
0 10 20 30 40 50
-0.4
0.0
0.4
0.8
1.2
0 10 20 30 40 50 0 10 20 30 40 50
te : -15te : 5te : 35
tip : tip : -80
pH 5.6
Fo
rce
(n
N)
Separation Distance(nm)
-60
(b)
mV mVmV
tip : -75
pH 7.8
pH 9
Figure 4.4 Typical interaction force curves (a) between AFM tip and hydrophobic
talc basal plane, and (b) between AFM tip and hydrophilic talc edge surfaces,
measured in 1 mM KCl solutions of different pH values. Symbols correspond to
experimental data. The solid lines represent theoretical fit. tb and te are the
fitted Stern potential values of the tip, talc basal plane and edge surface,
respectively.
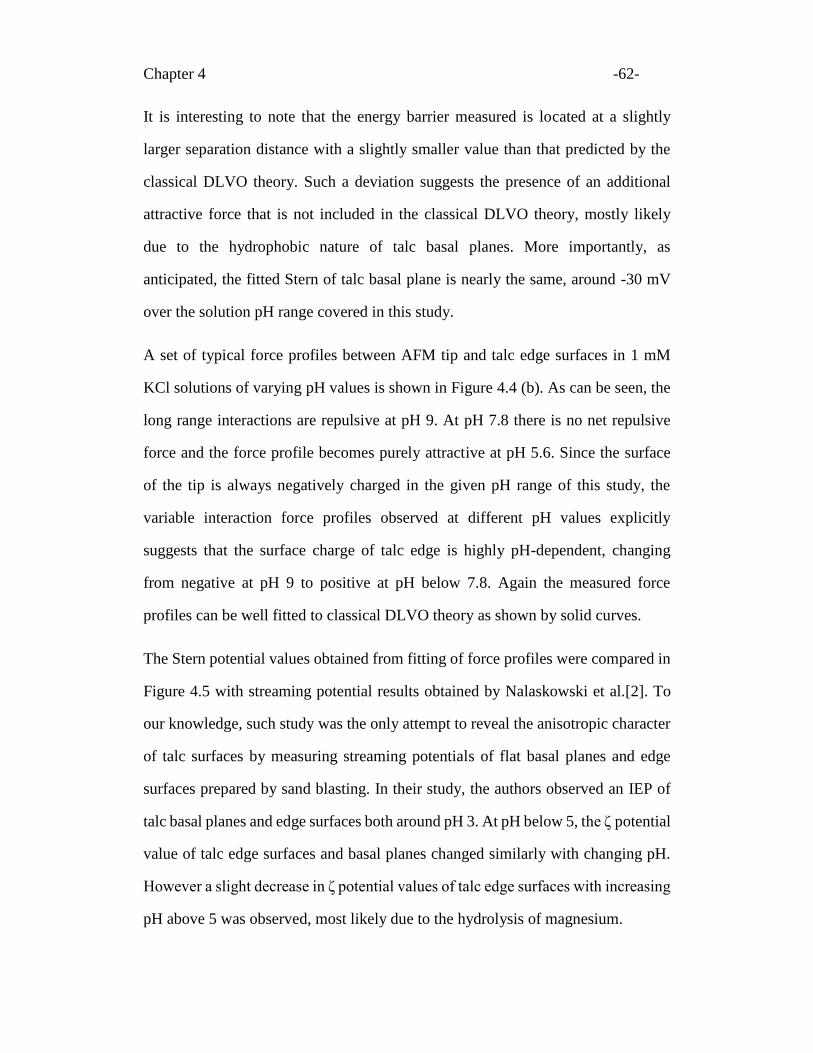
Chapter 4 -62-
It is interesting to note that the energy barrier measured is located at a slightly
larger separation distance with a slightly smaller value than that predicted by the
classical DLVO theory. Such a deviation suggests the presence of an additional
attractive force that is not included in the classical DLVO theory, mostly likely
due to the hydrophobic nature of talc basal planes. More importantly, as
anticipated, the fitted Stern of talc basal plane is nearly the same, around -30 mV
over the solution pH range covered in this study.
A set of typical force profiles between AFM tip and talc edge surfaces in 1 mM
KCl solutions of varying pH values is shown in Figure 4.4 (b). As can be seen, the
long range interactions are repulsive at pH 9. At pH 7.8 there is no net repulsive
force and the force profile becomes purely attractive at pH 5.6. Since the surface
of the tip is always negatively charged in the given pH range of this study, the
variable interaction force profiles observed at different pH values explicitly
suggests that the surface charge of talc edge is highly pH-dependent, changing
from negative at pH 9 to positive at pH below 7.8. Again the measured force
profiles can be well fitted to classical DLVO theory as shown by solid curves.
The Stern potential values obtained from fitting of force profiles were compared in
Figure 4.5 with streaming potential results obtained by Nalaskowski et al.[2]. To
our knowledge, such study was the only attempt to reveal the anisotropic character
of talc surfaces by measuring streaming potentials of flat basal planes and edge
surfaces prepared by sand blasting. In their study, the authors observed an IEP of
talc basal planes and edge surfaces both around pH 3. At pH below 5, the ζ potential
value of talc edge surfaces and basal planes changed similarly with changing pH.
However a slight decrease in ζ potential values of talc edge surfaces with increasing
pH above 5 was observed, most likely due to the hydrolysis of magnesium.
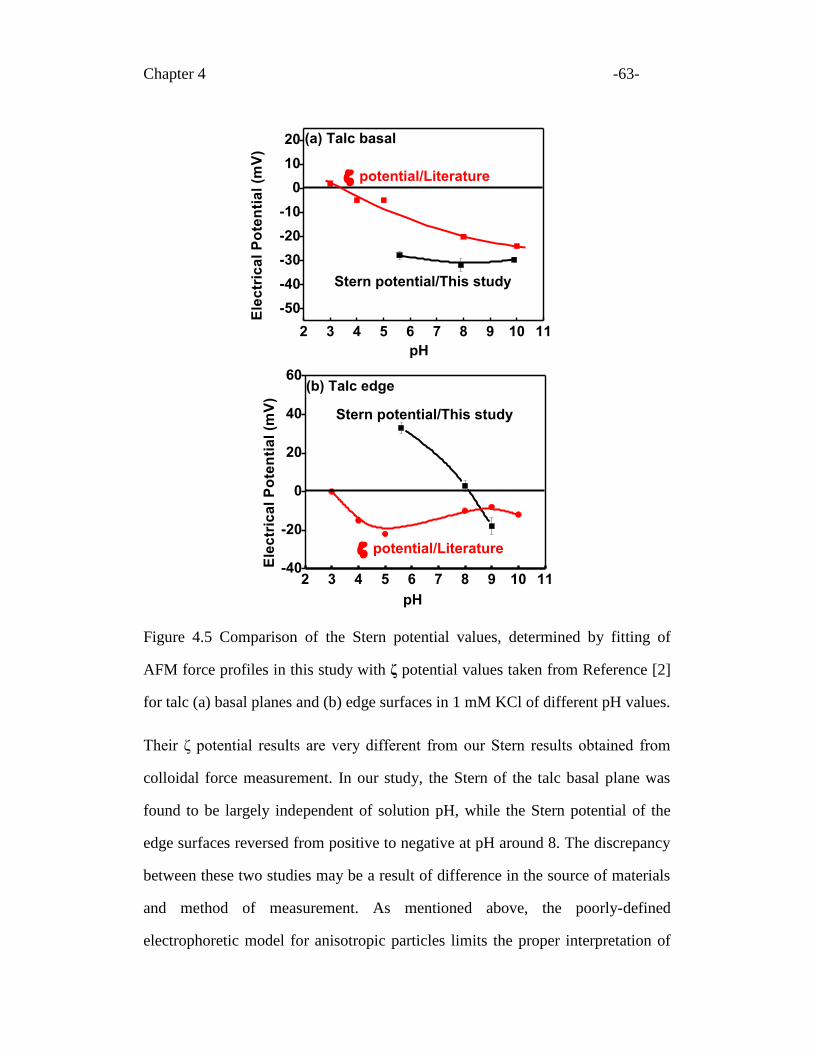
Chapter 4 -63-
Figure 4.5 Comparison of the Stern potential values, determined by fitting of
AFM force profiles in this study with ζ potential values taken from Reference [2]
for talc (a) basal planes and (b) edge surfaces in 1 mM KCl of different pH values.
Their ζ potential results are very different from our Stern results obtained from
colloidal force measurement. In our study, the Stern of the talc basal plane was
found to be largely independent of solution pH, while the Stern potential of the
edge surfaces reversed from positive to negative at pH around 8. The discrepancy
between these two studies may be a result of difference in the source of materials
and method of measurement. As mentioned above, the poorly-defined
electrophoretic model for anisotropic particles limits the proper interpretation of
2 3 4 5 6 7 8 9 10 11-40
-20
0
20
40
60
potential/Literature
Stern potential/This study
pH
Ele
ctr
ica
l P
ote
nti
al
(mV
)
(b) Talc edge
2 3 4 5 6 7 8 9 10 11
-50
-40
-30
-20
-10
0
10
20
Stern potential/This study
pH
Ele
ctr
ica
l P
ote
nti
al
(mV
)
potential/Literature
(a) Talc basal
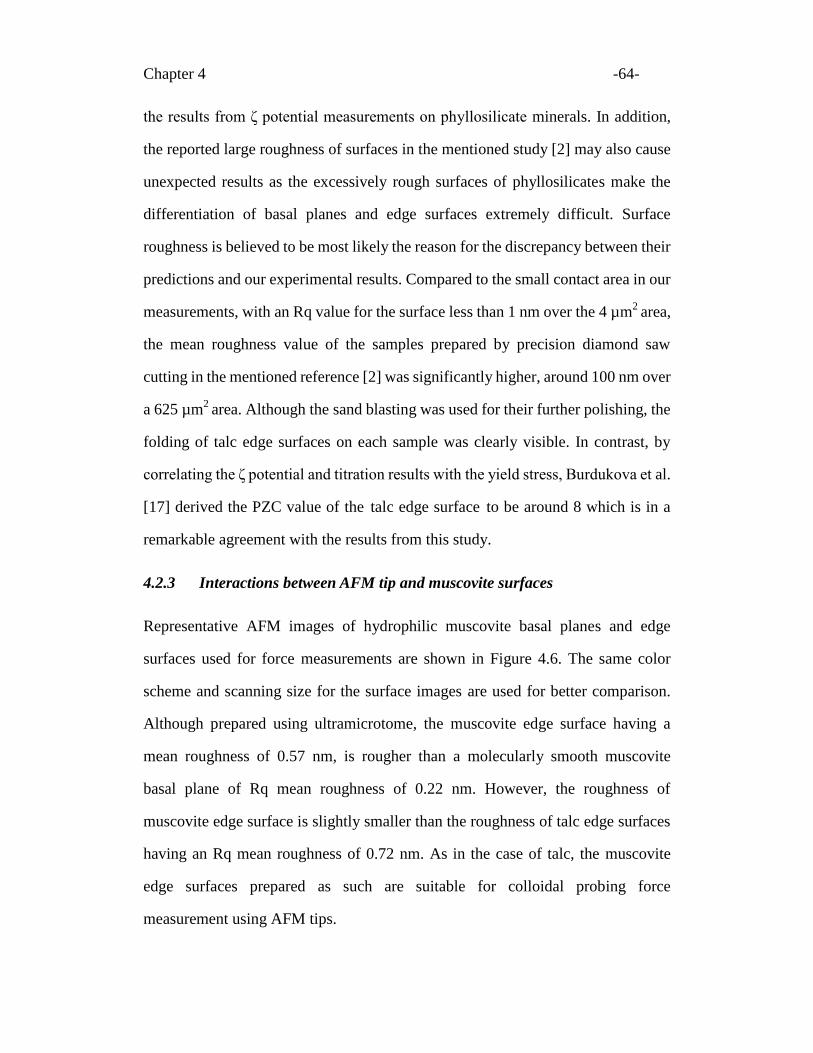
Chapter 4 -64-
the results from ζ potential measurements on phyllosilicate minerals. In addition,
the reported large roughness of surfaces in the mentioned study [2] may also cause
unexpected results as the excessively rough surfaces of phyllosilicates make the
differentiation of basal planes and edge surfaces extremely difficult. Surface
roughness is believed to be most likely the reason for the discrepancy between their
predictions and our experimental results. Compared to the small contact area in our
measurements, with an Rq value for the surface less than 1 nm over the 4 µm2
area,
the mean roughness value of the samples prepared by precision diamond saw
cutting in the mentioned reference [2] was significantly higher, around 100 nm over
a 625 µm2
area. Although the sand blasting was used for their further polishing, the
folding of talc edge surfaces on each sample was clearly visible. In contrast, by
correlating the ζ potential and titration results with the yield stress, Burdukova et al.
[17] derived the PZC value of the talc edge surface to be around 8 which is in a
remarkable agreement with the results from this study.
4.2.3 Interactions between AFM tip and muscovite surfaces
Representative AFM images of hydrophilic muscovite basal planes and edge
surfaces used for force measurements are shown in Figure 4.6. The same color
scheme and scanning size for the surface images are used for better comparison.
Although prepared using ultramicrotome, the muscovite edge surface having a
mean roughness of 0.57 nm, is rougher than a molecularly smooth muscovite
basal plane of Rq mean roughness of 0.22 nm. However, the roughness of
muscovite edge surface is slightly smaller than the roughness of talc edge surfaces
having an Rq mean roughness of 0.72 nm. As in the case of talc, the muscovite
edge surfaces prepared as such are suitable for colloidal probing force
measurement using AFM tips.
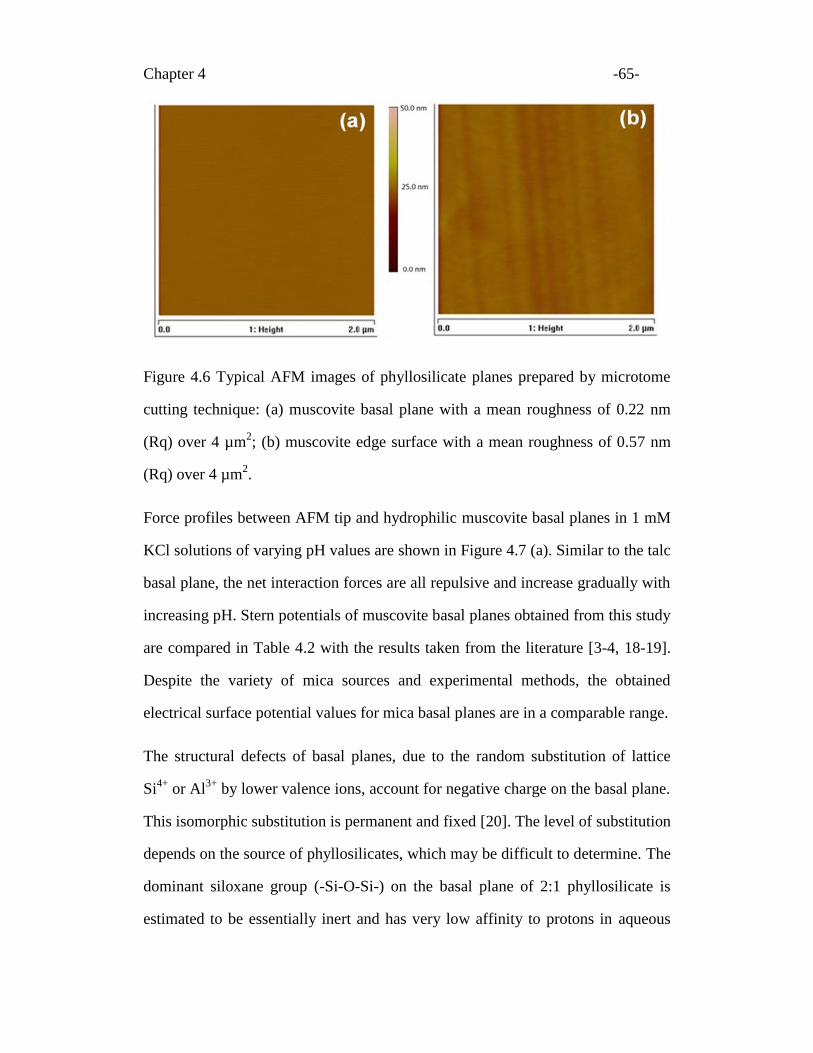
Chapter 4 -65-
Figure 4.6 Typical AFM images of phyllosilicate planes prepared by microtome
cutting technique: (a) muscovite basal plane with a mean roughness of 0.22 nm
(Rq) over 4 µm2; (b) muscovite edge surface with a mean roughness of 0.57 nm
(Rq) over 4 µm2.
Force profiles between AFM tip and hydrophilic muscovite basal planes in 1 mM
KCl solutions of varying pH values are shown in Figure 4.7 (a). Similar to the talc
basal plane, the net interaction forces are all repulsive and increase gradually with
increasing pH. Stern potentials of muscovite basal planes obtained from this study
are compared in Table 4.2 with the results taken from the literature [3-4, 18-19].
Despite the variety of mica sources and experimental methods, the obtained
electrical surface potential values for mica basal planes are in a comparable range.
The structural defects of basal planes, due to the random substitution of lattice
Si4+
or Al3+
by lower valence ions, account for negative charge on the basal plane.
This isomorphic substitution is permanent and fixed [20]. The level of substitution
depends on the source of phyllosilicates, which may be difficult to determine. The
dominant siloxane group (-Si-O-Si-) on the basal plane of 2:1 phyllosilicate is
estimated to be essentially inert and has very low affinity to protons in aqueous
Chapter 4 -66-
media of mild acidity or alkalinity [20]. The observed pH independence of the
Stern potential values derived from our experimental colloidal force profiles for
both the talc and muscovite basal planes supports the absence of the significant
protonation on phyllosilicate basal planes at solution pH studied. The isomorphic
substitution is believed to be the main cause for the basal plane charges. In a
recent report, Gupta et al. [9] showed that the Stern potential on a silica
tetrahedral layer of kaolinite is pH dependent. They attributed the observed pH
dependency to the possibility of broken bonds on the basal planes and/or
hydrolysis of siloxane bonds in strong acidic and alkaline environment.
Although both phyllosilicate basal surfaces show similar pH-independent
properties, the magnitude of the negative Stern potential on muscovite basal
planes is nearly twice that on talc basal planes. This means that these two different
phyllosilicates have different levels of isomorphic substitution, albeit with the
same charge mechanism. For most common mica minerals such as muscovite, the
ratio of the Al3+
substitution for Si4+
on the T basal plane is close to 1:3, which is
responsible for highly negative Stern potential values [21]. Talc, in contrast to
muscovite, has a much lower isomorphic substation ratio. Depending on the
source, the cation substitution in the tetrahedral layers may vary from 0.01% to
3.4% [22]. The majority of researchers believe that the talc basal plane is almost
electrically neutral because of its extremely low isomorphic substitution [18, 21].
Burdukova et al. [17] studied the coagulation behaviour of talc particles by
measuring the yield stress of talc suspensions as a function of pH. The
coagulation performance strongly indicated the presence of negative charges on
talc basal planes. The authors performed a microprobe analysis on the polished
thin talc section by analyzing the X-ray emission of each individual element and
found the cation substitution ratio in the tetrahedral layer to be as small as 0.38%.
Chapter 4 -67-
Based on their results, they proposed that even a small degree of isomorphic
substitution was sufficient to generate a negative charge on talc basal planes. In
their study, only the overall surface potential of both basal planes and edge
surfaces was evaluated. The Stern potential on each surface remains unknown. In
our study, a trace amount of iron was also detected in talc basal plane as shown by
XPS results and the cation substitution in the tetrahedral layer is around 1.9%. It
was verified that talc basal planes do carry a definite negative charge by
performing direct force measurements on the surface. The magnitude of charges
on each surface is determined and quantified. The fitting of measured force profile
with the theoretical model may not lead to the exact Stern potential values as only
the BC is applied in the calculations. It does however aid in quantitative
comparisons of the charge properties of each surface with the consistent use of the
same evaluation procedure.
A set of typical force profiles between the tip and the muscovite edge surface in 1
mM KCl solutions of varying pH values is shown in Figure 4.7 (b). These force
profiles are similar to the interactions between AFM tip and talc edge surface, as
shown in Figure 4.4 (b). The transition from a net attractive to a net repulsive
interaction force between the tip and muscovite edge surface is clearly observed.
The attractive interaction dominates at pH 5.6. The interaction force is reversed to
be repulsive in electrolyte solutions of pH 8 and becomes increasingly more
repulsive with further increasing pH up to 9. The observed transition of
interaction forces from attractive to repulsive with increasing solution pH strongly
suggests that the surface charge of muscovite edges is also pH-dependent. The
PZC of the muscovite edge surface is estimated to be between pH 7-8. This value
is in an excellent agreement with the PZC value obtained by Zhao et al. [17] who
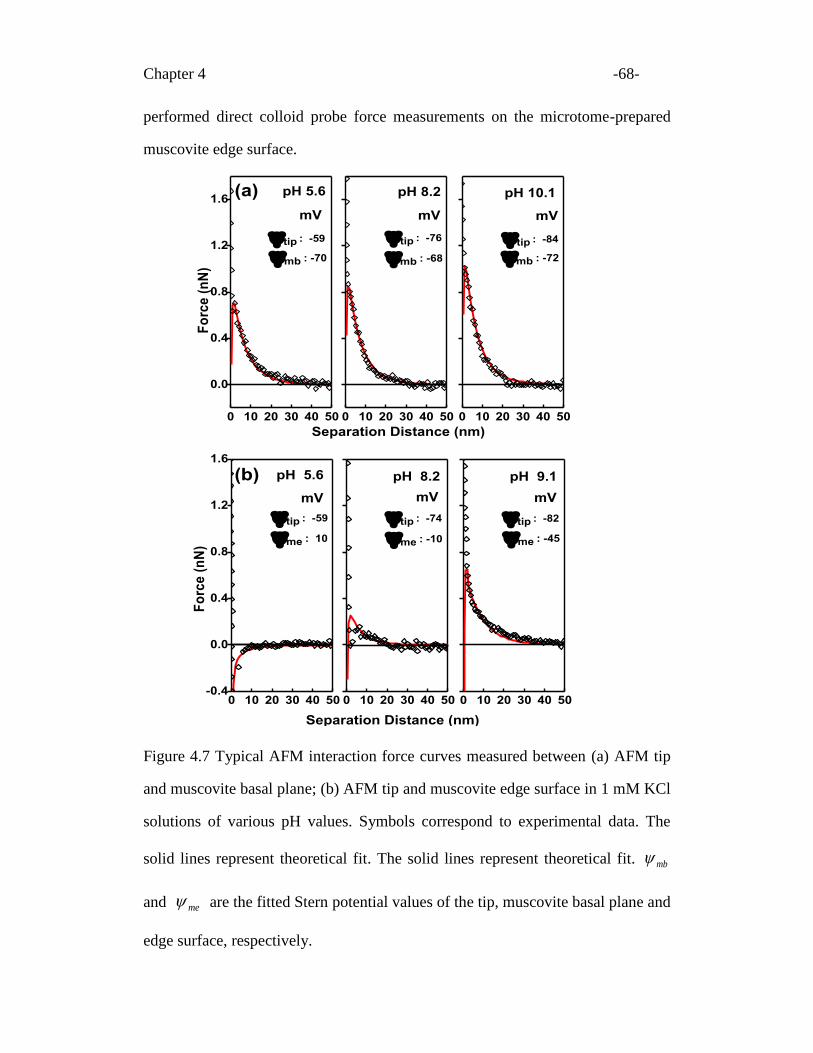
Chapter 4 -68-
performed direct colloid probe force measurements on the microtome-prepared
muscovite edge surface.
Figure 4.7 Typical AFM interaction force curves measured between (a) AFM tip
and muscovite basal plane; (b) AFM tip and muscovite edge surface in 1 mM KCl
solutions of various pH values. Symbols correspond to experimental data. The
solid lines represent theoretical fit. The solid lines represent theoretical fit. mb
and me are the fitted Stern potential values of the tip, muscovite basal plane and
edge surface, respectively.
0 10 20 30 40 50
0.0
0.4
0.8
1.2
1.6
0 10 20 30 40 50 0 10 20 30 40 50
mb : -72mb : -68
tip : -84tip : -76
mVmV
pH 5.6F
orc
e (
nN
)
Separation Distance (nm)
(a)
pH 8.2
pH 10.1
mb : -70
tip : -59
mV
0 10 20 30 40 50-0.4
0.0
0.4
0.8
1.2
1.6
0 10 20 30 40 50 0 10 20 30 40 50
Fo
rce
(n
N)
tip : -74 tip : -82
mVmV
pH 5.6
mV
tip : -59
me : 10
(b)
Separation Distance (nm)
me : -45me : -10
pH 9.1pH 8.2
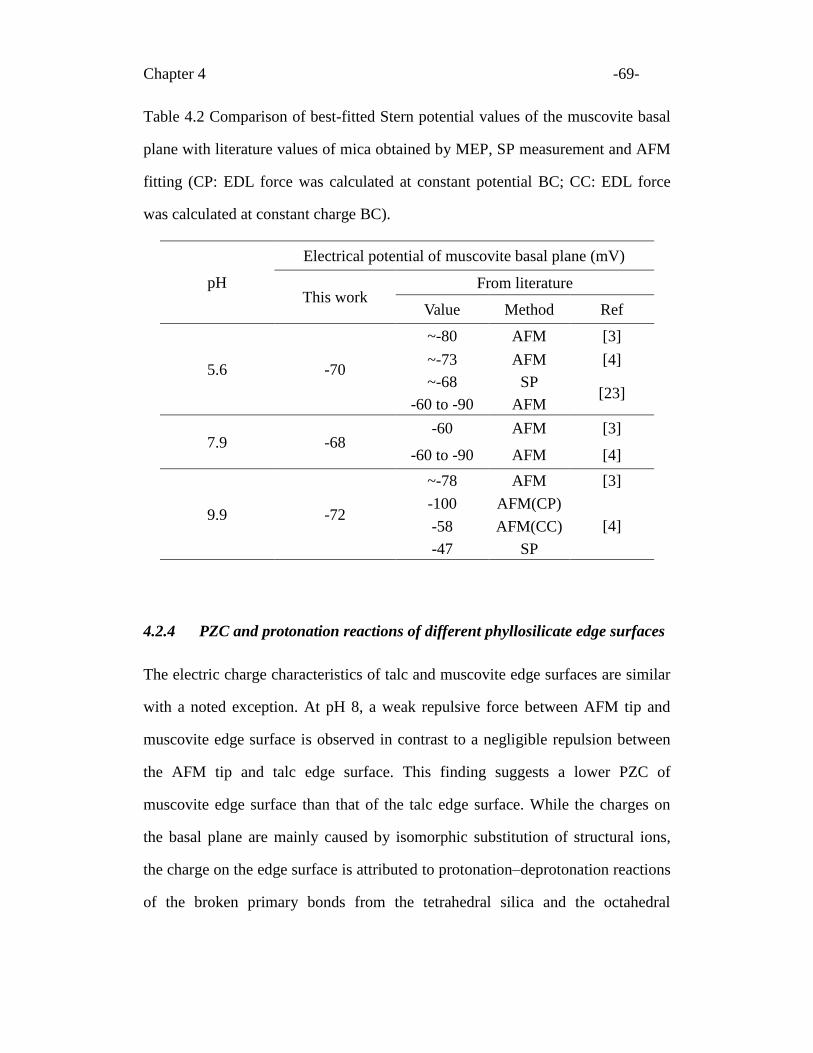
Chapter 4 -69-
Table 4.2 Comparison of best-fitted Stern potential values of the muscovite basal
plane with literature values of mica obtained by MEP, SP measurement and AFM
fitting (CP: EDL force was calculated at constant potential BC; CC: EDL force
was calculated at constant charge BC).
pH
Electrical potential of muscovite basal plane (mV)
This work From literature
Value Method Ref
5.6 -70
~-80 AFM [3]
~-73 AFM [4]
~-68 SP [23]
-60 to -90 AFM
7.9 -68 -60 AFM [3]
-60 to -90 AFM [4]
9.9 -72
~-78 AFM [3]
-100 AFM(CP)
[4] -58 AFM(CC)
-47 SP
4.2.4 PZC and protonation reactions of different phyllosilicate edge surfaces
The electric charge characteristics of talc and muscovite edge surfaces are similar
with a noted exception. At pH 8, a weak repulsive force between AFM tip and
muscovite edge surface is observed in contrast to a negligible repulsion between
the AFM tip and talc edge surface. This finding suggests a lower PZC of
muscovite edge surface than that of the talc edge surface. While the charges on
the basal plane are mainly caused by isomorphic substitution of structural ions,
the charge on the edge surface is attributed to protonation–deprotonation reactions
of the broken primary bonds from the tetrahedral silica and the octahedral
Chapter 4 -70-
gibbsite/brucite sheets. The basic charging reactions of proton adsorption can be
formulated as equation (1.1) as mentioned in Chapter 1.
For many metal oxide minerals, the surface potential can be approximated by the
Nernstian equation [19]. The surface potential is positive when the pH of the
solution is lower than the PZC and negative when the pH is higher than PZC. As
mentioned earlier, the PZC is an important parameter that determines
electrochemical phenomena, such as adsorption and coagulation, and controls
interactions between phyllosilicate particles. The PZC value of silica is around 2
[13, 24]. The PZC of gibbsite and brucite were reported to be around 8.4-9.1 [14]
and 11 [25], respectively. The reported PZC values of phyllosilicate minerals vary
widely from pH 1 to 8 depending on the type of phyllosilicates and measurement
methods, with the most frequently reported PZC values being observed between
pH 6-8.5 [26, 27]. The difference between the reported PZC values can be
attributed to different phyllosilicate structures, different degree of isomorphic
substitution in phyllosilicate structure and reactive groups on phyllosilicate edge
surfaces.
On phyllosilicate edge surfaces, each reactive surface group has its own intrinsic
chemical protonation constant (KH) associated with specific surface sites, e.g.,
Mg-OH in brucite vs Al-OH in gibbsite. Classical site binding models assume
only one type of surface group which is reactive to protons in two consecutive
steps, each with its own binding constant to impart surface charges. In general, the
difference in protonation constants between the two successive protonation steps
of the same surface group is expected to be so large that only one protonation
reaction dominates over a given pH window. Therefore, a single protonation
reaction is usually sufficient for describing the pristine surface charging [13].
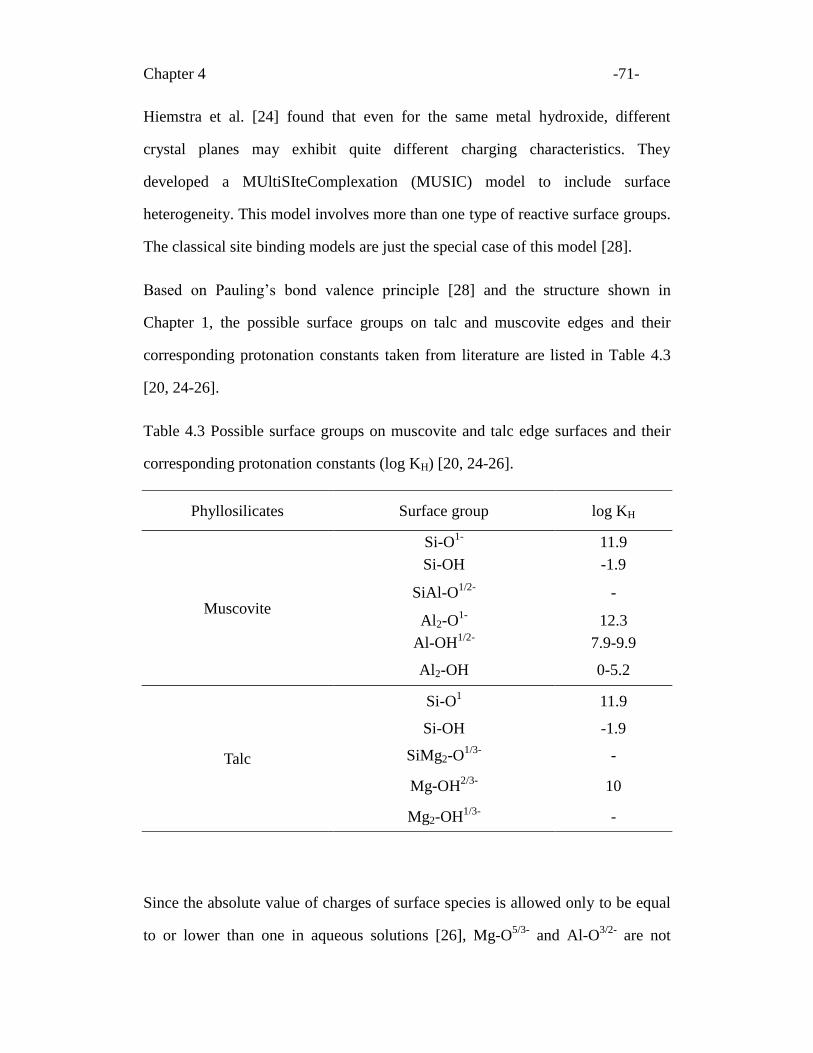
Chapter 4 -71-
Hiemstra et al. [24] found that even for the same metal hydroxide, different
crystal planes may exhibit quite different charging characteristics. They
developed a MUltiSIteComplexation (MUSIC) model to include surface
heterogeneity. This model involves more than one type of reactive surface groups.
The classical site binding models are just the special case of this model [28].
Based on Pauling’s bond valence principle [28] and the structure shown in
Chapter 1, the possible surface groups on talc and muscovite edges and their
corresponding protonation constants taken from literature are listed in Table 4.3
[20, 24-26].
Table 4.3 Possible surface groups on muscovite and talc edge surfaces and their
corresponding protonation constants (log KH) [20, 24-26].
Phyllosilicates Surface group log KH
Muscovite
Si-O1-
11.9
Si-OH -1.9
SiAl-O1/2-
-
Al2-O1-
12.3
Al-OH1/2-
7.9-9.9
Al2-OH 0-5.2
Talc
Si-O1 11.9
Si-OH -1.9
SiMg2-O1/3-
-
Mg-OH2/3-
10
Mg2-OH1/3-
-
Since the absolute value of charges of surface species is allowed only to be equal
to or lower than one in aqueous solutions [26], Mg-O5/3-
and Al-O3/2-
are not
Chapter 4 -72-
found at the interface in aqueous solutions. At least three types of surface groups
(singly, doubly and triply coordinated) may be found on talc or muscovite edge
surfaces. The groups that populate a talc edge surface are Si-OH, Si-O1-
,
SiMg2-O1/3-
, Mg2-OH1/3-
and Mg-OH2/3-
, and on muscovite edge surfaces they are
Si-OH, Si-O1-
, SiAl-O1/2-
, Al2-O1-
, Al2-OH, and Al-OH1/2-
. The singly coordinated
group is nearly always protonated due to its large protonation constant and is
considered to dominate the charging mechanism of the surface. The SiOH group
from the tetrahedral sheet has a log KH equal to -1.9, indicating a significantly
protonated surface only at H+ concentration greater than almost 10
1.9 (79.4) mol/L,
which is unrealistic as considering the fact that mole concentration of the pure
HCl is just 40.9 mol/L. Therefore, the de-protonation of Si-OH to Si-O1-
contributes to negative surface charges observed in the pH range studied. The
major protonation reactions on talc and muscovite edge surfaces are expected to
come from Mg-OH2/3-
and Al-OH1/2-
surface groups, respectively.
According to literature [28], both Mg-OH2/3-
and Al-OH1/2-
sites become
positively charged at pH values lower than 10, through the following site binding
reactions:
3
1
23
2
MgOHHMgOH (4.1)
2
1
22
1
AlOHHAlOH (4.2)
Different protonation constants of Al-OH1/2-
were derived from calculations using
different site binding models. The protonation constant of Al-OH1/2-
is often
considered to be lower than that of Mg-OH2/3-
, which accounts for lower PZC
values of gibbsite than that of brucite [24-25]. Since the positive charges on talc
and muscovite edge surfaces are mainly attributed to the protonation of singly
Chapter 4 -73-
coordinated Mg-OH2/3-
and Al-OH1/2-
groups, respectively, the difference in the
protonation constants of these two edge surface groups explains why at a given
pH talc edge surface is more positively charged than muscovite edge surface,
leading to a higher PZC value for talc edge surface than for muscovite edge
surface. In addition to protonation reactions of the singly coordinated groups on
phyllosilicate edge surfaces, the doubly coordinated surface groups, such as
SiAl-O1/2-
, Al2-OH, Al2-O1-
and Mg2-OH1/3-
, may also become protonated or
deprotonated at a given pH. For example, a proton can be attached to an Al2-OH
group at low pH to become Al2-OH2+. The protonation of Al2-OH, SiAl-O
1/2- or
Mg2-OH1/3-
surface groups, therefore also contributes to positive charges on edge
surfaces. However, the reactivity of these doubly coordinated surface groups is
believed to be suppressed by a singly coordinated group at high pH [26]. At
present, there is no well-accepted theoretical estimation or experimental
determination of the protonation constant for such transitional groups as
SiMg2-O1/3-
and SiAl-O1/2-
. Proton adsorption at a triply coordinated surface group
does not occur over the normal pH range encountered as its protonation constant
is extremely low [24]. As a result, the influence on surface charge from this kind
of groups can be neglected.
The increased dissolution of structural metal hydroxide with decreasing pH or
specific adsorption of Mg2+
on the talc edge surface may also contribute to the
observed difference in the PZC values between talc and muscovite edge surfaces
[24, 29]. Although it is believed that protons at low pH and hydroxyl groups at
high pH participate in the dissolution process, the detailed dissolution mechanism
of metal hydroxides remains to be established [24, 26].
Chapter 4 -74-
4.3 Summary
Thanks to the state-of-the-art ultramicrotome to prepare sufficiently smooth talc
and muscovite edge surfaces, commercial AFM tips are used in commercial
scanning probe microscope to quantitatively probe the surface charge properties
of two typical 2:1 layer phyllosilicates: talc and muscovite. The surface roughness
provided by this technique is much lower than other sample preparation methods
such as sandblasting or precision diamond saw cutting.
The measured interaction force profiles between AFM tip and phyllosilicate basal
planes and edge surfaces were fitted with the classical DLVO theory without
incurring complex finite element analysis applied to reconstruct surfaces. On the
basis of measured interaction forces between the tip and different phyllosilicate
surfaces, the Stern potential of talc and muscovite surfaces are determined. The
basal planes of talc are found to carry a permanent negative charge while the
charges on its edge surfaces are highly pH-dependent.
The long range interaction forces between AFM tip and talc edge surfaces are
repulsive at pH 9, reduces to nearly zero at pH 8.0 and be attractive at pH 5.6. It is
the first time that the magnitudes of Stern potential of the talc edge surface is
determined by direct force measurement. The similar trend has been observed for
basal plane and edge surfaces of muscovite. However, the basal plane of
muscovite has been found to be much more negative than that of talc, attributed to
a much higher isomorphic substitution in muscovite than in talc. The PZC of
muscovite edge surface, on the other hand, is lower than the corresponding PZC
for the edge surfaces of talc, which is attributed to higher protonation constant of
magnesium hydroxide in talc than aluminum hydroxide in muscovite.
Chapter 4 -75-
4.4 References
[1] Long, J., Xu, Z., Mashyah, J. H., 2006, "Role of Illite-Illite Interactions in Oil
Sands Processing," Colloids and Surfaces A-Physicochemical and
Engineering Aspects, 281(1-3) pp. 202-214.
[2] Nalaskowski, J., Abdul, B., Du, H., Miller, J. D., 2007, "Anisotropic Character
of Talc Surfaces as Revealed by Streaming Potential Measurements, Atomic
Force Microscopy, Molecular Dynamics Simulations and Contact Angle
Measurements," Canadian Metallurgical Quarterly, 46(3) pp. 227-235.
[3] Hartley, P. G., Larson, I., Scales, P. J., 1997, "Electrokinetic and Direct Force
Measurements between Silica and Mica Surfaces in Dilute Electrolyte,
Solutions," Langmuir, 13(8) pp. 2207-2214.
[4] Zhao, H., Bhattacharjee, S., Chow, R., Wallace, D., Masliyah, J. H., Xu, Z.,
2008, "Probing Surface Charge Potentials of Clay Basal Planes and Edges by
Direct Force Measurements," Langmuir, 24(22) pp. 12899-12910.
[5] Wallqvist, V., Claesson, P. M., Swerin, A., Schoelkopf, J., Gane, P. A. C.,
2007, "Interaction Forces between Talc and Pitch Probed by Atomic Force
Microscopy," Langmuir, 23(8) pp. 4248-4256.
[6] Chi, R., Xu, Z., DiFeo, T., Finch, J. A., Yordan, J. L., 2001, "Measurement of
Interaction Forces between Talc and Toner Particles," Journal of Pulp and
Paper Science, 27(5) pp. 152-157.
[7] Lin, X. Y., Creuzet, F., Arribart, H., 1993, "Atomic Force Microscopy for
Local Characterization of Surface Acid-Base Properties," Journal of Physical
Chemistry, 97(28) pp. 7272-7276.
[8] Yin, X., Drelich, J., 2008, "Surface Charge Microscopy: Novel Technique for
Mapping Charge-Mosaic Surfaces in Electrolyte Solutions," Langmuir, 24(15)
pp. 8013-8020.
[9] Gupta, V., Miller, J. D., 2010, "Surface Force Measurements at the Basal
Planes of Ordered Kaolinite Particles," Journal of Colloid and Interface
Science, 344(2) pp. 362-371.
[10] Long, J., Xu, Z., Masliyah, J. H., 2006, "Adhesion of Single Polyelectrolyte
Molecules on Silica, Mica, and Bitumen Surfaces," Langmuir, 22(4) pp.
1652-1659.
Chapter 4 -76-
[11] Drelich, J., Long, J., Yeung, A., 2007, "Determining Surface Potential of the
Bitumen-Water Interface at Nanoscale Resolution using Atomic Force
Microscopy," Canadian Journal of Chemical Engineering, 85(5) pp. 625-634.
[12] Drelich, J., Long, J., Xu, Z., Masliyah, J. H., White, C. L., 2006, "Probing
Colloidal Forces between a Si3N4 AFM Tip and Single Nanoparticles of
Silica and Alumina," Journal of Colloid and Interface Science, 303(2) pp.
627-638.
[13] King, R. P., 1982, "Principles of Flotation," South African Institute of
Mining and Metallurgy, Johannesburg.
[14] Parks, G. A., Bruyn, P. L. D., 1962, "Zero Point of Charge of Oxides,"
Journal of Physical Chemistry, 66(6) pp. 967.
[15] Liu, J., Xu, Z., Masliyah, J. H., 2003, "Studies on Bitumen−Silica Interaction
in Aqueous Solutions by Atomic Force Microscopy," Langmuir, 19(9) pp.
3911-3920.
[16] Cerovic, L. S., Milonjic, S. K., Bahloul-Hourlier, D., Doucey, B., 2002,
"Surface Properties of Silicon Nitride Powders," Colloids and Surfaces
A-Physicochemical and Engineering Aspects, 197(1-3) pp. 147-156.
[17] Burdukova, E., Becker, M., Bradshaw, D. J., Laskowski, J. S., 2007,
"Presence of Negative Charge on the Basal Planes of New York Talc,"
Journal of Colloid and Interface Science, 315(1) pp. 337-342.
[18] Van Olphen, H., 1963, "An Introduction to Clay Colloid Chemistry, for Clay
Technologists, Geologists, and Soil Scientists," Interscience Publishers, New
York.
[19] Brant, J. A., Johnson, K. M., Childress, A. E., 2006, "Examining the
Electrochemical Properties of a Nanofiltration Membrane with Atomic Force
Microscopy," Journal of Membrane Science, 276(1-2) pp. 286-294.
[20] Avena, M. J., Mariscal, M. M., De Pauli, C. P., 2003, "Proton Binding at
Clay Surfaces in Water," Applied Clay Science, 24(1-2) pp. 3-9.
[21] Bergaya, F., Theng, B. K. G., Lagaly, G., 2006, "Handbook of Clay Science,"
Elsevier, Amsterdam; London.
[22] Deer, W. A., Howie, R. A., Zussman, J., 1962, "Rock-Forming Minerals ,"
Longmans, London.
Chapter 4 -77-
[23] Toikka, G., Hayes, R. A., 1997, "Direct Measurement of Colloidal Forces
between Mica and Silica in Aqueous Electrolyte," Journal of Colloid and
Interface Science, 191(1) pp. 102-109.
[24] Lützenkirchen, J., 2006, "Surface Complexation Modelling," Academic Press,
Amsterdam; London.
[25] Jodin, M. C., Gaboriaud, F., Humbert, B., 2005, "Limitations of
Potentiometric Studies to Determine the Surface Charge of Gibbsite
Gamma-Al(OH)3 Particles," Journal of Colloid and Interface Science, 287(2)
pp. 581-591.
[26] Pokrovsky, O. S., Schott, J., 2004, "Experimental Study of Brucite
Dissolution and Precipitation in Aqueous Solutions: Surface Speciation and
Chemical Affinity Control," Geochimica Et Cosmochimica Acta, 68(1) pp.
31-45.
[27] Taubaso, C., Afonso, M. D., Sanchez, R. M. T., 2004, "Modelling Soil
Surface Charge Density using Mineral Composition," Geoderma, 121(1-2)
pp. 123-133.
[28] Hiemstra, T., Vanriemsdijk, W. H., Bolt, G. H., 1989, "Multisite Proton
Adsorption Modeling at the Solid-Solution Interface of (Hydr)Oxides-a New
Approach.1. Model Description and Evaluation of Intrinsic Reaction
Constants," Journal of Colloid and Interface Science, 133(1) pp. 91-104.
[29] Alvarez-Silva, M., Uribe-Salas, A., Mirnezami, M., Finch, J. A., 2010, "The
Point of Zero Charge of Phyllosilicate Minerals using the Mular-Roberts
Titration Technique," Minerals Engineering, 23(5) pp. 383-389.
-78-
* Yan, L., Masliyah, J. H., Xu, Z., 2013, Journal of Colloid and Interface Science (Accepted).
Chapter 5
Interaction of divalent cations with basal planes and edge
surfaces of phyllosilicate minerals*
Following the systematically study of the effect of pH on the anisotropic surface
charge characteristic of talc and muscovite in Chapter 4, the work presented in
this chapter comprises a detailed study on the effect of two divalent cations (Ca2+
and Mg2+
) on the surface charge characteristic of different surfaces of
phyllosilicate minerals by the direct interaction force measurements using AFM.
The AFM measurements were conducted in 1 mM KCl background solutions at
pH 8.5 as a function of divalent cation concentration. The fitted Stern potentials of
the muscovite basal plane become less negative with increasing Ca2+
or Mg2+
concentration but do not reverse its sign even at Ca2+
or Mg2+
concentrations up to 5
mM. In contrast, the Stern potentials of the muscovite edge surface reverse at Ca2+
or Mg2+
concentrations as low as 0.1 mM. The Stern potentials of talc basal planes
become less negative with 0.1 mM Ca2+
addition and nearly zero with 1 mM Ca2+
addition. The Stern potentials of talc edge surfaces become reverse with 0.1 mM
Ca2+
or 1 mM Mg2+
addition, showing not only a different binding mechanism of
talc basal planes and edge surfaces with Ca2+
and Mg2+
, but also different binding
mechanism between Ca2+
and Mg2+
ions with basal planes and edge surfaces.
5.1 Introduction
The multivalent cations were reported to promote homocoagulation of mineral
particles and hence to increase the efficiency of mineral recovery [1-6]. The
presence of multivalent cations in solution is known to compress more
Chapter 5 -79-
significantly the EDL of the charged particles than monovalent electrolytes,
therefore reducing the EDL repulsive forces between the mineral particles. This
effect is often referred to as double layer compression. The adsorption of metal
ions and/or their hydroxyl species on the mineral surface can often lead to a more
significant effect on the colloidal behaviour of mineral particles than the EDL
compression. Taking the oil sands processing as an example, the detrimental
effect of divalent cations on the overall bitumen recovery from oil sands by hot
water based extraction process has been reported extensively [1-6]. A dramatic
reduction in bitumen recovery was observed when processing certain types of ores
in the presence of over 1 mM Ca2+
or Mg2+
in the solution. The depression of
bitumen recovery was attributed to the slime coating of negatively charged
bitumen by clays with divalent cations acting as the bridge, making the bitumen
surface more clay like and hence difficult to attach to air bubbles [1, 2]. More
interestingly, Kasongo et al. [3] observed that only the co-presence of
montmorillonite and Ca2+
presented over 1 mM concentration in the solution had a
detrimental effect on bitumen recovery, while other clay minerals such as
kaolinite and illite were less detrimental. Similar to their finding, Liu et al. [4]
observed that kaolinite was weakly attached to the bitumen surface when 1 mM
Ca2+
was added in the solution, in contrast to strong adhesion of montmorillonite
to the bitumen surface in the presence of the same amount of Ca2+
. Similar effect
of clays and divalent cations on coal flotation was also reported [7]. Divalent Ca2+
and Mg2+
cations are both hydrolysable metal ions and can undergo hydrolysis at
specific concentrations and pH values. It was reported that the enhancement in
fine particle coagulation of some minerals was significant only when these metal
cations were in the form of more hydroxyl species such as Ca (OH)+
and
Mg(OH)+ [5-6]. This finding suggests that instead of metal ions themselves, the
Chapter 5 -80-
specific adsorption of metal mono hydroxyl species on the clay surfaces was
responsible for the reduction in bitumen recovery [5]. Gan et al. [6] reported that
only the metal mono hydroxyl species may have a significant effect on the
heterocoagulation between the bitumen and silica.
Though the detrimental effect of divalent metal cations such as Ca2+
and Mg2+
on
bitumen recovery is already well recognized, there is no consensus reached
regarding how this kind of hydrolysable divalent cations affects the surface
property of specific mineral surfaces. Until now, there is no direct measurement on
how different divalent metal ions interact with basal plane and edge surfaces of
phyllosilicate minerals. The major hurdle to systematically study the interaction of
metal cations with phyllosilicates is that this type of minerals has distinct
anisotropic surface properties as well described in chapter 1. This distinct
anisotropic character of phyllosilicate surface chemistry and hence surface charge
makes the study of metal ion interactions with phyllosilicate minerals extremely
difficult if not impossible, despite its critical importance, mainly due to the lack of
tools to study the basal plane and edge surfaces independently.
As well described in Chapter 3, sufficiently smooth edge surfaces of different
phyllosilicate minerals were successfully prepared using an ultramicrotome cutting
method, which makes the study on anisotropic charge properties of phyllosilicate
minerals at nano-scale resolution possible. As presented in Chapter 4, the surface
charge characteristics of the basal plane and edge surfaces of two different
phyllosilicate minerals in simply electrolyte solutions as a function of solution pH
were investigated, which demonstrates the capable of AFM tip to independently
probe surface charge properties on these specific surfaces.
In this chapter, the interactions of two divalent cations with basal planes and edge
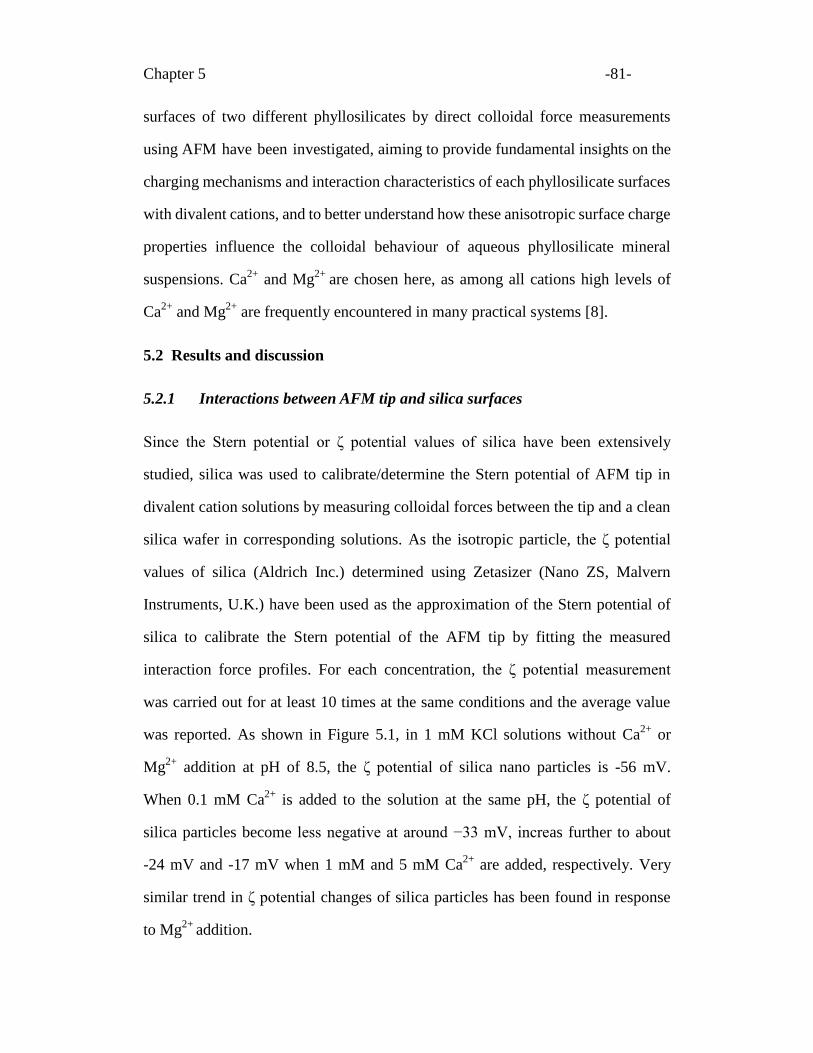
Chapter 5 -81-
surfaces of two different phyllosilicates by direct colloidal force measurements
using AFM have been investigated, aiming to provide fundamental insights on the
charging mechanisms and interaction characteristics of each phyllosilicate surfaces
with divalent cations, and to better understand how these anisotropic surface charge
properties influence the colloidal behaviour of aqueous phyllosilicate mineral
suspensions. Ca2+
and Mg2+
are chosen here, as among all cations high levels of
Ca2+
and Mg2+
are frequently encountered in many practical systems [8].
5.2 Results and discussion
5.2.1 Interactions between AFM tip and silica surfaces
Since the Stern potential or ζ potential values of silica have been extensively
studied, silica was used to calibrate/determine the Stern potential of AFM tip in
divalent cation solutions by measuring colloidal forces between the tip and a clean
silica wafer in corresponding solutions. As the isotropic particle, the ζ potential
values of silica (Aldrich Inc.) determined using Zetasizer (Nano ZS, Malvern
Instruments, U.K.) have been used as the approximation of the Stern potential of
silica to calibrate the Stern potential of the AFM tip by fitting the measured
interaction force profiles. For each concentration, the ζ potential measurement
was carried out for at least 10 times at the same conditions and the average value
was reported. As shown in Figure 5.1, in 1 mM KCl solutions without Ca2+
or
Mg2+
addition at pH of 8.5, the ζ potential of silica nano particles is -56 mV.
When 0.1 mM Ca2+
is added to the solution at the same pH, the ζ potential of
silica particles become less negative at around −33 mV, increas further to about
-24 mV and -17 mV when 1 mM and 5 mM Ca2+
are added, respectively. Very
similar trend in ζ potential changes of silica particles has been found in response
to Mg2+
addition.
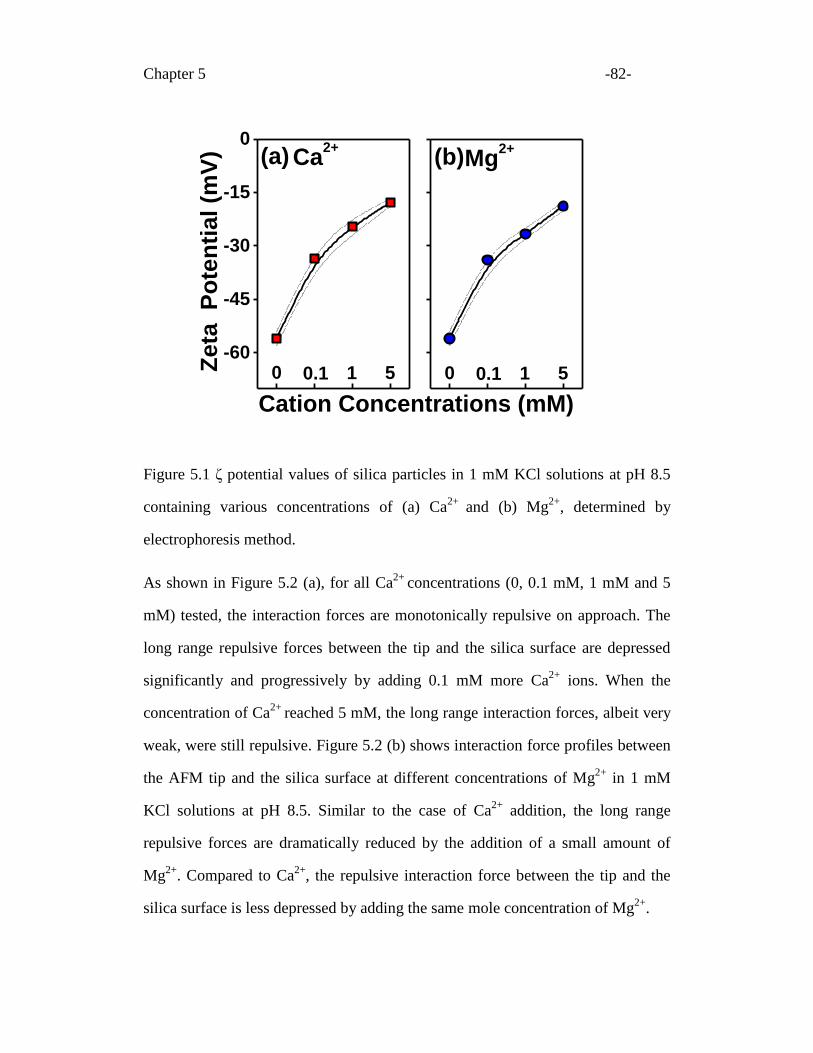
Chapter 5 -82-
-60
-45
-30
-15
0
(b)(a)
0 510.1
Cation Concentrations (mM)
Ze
ta
Po
ten
tia
l (m
V)
0 510.1
Mg2+
Ca2+
Figure 5.1 ζ potential values of silica particles in 1 mM KCl solutions at pH 8.5
containing various concentrations of (a) Ca2+
and (b) Mg2+
, determined by
electrophoresis method.
As shown in Figure 5.2 (a), for all Ca2+
concentrations (0, 0.1 mM, 1 mM and 5
mM) tested, the interaction forces are monotonically repulsive on approach. The
long range repulsive forces between the tip and the silica surface are depressed
significantly and progressively by adding 0.1 mM more Ca2+
ions. When the
concentration of Ca2+
reached 5 mM, the long range interaction forces, albeit very
weak, were still repulsive. Figure 5.2 (b) shows interaction force profiles between
the AFM tip and the silica surface at different concentrations of Mg2+
in 1 mM
KCl solutions at pH 8.5. Similar to the case of Ca2+
addition, the long range
repulsive forces are dramatically reduced by the addition of a small amount of
Mg2+
. Compared to Ca2+
, the repulsive interaction force between the tip and the
silica surface is less depressed by adding the same mole concentration of Mg2+
.
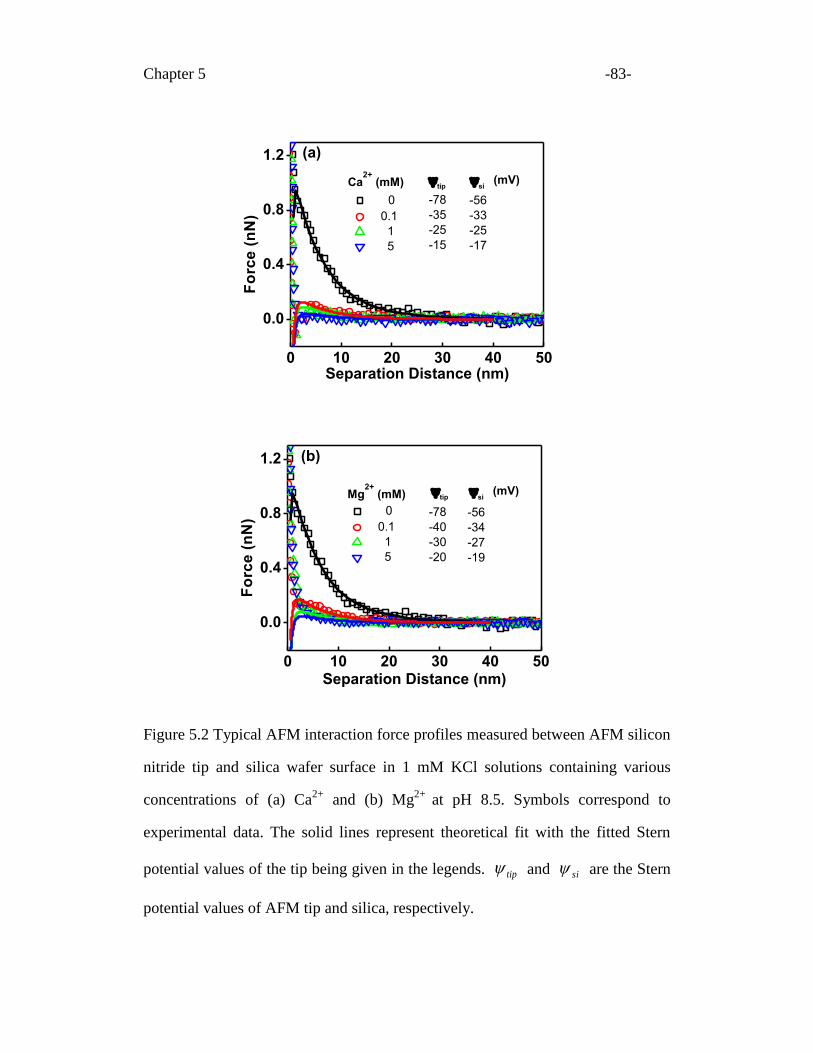
Chapter 5 -83-
0 10 20 30 40 50
0.0
0.4
0.8
1.2
Ca2+
(mM)
-56
-33
-25
-17
(a)
Fo
rce
(n
N)
Separation Distance (nm)
tip
si
(mV)
0
0.1
1
5
-78
-35
-25
-15
0 10 20 30 40 50
0.0
0.4
0.8
1.2
Mg2+
(mM)
-56
-34
-27
-19
tip
si
(mV)
-78
-40
-30
-20
(b)
Fo
rce
(n
N)
Separation Distance (nm)
0
0.1
1
5
Figure 5.2 Typical AFM interaction force profiles measured between AFM silicon
nitride tip and silica wafer surface in 1 mM KCl solutions containing various
concentrations of (a) Ca2+
and (b) Mg2+
at pH 8.5. Symbols correspond to
experimental data. The solid lines represent theoretical fit with the fitted Stern
potential values of the tip being given in the legends. tip and si are the Stern
potential values of AFM tip and silica, respectively.
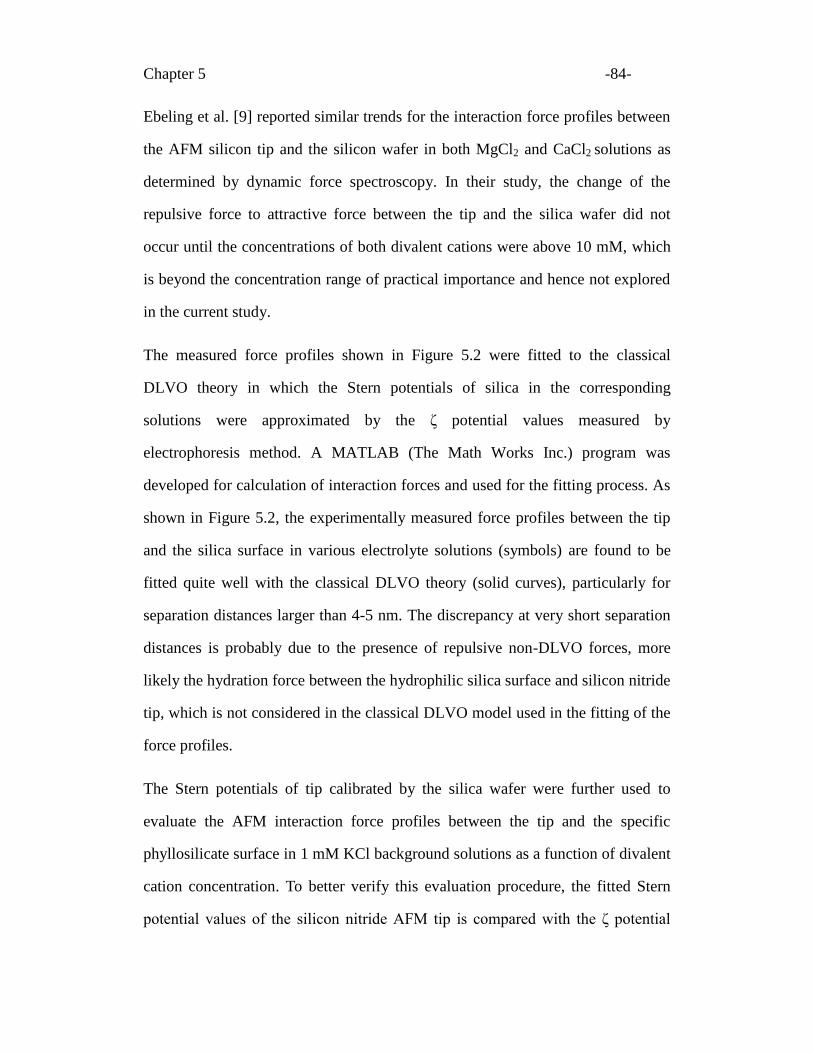
Chapter 5 -84-
Ebeling et al. [9] reported similar trends for the interaction force profiles between
the AFM silicon tip and the silicon wafer in both MgCl2 and CaCl2 solutions as
determined by dynamic force spectroscopy. In their study, the change of the
repulsive force to attractive force between the tip and the silica wafer did not
occur until the concentrations of both divalent cations were above 10 mM, which
is beyond the concentration range of practical importance and hence not explored
in the current study.
The measured force profiles shown in Figure 5.2 were fitted to the classical
DLVO theory in which the Stern potentials of silica in the corresponding
solutions were approximated by the ζ potential values measured by
electrophoresis method. A MATLAB (The Math Works Inc.) program was
developed for calculation of interaction forces and used for the fitting process. As
shown in Figure 5.2, the experimentally measured force profiles between the tip
and the silica surface in various electrolyte solutions (symbols) are found to be
fitted quite well with the classical DLVO theory (solid curves), particularly for
separation distances larger than 4-5 nm. The discrepancy at very short separation
distances is probably due to the presence of repulsive non-DLVO forces, more
likely the hydration force between the hydrophilic silica surface and silicon nitride
tip, which is not considered in the classical DLVO model used in the fitting of the
force profiles.
The Stern potentials of tip calibrated by the silica wafer were further used to
evaluate the AFM interaction force profiles between the tip and the specific
phyllosilicate surface in 1 mM KCl background solutions as a function of divalent
cation concentration. To better verify this evaluation procedure, the fitted Stern
potential values of the silicon nitride AFM tip is compared with the ζ potential
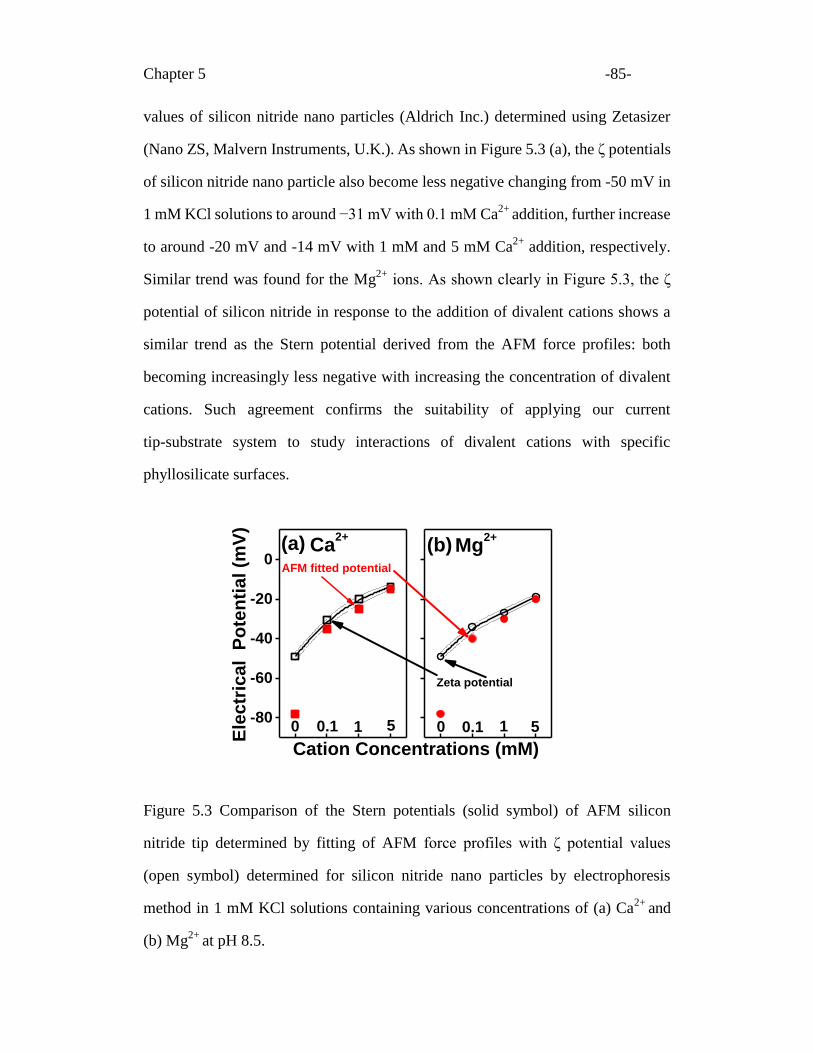
Chapter 5 -85-
values of silicon nitride nano particles (Aldrich Inc.) determined using Zetasizer
(Nano ZS, Malvern Instruments, U.K.). As shown in Figure 5.3 (a), the ζ potentials
of silicon nitride nano particle also become less negative changing from -50 mV in
1 mM KCl solutions to around −31 mV with 0.1 mM Ca2+
addition, further increase
to around -20 mV and -14 mV with 1 mM and 5 mM Ca2+
addition, respectively.
Similar trend was found for the Mg2+
ions. As shown clearly in Figure 5.3, the ζ
potential of silicon nitride in response to the addition of divalent cations shows a
similar trend as the Stern potential derived from the AFM force profiles: both
becoming increasingly less negative with increasing the concentration of divalent
cations. Such agreement confirms the suitability of applying our current
tip-substrate system to study interactions of divalent cations with specific
phyllosilicate surfaces.
-80
-60
-40
-20
0
(b)(a)AFM fitted potential
Zeta potential
Cation Concentrations (mM)
Ele
ctr
ica
l P
ote
nti
al
(mV
)
0.10 1 5 0.10 1 5
Ca2+
Mg2+
Figure 5.3 Comparison of the Stern potentials (solid symbol) of AFM silicon
nitride tip determined by fitting of AFM force profiles with ζ potential values
(open symbol) determined for silicon nitride nano particles by electrophoresis
method in 1 mM KCl solutions containing various concentrations of (a) Ca2+
and
(b) Mg2+
at pH 8.5.
Chapter 5 -86-
Theoretically, the addition of 0.1 mM, 1 mM and 5 mM divalent cations to 1 mM
simple electrolyte (KCl) solution would reduce the thickness of the EDL around
charged particles from 9.6 nm to 6.5, 4.8 and 2.8 nm, respectively. These values are
also used for data fitting. The compression of the EDL due to the addition of
divalent cations in the solution, especially at higher divalent cation concentration
leads to lower electrostatic repulsion, as shown in Figure 5.3. It should be noted that
the magnitude of the ζ potential values is slightly lower than the corresponding
Stern potential values derived by fitting of AFM force profiles to the classical
DLVO theory, more so at lower divalent cation ion concentrations. This
discrepancy between the two data sets is anticipated from the definition of ζ
potential and Stern potential which is measured at a much closer location to the
surface than ζ potential. When compressed more of the EDL by adding more
divalent cations, a reduced difference between the Stern potential and ζ potential is
anticipated as shown in Figure 5.3.
5.2.2 Interactions between AFM tip and different muscovite surfaces
Typical interaction force profiles between AFM tip and the hydrophilic muscovite
basal plane in 1 mM KCl solutions of varying Ca2+
concentrations at pH 8.5 are
shown in Figure 5.4 (a). The long range repulsion is drastically depressed upon
the addition of a small amount of Ca2+
ions (0.1 mM) and continued to decrease
with increasing Ca2+
concentrations to 1 mM and 5 mM. However, the interaction
forces remain monotonically repulsive. A qualitatively similar effect of Mg2+
concentrations on the interaction force profiles between AFM tip and muscovite
basal plane in 1 mM KCl solutions at the given pH of 8.5 is observed.
Chapter 5 -87-
0 10 20 30 40 50
0.0
0.4
0.8
1.2
Ca2+
(mM)
(a)
Fo
rce
(n
N)
Separation Distance (nm)
-81
-35
-18
-
tip
mb
(mV)
0
0.1
1
5
-78
-35
-25
-
0 10 20 30 40 50
0.0
0.4
0.8
1.2
Mg2+
(mM)
(b)
Fo
rce
(n
N)
Separation Distance (nm)
-81
-42
-25
-
tip
mb
(mV)
-78
-40
-30
-
0
0.1
1
5
Figure 5.4 Typical AFM interaction force profiles measured between AFM tip
and muscovite basal planes in 1 mM KCl solutions of various (a) Ca2+
and (b)
Mg2+
concentrations at pH 8.5. Symbols correspond to experimental data. The
solid lines represent theoretical fits of classical DLVO theory. tip and mb are
the Stern potential values of AFM tip and the muscovite basal plane, respectively.
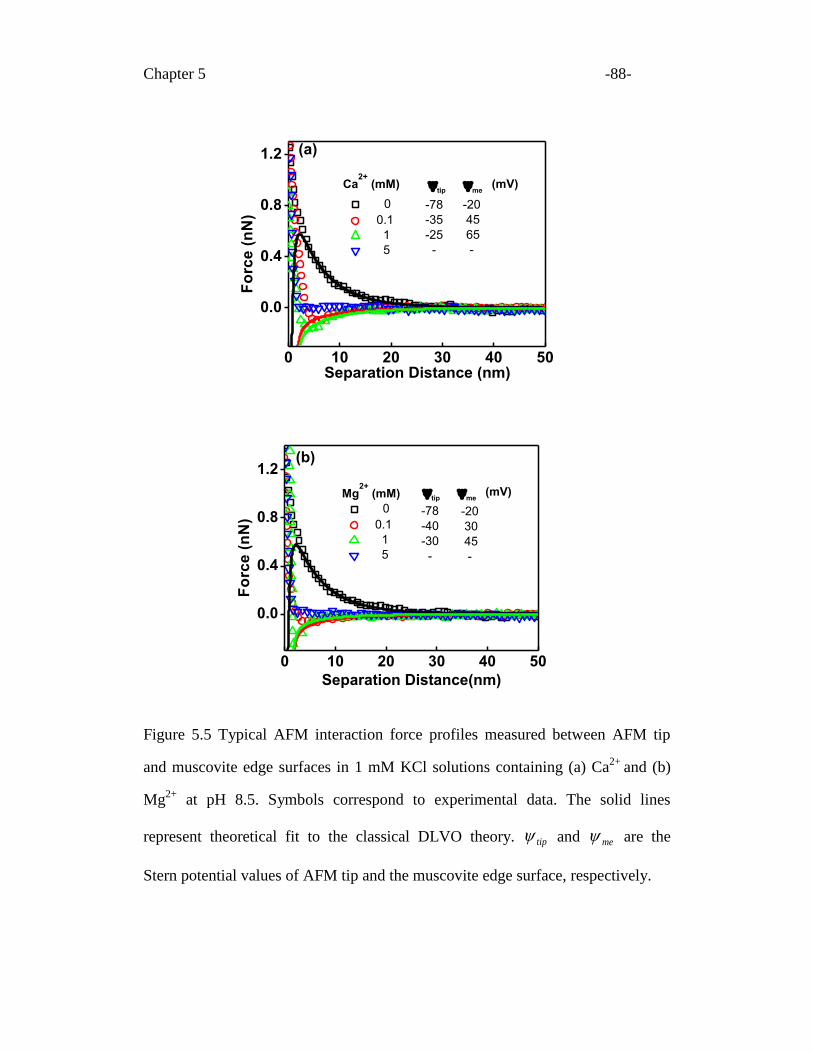
Chapter 5 -88-
0 10 20 30 40 50
0.0
0.4
0.8
1.2
Ca2+
(mM)
Separation Distance (nm)
(a)
Fo
rce
(n
N)
-20
45
65
-
tip
me
(mV)
0
0.1
1
5
-78
-35
-25
-
0 10 20 30 40 50
0.0
0.4
0.8
1.2
Mg2+
(mM)
(b)
Fo
rce
(n
N)
Separation Distance(nm)
-20
30
45
-
tip
me
(mV)
-78
-40
-30
-
0
0.1
1
5
Figure 5.5 Typical AFM interaction force profiles measured between AFM tip
and muscovite edge surfaces in 1 mM KCl solutions containing (a) Ca2+
and (b)
Mg2+
at pH 8.5. Symbols correspond to experimental data. The solid lines
represent theoretical fit to the classical DLVO theory. tip and me are the
Stern potential values of AFM tip and the muscovite edge surface, respectively.
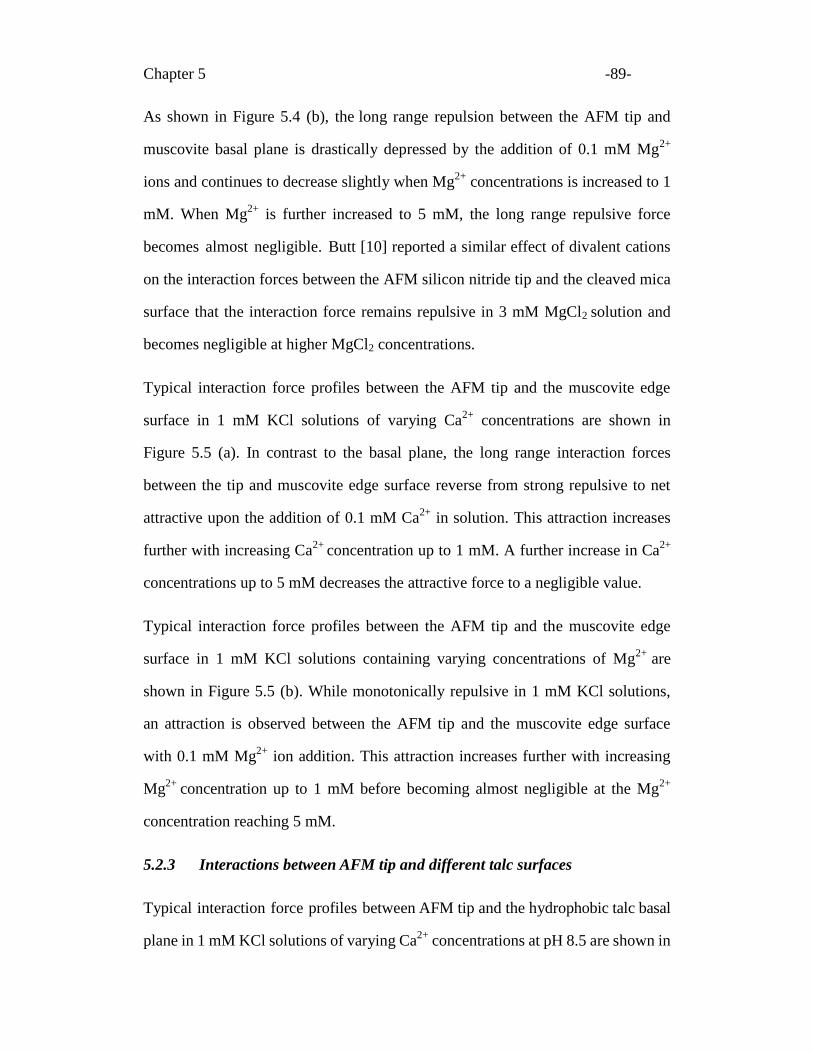
Chapter 5 -89-
As shown in Figure 5.4 (b), the long range repulsion between the AFM tip and
muscovite basal plane is drastically depressed by the addition of 0.1 mM Mg2+
ions and continues to decrease slightly when Mg2+
concentrations is increased to 1
mM. When Mg2+
is further increased to 5 mM, the long range repulsive force
becomes almost negligible. Butt [10] reported a similar effect of divalent cations
on the interaction forces between the AFM silicon nitride tip and the cleaved mica
surface that the interaction force remains repulsive in 3 mM MgCl2 solution and
becomes negligible at higher MgCl2 concentrations.
Typical interaction force profiles between the AFM tip and the muscovite edge
surface in 1 mM KCl solutions of varying Ca2+
concentrations are shown in
Figure 5.5 (a). In contrast to the basal plane, the long range interaction forces
between the tip and muscovite edge surface reverse from strong repulsive to net
attractive upon the addition of 0.1 mM Ca2+
in solution. This attraction increases
further with increasing Ca2+
concentration up to 1 mM. A further increase in Ca2+
concentrations up to 5 mM decreases the attractive force to a negligible value.
Typical interaction force profiles between the AFM tip and the muscovite edge
surface in 1 mM KCl solutions containing varying concentrations of Mg2+
are
shown in Figure 5.5 (b). While monotonically repulsive in 1 mM KCl solutions,
an attraction is observed between the AFM tip and the muscovite edge surface
with 0.1 mM Mg2+
ion addition. This attraction increases further with increasing
Mg2+
concentration up to 1 mM before becoming almost negligible at the Mg2+
concentration reaching 5 mM.
5.2.3 Interactions between AFM tip and different talc surfaces
Typical interaction force profiles between AFM tip and the hydrophobic talc basal
plane in 1 mM KCl solutions of varying Ca2+
concentrations at pH 8.5 are shown in
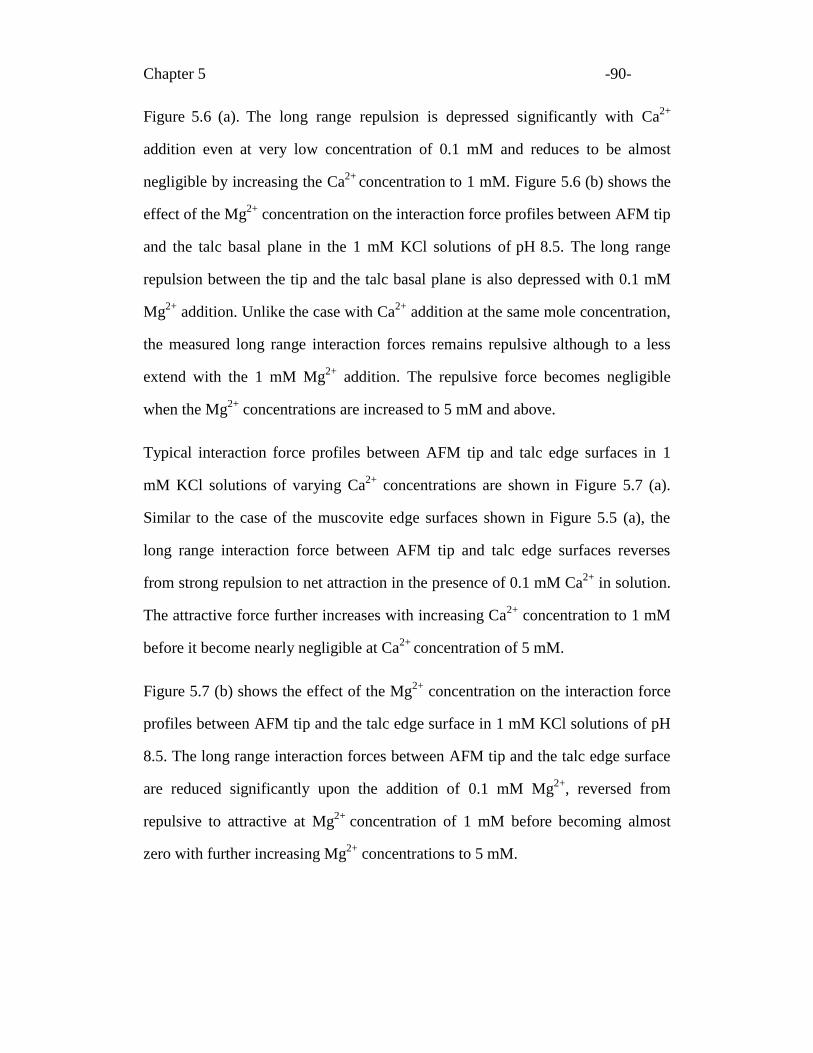
Chapter 5 -90-
Figure 5.6 (a). The long range repulsion is depressed significantly with Ca2+
addition even at very low concentration of 0.1 mM and reduces to be almost
negligible by increasing the Ca2+
concentration to 1 mM. Figure 5.6 (b) shows the
effect of the Mg2+
concentration on the interaction force profiles between AFM tip
and the talc basal plane in the 1 mM KCl solutions of pH 8.5. The long range
repulsion between the tip and the talc basal plane is also depressed with 0.1 mM
Mg2+
addition. Unlike the case with Ca2+
addition at the same mole concentration,
the measured long range interaction forces remains repulsive although to a less
extend with the 1 mM Mg2+
addition. The repulsive force becomes negligible
when the Mg2+
concentrations are increased to 5 mM and above.
Typical interaction force profiles between AFM tip and talc edge surfaces in 1
mM KCl solutions of varying Ca2+
concentrations are shown in Figure 5.7 (a).
Similar to the case of the muscovite edge surfaces shown in Figure 5.5 (a), the
long range interaction force between AFM tip and talc edge surfaces reverses
from strong repulsion to net attraction in the presence of 0.1 mM Ca2+
in solution.
The attractive force further increases with increasing Ca2+
concentration to 1 mM
before it become nearly negligible at Ca2+
concentration of 5 mM.
Figure 5.7 (b) shows the effect of the Mg2+
concentration on the interaction force
profiles between AFM tip and the talc edge surface in 1 mM KCl solutions of pH
8.5. The long range interaction forces between AFM tip and the talc edge surface
are reduced significantly upon the addition of 0.1 mM Mg2+
, reversed from
repulsive to attractive at Mg2+
concentration of 1 mM before becoming almost
zero with further increasing Mg2+
concentrations to 5 mM.
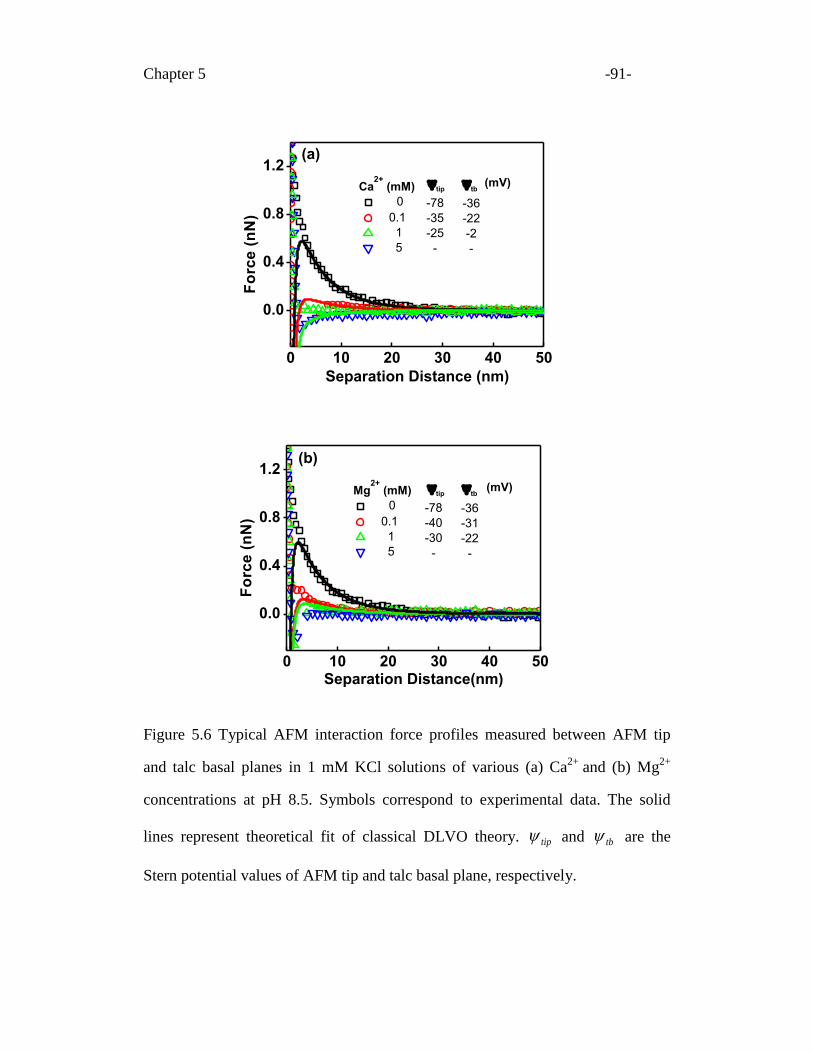
Chapter 5 -91-
0 10 20 30 40 50
0.0
0.4
0.8
1.2
tip
tb (mV)
0
0.1
1
5
(a)
Fo
rce
(n
N)
Separation Distance (nm)
Ca2+
(mM)
-36
-22
-2
-
-78
-35
-25
-
0 10 20 30 40 50
0.0
0.4
0.8
1.2
Mg2+
(mM)
(b)
Fo
rce
(n
N)
Separation Distance(nm)
-36
-31
-22
-
tip
tb
(mV)
-78
-40
-30
-
0
0.1
1
5
Figure 5.6 Typical AFM interaction force profiles measured between AFM tip
and talc basal planes in 1 mM KCl solutions of various (a) Ca2+
and (b) Mg2+
concentrations at pH 8.5. Symbols correspond to experimental data. The solid
lines represent theoretical fit of classical DLVO theory. tip and tb are the
Stern potential values of AFM tip and talc basal plane, respectively.
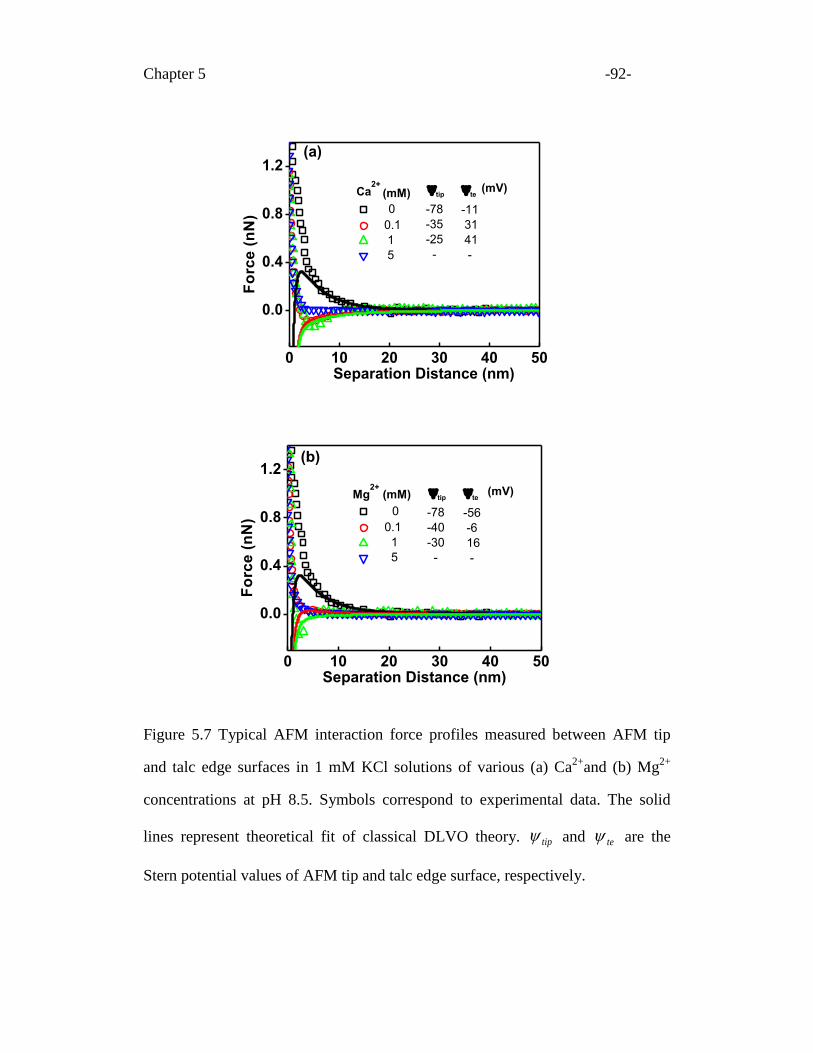
Chapter 5 -92-
0 10 20 30 40 50
0.0
0.4
0.8
1.2
(mM)
(a)
Fo
rce
(n
N)
Separation Distance (nm)
Ca2+
0
0.1
1
5
-11
31
41
-
-78
-35
-25
-
tip
te
(mV)
0 10 20 30 40 50
0.0
0.4
0.8
1.2
Mg2+
(mM)
(b)
Fo
rce
(n
N)
Separation Distance (nm)
-56
-6
16
-
tip
te
(mV)
-78
-40
-30
-
0
0.1
1
5
Figure 5.7 Typical AFM interaction force profiles measured between AFM tip
and talc edge surfaces in 1 mM KCl solutions of various (a) Ca2+
and (b) Mg2+
concentrations at pH 8.5. Symbols correspond to experimental data. The solid
lines represent theoretical fit of classical DLVO theory. tip and te are the
Stern potential values of AFM tip and talc edge surface, respectively.
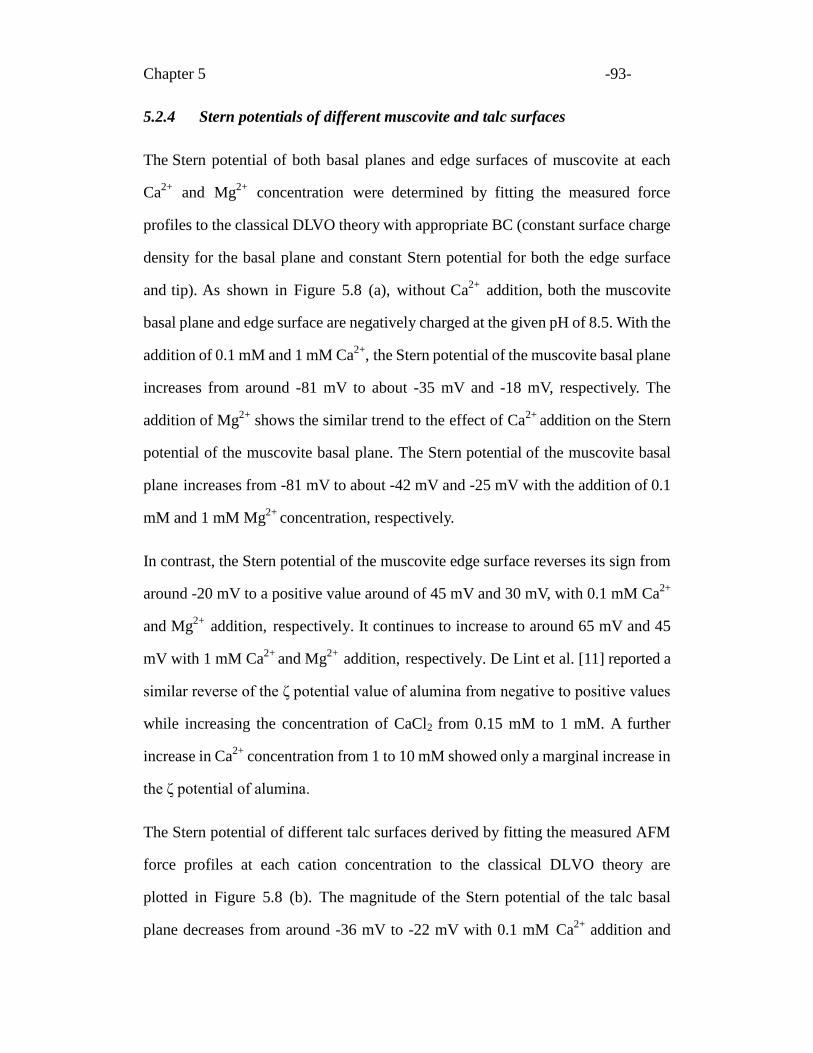
Chapter 5 -93-
5.2.4 Stern potentials of different muscovite and talc surfaces
The Stern potential of both basal planes and edge surfaces of muscovite at each
Ca2+
and Mg2+
concentration were determined by fitting the measured force
profiles to the classical DLVO theory with appropriate BC (constant surface charge
density for the basal plane and constant Stern potential for both the edge surface
and tip). As shown in Figure 5.8 (a), without Ca2+
addition, both the muscovite
basal plane and edge surface are negatively charged at the given pH of 8.5. With the
addition of 0.1 mM and 1 mM Ca2+
, the Stern potential of the muscovite basal plane
increases from around -81 mV to about -35 mV and -18 mV, respectively. The
addition of Mg2+
shows the similar trend to the effect of Ca2+
addition on the Stern
potential of the muscovite basal plane. The Stern potential of the muscovite basal
plane increases from -81 mV to about -42 mV and -25 mV with the addition of 0.1
mM and 1 mM Mg2+
concentration, respectively.
In contrast, the Stern potential of the muscovite edge surface reverses its sign from
around -20 mV to a positive value around of 45 mV and 30 mV, with 0.1 mM Ca2+
and Mg2+
addition, respectively. It continues to increase to around 65 mV and 45
mV with 1 mM Ca2+
and Mg2+
addition, respectively. De Lint et al. [11] reported a
similar reverse of the ζ potential value of alumina from negative to positive values
while increasing the concentration of CaCl2 from 0.15 mM to 1 mM. A further
increase in Ca2+
concentration from 1 to 10 mM showed only a marginal increase in
the ζ potential of alumina.
The Stern potential of different talc surfaces derived by fitting the measured AFM
force profiles at each cation concentration to the classical DLVO theory are
plotted in Figure 5.8 (b). The magnitude of the Stern potential of the talc basal
plane decreases from around -36 mV to -22 mV with 0.1 mM Ca2+
addition and
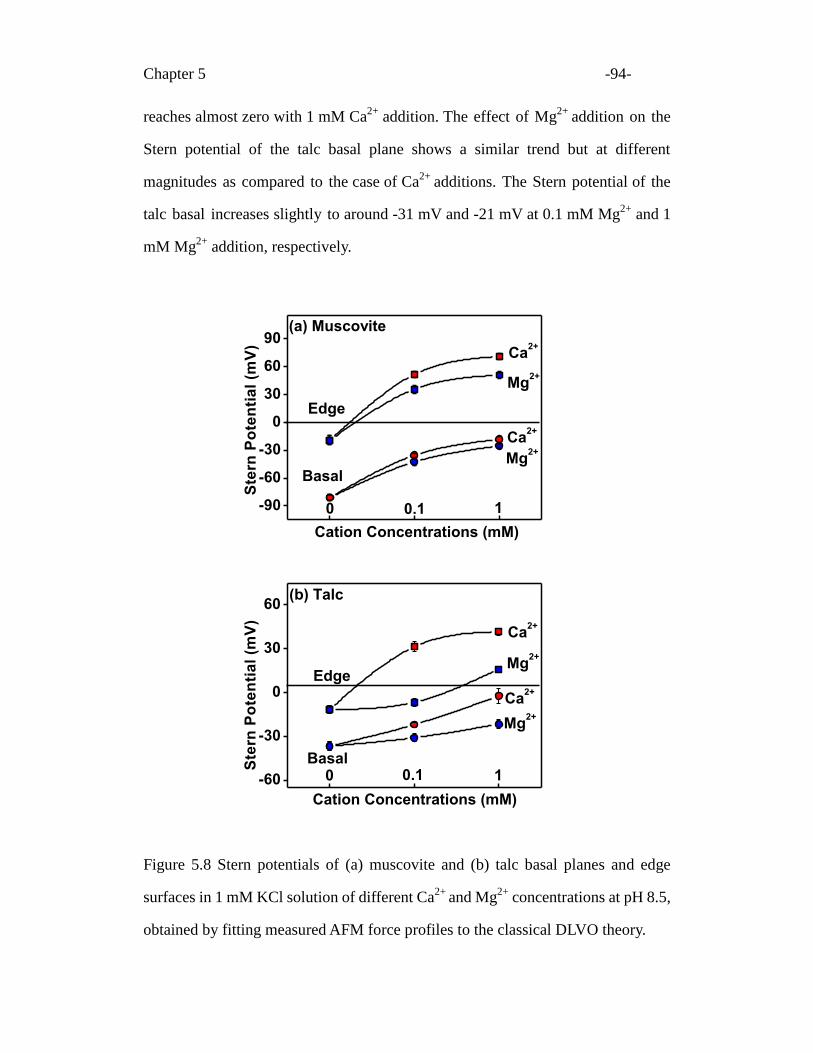
Chapter 5 -94-
reaches almost zero with 1 mM Ca2+
addition. The effect of Mg2+
addition on the
Stern potential of the talc basal plane shows a similar trend but at different
magnitudes as compared to the case of Ca2+
additions. The Stern potential of the
talc basal increases slightly to around -31 mV and -21 mV at 0.1 mM Mg2+
and 1
mM Mg2+
addition, respectively.
Figure 5.8 Stern potentials of (a) muscovite and (b) talc basal planes and edge
surfaces in 1 mM KCl solution of different Ca2+
and Mg2+
concentrations at pH 8.5,
obtained by fitting measured AFM force profiles to the classical DLVO theory.
-90
-60
-30
0
30
60
90(a) Muscovite
0
Ste
rn P
ote
nti
al
(mV
)
Mg2+
Edge
Ca2+
Mg2+
Ca2+
Basal
0.1 1
Cation Concentrations (mM)
-60
-30
0
30
60(b) Talc
Mg2+
Ca2+
Mg2+
Cation Concentrations (mM)
Ste
rn P
ote
nti
al
(mV
)
Edge
Ca2+
Basal0 0.1 1
Chapter 5 -95-
5.2.5 Anisotropic surface character of phyllosilicates
The adsorption of metal ions on the mineral surface in the aqueous solutions
usually can be attributed to two different mechanisms: one is the pure electrostatic
interaction between positively charged metal ions and the negatively charged or
neutral mineral surface; and the other results from surface complexation or specific
adsorption of divalent cations at the mineral-water interface.
As mentioned before, the phyllosilicate minerals exhibit different surface charge
characteristics on the basal plane and edge surfaces, attributed to different
prevailing charge mechanisms. Due to the structural defects, the muscovite basal
plane carries fixed negative charges caused by isomorphic substitution of lattice
Si4+
by Al3+
in the T sheets. This permanent negative surface charge characteristic
enables the basal plane to attract positively charged metal cations or their
hydrolysis products through electrostatic interaction.
On the other hand, charges on the edge surface are attributed to
protonation–deprotonation reactions of the hydrolyzed broken primary bonds from
the tetrahedral silica-like and the octahedral gibbsite-like sheets. Unlike the inert
siloxane group on the basal plane, the amphoteric SOH surface groups (where S
represents surface Al or Si atoms) on the muscovite edge surface can easily undergo
protonation or deprotonation reactions which impose charge on the edge surface as
be expressed in equation (1.1) in Chapter 1. At the given pH of 8.5 in this study, the
Si-OH group from the T sheet can be deprotonated to Si–O–, while the Al-OH
surface groups undergo protonation reactions to Al-OH21/2+
. In addition to these
reactions, some of the amphoteric SOH groups on the edge surface are also
assumed to be able to form strong bi-or monodentate surface complexes with some
metal ions in electrolyte solutions. Generally speaking one of these metal
Chapter 5 -96-
complexation species is dominant that can be expressed in the following
equilibrium reaction [12]:
HSOMMSOH 2 (5.1)
In the case of the muscovite edge surface, possible surface complexation groups of
AlOM+ can form. These specific bindings of surface groups to the divalent cation in
the solution have a more significant effect on the change in the Stern potential of
the edge surface as compared to the electrostatic interaction between the muscovite
basal plane and divalent cations in the solution. Therefore, the change in the Stern
potential of muscovite basal planes and edge surfaces responds differently to the
different cations in the solution as shown in Figure 5.8 (a).
Compared to the change in the Stern potential of the muscovite basal plane as
shown in Figure 5.8 (a), the difference in surface hydrophobicity and permanent
charge density on the talc basal plane may be the reason for the observed difference
in the Stern potential variations in responding to the addition of differential divalent
cations as shown in Figure 5.8 (b). As a measure of the strength of hydrogen
bonding between the surface and water molecules, the hydrophobicity is believed
to be affected by the crystal structure of the mineral [13]. The structural charge,
cation occupancies and distributions all affect the hydrophobicity of the surface.
Similar to the muscovite basal plane, the dominant surface groups on the talc basal
plane is the siloxane group which has very low affinity to protons. The charges of
the basal plane are mainly caused by the structural defects in the crystalline
building sheet. Despite the same charging mechanism, these two phyllosilicate
minerals have very different levels of isomorphic substitution. For a perfect
muscovite, the ratio of the Al3+
substitution for Si4+
on the tetrahedral basal plane is
close to 1/3 [14], which is responsible for the highly negative Stern potential of its
Chapter 5 -97-
basal plane. In contrast, the talc basal plane has a much lower isomorphic
substitution ratio which results in a lower Stern potential as observed in chapter 4.
As a result, these two basal planes show totally different hydrophobicity. The
existence of an exclusion zone between siloxane group on talc basal plane and
water molecules in solution was well documented. It is due to the absence of
polarity of talc basal plane [13, 15]. In contrast, water molecules are tightly bonded
with muscovite basal plane of high permanent charge density.
As also shown in Figure 5.8 (b), despite the different chemistry of muscovite and
talc edge surface (Al vs Mg), the effect of Ca2+
addition on their electrical charge
characteristics is quite similar. The Stern potential of both muscovite and talc edge
surfaces reverses upon the addition of 0.1 mM Ca2+
and increases slightly at 1 mM
Ca2+
addition. For Mg2+
, the muscovite and talc edge surface respond slightly
differently. The Stern potential of talc edge surface remains negative with the
addition of 0.1 mM Mg2+
ions and reverses to positive value only when Mg2+
addition is up to 1 mM, while the Stern potential of the muscovite edge surface
reverses with the addition of 0.1 mM Ca2+
. Instead of Al–OH surface group on
muscovite edge surface, the Mg–OH group populates on the talc edge surface.
These two surface species exhibit different protonation constants. At a given pH of
8.5, the talc edge surface is more positively charged than the muscovite edge
surface as anticipated from a higher PZC value of Mg(OH)2 than Al(OH)2 [16]. On
the other hand, similar to the case of the muscovite edge surface, in addition to
protonation reactions, Mg-OH groups on the talc edge surface are also able to form
strong surface complexes with metal ions in solution to form MgOCa+
and
MgOMg+. These differences between each surface groups reacting with different
metal ions cause different surface charge responses to the presence of different
metal ions in solutions.
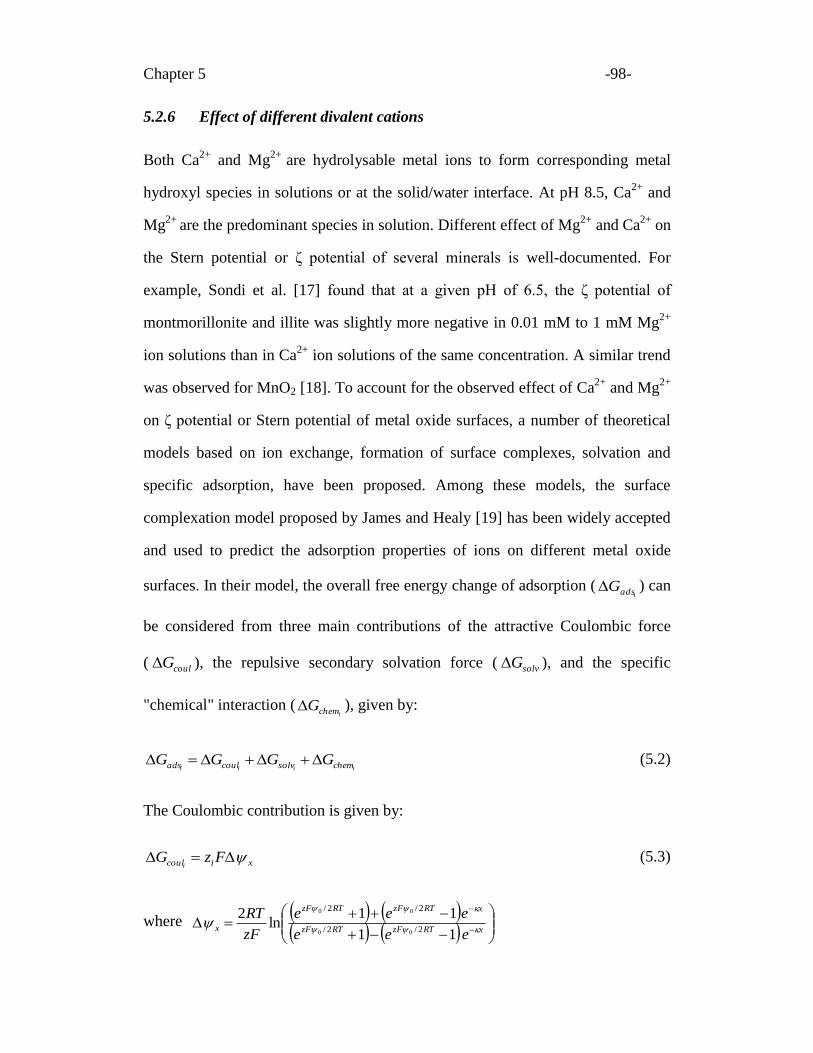
Chapter 5 -98-
5.2.6 Effect of different divalent cations
Both Ca2+
and Mg2+
are hydrolysable metal ions to form corresponding metal
hydroxyl species in solutions or at the solid/water interface. At pH 8.5, Ca2+
and
Mg2+
are the predominant species in solution. Different effect of Mg2+
and Ca2+
on
the Stern potential or ζ potential of several minerals is well-documented. For
example, Sondi et al. [17] found that at a given pH of 6.5, the ζ potential of
montmorillonite and illite was slightly more negative in 0.01 mM to 1 mM Mg2+
ion solutions than in Ca2+
ion solutions of the same concentration. A similar trend
was observed for MnO2 [18]. To account for the observed effect of Ca2+
and Mg2+
on ζ potential or Stern potential of metal oxide surfaces, a number of theoretical
models based on ion exchange, formation of surface complexes, solvation and
specific adsorption, have been proposed. Among these models, the surface
complexation model proposed by James and Healy [19] has been widely accepted
and used to predict the adsorption properties of ions on different metal oxide
surfaces. In their model, the overall free energy change of adsorption (iadsG ) can
be considered from three main contributions of the attractive Coulombic force
( coulG ), the repulsive secondary solvation force ( solvG ), and the specific
"chemical" interaction (ichemG ), given by:
iiii chemsolvcoulads GGGG (5.2)
The Coulombic contribution is given by:
xicoul FzGi
(5.3)
where
xRTzFRTzF
xRTzFRTzF
xeee
eee
zF
RT
11
11ln
22/2/
2/2/
00
00
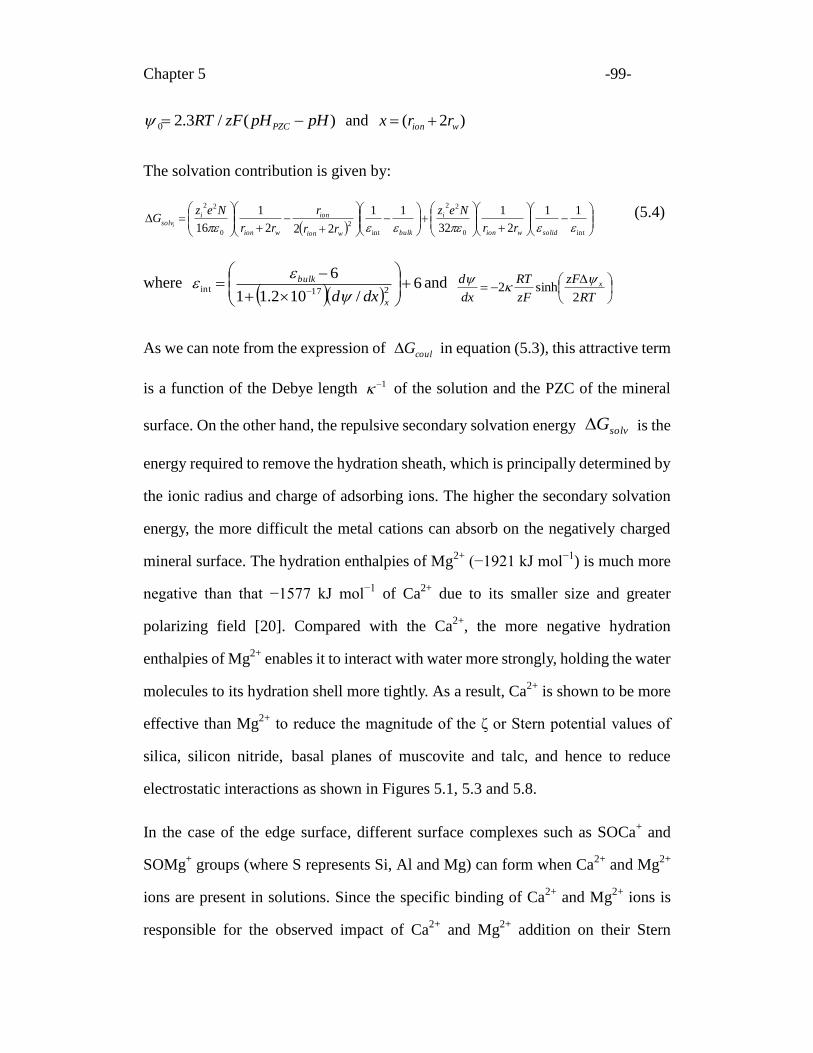
Chapter 5 -99-
)(/3.20 pHpHzFRT PZC and )2( wion rrx
The solvation contribution is given by:
int0
22
int
2
0
2211
2
1
32
11
222
1
16 solidwion
i
bulkwion
ion
wion
isolv
rr
Nez
rr
r
rr
NezG
i
(5.4)
where
6/102.11
6217int
x
bulk
dxd
and
RT
zF
zF
RT
dx
d x
2sinh2
As we can note from the expression of coulG in equation (5.3), this attractive term
is a function of the Debye length 1 of the solution and the PZC of the mineral
surface. On the other hand, the repulsive secondary solvation energy solvG is the
energy required to remove the hydration sheath, which is principally determined by
the ionic radius and charge of adsorbing ions. The higher the secondary solvation
energy, the more difficult the metal cations can absorb on the negatively charged
mineral surface. The hydration enthalpies of Mg2+
(−1921 kJ mol−1
) is much more
negative than that −1577 kJ mol−1
of Ca2+
due to its smaller size and greater
polarizing field [20]. Compared with the Ca2+
, the more negative hydration
enthalpies of Mg2+
enables it to interact with water more strongly, holding the water
molecules to its hydration shell more tightly. As a result, Ca2+
is shown to be more
effective than Mg2+
to reduce the magnitude of the ζ or Stern potential values of
silica, silicon nitride, basal planes of muscovite and talc, and hence to reduce
electrostatic interactions as shown in Figures 5.1, 5.3 and 5.8.
In the case of the edge surface, different surface complexes such as SOCa+ and
SOMg+ groups (where S represents Si, Al and Mg) can form when Ca
2+ and Mg
2+
ions are present in solutions. Since the specific binding of Ca2+
and Mg2+
ions is
responsible for the observed impact of Ca2+
and Mg2+
addition on their Stern
Chapter 5 -100-
potentials, the proximity of ions to the surface is more critical. Compared with
Mg2+
, the less hydrated Ca2+
seems easier to get close to the surface and therefore
exhibits a stronger effect than Mg2+
ions on Stern potential of muscovite and talc
edge surfaces.
5.3 Summary
The effect of two divalent cations: Mg2+
and Ca2+
on the Stern potential of different
surfaces of phyllosilicate minerals was investigated by the direct measurement of
interaction forces between the AFM tip and various phyllosilicate surfaces using
AFM. The measurement was conducted in 1 mM KCl background solutions at pH
8.5 as a function of divalent cation concentration. The Stern potential of each
surface was determined by fitting the measured interaction force profiles to the
classical DLVO theory using proper BC. Direct colloidal probe force measurement
using AFM is proved to be a powerful tool to study the adsorption of cations on
well-defined phyllosilicate surfaces (basal planes and edge surfaces). The
methodology developed in this study opens the door to probe interactions of
various mineral surfaces with process aids under various physicochemical
conditions of the system. From this study the following conclusions are drawn.
1) The basal plane of talc carries a much lower permanent negative surface charge
than the basal plane of mica due to its much lower isomorphic substitution of lattice
Si4+
by Al3+
in the tetrahedron silica sheet, accounting for its hydrophobic nature of
the plane.
2) The fitted Stern potential of both muscovite and talc basal planes became less
negative with the addition of Ca2+
or Mg2+
ions but did not reverse to a positive
value even at Ca2+
or Mg2+
concentrations up to 5 mM. The reduction in the stern
potential is slightly more significant with the Ca2+
addition than with Mg2+
Chapter 5 -101-
addition.
3) The Stern potential of the muscovite edge surface reversed at Ca2+
or Mg2+
concentrations as low as 0.1 mM, and further increased with further increasing
their concentrations. The Stern potential of talc edge surface reversed upon the
addition of 0.1 mM Ca2+
and 1 mM Mg2+
, respectively.
4) The different responses of the Stern potential of the basal plane and edge
surfaces to the divalent cation addition in solution are attributed to the different
surface charging mechanisms and binding mechanisms of each type of surfaces
with divalent cations: the EDL compression predominate the effect on basal planes
and the specific adsorption prevail on the edge surfaces.
5) A slightly stronger impact of Ca2+
ions than Mg2+
ions on Stern potential of
both basal planes and edge surfaces is attributed to less hydrated nature of Ca2+
ions
than Mg2+
ions.
Chapter 5 -102-
5.4 References
[1] Fong, N., Ng, S., Chung, K. H., Tu,Y., Li, Z., Sparks, B. D., Kotlyar, L. S.,
2004, "A Two Level Fractional Factorial Design to Test the Effect of Oil
Sands Composition and Process Water Chemistry on Bitumen Recovery from
Model Systems," Canadian Journal of Chemical Engineering, 82(4) pp.
782-793.
[2] Ding, X., Repka, C., Xu, Z., Masliyah, J. H., 2006, "Effect of Illite Clay and
Divalent Cations on Bitumen Recovery," Canadian Journal of Chemical
Engineering, 84(6) pp. 643-650.
[3] Kasongo, T., Zhou, Z., Xu, Z., Masliyah, J. H., 2000, "Effect of Clays and
Calcium Ions on Bitumen Extraction from Athabasca Oil Sands using
Flotation," Canadian Journal of Chemical Engineering, 78(4) pp. 674-681.
[4] Liu, J., Xu, Z., Masliyah, J. H., 2004, "Role of Fine Clays in Bitumen
Extraction from Oil Sands," AICHE Journal, 50(8) pp. 1917-1927.
[5] Zhou, Z., Xu, Z., Masliyah, J. H., 1999, "Coagulation of Bitumen with Fine
Silica in Model Systems," Colloids and Surfaces A-Physicochemical and
Engineering Aspects, 148(3) pp. 199-211.
[6] Gan, W., Liu, Q., 2008, "Coagulation of Bitumen with Kaolinite in Aqueous
Solutions Containing Ca2+
, Mg2+
and Fe3+
: Effect of Citric Acid," Journal of
Colloid and Interface Science, 324(1-2) pp. 85-91.
[7] Xu, Z., Liu, J., Choung, J., Zhou, Z., 2003, "Electrokinetic Study of Clay
Interactions with Coal in Flotation" International Journal of Mineral
Processing, 68(1-4) pp. 183-196.
[8] Zhao, H., Long, J., Masliyah, J. H., Xu, Z., 2006, "Effect of Divalent Cations
and Surfactants on Silica-Bitumen Interactions," Industrial & Engineering
Chemistry Research, 45(22) pp. 7482-7490.
[9] Ebeling, D., van den Ende, D., Mugele, F., 2011, "Electrostatic Interaction
Forces in Aqueous Salt Solutions of Variable Concentration and Valency,"
Nanotechnology, 22(30) pp. 305706.
[10] Butt, H., 1991, "Measuring Electrostatic, Van der waals and Hydration
Forces in Electrolyte-Solutions with an Atomic Force Microscope,"
Biophysical Journal, 60(6) pp. 1438-1444.
Chapter 5 -103-
[11] de Lint, W., Benes, N., Lyklema, J., 2003, "Ion Adsorption Parameters
Determined from Zeta Potential and Titration Data for a Gamma-Alumina
Nanofiltration Membrane," Langmuir, 19(14) pp. 5861-5868.
[12] Lützenkirchen, J., 2006, "Surface Complexation Modeling," Academic Press,
Amsterdam; London.
[13] Wang, J., Kalinichev, A. G., Kirkpatrick, R. J., 2006, "Effects of Substrate
Structure and Composition on the Structure, Dynamics, and Energetics of
Water at Mineral Surfaces: A Molecular Dynamics Modeling Study,"
Geochimica Et Cosmochimica Acta, 70(3) pp. 562-582.
[14] Bergaya, F., Theng, B. K. G., Lagaly, G., 2006, "Handbook of Clay Science,"
Elsevier, Amsterdam, London.
[15] Du, H., Miller, J. D., 2007, "A Molecular Dynamics Simulation Study of
Water Structure and Adsorption States at Talc Surfaces," International
Journal of Mineral Processing, 84(1-4) pp. 172-184.
[16] Parks, G. A., 1965, "The Isoelectric Points of Solid Oxides, Solid Hydroxides,
and Aqueous Hydroxo Complex Systems," Chemical Reviews, 65(2) pp.
177-198.
[17] Sondi, I., Bišćan, J., Pravdić, V., 1996, "Electrokinetics of Pure Clay
Minerals Revisited," Journal of Colloid and Interface Science, 178(2) pp.
514-522.
[18] Malati, M. A., 1987, "The Role of the Hydration of Cations in their
Adsorption on Oxides," Surface and Coatings Technology, 30(3) pp.
317-325.
[19] James, R. O., Healy, T. W., 1972, "Adsorption of Hydrolyzable Metal-Ions at
Oxide-Water Interface 3. Thermodynamic Model of Adsorption," Journal of
Colloid and Interface Science, 40(1) pp. 65-66.
[20] Smith, D., 1977, "Ionic Hydration Enthalpies," Journal of Chemical
Education, 54(9) pp. 540-542.
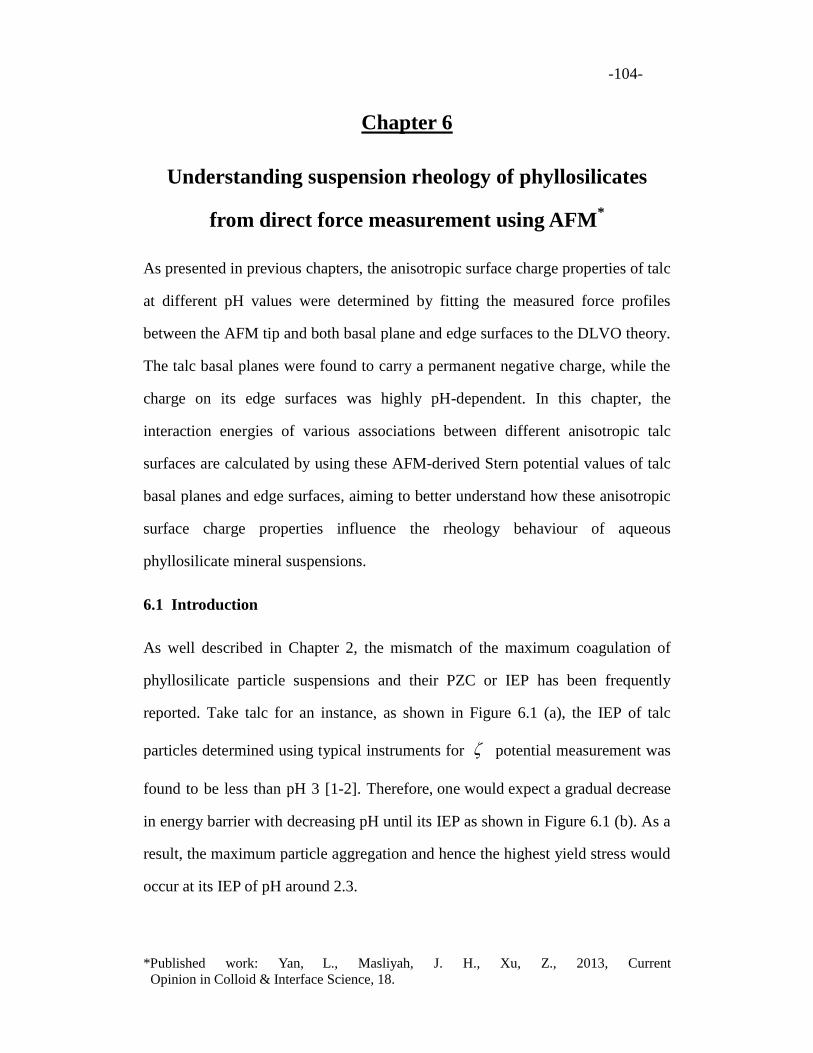
-104-
*Published work: Yan, L., Masliyah, J. H., Xu, Z., 2013, Current
Opinion in Colloid & Interface Science, 18.
Chapter 6
Understanding suspension rheology of phyllosilicates
from direct force measurement using AFM*
As presented in previous chapters, the anisotropic surface charge properties of talc
at different pH values were determined by fitting the measured force profiles
between the AFM tip and both basal plane and edge surfaces to the DLVO theory.
The talc basal planes were found to carry a permanent negative charge, while the
charge on its edge surfaces was highly pH-dependent. In this chapter, the
interaction energies of various associations between different anisotropic talc
surfaces are calculated by using these AFM-derived Stern potential values of talc
basal planes and edge surfaces, aiming to better understand how these anisotropic
surface charge properties influence the rheology behaviour of aqueous
phyllosilicate mineral suspensions.
6.1 Introduction
As well described in Chapter 2, the mismatch of the maximum coagulation of
phyllosilicate particle suspensions and their PZC or IEP has been frequently
reported. Take talc for an instance, as shown in Figure 6.1 (a), the IEP of talc
particles determined using typical instruments for potential measurement was
found to be less than pH 3 [1-2]. Therefore, one would expect a gradual decrease
in energy barrier with decreasing pH until its IEP as shown in Figure 6.1 (b). As a
result, the maximum particle aggregation and hence the highest yield stress would
occur at its IEP of pH around 2.3.
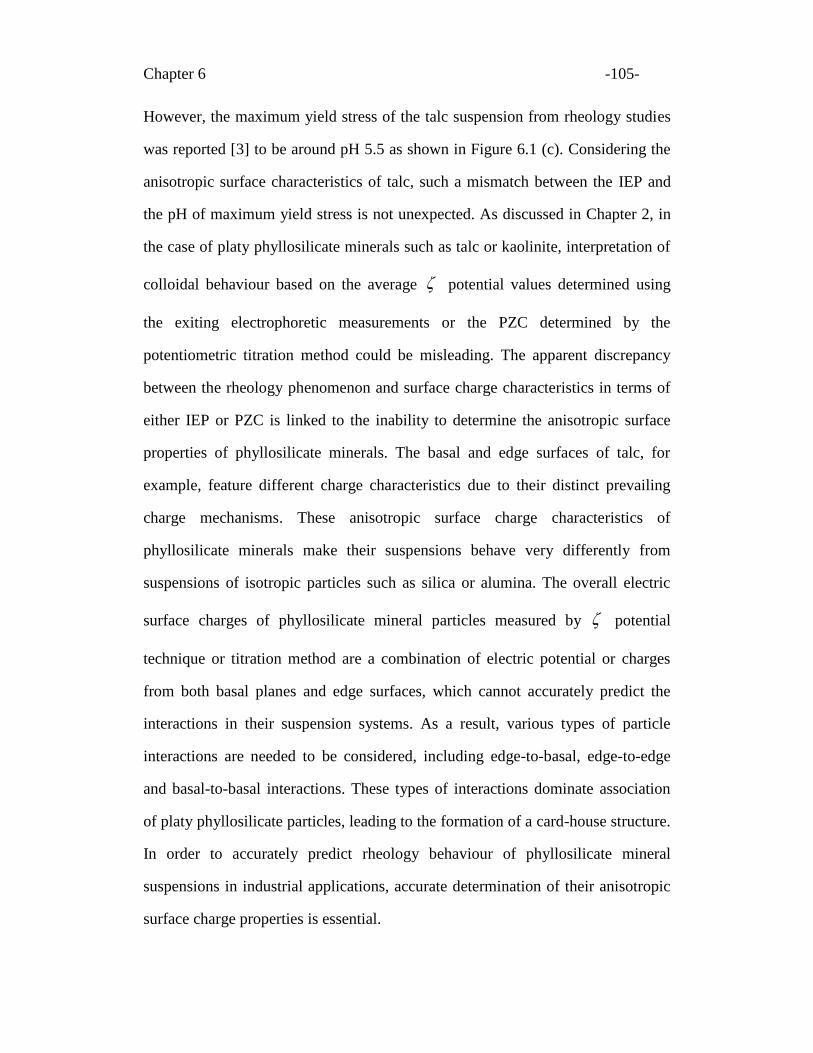
Chapter 6 -105-
However, the maximum yield stress of the talc suspension from rheology studies
was reported [3] to be around pH 5.5 as shown in Figure 6.1 (c). Considering the
anisotropic surface characteristics of talc, such a mismatch between the IEP and
the pH of maximum yield stress is not unexpected. As discussed in Chapter 2, in
the case of platy phyllosilicate minerals such as talc or kaolinite, interpretation of
colloidal behaviour based on the average potential values determined using
the exiting electrophoretic measurements or the PZC determined by the
potentiometric titration method could be misleading. The apparent discrepancy
between the rheology phenomenon and surface charge characteristics in terms of
either IEP or PZC is linked to the inability to determine the anisotropic surface
properties of phyllosilicate minerals. The basal and edge surfaces of talc, for
example, feature different charge characteristics due to their distinct prevailing
charge mechanisms. These anisotropic surface charge characteristics of
phyllosilicate minerals make their suspensions behave very differently from
suspensions of isotropic particles such as silica or alumina. The overall electric
surface charges of phyllosilicate mineral particles measured by potential
technique or titration method are a combination of electric potential or charges
from both basal planes and edge surfaces, which cannot accurately predict the
interactions in their suspension systems. As a result, various types of particle
interactions are needed to be considered, including edge-to-basal, edge-to-edge
and basal-to-basal interactions. These types of interactions dominate association
of platy phyllosilicate particles, leading to the formation of a card-house structure.
In order to accurately predict rheology behaviour of phyllosilicate mineral
suspensions in industrial applications, accurate determination of their anisotropic
surface charge properties is essential.
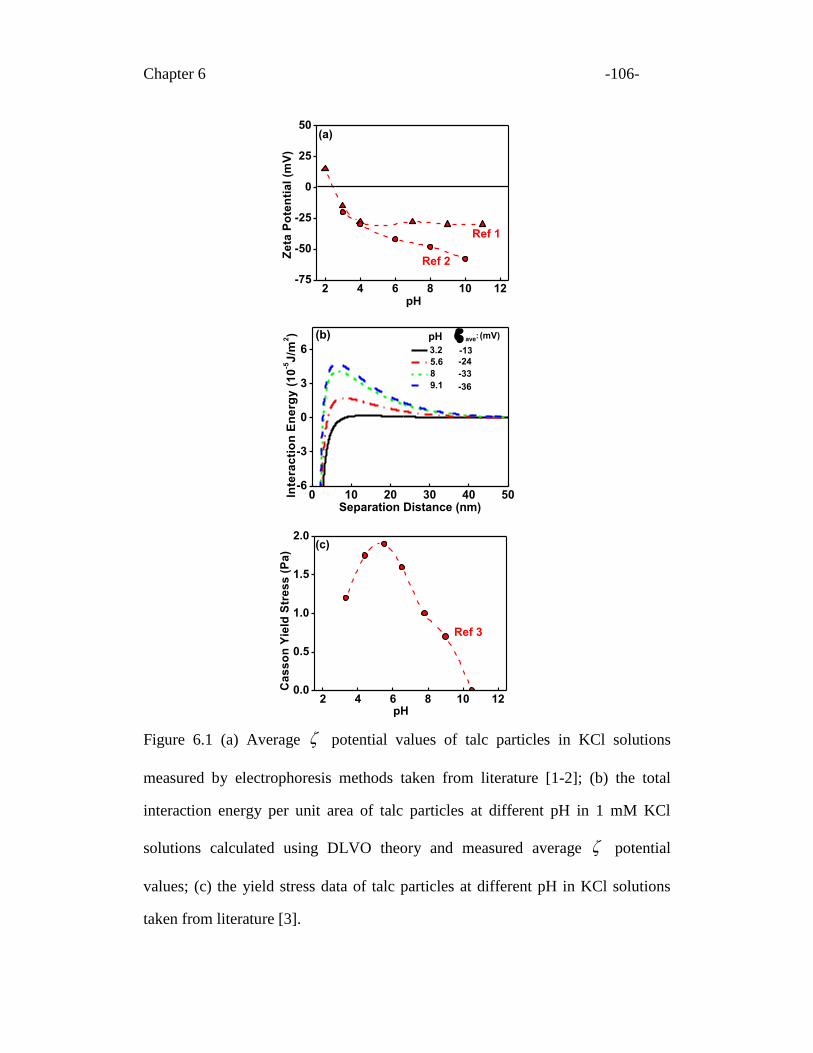
Chapter 6 -106-
2 4 6 8 10 12-75
-50
-25
0
25
50(a)
Ref 2
Ref 1
Ze
ta P
ote
nti
al
(mV
)
pH
Figure 6.1 (a) Average potential values of talc particles in KCl solutions
measured by electrophoresis methods taken from literature [1-2]; (b) the total
interaction energy per unit area of talc particles at different pH in 1 mM KCl
solutions calculated using DLVO theory and measured average potential
values; (c) the yield stress data of talc particles at different pH in KCl solutions
taken from literature [3].
0 10 20 30 40 50-6
-3
0
3
6
(b)
3.2
5.6
8
9.1
Inte
rac
tio
n E
ne
rgy
(1
0-5J
/m2)
Separation Distance (nm)
-13
(mV)pH
-36
-33
ave:
-24
2 4 6 8 10 120.0
0.5
1.0
1.5
2.0
(c)
Ref 3
Ca
ss
on
Yie
ld S
tre
ss
(P
a)
pH
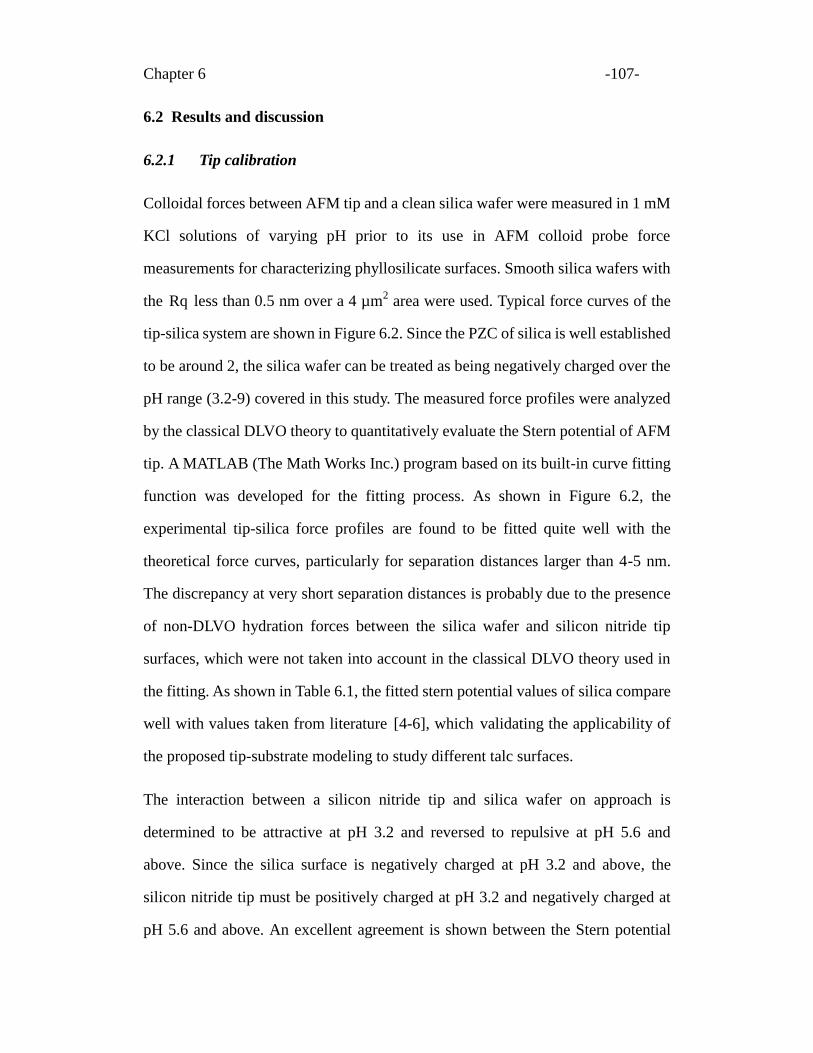
Chapter 6 -107-
6.2 Results and discussion
6.2.1 Tip calibration
Colloidal forces between AFM tip and a clean silica wafer were measured in 1 mM
KCl solutions of varying pH prior to its use in AFM colloid probe force
measurements for characterizing phyllosilicate surfaces. Smooth silica wafers with
the Rq less than 0.5 nm over a 4 µm2 area were used. Typical force curves of the
tip-silica system are shown in Figure 6.2. Since the PZC of silica is well established
to be around 2, the silica wafer can be treated as being negatively charged over the
pH range (3.2-9) covered in this study. The measured force profiles were analyzed
by the classical DLVO theory to quantitatively evaluate the Stern potential of AFM
tip. A MATLAB (The Math Works Inc.) program based on its built-in curve fitting
function was developed for the fitting process. As shown in Figure 6.2, the
experimental tip-silica force profiles are found to be fitted quite well with the
theoretical force curves, particularly for separation distances larger than 4-5 nm.
The discrepancy at very short separation distances is probably due to the presence
of non-DLVO hydration forces between the silica wafer and silicon nitride tip
surfaces, which were not taken into account in the classical DLVO theory used in
the fitting. As shown in Table 6.1, the fitted stern potential values of silica compare
well with values taken from literature [4-6], which validating the applicability of
the proposed tip-substrate modeling to study different talc surfaces.
The interaction between a silicon nitride tip and silica wafer on approach is
determined to be attractive at pH 3.2 and reversed to repulsive at pH 5.6 and
above. Since the silica surface is negatively charged at pH 3.2 and above, the
silicon nitride tip must be positively charged at pH 3.2 and negatively charged at
pH 5.6 and above. An excellent agreement is shown between the Stern potential
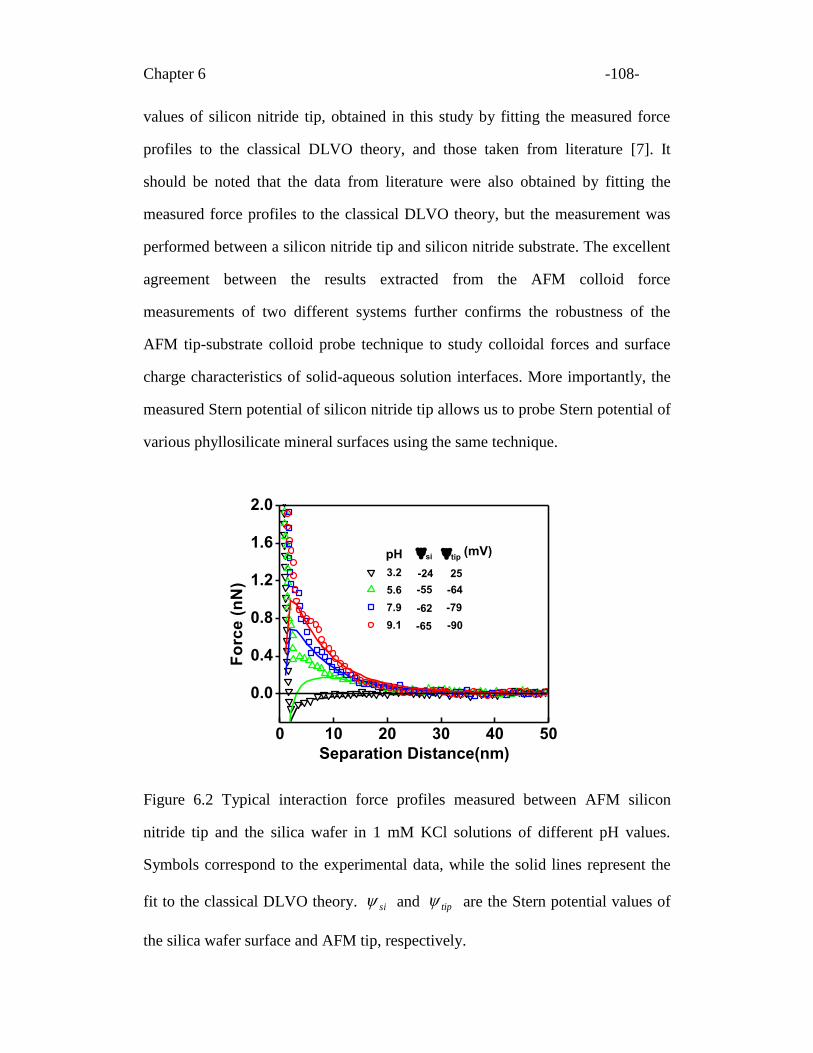
Chapter 6 -108-
values of silicon nitride tip, obtained in this study by fitting the measured force
profiles to the classical DLVO theory, and those taken from literature [7]. It
should be noted that the data from literature were also obtained by fitting the
measured force profiles to the classical DLVO theory, but the measurement was
performed between a silicon nitride tip and silicon nitride substrate. The excellent
agreement between the results extracted from the AFM colloid force
measurements of two different systems further confirms the robustness of the
AFM tip-substrate colloid probe technique to study colloidal forces and surface
charge characteristics of solid-aqueous solution interfaces. More importantly, the
measured Stern potential of silicon nitride tip allows us to probe Stern potential of
various phyllosilicate mineral surfaces using the same technique.
0 10 20 30 40 50
0.0
0.4
0.8
1.2
1.6
2.0
Fo
rce
(n
N)
Separation Distance(nm)
3.2
5.6
7.9
9.1
25-24
-90
-79
-64
-65
-62
tip
(mV)pH si
-55
Figure 6.2 Typical interaction force profiles measured between AFM silicon
nitride tip and the silica wafer in 1 mM KCl solutions of different pH values.
Symbols correspond to the experimental data, while the solid lines represent the
fit to the classical DLVO theory. si and tip are the Stern potential values of
the silica wafer surface and AFM tip, respectively.
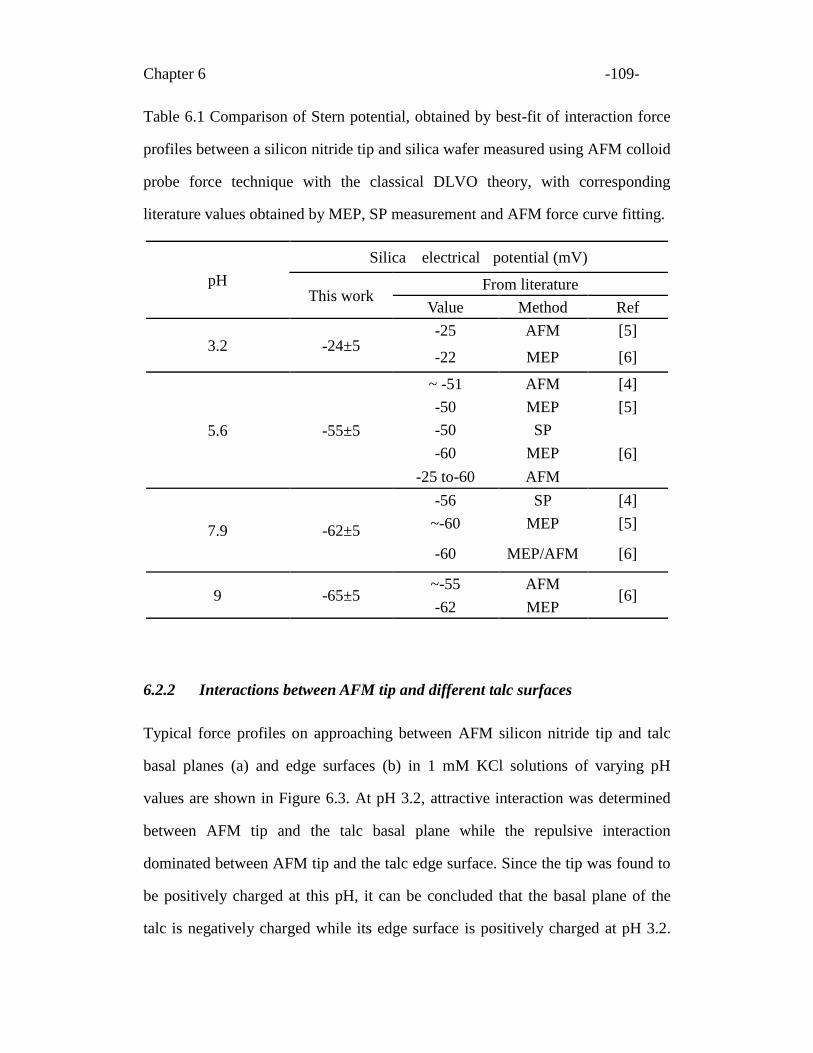
Chapter 6 -109-
Table 6.1 Comparison of Stern potential, obtained by best-fit of interaction force
profiles between a silicon nitride tip and silica wafer measured using AFM colloid
probe force technique with the classical DLVO theory, with corresponding
literature values obtained by MEP, SP measurement and AFM force curve fitting.
pH
Silica electrical potential (mV)
This work From literature
Value Method Ref
3.2 -24±5 -25 AFM [5]
-22 MEP [6]
5.6 -55±5
~ -51 AFM [4]
-50 MEP [5]
-50 SP
[6] -60 MEP
-25 to-60 AFM
7.9 -62±5
-56 SP [4]
~-60 MEP [5]
-60 MEP/AFM [6]
9 -65±5 ~-55 AFM
[6] -62 MEP
6.2.2 Interactions between AFM tip and different talc surfaces
Typical force profiles on approaching between AFM silicon nitride tip and talc
basal planes (a) and edge surfaces (b) in 1 mM KCl solutions of varying pH
values are shown in Figure 6.3. At pH 3.2, attractive interaction was determined
between AFM tip and the talc basal plane while the repulsive interaction
dominated between AFM tip and the talc edge surface. Since the tip was found to
be positively charged at this pH, it can be concluded that the basal plane of the
talc is negatively charged while its edge surface is positively charged at pH 3.2.
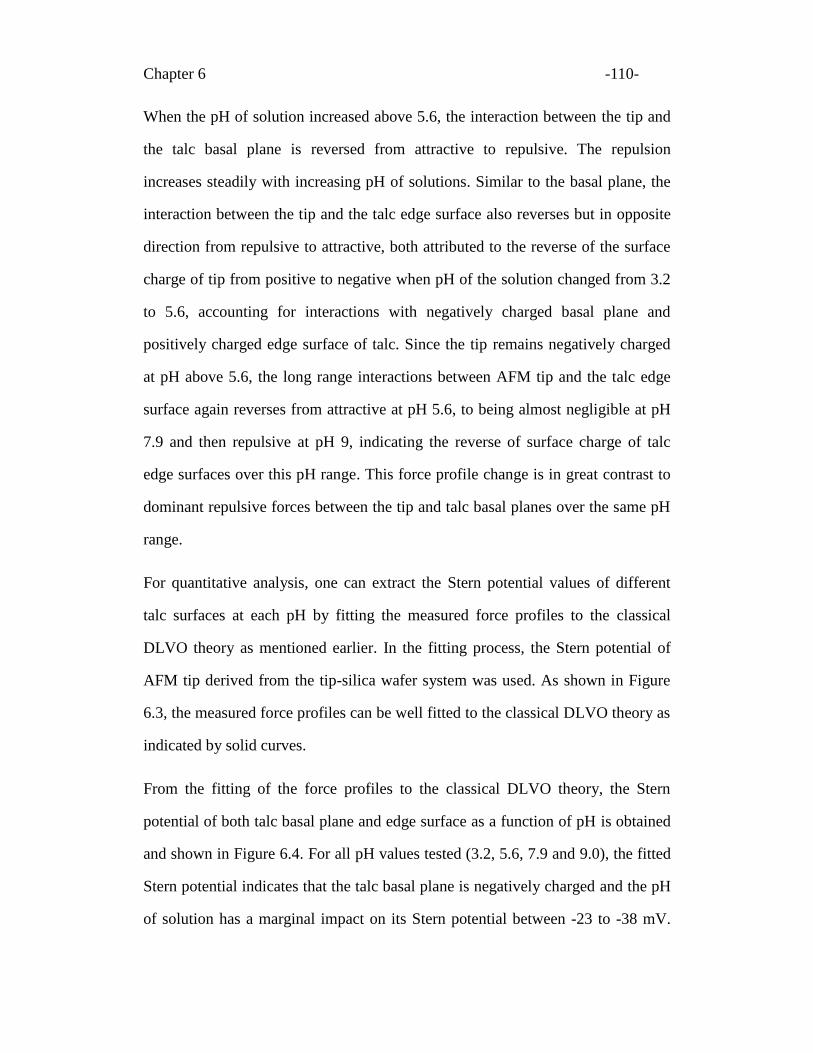
Chapter 6 -110-
When the pH of solution increased above 5.6, the interaction between the tip and
the talc basal plane is reversed from attractive to repulsive. The repulsion
increases steadily with increasing pH of solutions. Similar to the basal plane, the
interaction between the tip and the talc edge surface also reverses but in opposite
direction from repulsive to attractive, both attributed to the reverse of the surface
charge of tip from positive to negative when pH of the solution changed from 3.2
to 5.6, accounting for interactions with negatively charged basal plane and
positively charged edge surface of talc. Since the tip remains negatively charged
at pH above 5.6, the long range interactions between AFM tip and the talc edge
surface again reverses from attractive at pH 5.6, to being almost negligible at pH
7.9 and then repulsive at pH 9, indicating the reverse of surface charge of talc
edge surfaces over this pH range. This force profile change is in great contrast to
dominant repulsive forces between the tip and talc basal planes over the same pH
range.
For quantitative analysis, one can extract the Stern potential values of different
talc surfaces at each pH by fitting the measured force profiles to the classical
DLVO theory as mentioned earlier. In the fitting process, the Stern potential of
AFM tip derived from the tip-silica wafer system was used. As shown in Figure
6.3, the measured force profiles can be well fitted to the classical DLVO theory as
indicated by solid curves.
From the fitting of the force profiles to the classical DLVO theory, the Stern
potential of both talc basal plane and edge surface as a function of pH is obtained
and shown in Figure 6.4. For all pH values tested (3.2, 5.6, 7.9 and 9.0), the fitted
Stern potential indicates that the talc basal plane is negatively charged and the pH
of solution has a marginal impact on its Stern potential between -23 to -38 mV.
Chapter 6 -111-
This finding further confirms the charge deficiency on the talc basal plane by
isomorphic substitution and suggests a negligible hydrolysis of the siloxane group
(-Si-O-Si-) on the talc basal plane over the given pH range tested as anticipated.
0 10 20 30 40 50
0.0
0.3
0.6
0.9
1.2
0 10 20 30 40 50
pH 3.2
(b)
Fo
rce
(n
N)
Separation Distance (nm)
(a)
(a) mV
te : 35
tip : 25
mV
tb : -23
tip : 25
0 10 20 30 40 50
0.0
0.3
0.6
0.9
1.2
0 10 20 30 40 50
Fo
rce
(n
N)
Separation Distance (nm)
pH 5.6
(b)(a) mV
te : 30
tip : -64
mV
tb : -31
tip : -64
Figure 6.3 Typical force profiles measured between AFM tip and (a) talc basal
planes and (b) edge surfaces in 1 mM KCl solutions as a function of aqueous
solution pH. Symbols correspond to experimental data, while the solid lines
represent theoretical fit of DLVO theory. tb and te are the fitted Stern
potential values of the talc basal plane and edge surface, respectively.
At pH below 7.9, the talc edge surface is positively charged. The Stern potential at
pH 3.2, 5.6 and 7.9 is determined to be 35 mV, 30 mV and 6 mV, respectively. When
increasing the pH from 7.9 to 9, the Stern potential reverses to -27 mV. These
0 10 20 30 40 50
0.0
0.3
0.6
0.9
1.2
0 10 20 30 40 50
Fo
rce
(n
N)
Separation Distance (nm)
tip : -90
pH 9
(b)(a)
mV
te : -27
mV
tb : -38
tip : -90
0 10 20 30 40 50
0.0
0.3
0.6
0.9
1.2
0 10 20 30 40 50
tip : -79
pH 7.9
Fo
rce
(n
N)
Separation Distance (nm)
(b)(a)
mV
te : 6
mV
tb : -34
tip : -79
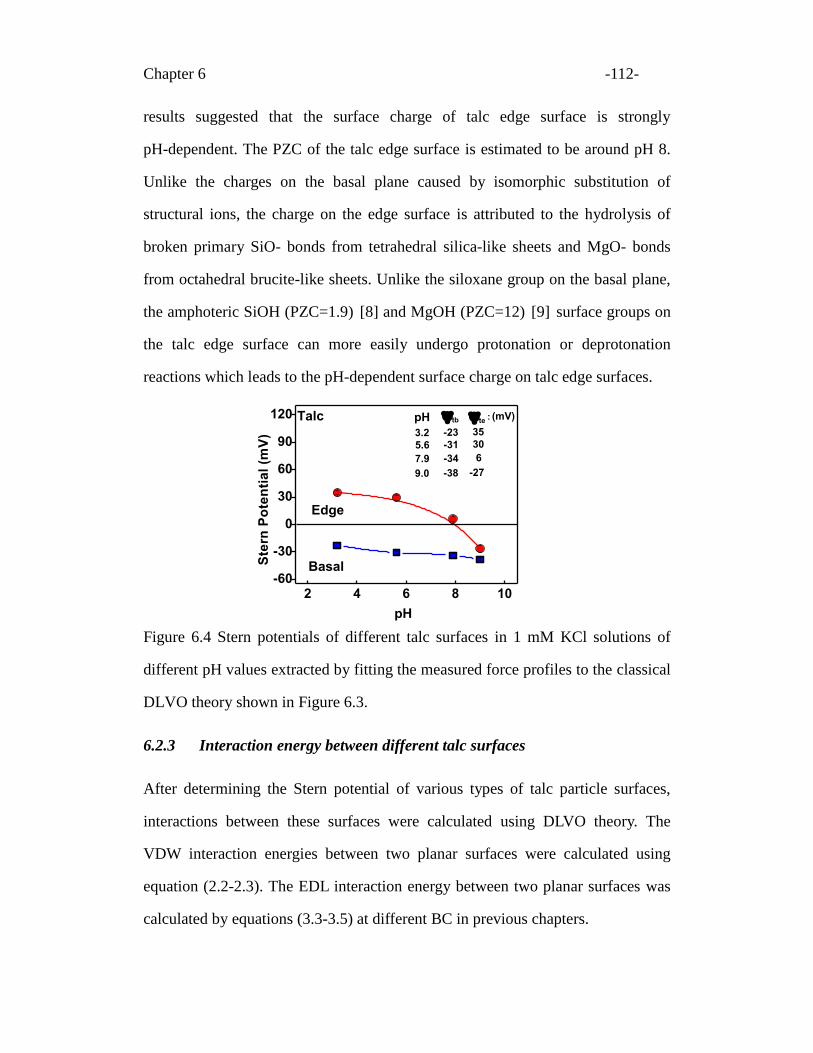
Chapter 6 -112-
results suggested that the surface charge of talc edge surface is strongly
pH-dependent. The PZC of the talc edge surface is estimated to be around pH 8.
Unlike the charges on the basal plane caused by isomorphic substitution of
structural ions, the charge on the edge surface is attributed to the hydrolysis of
broken primary SiO- bonds from tetrahedral silica-like sheets and MgO- bonds
from octahedral brucite-like sheets. Unlike the siloxane group on the basal plane,
the amphoteric SiOH (PZC=1.9) [8] and MgOH (PZC=12) [9] surface groups on
the talc edge surface can more easily undergo protonation or deprotonation
reactions which leads to the pH-dependent surface charge on talc edge surfaces.
Figure 6.4 Stern potentials of different talc surfaces in 1 mM KCl solutions of
different pH values extracted by fitting the measured force profiles to the classical
DLVO theory shown in Figure 6.3.
6.2.3 Interaction energy between different talc surfaces
After determining the Stern potential of various types of talc particle surfaces,
interactions between these surfaces were calculated using DLVO theory. The
VDW interaction energies between two planar surfaces were calculated using
equation (2.2-2.3). The EDL interaction energy between two planar surfaces was
calculated by equations (3.3-3.5) at different BC in previous chapters.
2 4 6 8 10-60
-30
0
30
60
90
120 Talc
Ste
rn P
ote
nti
al
(mV
)
pH
Edge
Basal
-23
pH
-38
-34
tb
-31
35
(mV)
-27
6
te :
303.2
5.6
7.9
9.0
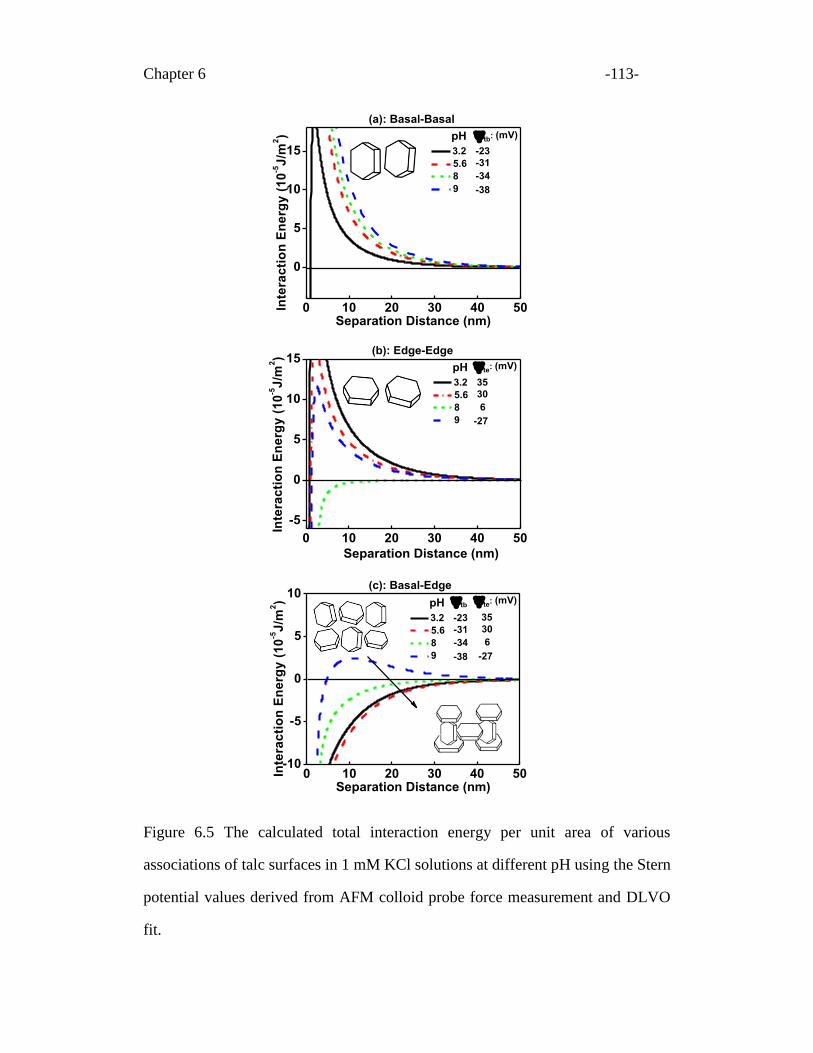
Chapter 6 -113-
0 10 20 30 40 50
0
5
10
15
(a): Basal-Basal
Inte
rac
tio
n E
ne
rgy
(1
0-5J
/m2)
Separation Distance (nm)
3.2
5.6
8
9
-23
pH
-38
-34
tb: (mV)
-31
0 10 20 30 40 50-10
-5
0
5
10
(c): Basal-Edge
Inte
rac
tio
n E
ne
rgy
(1
0-5J
/m2)
Separation Distance (nm)
3.2
5.6
8
9
-23
pH
-38
-34
tb
-31
35
-27
6
te: (mV)
30
Figure 6.5 The calculated total interaction energy per unit area of various
associations of talc surfaces in 1 mM KCl solutions at different pH using the Stern
potential values derived from AFM colloid probe force measurement and DLVO
fit.
0 10 20 30 40 50
-5
0
5
10
15
(b): Edge-Edge
Inte
rac
tio
n E
ne
rgy
(1
0-5J
/m2)
Separation Distance (nm)
3.2
5.6
8
9
35
pH
-27
6
te: (mV)
30
Chapter 6 -114-
In talc suspensions system, three types of particle associations may occur:
basal–basal, edge–edge and basal–edge. Using the Stern potential values in Figure
6.4 of talc basal planes and edge surfaces, derived from the fitting of the measured
force profiles to the classical DLVO theory, the interaction energy of each kind of
association calculated at different pH values is shown in Figure 6.5.
As it is revealed in Figure 6.4 that the talc basal plane carried permanent negative
surface charge and insensitive to the change of solution pH, the electrostatic
interaction energy between basal planes was calculated by using equation (3.3) for
constant surface charge density case. As shown in Figure 6.5 (a), the basal-basal
interactions are all repulsive over the pH range studied. Compare to the van der
Waals attraction, the electrostatic repulsion was much stronger and dominant in
the total interaction energy between the two basal planes. The energy barrier is
observed to be significantly high. By lowering the solution pH to 3.2, only a slight
decrease in the energy barrier is observed due to its pH-insensitive nature of the
Stern potential.
In contrast to the fixed negative surface charge of talc basal planes caused by
isomorphic substitution, the charge of talc edge surface was highly pH-dependent,
which is negative at pH 9 and reverses to positive value at pH less than 8. Such
charge characteristics led to interesting interaction energy profiles of Figure 6.5 (b)
using the electrostatic interaction energy between edges was calculated using the
equation (3.4) for the constant electric surface potential case. At lower pH 3.2 and
5.6, the edge surfaces are highly repulsive although the energy barrier is lower at
pH 5.6 than at pH 3.2. At pH 8, the force profile shows a negligible energy barrier
due to a negligible surface charge of talc edge surface at this pH. In this case the
VDW attraction dominates the total interaction between the two edge surfaces.
Chapter 6 -115-
With the pH of the solution being increased to 9, the EDL repulsion becomes
more dominant than VDW forces, leading again to a noticeable energy barrier due
to charge reverse to a Stern potential of -27 mV.
In the case of association between talc edge surfaces and basal planes in Figure
6.5 (c), the EDL interaction energy between the basal plane and the edge surface
was calculated using the equation (3.5) for the mixed case and a strong repulsion
was obtained at pH 9. At this pH both the talc basal plane and edge surface are
negatively charged. These similarly charged surfaces repelled each other, leading
to a strong repulsive energy barrier as shown in Figure 6.5 (c). At pH 8, talc basal
plane remains negatively charged while its edge surface becomes already slightly
positively charged. Due to the opposite sign of surface charges of the basal plane
and edge surface, the electrostatic interaction is reversed from repulsive to
attractive. As a result, the talc basal planes and edge surfaces are monotonically
attractive, leading to the formation of three dimensional card-house structure as
shown schematically in the inset of Figure 6.5 (c). This attraction becomes even
stronger as the positive charges of the edge surface increases with decreasing pH,
and reaches the maximum at pH 5.6 where the difference in Stern potentials
between the two surfaces is at its maximum (61 mV). With a further decrease in
pH to 3.2, the EDL attraction becomes slightly weaker due to a slightly smaller
Stern potential difference as compared with the value at pH 5.6.
6.2.4 Predicting rheology of talc suspensions
Instead of using interaction energies calculated from average potential values
shown in Figure 6.1, the rheology or yield stress of talc suspensions can be better
explained using the interaction energy profiles calculated from Stern potential
values of each kind of surfaces for their association (basal-basal, edge-edge,
Chapter 6 -116-
basal-edge) at different pH values as shown in Figure 6.5. At pH higher than 9,
the double-layer repulsion governs the interactions of all three associations
between talc basal planes, edge surfaces or basal plane and edge surfaces, leading
to a well dispersed talc suspension and hence low yield stress of suspensions, as
shown in Figure 6.1 (c). When the charge of talc edge surface reversed from
negative to positive with decreasing the pH of the solution to 8, the interaction
between talc basal plane and edge surfaces becomes attractive while there is little
repulsion between edge-edge surfaces. Such an interaction system would lead to
formation of three dimensional card house structures from basal-edge association
with limited edge-edge alignment and without stack of basal planes due to strong
repulsion between the basal planes. As a result, an increase in yield stress is
anticipated as shown in Figure 6.1 (c). A further decrease in pH to 5.6 led to the
strongest attraction between the edge surfaces and basal planes, while the forces
between edge-edge and basal plane-basal plane are strongly repulsive. Such a
system would lead to the highest probability of card-house formation due to the
strongest attraction between the basal and edge planes and hence the highest yield
stress as observed. A further decrease in suspension pH to 3.2 led to a slight
decrease in attraction between talc edge surface and basal planes while the
association between talc edges shows a strong repulsive energy barrier. At the
same time, the energy barrier between talc basal planes is also decreased. In this
case, a slightly weaker association between talc basal planes and edges are
anticipated while there some weak basal plane stacking, leading to weaker
card-house structure and hence slightly lower yield stress than at pH 5.6, as shown
in Figure 6.1 (c). It appears that the attractive interaction between talc basal planes
and edge surfaces dominates rheological properties of talc suspensions. To reduce
the yield stress and hence improve the flow of talc suspensions, it is of paramount
Chapter 6 -117-
importance to adjust systems in such a way that minimizes attraction between
basal planes and edge surface by increasing pH or more preferably adding
dispersants which interact specifically with edge surfaces.
Similar rheological characteristics of the montmorillonite and bentonite
suspension were reported [10-11]. Although various hypotheses has been
proposed to account for the observed discrepancy between the measured rheology
and that predicted based on the average potential or surface charge density of
phyllosilicate minerals, extension of our study to these systems would lead to
definitive mechanism that controlling the rheology of suspensions consisting of
anisotropically-charged solids.
6.3 Summary
Following successful preparation of sufficiently smooth talc edge surfaces by the
ultramicrotome method for AFM colloid probe force measurement, anisotropic
surface charge properties of talc at different pH values were determined by fitting
the measured force profiles between the AFM tip and both talc basal plane and
edge surfaces to the classical DLVO theory. The talc basal planes were found to
carry a permanent negative charge, while the charge on its edge surfaces was
highly pH-dependent, negative at pH 9 and positive at pH less than 8.
The Stern potential values of talc basal planes and edge surfaces obtained from
fitting of the measured force profiles allowed us to calculate the interaction
energy for association between anisotropically-charged phyllosilicate surfaces,
such as basal plane-basal plane, edge-edge and basal plane-edge. The results
confirmed the attractive interaction between talc basal planes and edge surfaces
dominates the rheological behaviour.
Chapter 6 -118-
The highest probability of card-house formation between talc edge surfaces and
basal planes was determined at pH 5.6, which corresponds well with the measured
highest yield stress of talc suspensions.
Our study clearly demonstrates the necessity of determining anisotropic surface
charge characteristics if one would want to improve their understanding of
rheological properties and hence better control their process performance.
Chapter 6 -119-
6.4 References
[1] Morris, G., Fornasiero, D., Ralston, J., 2002, "Polymer Depressants at the
Talc-Water Interface: Adsorption Isotherm, Microflotation and Electrokinetic
Studies," International Journal of Mineral Processing, 67(1-4) pp. 211-227.
[2] Burdukova, E., Becker, M., Bradshaw, D. J., 2007, "Presence of Negative
Charge on the Basal Planes of New York Talc," Journal of Colloid and
Interface Science, 315(1) pp. 337-342.
[3] Wang, J., Somasundaran, P., 2005, "Adsorption and Conformation of
Carboxymethyl Cellulose at Solid-Liquid Interfaces using Spectroscopic,
AFM and Allied Techniques," Journal of Colloid and Interface Science, 291(1)
pp. 75-83.
[4] Zhao, H., Bhattacharjee, S., Chow, R., Wallace, D., Masliyah, J. H., Xu, Z.
2008, "Probing Surface Charge Potentials of Clay Basal Planes and Edges by
Direct Force Measurements," Langmuir, 24(22) pp. 12899-12910.
[5] Liu, J., Xu, Z., Masliyah, J. H., 2003, "Studies on Bitumen−Silica Interaction
in Aqueous Solutions by Atomic Force Microscopy," Langmuir, 19(9) pp.
3911-3920.
[6] Hartley, P. G., Larson, I., Scales, P. J., 1997, "Electrokinetic and Direct Force
Measurements between Silica and Mica Surfaces in Dilute Electrolyte,
Solutions," Langmuir, 13(8) pp. 2207-2214.
[7] Yin, X., Drelich, J., 2008, "Surface Charge Microscopy: Novel Technique for
Mapping Charge-Mosaic Surfaces in Electrolyte Solutions," Langmuir, 24(15)
pp. 8013-8020.
[8] Avena, M. J., Mariscal, M. M., De Pauli, C. P., 2003, "Proton Binding at Clay
Surfaces in Water," Applied Clay Science, 24(1-2) pp. 3-9.
[9] Pokrovsky, O. S., Schott, J., 2004, "Experimental Study of Brucite Dissolution
and Precipitation in Aqueous Solutions: Surface Speciation and Chemical
Affinity Control," Geochimica Et Cosmochimica Acta, 68(1) pp. 31-45.
[10] Brandenburg, U., Lagaly, G., 1988, "Rheological Properties of Sodium
Montmorillonite Dispersions." Applied Clay Science, 3(3) pp. 263-279.
[11] Benna, M., Kbir-Ariguib, N., Magnin, A., 1999, "Effect of pH on
Rheological Properties of Purified Sodium Bentonite Suspensions," Journal
of Colloid and Interface Science, 218(2) pp. 442-455.
-120-
Chapter 7
Adsorption and conformation of polysaccharide on
anisotropic phyllosilicates:
Effect of ionic strength
Following the investigation of surface charging characteristic of different
phyllosilicate in various solutions, some preliminary results of polymer adsorption
on different talc surfaces are presented in this chapter. The adsorption of
carboxymethyl cellulose (CMC) on distinct talc basal plane and edge surfaces in
solutions of various ionic strengths is investigated by in situ AFM imaging
technique, aiming to provide some fundamental insights on the mechanisms of
polysaccharide adsorption on anisotropic phyllosilicate surfaces.
7.1 Introduction
Utilization of polymers as process aids in mineral processing is well documented.
By interacting with mineral particles and altering the interactions between mineral
particles and air bubbles, polymers can play various roles, such as acting as
flocculent, dispersant or depressant in industrial processes such as selective
flotation, desliming, or dewatering.
Commercial synthetic polymers such as polyacrylamide (PAM) have been
routinely selected as process aids in mineral processing. However, most PAM
based polymers are extremely toxic and environmentally unacceptable. Therefore,
as a promising substitute, natural organic polysaccharides such as cellulose or
starch are often considered due to their non-toxic and biodegradable nature. In
fact, they are widely used as depressants for iron surphide and talc which are
Chapter 7 -121-
inherently hydrophobic minerals or other rock forming gangue minerals [1-3].
The adsorption of polysaccharides at mineral surfaces is dependent on both the
solution condition (such as the ionic strength and/or pH of the solution) and the
surface property of the mineral (such as the hydrophobicity or chemical nature).
Among these variables, the ionic strength of the solution was reported to be a
crucial factor on adsorption of some polysaccharides on various mineral surfaces
such as illite, dolomite and talc [4-6], leading to totally different stability
behaviour of mineral suspensions.
Polymer adsorption on minerals has been extensively investigated using both the
molecular modeling and experimental measurements. In the view of the
experimental studies, infrared spectroscopy (IR) studies are widely used to
investigate the interactions between the functional groups of polymers and
mineral surfaces [7-9]. The shortcoming of IR method is that the IR results
reported so far are based on dried samples, which are drastically different from
most real scenarios of polymer adsorption on the mineral surface occurring and
corresponding functions in the aqueous solutions. The state of polymers could be
substantially alternated during the dehydration process. Electrophoresis
measurement is another conventional experimental method being used to study
polymer adsorption on mineral surfaces [4, 10-12]. The electrophoretic mobility
of suspensions in solution was measured, which is then converted to potential
values of the particles. However, the equations used for the conversion are
derived for spherical or near-spherical particles with the assumption that the
charges of particles are uniformly distributed on the mineral surfaces. No single
model is well developed to properly describe the movement of anisotropic
particles under a given electric field. The total electric surface charge of
Chapter 7 -122-
phyllosilicate particles determined by the potential measurement method is
just a combined effect of charges from both the basal planes and edge surfaces
which can vary with the basal/edge area ratio of particles. Therefore, in the case of
anisotropic phyllosilicate suspensions, the interpretation of colloidal behaviour
based on potential values determined by the existing electrophoretic methods
could be misleading.
AFM has been widely used to study the adsorption of polysaccharides on both
hydrophobic (such as talc, molybdenite and graphite) and hydrophilic mineral
(such as chalcopyrite, clinochlore or sphalerite) surfaces [13-14]. By analyzing the
images of the adsorbed polymer layers on mineral surfaces, AFM provides the
possibility to directly investigate the conformation or morphological change of
adsorbed polymer on mineral surfaces in different environments. Especially, by
employing the in situ AFM imaging, the response of the adsorbed polymer to the
change of the solution condition (alteration of polymer or electrolyte concentration)
can be monitored. Based on AFM images, for example, Kaggwa et al. [15] found
that the roughness of the surface, the substituted functional group and molecular
weight of the polymer all play a role in affecting the morphology of adsorbed
polymer on treated silica surfaces. Beattie’s group studied systematically the
adsorption of different polysaccharides with various functional groups, degree of
substitution and molecular weight on both hydrophobic and hydrophilic minerals [6,
13-14, 16-19]. They found that not only the functional group on the polymer chain
or the molecular weight of the polymer can affect the conformation and
morphology of the adsorbed polymer layer on the mineral surfaces; different
morphologies of the adsorbed polymer layer were also evolved on surfaces of
similar hydrophobicity and surface roughness.
Chapter 7 -123-
More importantly, the morphological features such as the surface coverage or
thickness of polymer layer on the mineral surface shown in AFM images were
proven to be closely related to the depressant efficiency of the polymer in mineral
processing. Based on this relation, the information obtained from the AFM image
at different conditions is considered as a key parameter to predict the polymer
performance on certain minerals in industrial mineral processing.
In spite of a large number of studies, the adsorption mechanism of the
polysaccharides on anisotropic mineral surfaces remains a subject for
debate. Taking the typical magnesium phyllosilicate talc as an example, many
adsorption mechanisms have been proposed based on both experimental or
simulation results, to govern the adsorption process of the polysaccharide on the
talc surface. Based on the variable adsorption of CMC on the talc samples of
different hydrophobicities, Steenberg [20] proposed hydrophobic interaction
between the CMC and talc particle being the main mechanism of CMC adsorption
on talc surface. In contrast, Wang et al. [7] observed by employing the
fluorescence spectroscopy that the hydrophilic instead of hydrophobic domains
were formed on the interface between the labeled CMC and the talc surface in
aqueous solutions. Adding the hydrogen bond breaker (urea) to the solution led to
a significant reduction in the adsorption of CMC on talc surface. The strong
hydrogen bonding of CMC on talc was confirmed by their FTIR study.
Furthermore, they found the adsorption of CMC on talc surface being affected by
the changes of the pH and ionic strength of the solution. Based on these
experimental results, combined with their molecular modeling, they suggested
that the main driving force for CMC adsorption on the talc surface is a
combination of hydrogen bonding and electrostatic interaction rather than
hydrophobic interaction.
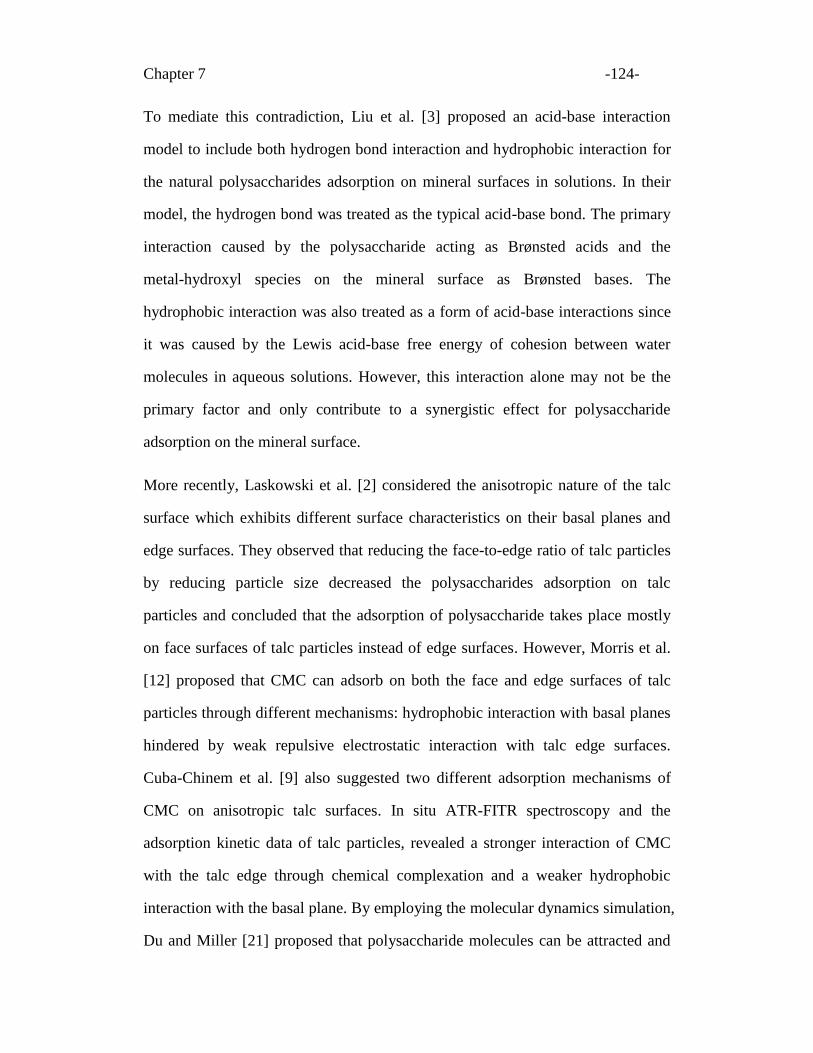
Chapter 7 -124-
To mediate this contradiction, Liu et al. [3] proposed an acid-base interaction
model to include both hydrogen bond interaction and hydrophobic interaction for
the natural polysaccharides adsorption on mineral surfaces in solutions. In their
model, the hydrogen bond was treated as the typical acid-base bond. The primary
interaction caused by the polysaccharide acting as Brønsted acids and the
metal-hydroxyl species on the mineral surface as Brønsted bases. The
hydrophobic interaction was also treated as a form of acid-base interactions since
it was caused by the Lewis acid-base free energy of cohesion between water
molecules in aqueous solutions. However, this interaction alone may not be the
primary factor and only contribute to a synergistic effect for polysaccharide
adsorption on the mineral surface.
More recently, Laskowski et al. [2] considered the anisotropic nature of the talc
surface which exhibits different surface characteristics on their basal planes and
edge surfaces. They observed that reducing the face-to-edge ratio of talc particles
by reducing particle size decreased the polysaccharides adsorption on talc
particles and concluded that the adsorption of polysaccharide takes place mostly
on face surfaces of talc particles instead of edge surfaces. However, Morris et al.
[12] proposed that CMC can adsorb on both the face and edge surfaces of talc
particles through different mechanisms: hydrophobic interaction with basal planes
hindered by weak repulsive electrostatic interaction with talc edge surfaces.
Cuba-Chinem et al. [9] also suggested two different adsorption mechanisms of
CMC on anisotropic talc surfaces. In situ ATR-FITR spectroscopy and the
adsorption kinetic data of talc particles, revealed a stronger interaction of CMC
with the talc edge through chemical complexation and a weaker hydrophobic
interaction with the basal plane. By employing the molecular dynamics simulation,
Du and Miller [21] proposed that polysaccharide molecules can be attracted and
Chapter 7 -125-
stabilized at the talc basal plane with strong affinity while do not adsorb on the
talc edge surface due to strong interaction between talc edge surfaces and
surrounding water molecules.
Despite great efforts to elucidate how polymers adsorb on phyllosilicates, how the
specific surface of talc interacts with polymers remains unresolved, due to the
lack of direct experimental technique to probe the adsorption of polymers on their
basal planes or edge surfaces. Up to date, most experiments were still limited to
basal planes or simply rough surfaces due to the difficulties in preparing
sufficiently smooth phyllosilicate edge surfaces. Simulation results on the edge
surface are hard to be confirmed by experimental results.
In this chapter, the influence of ionic strength of KCl solutions on polysaccharide
adsorption on anisotropic phyllosilicate surfaces is investigated by in situ AFM
imaging, aiming to provide some fundamental insights on adsorption mechanisms
for specific surfaces.
7.2 Experimental
7.2.1 Polysaccharide solution
CMC sodium salt (MW 70 kD, DS 0.7) supplied by Aldrich Inc. was used in this
study. A stock solution of 2500 mg L−1
was prepared by dissolving the polymer
powders in background electrolyte (KCl) solutions overnight to ensure complete
hydration of the polymer. The potential value of CMC was determined by
Nano-ZS Zetasizer (Malvern Instruments Ltd., Worcestershire, UK) and the
radius of gyration of CMC was determined by dynamic light scattering (DLS)
using an ALV 5022 laser light-scattering instrument equipped with a cylindrical
He-Ne laser at a scattering angle of 90°. The DLS experiments were completed in
Chapter 7 -126-
10 minutes and repeated at least twice. The CONTIN program supplied with the
correlator was used to calculate the radius of gyration.
7.2.2 AFM imaging
The Peak Force Tapping imaging technique provided in quantitative
nanomechanical mapping mode of AFM (Veeco Instruments Inc., Santa Barbara,
CA, USA) is used for taking images. In this new model, the tip-sample interaction
forces instead of cantilever amplitude in common tapping was monitored and
controlled, which makes the operation inherently more stable in both air and
liquid. Therefore, the quality of obtained images is greatly improved compared to
the normal tapping mode.
Freshly prepared surface was first placed in a liquid cell. After injecting the CMC
solution into the cell, the surface was incubated for 30 minutes, after which the
polymer solution was exchanged by injecting the KCl solution of same ionic
strength using a syringe. The image was taken after injecting the KCl solution for at
least 30 minutes to make sure the whole system has reached the equilibrium. To
avoid potential artifact on the image due to adsorbed polymer on the tip, the image
was also taken in the same background KCl solution on another surface. This
surface was incubated with a small droplet of CMC solution for 30 minutes and
gently rinsed by KCl solution before being placed in the liquid cell for imaging.
Very similar surface features were observed for the two surfaces treated by
different protocols. No degradation in the quality of the image was shown by
soaking the tip in the liquid cell filled with the CMC solution for 30 minutes,
indicating CMC does not adsorption on AFM tip at pH 9. It was noticed that when
changing CMC solutions of higher KCl ionic strength, some of the adsorbed CMC
remained on the mineral surface even after flushing by a large amount of
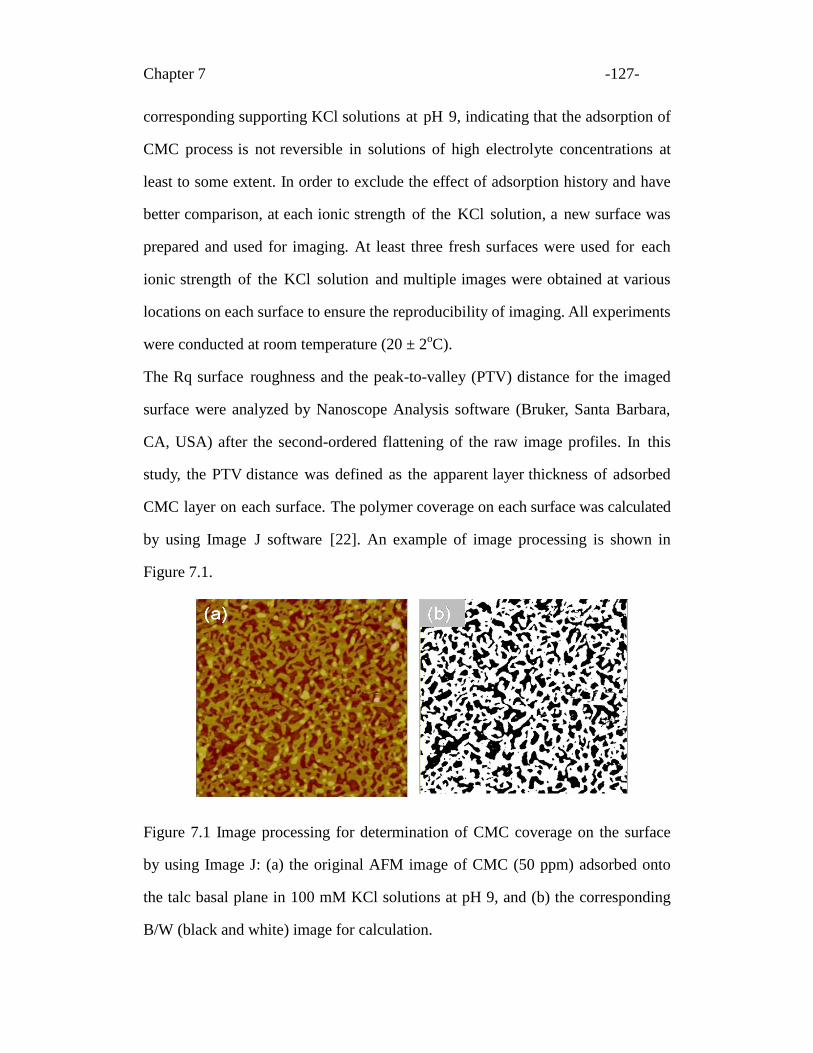
Chapter 7 -127-
corresponding supporting KCl solutions at pH 9, indicating that the adsorption of
CMC process is not reversible in solutions of high electrolyte concentrations at
least to some extent. In order to exclude the effect of adsorption history and have
better comparison, at each ionic strength of the KCl solution, a new surface was
prepared and used for imaging. At least three fresh surfaces were used for each
ionic strength of the KCl solution and multiple images were obtained at various
locations on each surface to ensure the reproducibility of imaging. All experiments
were conducted at room temperature (20 ± 2oC).
The Rq surface roughness and the peak-to-valley (PTV) distance for the imaged
surface were analyzed by Nanoscope Analysis software (Bruker, Santa Barbara,
CA, USA) after the second-ordered flattening of the raw image profiles. In this
study, the PTV distance was defined as the apparent layer thickness of adsorbed
CMC layer on each surface. The polymer coverage on each surface was calculated
by using Image J software [22]. An example of image processing is shown in
Figure 7.1.
Figure 7.1 Image processing for determination of CMC coverage on the surface
by using Image J: (a) the original AFM image of CMC (50 ppm) adsorbed onto
the talc basal plane in 100 mM KCl solutions at pH 9, and (b) the corresponding
B/W (black and white) image for calculation.
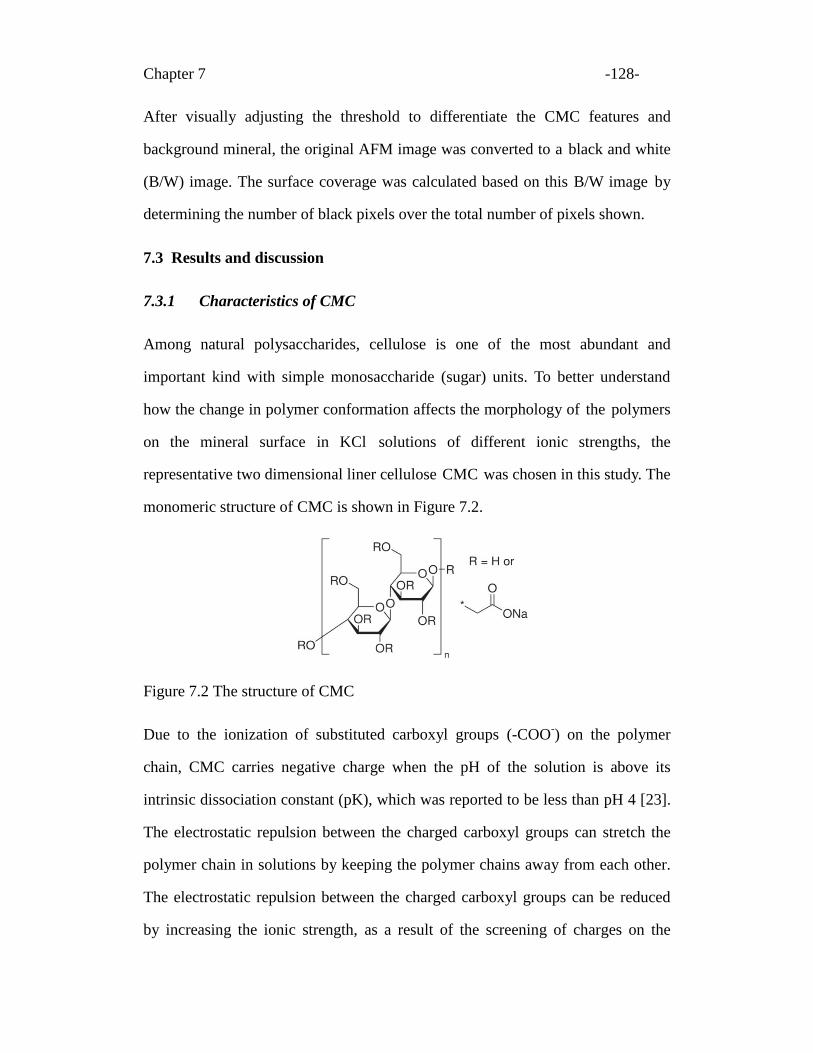
Chapter 7 -128-
After visually adjusting the threshold to differentiate the CMC features and
background mineral, the original AFM image was converted to a black and white
(B/W) image. The surface coverage was calculated based on this B/W image by
determining the number of black pixels over the total number of pixels shown.
7.3 Results and discussion
7.3.1 Characteristics of CMC
Among natural polysaccharides, cellulose is one of the most abundant and
important kind with simple monosaccharide (sugar) units. To better understand
how the change in polymer conformation affects the morphology of the polymers
on the mineral surface in KCl solutions of different ionic strengths, the
representative two dimensional liner cellulose CMC was chosen in this study. The
monomeric structure of CMC is shown in Figure 7.2.
Figure 7.2 The structure of CMC
Due to the ionization of substituted carboxyl groups (-COO-) on the polymer
chain, CMC carries negative charge when the pH of the solution is above its
intrinsic dissociation constant (pK), which was reported to be less than pH 4 [23].
The electrostatic repulsion between the charged carboxyl groups can stretch the
polymer chain in solutions by keeping the polymer chains away from each other.
The electrostatic repulsion between the charged carboxyl groups can be reduced
by increasing the ionic strength, as a result of the screening of charges on the
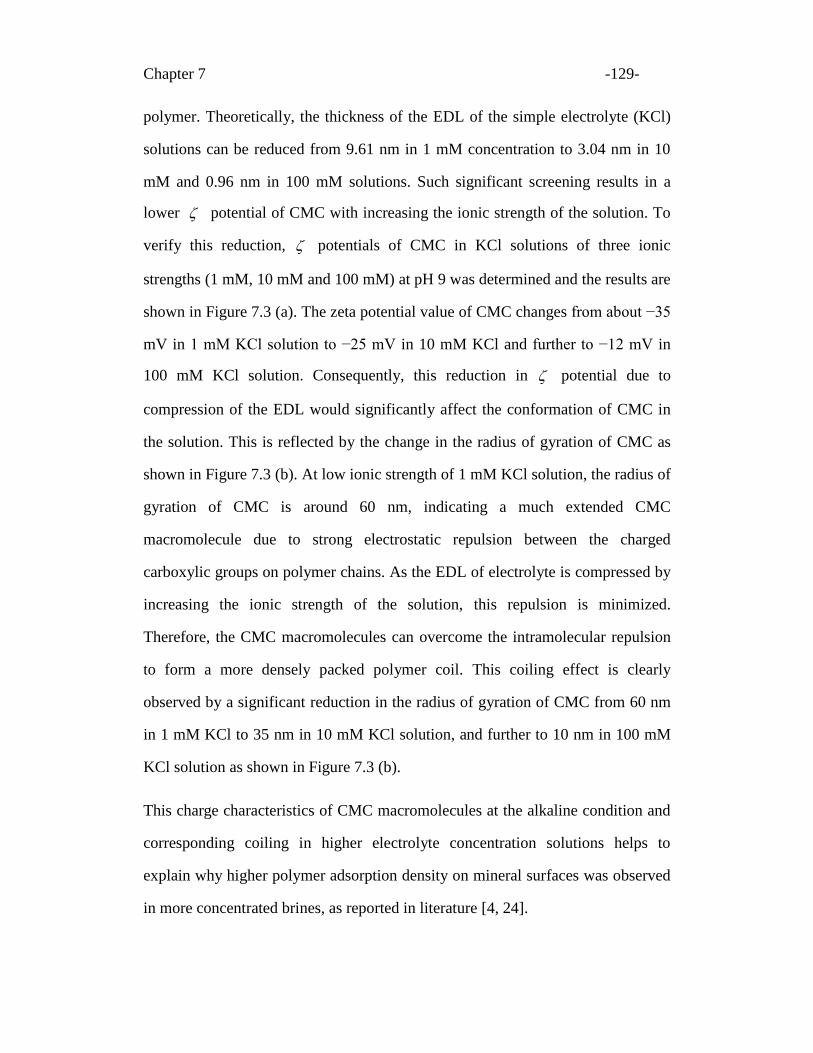
Chapter 7 -129-
polymer. Theoretically, the thickness of the EDL of the simple electrolyte (KCl)
solutions can be reduced from 9.61 nm in 1 mM concentration to 3.04 nm in 10
mM and 0.96 nm in 100 mM solutions. Such significant screening results in a
lower potential of CMC with increasing the ionic strength of the solution. To
verify this reduction, potentials of CMC in KCl solutions of three ionic
strengths (1 mM, 10 mM and 100 mM) at pH 9 was determined and the results are
shown in Figure 7.3 (a). The zeta potential value of CMC changes from about −35
mV in 1 mM KCl solution to −25 mV in 10 mM KCl and further to −12 mV in
100 mM KCl solution. Consequently, this reduction in potential due to
compression of the EDL would significantly affect the conformation of CMC in
the solution. This is reflected by the change in the radius of gyration of CMC as
shown in Figure 7.3 (b). At low ionic strength of 1 mM KCl solution, the radius of
gyration of CMC is around 60 nm, indicating a much extended CMC
macromolecule due to strong electrostatic repulsion between the charged
carboxylic groups on polymer chains. As the EDL of electrolyte is compressed by
increasing the ionic strength of the solution, this repulsion is minimized.
Therefore, the CMC macromolecules can overcome the intramolecular repulsion
to form a more densely packed polymer coil. This coiling effect is clearly
observed by a significant reduction in the radius of gyration of CMC from 60 nm
in 1 mM KCl to 35 nm in 10 mM KCl solution, and further to 10 nm in 100 mM
KCl solution as shown in Figure 7.3 (b).
This charge characteristics of CMC macromolecules at the alkaline condition and
corresponding coiling in higher electrolyte concentration solutions helps to
explain why higher polymer adsorption density on mineral surfaces was observed
in more concentrated brines, as reported in literature [4, 24].
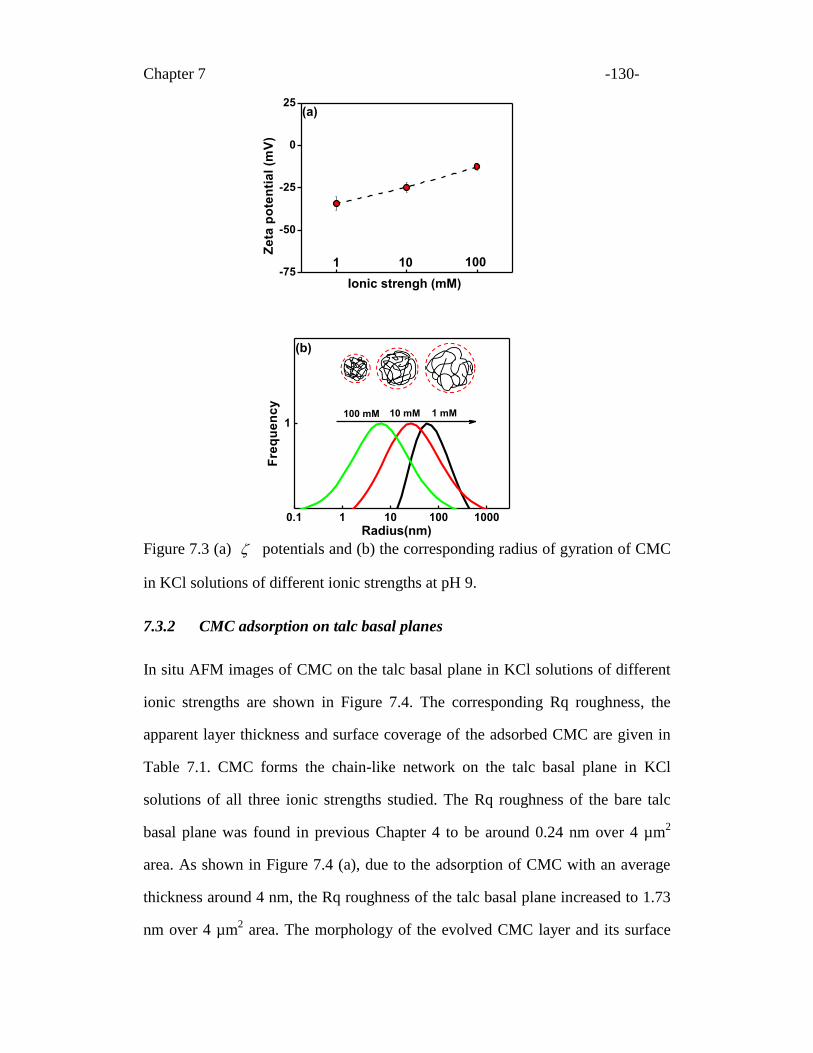
Chapter 7 -130-
Figure 7.3 (a) potentials and (b) the corresponding radius of gyration of CMC
in KCl solutions of different ionic strengths at pH 9.
7.3.2 CMC adsorption on talc basal planes
In situ AFM images of CMC on the talc basal plane in KCl solutions of different
ionic strengths are shown in Figure 7.4. The corresponding Rq roughness, the
apparent layer thickness and surface coverage of the adsorbed CMC are given in
Table 7.1. CMC forms the chain-like network on the talc basal plane in KCl
solutions of all three ionic strengths studied. The Rq roughness of the bare talc
basal plane was found in previous Chapter 4 to be around 0.24 nm over 4 µm2
area. As shown in Figure 7.4 (a), due to the adsorption of CMC with an average
thickness around 4 nm, the Rq roughness of the talc basal plane increased to 1.73
nm over 4 µm2 area. The morphology of the evolved CMC layer and its surface
-75
-50
-25
0
25(a)
10 1001
Ze
ta p
ote
nti
al
(mV
)
Ionic strengh (mM)
0.1 1 10 100 1000
1
(b)
Fre
qu
en
cy
Radius(nm)
1 mM10 mM100 mM
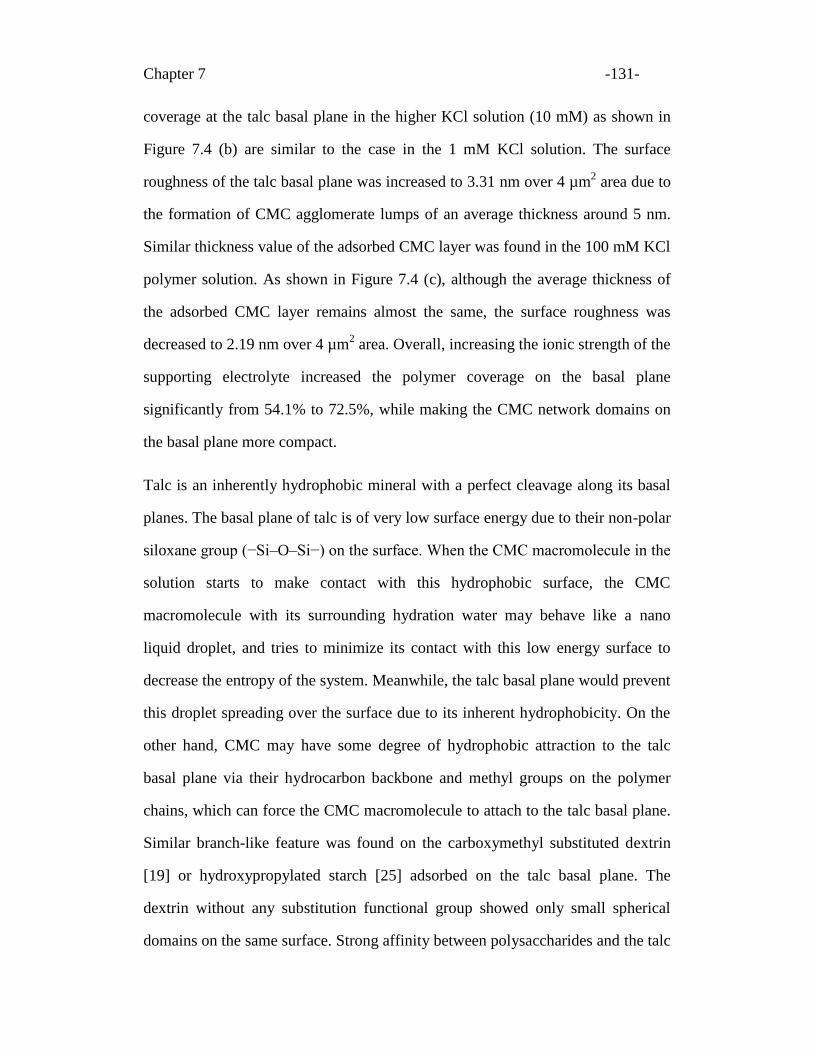
Chapter 7 -131-
coverage at the talc basal plane in the higher KCl solution (10 mM) as shown in
Figure 7.4 (b) are similar to the case in the 1 mM KCl solution. The surface
roughness of the talc basal plane was increased to 3.31 nm over 4 µm2 area due to
the formation of CMC agglomerate lumps of an average thickness around 5 nm.
Similar thickness value of the adsorbed CMC layer was found in the 100 mM KCl
polymer solution. As shown in Figure 7.4 (c), although the average thickness of
the adsorbed CMC layer remains almost the same, the surface roughness was
decreased to 2.19 nm over 4 µm2 area. Overall, increasing the ionic strength of the
supporting electrolyte increased the polymer coverage on the basal plane
significantly from 54.1% to 72.5%, while making the CMC network domains on
the basal plane more compact.
Talc is an inherently hydrophobic mineral with a perfect cleavage along its basal
planes. The basal plane of talc is of very low surface energy due to their non-polar
siloxane group (−Si–O–Si−) on the surface. When the CMC macromolecule in the
solution starts to make contact with this hydrophobic surface, the CMC
macromolecule with its surrounding hydration water may behave like a nano
liquid droplet, and tries to minimize its contact with this low energy surface to
decrease the entropy of the system. Meanwhile, the talc basal plane would prevent
this droplet spreading over the surface due to its inherent hydrophobicity. On the
other hand, CMC may have some degree of hydrophobic attraction to the talc
basal plane via their hydrocarbon backbone and methyl groups on the polymer
chains, which can force the CMC macromolecule to attach to the talc basal plane.
Similar branch-like feature was found on the carboxymethyl substituted dextrin
[19] or hydroxypropylated starch [25] adsorbed on the talc basal plane. The
dextrin without any substitution functional group showed only small spherical
domains on the same surface. Strong affinity between polysaccharides and the talc
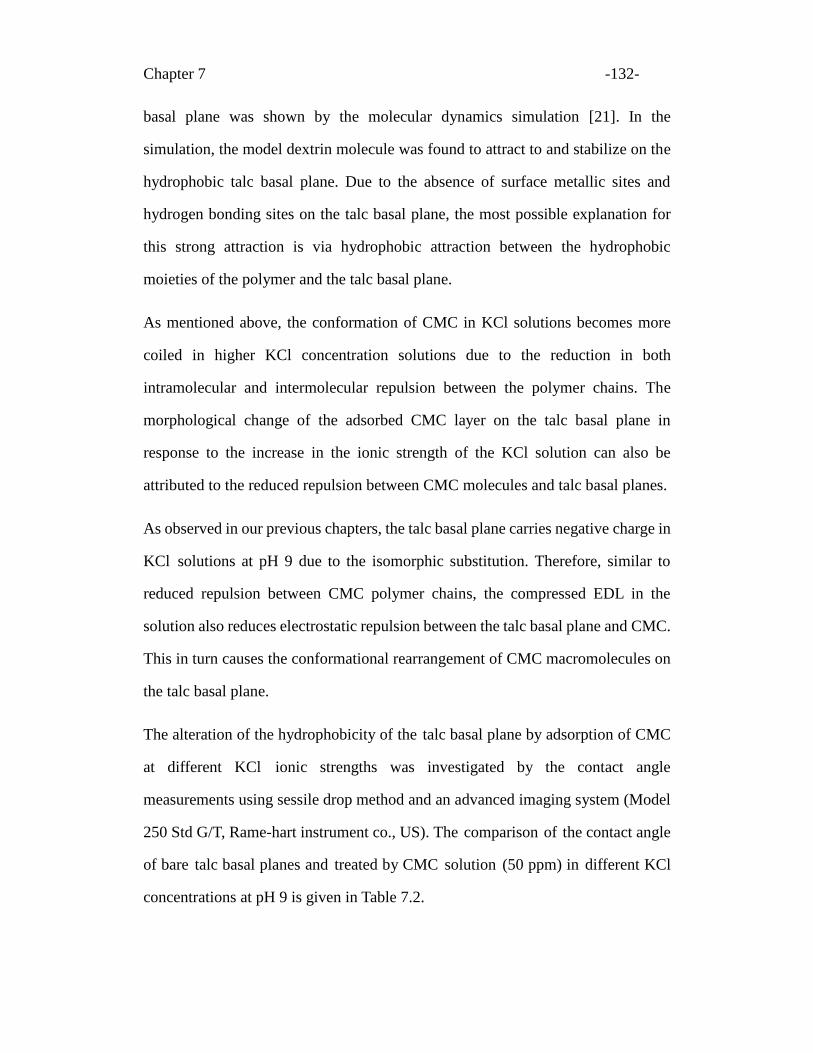
Chapter 7 -132-
basal plane was shown by the molecular dynamics simulation [21]. In the
simulation, the model dextrin molecule was found to attract to and stabilize on the
hydrophobic talc basal plane. Due to the absence of surface metallic sites and
hydrogen bonding sites on the talc basal plane, the most possible explanation for
this strong attraction is via hydrophobic attraction between the hydrophobic
moieties of the polymer and the talc basal plane.
As mentioned above, the conformation of CMC in KCl solutions becomes more
coiled in higher KCl concentration solutions due to the reduction in both
intramolecular and intermolecular repulsion between the polymer chains. The
morphological change of the adsorbed CMC layer on the talc basal plane in
response to the increase in the ionic strength of the KCl solution can also be
attributed to the reduced repulsion between CMC molecules and talc basal planes.
As observed in our previous chapters, the talc basal plane carries negative charge in
KCl solutions at pH 9 due to the isomorphic substitution. Therefore, similar to
reduced repulsion between CMC polymer chains, the compressed EDL in the
solution also reduces electrostatic repulsion between the talc basal plane and CMC.
This in turn causes the conformational rearrangement of CMC macromolecules on
the talc basal plane.
The alteration of the hydrophobicity of the talc basal plane by adsorption of CMC
at different KCl ionic strengths was investigated by the contact angle
measurements using sessile drop method and an advanced imaging system (Model
250 Std G/T, Rame-hart instrument co., US). The comparison of the contact angle
of bare talc basal planes and treated by CMC solution (50 ppm) in different KCl
concentrations at pH 9 is given in Table 7.2.
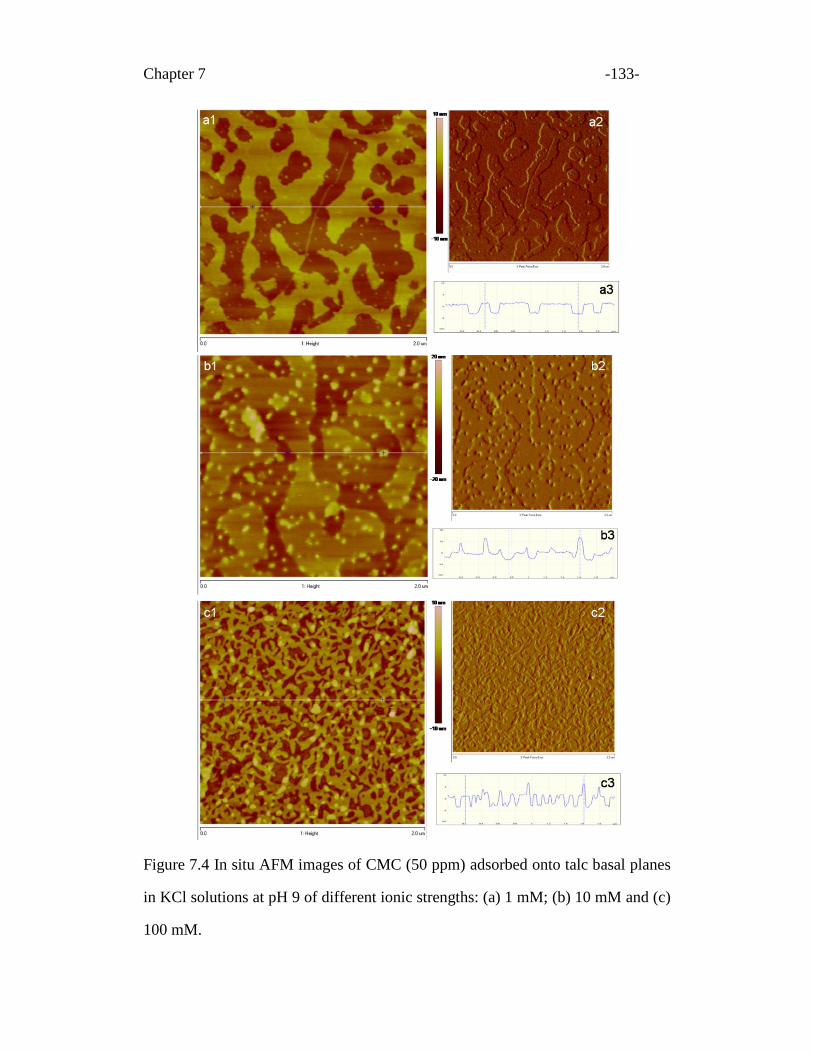
Chapter 7 -133-
Figure 7.4 In situ AFM images of CMC (50 ppm) adsorbed onto talc basal planes
in KCl solutions at pH 9 of different ionic strengths: (a) 1 mM; (b) 10 mM and (c)
100 mM.
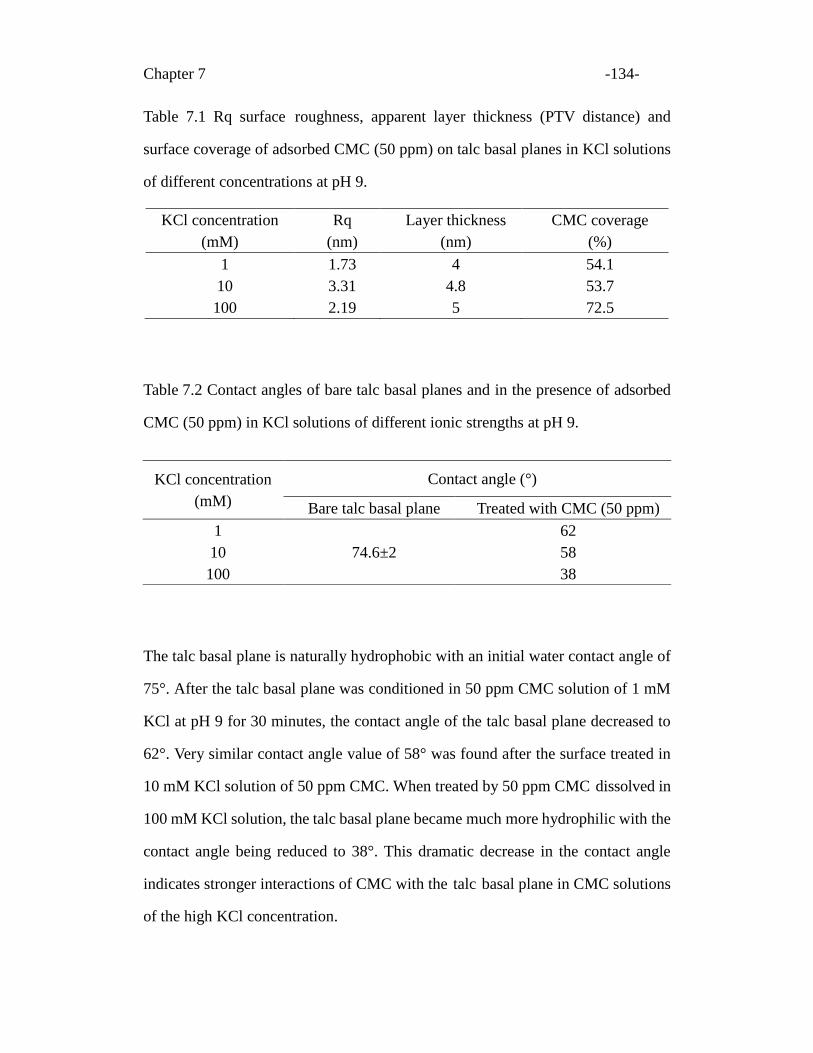
Chapter 7 -134-
Table 7.1 Rq surface roughness, apparent layer thickness (PTV distance) and
surface coverage of adsorbed CMC (50 ppm) on talc basal planes in KCl solutions
of different concentrations at pH 9.
KCl concentration
(mM)
Rq
(nm)
Layer thickness
(nm)
CMC coverage
(%)
1 1.73 4 54.1
10 3.31 4.8 53.7
100 2.19 5 72.5
Table 7.2 Contact angles of bare talc basal planes and in the presence of adsorbed
CMC (50 ppm) in KCl solutions of different ionic strengths at pH 9.
The talc basal plane is naturally hydrophobic with an initial water contact angle of
75°. After the talc basal plane was conditioned in 50 ppm CMC solution of 1 mM
KCl at pH 9 for 30 minutes, the contact angle of the talc basal plane decreased to
62°. Very similar contact angle value of 58° was found after the surface treated in
10 mM KCl solution of 50 ppm CMC. When treated by 50 ppm CMC dissolved in
100 mM KCl solution, the talc basal plane became much more hydrophilic with the
contact angle being reduced to 38°. This dramatic decrease in the contact angle
indicates stronger interactions of CMC with the talc basal plane in CMC solutions
of the high KCl concentration.
KCl concentration
(mM)
Contact angle (°)
Bare talc basal plane Treated with CMC (50 ppm)
1
74.6±2
62
10 58
100 38
Chapter 7 -135-
The results from the contact angle measurements correlated well with the results
from in situ AFM imaging at different KCl concentrations: the higher KCl
concentration, the larger the thickness and the higher the surface coverage of the
adsorbed polymer layer, which make talc basal planes less hydrophobic, as shown
by a significant reduction in contact angle values. This correlation suggests that
the observed morphology of CMC on the mineral surface from AFM imaging
under different conditions of the solution could be a good indicator to evaluate the
ability of CMC to alter the wettability of mineral surfaces, which strongly affects
mineral flotation.
7.3.3 CMC adsorption on talc edge surfaces
The morphologies of adsorbed CMC layer on the prepared talc edge surfaces in
KCl solutions of different ionic strengths at pH 9 are shown in Figure 7.5. The Rq
roughness, apparent layer thickness and surface coverage of adsorbed CMC on
talc edge surfaces are given in Table 7.3. As observed in Figure 7.5, the adsorbed
CMC formed spherical domains on the talc edge surface, which is totally different
from the morphology of adsorbed CMC layer on talc basal planes as shown in
Figure 7.4.
This anticipated difference in CMC morphology adsorbed on the talc basal plane
and edge surface is most likely attributed to the different binding interactions
involved between CMC and these two distinct talc surfaces. Unlike the non-polar
hydrophobic talc basal plane, the talc edge surface contains abundant hydrogen
bonding sites (Mg-OH and Si-OH) due to the broken bonds of Si-O-Si or
Mg-O-Mg on edges, which makes the talc edge surface hydrophilic.
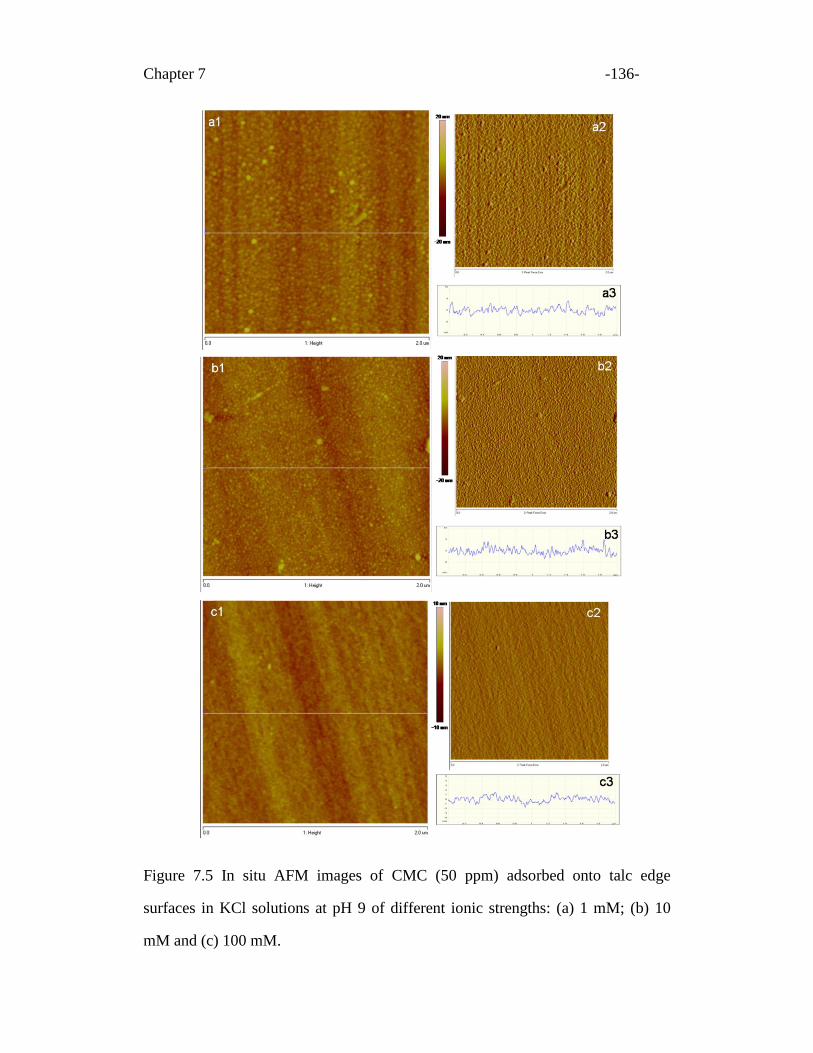
Chapter 7 -136-
Figure 7.5 In situ AFM images of CMC (50 ppm) adsorbed onto talc edge
surfaces in KCl solutions at pH 9 of different ionic strengths: (a) 1 mM; (b) 10
mM and (c) 100 mM.
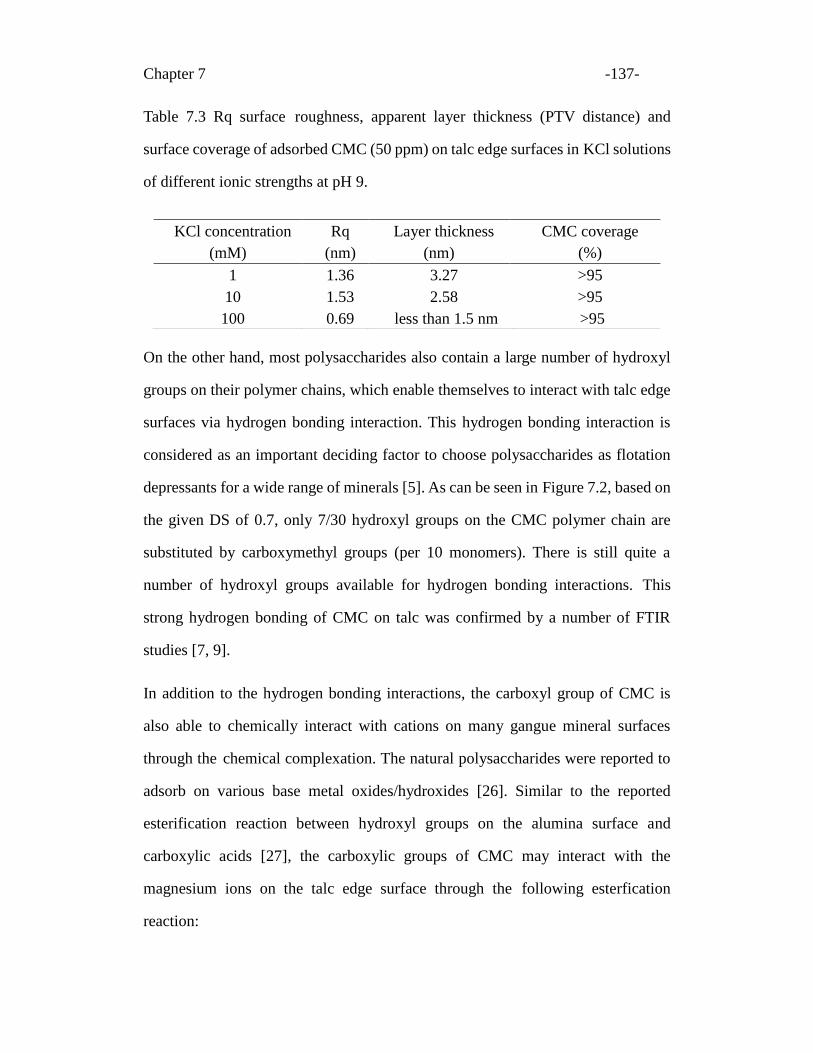
Chapter 7 -137-
Table 7.3 Rq surface roughness, apparent layer thickness (PTV distance) and
surface coverage of adsorbed CMC (50 ppm) on talc edge surfaces in KCl solutions
of different ionic strengths at pH 9.
On the other hand, most polysaccharides also contain a large number of hydroxyl
groups on their polymer chains, which enable themselves to interact with talc edge
surfaces via hydrogen bonding interaction. This hydrogen bonding interaction is
considered as an important deciding factor to choose polysaccharides as flotation
depressants for a wide range of minerals [5]. As can be seen in Figure 7.2, based on
the given DS of 0.7, only 7/30 hydroxyl groups on the CMC polymer chain are
substituted by carboxymethyl groups (per 10 monomers). There is still quite a
number of hydroxyl groups available for hydrogen bonding interactions. This
strong hydrogen bonding of CMC on talc was confirmed by a number of FTIR
studies [7, 9].
In addition to the hydrogen bonding interactions, the carboxyl group of CMC is
also able to chemically interact with cations on many gangue mineral surfaces
through the chemical complexation. The natural polysaccharides were reported to
adsorb on various base metal oxides/hydroxides [26]. Similar to the reported
esterification reaction between hydroxyl groups on the alumina surface and
carboxylic acids [27], the carboxylic groups of CMC may interact with the
magnesium ions on the talc edge surface through the following esterfication
reaction:
KCl concentration
(mM)
Rq
(nm)
Layer thickness
(nm)
CMC coverage
(%)
1 1.36 3.27 >95
10 1.53 2.58 >95
100 0.69 less than 1.5 nm >95
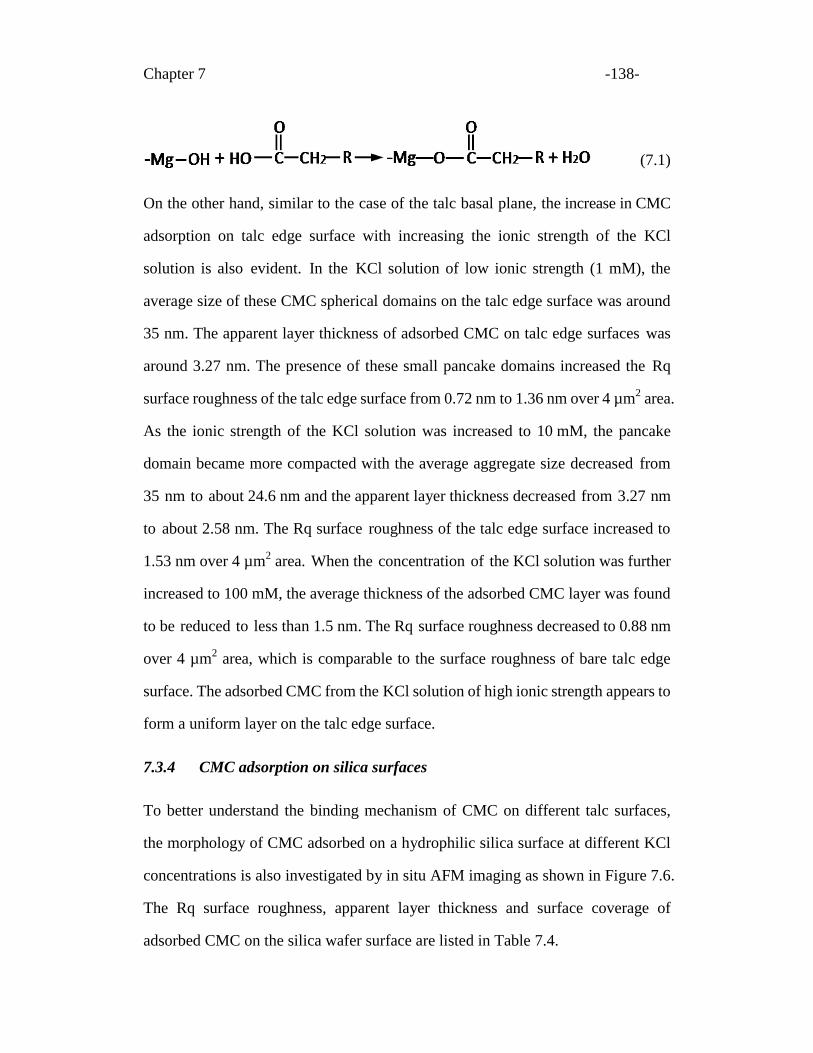
Chapter 7 -138-
(7.1)
On the other hand, similar to the case of the talc basal plane, the increase in CMC
adsorption on talc edge surface with increasing the ionic strength of the KCl
solution is also evident. In the KCl solution of low ionic strength (1 mM), the
average size of these CMC spherical domains on the talc edge surface was around
35 nm. The apparent layer thickness of adsorbed CMC on talc edge surfaces was
around 3.27 nm. The presence of these small pancake domains increased the Rq
surface roughness of the talc edge surface from 0.72 nm to 1.36 nm over 4 µm2 area.
As the ionic strength of the KCl solution was increased to 10 mM, the pancake
domain became more compacted with the average aggregate size decreased from
35 nm to about 24.6 nm and the apparent layer thickness decreased from 3.27 nm
to about 2.58 nm. The Rq surface roughness of the talc edge surface increased to
1.53 nm over 4 µm2 area. When the concentration of the KCl solution was further
increased to 100 mM, the average thickness of the adsorbed CMC layer was found
to be reduced to less than 1.5 nm. The Rq surface roughness decreased to 0.88 nm
over 4 µm2 area, which is comparable to the surface roughness of bare talc edge
surface. The adsorbed CMC from the KCl solution of high ionic strength appears to
form a uniform layer on the talc edge surface.
7.3.4 CMC adsorption on silica surfaces
To better understand the binding mechanism of CMC on different talc surfaces,
the morphology of CMC adsorbed on a hydrophilic silica surface at different KCl
concentrations is also investigated by in situ AFM imaging as shown in Figure 7.6.
The Rq surface roughness, apparent layer thickness and surface coverage of
adsorbed CMC on the silica wafer surface are listed in Table 7.4.
Chapter 7 -139-
The silica surface has identical chemical composition and surface roughness as
talc basal planes, with only difference being hydrophilic for the silica wafer in
contrast to being hydrophobic for talc basal planes. Compared to the morphology
of CMC adsorbed on the talc basal plane, totally different morphology of CMC
adsorbed on the silica surface was observed. These observed differences in
adsorption and conformation of CMC on the two surfaces can be attributed to the
totally different wettability characteristics of these two surfaces, and hence
different binding mechanisms and their impact on the morphology of adsorbed
CMC. Though both surfaces have similar chemical composition and surface
roughness, it is believed that there exists an exclusion zone between siloxane
groups (-Si-O-Si-) on the talc basal plane and water molecules of the solution due
to the absence of polarity of talc basal planes [21]. In contrast, water molecules
can be tightly bonded with polar groups (Si-OH) on the silica surface. The CMC
molecules tend to spread over the talc basal plane in two dimensional network by
strong hydrophobic interaction via their hydrocarbon backbone and methyl group,
while this hydrophobic interaction does not exist on the silica surface. The strong
hydrophobic interaction in the binding of CMC on talc basal planes was shown
clearly.
On the other hand, although both silica and talc edge surfaces are hydrophilic due
to similar metal polar hydroxyl groups (M-OH), the morphology of CMC
adsorbed on the silica surface is also different from that on the talc edge surface
under the same solution conditions.
As shown in Figure 7.6, at the lowest ionic strength of the KCl solution (1 mM) at
pH 9, individual CMC pancakes of around 58.5 nm in diameter were formed on
the silica wafer surface with the apparent CMC layer thickness of 2.27 nm. The
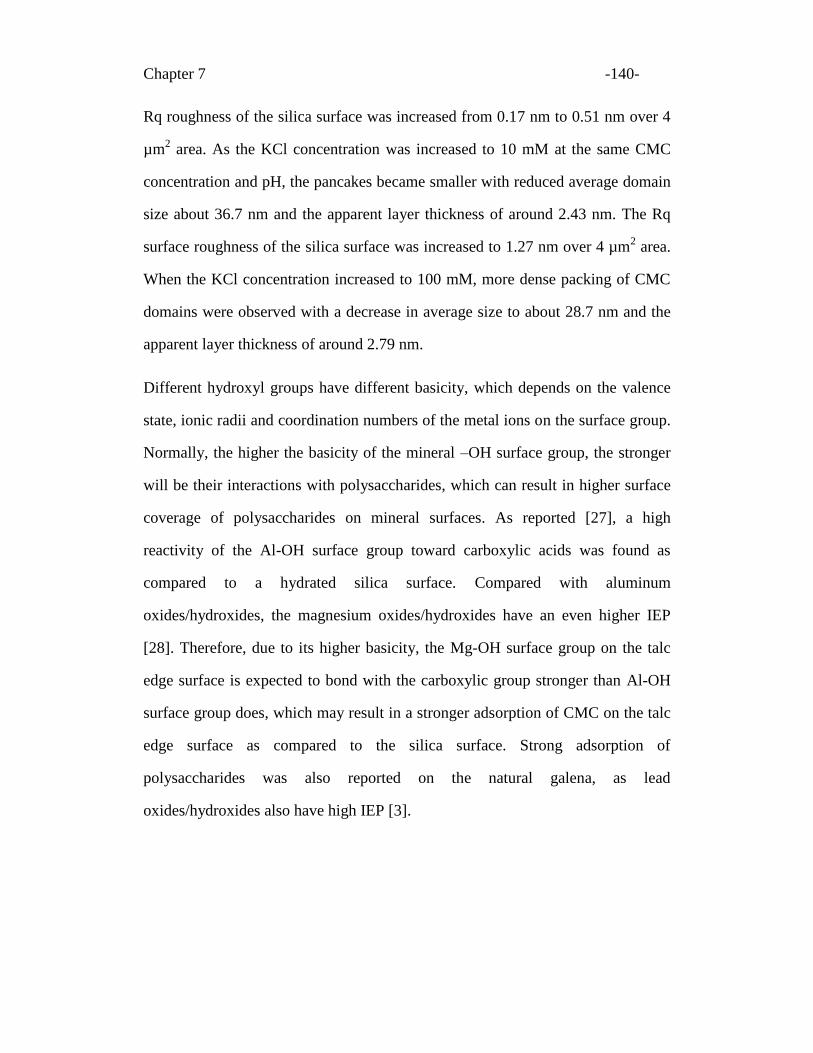
Chapter 7 -140-
Rq roughness of the silica surface was increased from 0.17 nm to 0.51 nm over 4
µm2 area. As the KCl concentration was increased to 10 mM at the same CMC
concentration and pH, the pancakes became smaller with reduced average domain
size about 36.7 nm and the apparent layer thickness of around 2.43 nm. The Rq
surface roughness of the silica surface was increased to 1.27 nm over 4 µm2 area.
When the KCl concentration increased to 100 mM, more dense packing of CMC
domains were observed with a decrease in average size to about 28.7 nm and the
apparent layer thickness of around 2.79 nm.
Different hydroxyl groups have different basicity, which depends on the valence
state, ionic radii and coordination numbers of the metal ions on the surface group.
Normally, the higher the basicity of the mineral –OH surface group, the stronger
will be their interactions with polysaccharides, which can result in higher surface
coverage of polysaccharides on mineral surfaces. As reported [27], a high
reactivity of the Al-OH surface group toward carboxylic acids was found as
compared to a hydrated silica surface. Compared with aluminum
oxides/hydroxides, the magnesium oxides/hydroxides have an even higher IEP
[28]. Therefore, due to its higher basicity, the Mg-OH surface group on the talc
edge surface is expected to bond with the carboxylic group stronger than Al-OH
surface group does, which may result in a stronger adsorption of CMC on the talc
edge surface as compared to the silica surface. Strong adsorption of
polysaccharides was also reported on the natural galena, as lead
oxides/hydroxides also have high IEP [3].
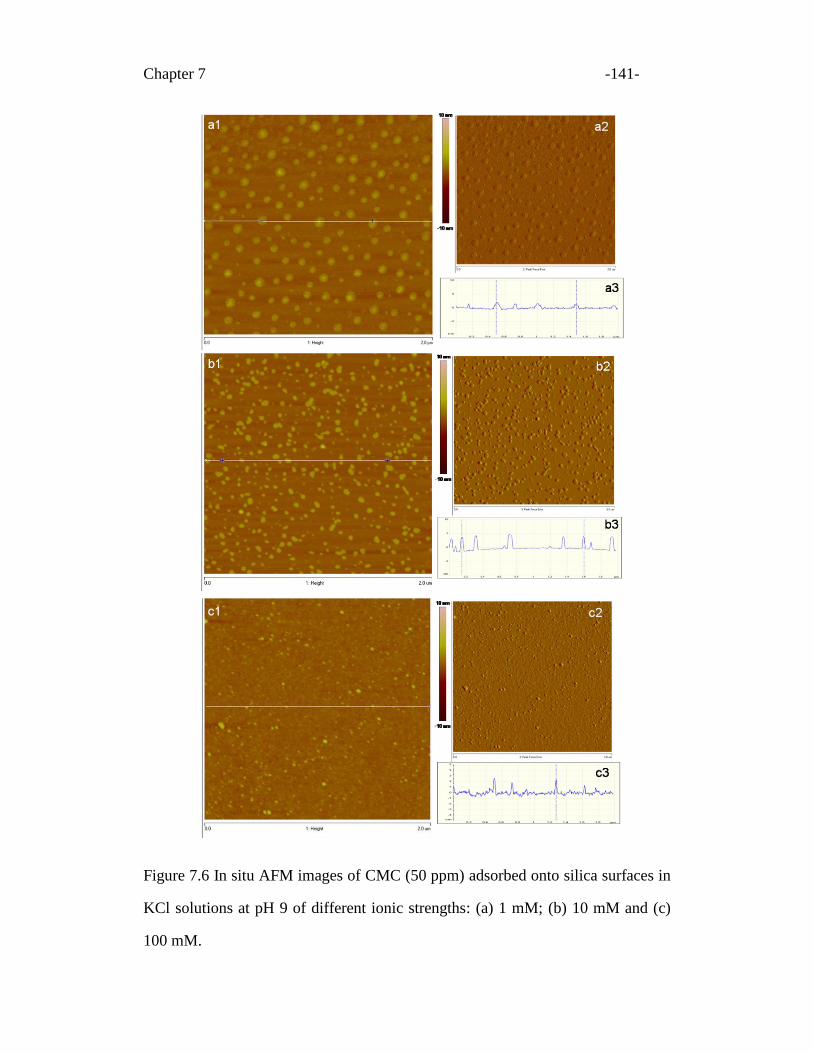
Chapter 7 -141-
Figure 7.6 In situ AFM images of CMC (50 ppm) adsorbed onto silica surfaces in
KCl solutions at pH 9 of different ionic strengths: (a) 1 mM; (b) 10 mM and (c)
100 mM.
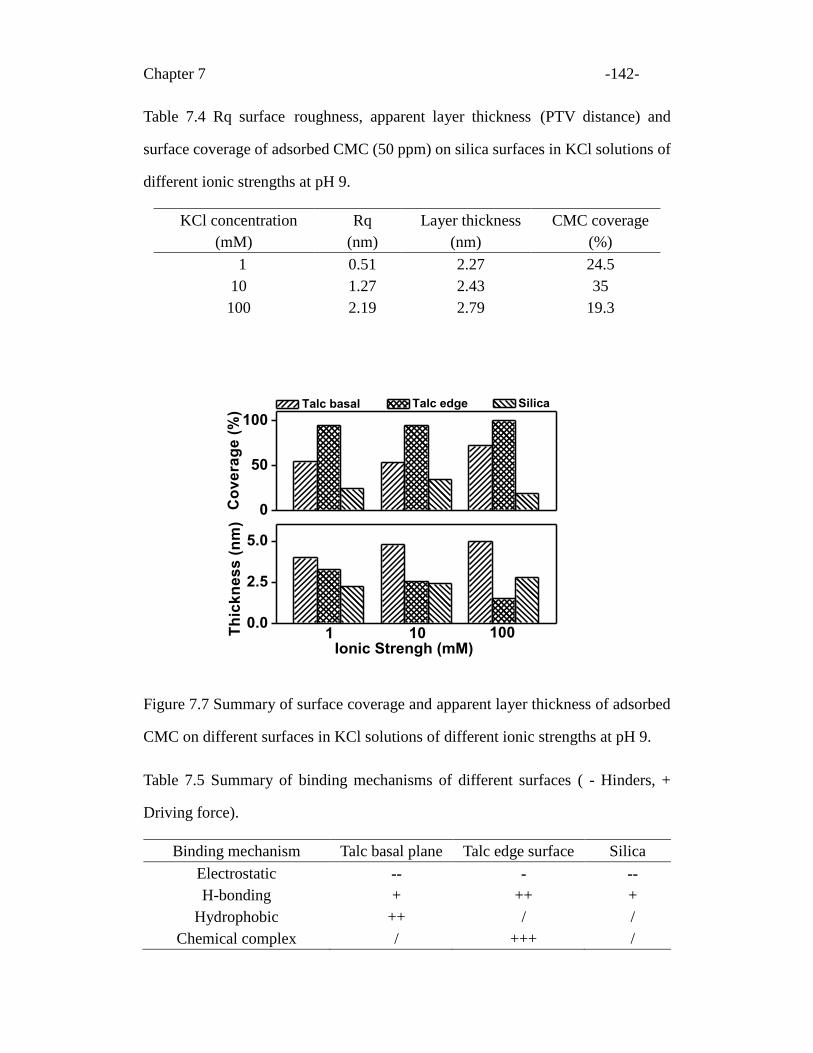
Chapter 7 -142-
Table 7.4 Rq surface roughness, apparent layer thickness (PTV distance) and
surface coverage of adsorbed CMC (50 ppm) on silica surfaces in KCl solutions of
different ionic strengths at pH 9.
0
50
100
100101Th
ick
ne
ss
(n
m)
Talc edge Silica
Co
ve
rag
e (
%)
Talc basal
Ionic Strengh (mM)
0.0
2.5
5.0
Figure 7.7 Summary of surface coverage and apparent layer thickness of adsorbed
CMC on different surfaces in KCl solutions of different ionic strengths at pH 9.
Table 7.5 Summary of binding mechanisms of different surfaces ( - Hinders, +
Driving force).
Binding mechanism Talc basal plane Talc edge surface Silica
Electrostatic -- - --
H-bonding + ++ +
Hydrophobic ++ / /
Chemical complex / +++ /
KCl concentration
(mM)
Rq
(nm)
Layer thickness
(nm)
CMC coverage
(%)
1 0.51 2.27 24.5
10 1.27 2.43 35
100 2.19 2.79 19.3
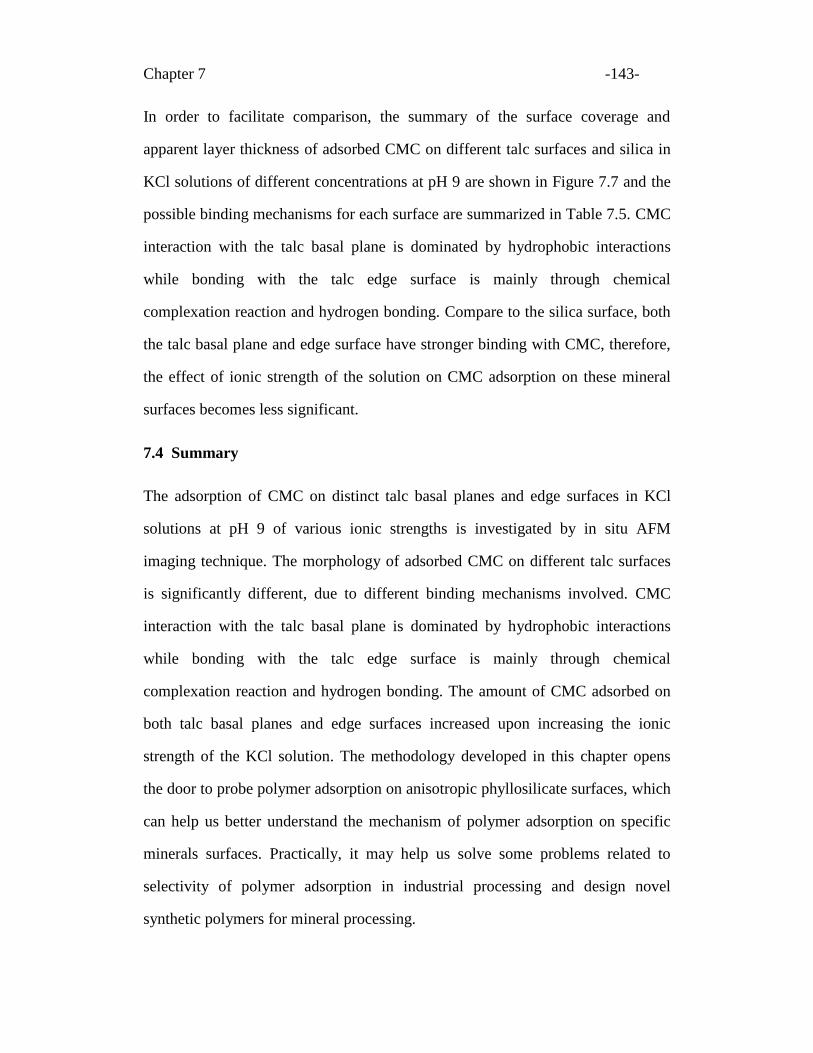
Chapter 7 -143-
In order to facilitate comparison, the summary of the surface coverage and
apparent layer thickness of adsorbed CMC on different talc surfaces and silica in
KCl solutions of different concentrations at pH 9 are shown in Figure 7.7 and the
possible binding mechanisms for each surface are summarized in Table 7.5. CMC
interaction with the talc basal plane is dominated by hydrophobic interactions
while bonding with the talc edge surface is mainly through chemical
complexation reaction and hydrogen bonding. Compare to the silica surface, both
the talc basal plane and edge surface have stronger binding with CMC, therefore,
the effect of ionic strength of the solution on CMC adsorption on these mineral
surfaces becomes less significant.
7.4 Summary
The adsorption of CMC on distinct talc basal planes and edge surfaces in KCl
solutions at pH 9 of various ionic strengths is investigated by in situ AFM
imaging technique. The morphology of adsorbed CMC on different talc surfaces
is significantly different, due to different binding mechanisms involved. CMC
interaction with the talc basal plane is dominated by hydrophobic interactions
while bonding with the talc edge surface is mainly through chemical
complexation reaction and hydrogen bonding. The amount of CMC adsorbed on
both talc basal planes and edge surfaces increased upon increasing the ionic
strength of the KCl solution. The methodology developed in this chapter opens
the door to probe polymer adsorption on anisotropic phyllosilicate surfaces, which
can help us better understand the mechanism of polymer adsorption on specific
minerals surfaces. Practically, it may help us solve some problems related to
selectivity of polymer adsorption in industrial processing and design novel
synthetic polymers for mineral processing.
Chapter 7 -144-
7.5 References
[1] Pugh, R. J., 1989, "Macromolecular Organic Depressants in Sulphide
flotation-a Review, 1. Principles, Types and Applications," International
Journal of Mineral Processing, 25(1-2) pp. 101-130.
[2] Laskowski, J. S., 2010, "Rheological Properties of Aqueous Suspensions of
Anisotropic Minerals," 8th UBC-McGill-UA Symposium, M. Pawlik, ed.
Vancouver, BC, Canada.
[3] Liu, Q., Zhang, Y., Laskowski, J. S., 2000, "The Adsorption of
Polysaccharides onto Mineral Surfaces: An Acid/Base Interaction,"
International Journal of Mineral Processing, 60(3-4) pp. 229-245.
[4] Pawlik, M., Laskowski, J. S., Ansari, A., 2003, "Effect of Carboxymethyl
Cellulose and Ionic Strength on Stability of Mineral Suspensions in Potash
Ore Flotation Systems," Journal of Colloid and Interface Science, 260(2) pp.
251-258.
[5] Khraisheh, M., Holland, C., Creany, C., Harris, P., Parolis, L., 2005, "Effect of
Molecular Weight and Concentration on the Adsorption of CMC Onto Talc at
Different Ionic Strengths," International Journal of Mineral Processing, 75(3-4)
pp. 197-206.
[6] Beaussart, A., Mierczynska-Vasilev, A., Beattie, D. A., 2010, "Evolution of
Carboxymethyl Cellulose Layer Morphology on Hydrophobic Mineral
Surfaces: Variation of Polymer Concentration and Ionic Strength," Journal of
Colloid and Interface Science, 346(2) pp. 303-310.
[7] Wang, J., and Somasundaran, P., 2005, "Adsorption and Conformation of
Carboxymethyl Cellulose at Solid-Liquid Interfaces using Spectroscopic,
AFM and Allied Techniques," Journal of Colloid and Interface Science, 291(1)
pp. 75-83.
[8] Cuba-Chiem, L. T., Huynh, L., Ralston, J., 2008, "In Situ Particle Film ATR
FTIR Spectroscopy of Carboxymethyl Cellulose Adsorption on Talc: Binding
Mechanism, pH Effects, and Adsorption Kinetics," Langmuir, 24(15) pp.
8036-8044.
[9] Cuba-Chiem, L. T., Huynh, L., Ralston, J., 2008, "In Situ Particle Film
ATR-FTIR Studies of CMC Adsorption on Talc: The Effect of Ionic Strength
and Multivalent Metal Ions," Minerals Engineering, 21(12-14) pp. 1013-1019.
Chapter 7 -145-
[10] Bacchin, P., Bonino, J., Martin, F., 2006, "Surface Pre-Coating of Talc
Particles by Carboxyl Methyl Cellulose Adsorption: Study of Adsorption and
Consequences on Surface Properties and Settling Rate," Colloids and
Surfaces A-Physicochemical and Engineering Aspects, 272(3) pp. 211-219.
[11] Burdukova, E., Bradshaw, D. J., Laskowski, J. S., 2007, "Effect of CMC and
pH on the Rheology of Suspensions of Isotropic and Anisotropic Minerals,"
Canadian Metallurgical Quarterly, 46(3) pp. 273-278.
[12] Morris, G., Fornasiero, D., Ralston, J., 2002, "Polymer Depressants at the
Talc-Water Interface: Adsorption Isotherm, Microflotation and
Electrokinetic Studies," International Journal of Mineral Processing, 67(1-4)
pp. 211-227.
[13] Mierczynska-Vasilev, A., Beattie, D. A., 2010, "Adsorption of Tailored
Carboxymethyl Cellulose Polymers on Talc and Chalcopyrite: Correlation
between Coverage, Wettability, and Flotation," Minerals Engineering,
23(11-13) pp. 985-993.
[14] Beaussart, A., Mierczynska-Vasilev, A. M., Harmer, S. L., Beattie, D. A.,
2011, "The Role of Mineral Surface Chemistry in Modified Dextrin
Adsorption," Journal of Colloid and Interface Science, 357(2) pp. 510-520.
[15] Kaggwa, G. B., Froebe, S., Huynh, L., Ralston, J., Bremmell, K., 2005,
"Morphology of Adsorbed Polymers and Solid Surface Wettability,"
Langmuir, 21(10) pp. 4695-4704.
[16] Beaussart, A., Parkinson, L., Mierczynska-Vasilev, A., Beattie, D. A., 2012,
"Adsorption of Modified Dextrins on Molybdenite: AFM Imaging, Contact
Angle, and Flotation Studies," Journal of Colloid and Interface Science,
368(1) pp. 608-615.
[17] Beaussart, A., Mierczynska-Vasilev, A., Beattie, D. A., 2009, "Adsorption of
Dextrin on Hydrophobie Minerals," Langmuir, 25(17) pp. 9913-9921.
[18] Mierczynska-Vasilev, A., Ralston, J., Beattie, D. A., 2008, "Adsorption of
Modified Dextrins on Talc: Effect of Surface Coverage and Hydration Water
on Hydrophobicity Reduction," Langmuir, 24(12) pp. 6121-6127.
[19] Beattie, D. A., Huynh, L., Mierczynska-Vasilev, A., Myllynen, M., Flatt, J.,
2007, "Effect of Modified Dextrins on the Depression of Talc and their
Selectivity in Sulphide Mineral Flotation: Adsorption Isotherms, AFM
Chapter 7 -146-
Imaging and Flotation Studies," Canadian Metallurgical Quarterly, 46(3) pp.
349-358.
[20] Steenberg, E., Harris, P., 1984, "Adsorption of Carboxymethyl cellulose,
Guar Gum, and Starch Onto Talc, Sulfides, Oxides, and Salt-Type Minerals,"
South African Journal of Chemistry, 37(3) pp. 85-90.
[21] Du, H., Miller, J. D., 2007, "A Molecular Dynamics Simulation Study of
Water Structure and Adsorption States at Talc Surfaces," International
Journal of Mineral Processing, 84(1-4) pp. 172-184.
[22] Schneider, C. A., Rasband, W. S., Eliceiri, K. W., 2012, "NIH Image to
Image J: 25 Years of Image Analysis," Nature Methods, 9(7) pp. 671-675.
[23] Chowdhury, F., Neale, S., 1963, "Acid Behaviour of Carboxylic derivatives
of Cellulose.1. Carboxymethyl Cellulose," Journal of Polymer Science: Part
A, 1pp. 2881-2891.
[24] Shortridge, P., Harris, P., Bradshaw, D., 2000, "The Effect of Chemical
Composition and Molecular Weight of Polysaccharide Depressants on the
flotation of Talc," International Journal of Mineral Processing, 59(3) pp.
215-224.
[25] Kaggwa, G. B., Huynh, L., Ralston, J., Bremmell, K., 2006, "The Influence
of Polymer Structure and Morphology on Talc Wettability," Langmuir, 22(7)
pp. 3221-3227.
[26] Laskowski, J. S., Liu, Q., O'Connor, C. T., 2007, "Current Understanding of
the Mechanism of Polysaccharide Adsorption at the Mineral/Aqueous
Solution Interface," International Journal of Mineral Processing, 84(1-4) pp.
59-68.
[27] Karaman, M. E., Antelmi, D. A., Pashley, R. M., 2001, "The Production of
Stable Hydrophobic Surfaces by the Adsorption of Hydrocarbon and
Fluorocarbon Carboxylic Acids onto Alumina Substrates," Colloids and
Surfaces A: Physicochemical and Engineering Aspects, 182(1-3) pp.
285-298.
[28] Parks, G. A., 1965, "The Isoelectric Points of Solid Oxides, Solid Hydroxides,
and Aqueous Hydroxo Complex Systems," Chemical Reviews, 65(2) pp.
177-198.
-147-
Chapter 8
Summary
8.1 General conclusions
This dissertation focuses on investigating anisotropic surface properties of
phyllosilicates. In particular, systematic studies on the impact of pH and divalent
cations in aqueous solutions on surface charging characteristic of two typical 2:1
(TOT) layer phyllosilicates (talc and muscovite) are presented. The anisotropic
surface charge property of phyllosilicate suspensions related to their rheological
behaviour is discussed. Also, some preliminary results on polymer adsorption on
different talc surfaces are included.
In Chapter 3, the methodology to study anisotropic properties of phyllosilicates
was established. The ultramicrotome cutting technique was employed to prepare
molecularly smooth edge surfaces of talc and muscovite, which allowed direct
measurement of interactions between AMF tips and prepared phyllosilicate
surfaces in various electrolyte solutions. Commercial AFM silicon nitride tips
instead of micron size probes were chosen in AFM force measurements to
quantitatively evaluate surface charge properties of prepared surfaces. A
theoretical model based on the geometry of this tip was used to fit the measured
force profiles to the classical DLVO theory at different BC, which allowed direct
determination of the Stern potentials of different phyllosilicate surfaces.
In Chapter 4, colloidal interaction forces between AFM tips and specific
phyllosilicate surfaces as a function of solution pH were measured. The basal
plane of both muscovite and talc were found to carry a permanent negative charge,
Chapter 8 -148-
while the charge on their edge surfaces is highly pH-dependent. Although both
talc and muscovite are platy 2:1 phyllosilicate minerals, the stern potential of
muscovite basal planes is much more negative than that of talc basal planes due to
its high degree of isomorphic substitution. The charges on edge surfaces of
muscovite and talc basal planes exhibit different responses to solution pH. The
observed differences in Stern potentials of basal planes and edge surfaces for both
talc and muscovite are closely related to their crystal structure and ionization
characteristics. The protonation reactivity and the contribution of each surface
group to the surface charging behaviour are modeled using their protonation
constants.
In Chapter 5, the effects of the concentration of two divalent cations: Mg2+
and
Ca2+
on Stern potentials of different phyllosilicate mineral surfaces were
investigated. Different responses of the Stern potential of the basal plane and the
edge surface to the divalent cation addition in solutions are attributed to the
different surface charging mechanisms and binding mechanisms of each type of
surfaces with different divalent cations.
In Chapter 6, The Stern potential values of talc basal planes and edge surfaces
from fitting of measured interaction force profiles in 1 mM KCl solution at
different pH values (3.2-9) were obtained. Based on these fitted Stern potential
values, interaction energies of various associations between talc surfaces, (basal
plane-basal plane, edge-edge and basal plane-edge) were calculated. The attractive
interaction between talc basal planes and edge surfaces was found to dominate the
rheological behaviour of talc suspensions and the highest probability of
card-house formation between talc edge surfaces and basal planes was found to
correspond well with the measured highest yield stress of talc suspensions.
Chapter 8 -149-
In Chapter 7, some preliminary results on CMC adsorption on different talc
surfaces were presented.
In conclusion, this work clearly demonstrates the need for study on anisotropic
surface characteristics if one wants to improve the understanding of colloidal
behaviours of phyllosilicate minerals and hence better control their process
performance.
Moreover, the methodology developed in this study opens the door to probe
interactions of various mineral surfaces with process aids under various
physicochemical conditions of the system, an extremely important subject in nano
technology and resource engineering. The method of preparation of the
phyllosilicate edge surface described in this study can be extended to other
minerals or natural resources such as coal. For instance, the work of applying
ultramicrotome technique to study anisotropic properties of chlorite surfaces, in
collaboration with Professor Jan D. Miller’s research group at the University of
Utah is not included in this thesis but can be found elsewhere: Yin, X., Yan, L.,
Liu, J., Xu, Z., Miller, J. D., 2013, "Anisotropic Surface Charging of Chlorite
Surfaces", Clays and Clay Minerals, In press.
8.2 Contributions to original knowledge
1. An ultramicrotome cutting procedure was developed to prepare molecularly
smooth edge surfaces of phyllosilicates. More accurate results can be obtained
without incurring complex finite element analysis to incorporate the effect of
surface roughness in AFM interaction forces fitting.
2. The colloidal probe technique of AFM was proved to be a powerful tool to
study the interactions between AFM tips and well-defined basal planes and
Chapter 8 -150-
edge surfaces of phyllosilicates in aqueous solution.
3. A theoretical model based on the geometry of AFM tip was developed to fit the
measured force profiles to the classical DLVO theory for mixed BC, which
allows direct determination of Stern potentials of different phyllosilicate
surfaces for the specific case at proper BC.
4. To the best of my knowledge, it is the first time that the effect of pH and the
concentration of two divalent cations (Mg2+
and Ca2+
) in solutions on the Stern
potential of different phyllosilicate surfaces were systematically and
quantitatively investigated by direct force measurement using AFM.
5. Interaction energies of various associations between talc surfaces were
calculated using the AFM-derived Stern potential values of talc basal planes
and edge surfaces. The rheological behaviour of talc suspensions was better
interpreted in terms of considering anisotropic surface charge characteristics of
the talc particle, instead of blindly treating it as isotropic.
8.3 Recommendations for further work
It is my hope that the developed methodology and obtained results in this
dissertation are interesting to those in the field of investigating the surface property
of phyllosilicates, in particular of real clays. Should that be the case, I would like to
suggest:
1. Develop a suitable technique to prepare a smooth edge surface for other
phyllosilicate particles such as kaolinite which lacks of cleavage basal planes.
2. Probe interactions of polymers with well-defined basal planes and edge
surfaces of phyllosilicates under various physicochemical conditions at a
single molecule resolution using single molecule force spectroscopy.
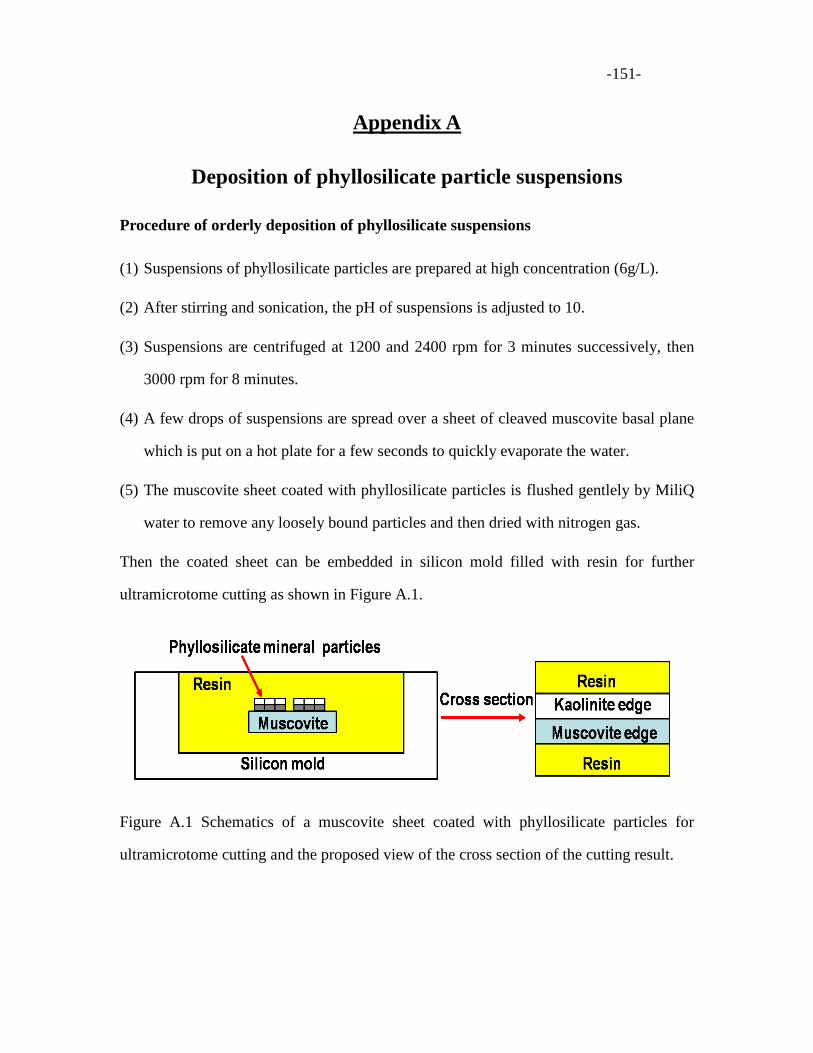
-151-
Appendix A
Deposition of phyllosilicate particle suspensions
Procedure of orderly deposition of phyllosilicate suspensions
(1) Suspensions of phyllosilicate particles are prepared at high concentration (6g/L).
(2) After stirring and sonication, the pH of suspensions is adjusted to 10.
(3) Suspensions are centrifuged at 1200 and 2400 rpm for 3 minutes successively, then
3000 rpm for 8 minutes.
(4) A few drops of suspensions are spread over a sheet of cleaved muscovite basal plane
which is put on a hot plate for a few seconds to quickly evaporate the water.
(5) The muscovite sheet coated with phyllosilicate particles is flushed gentlely by MiliQ
water to remove any loosely bound particles and then dried with nitrogen gas.
Then the coated sheet can be embedded in silicon mold filled with resin for further
ultramicrotome cutting as shown in Figure A.1.
Figure A.1 Schematics of a muscovite sheet coated with phyllosilicate particles for
ultramicrotome cutting and the proposed view of the cross section of the cutting result.
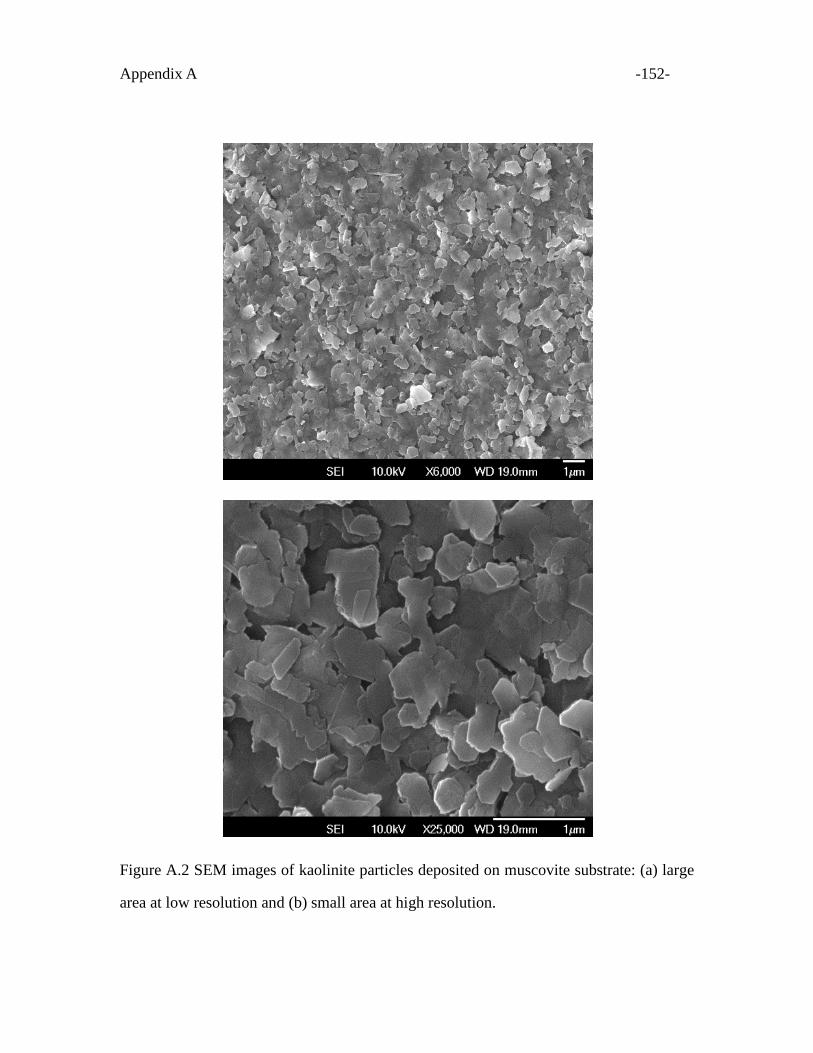
Appendix A -152-
Figure A.2 SEM images of kaolinite particles deposited on muscovite substrate: (a) large
area at low resolution and (b) small area at high resolution.
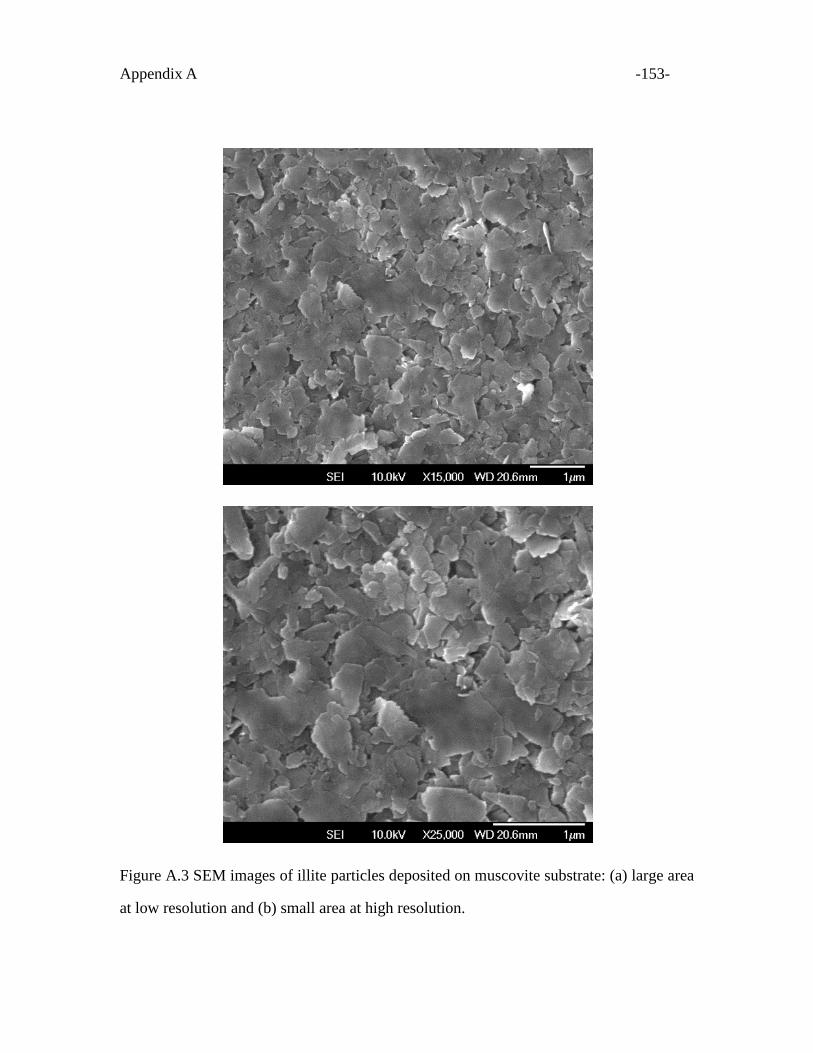
Appendix A -153-
Figure A.3 SEM images of illite particles deposited on muscovite substrate: (a) large area
at low resolution and (b) small area at high resolution.
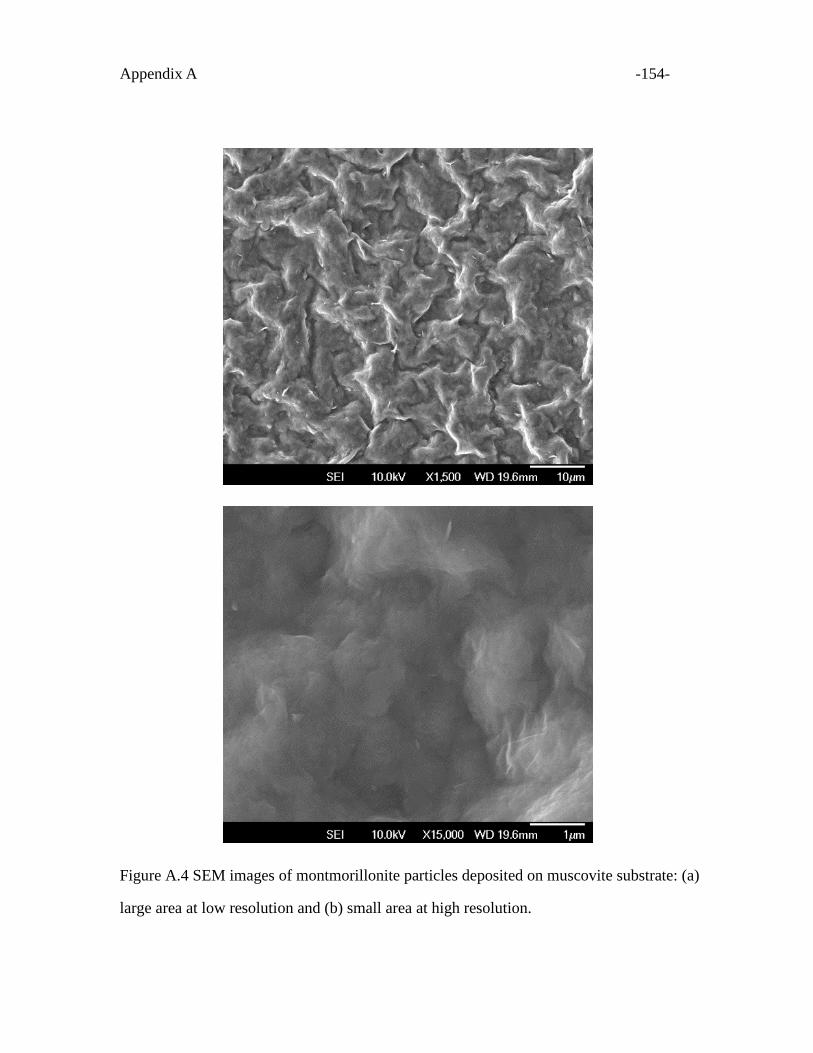
Appendix A -154-
Figure A.4 SEM images of montmorillonite particles deposited on muscovite substrate: (a)
large area at low resolution and (b) small area at high resolution.
-155-
Appendix B
Estimation of surface energy of different phyllosilicate
surfaces
B.1 Good & Van Oss model
In the Good & Van Oss model, the surface energy can be written as [1, 2]:
2LW (B.1)
where is the surface energy, LW is the Lifshitz-Van der Waals interactions
component and and are Lewis acid-base components .
The relation between liquid contact angle ( ) and surface energy components of solid
surface and liquid can be given by:
_22)cos1( SLLS
LW
L
LW
SL (B.2)
where L and S represent the liquid and solid, respectively.
B.2 Three-probe-liquid contact angle measurement
The surface energy components of the solid ( LW
S ,
S and
S ) were derived using the
sessile drop method based on the contact angles of the three probe liquids, including one
nonpolar (diiodomethane) and two polar (water and glycerol) liquids. The surface tension
components were taken from literature [1-3].
Thus, the energy components of phyllosilicate surfaces can be determined by:
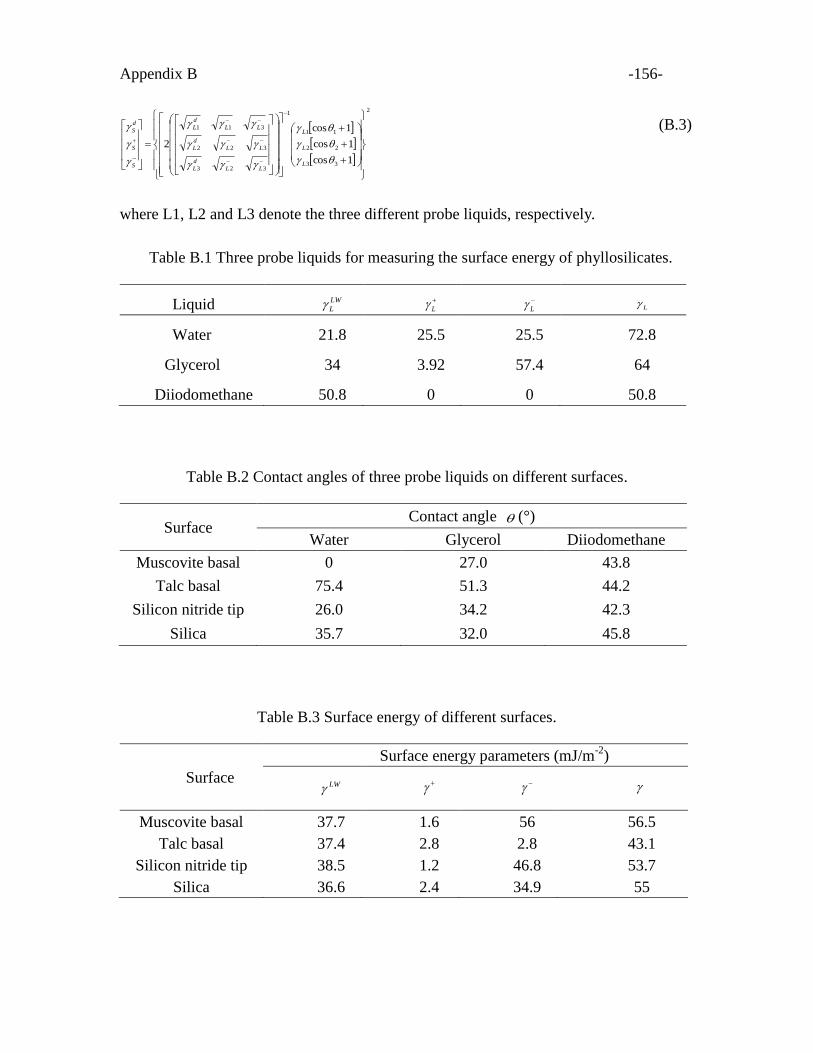
Appendix B -156-
2
33
22
11
1
323
322
311
1cos
1cos
1cos
2
L
L
L
LL
d
L
LL
d
L
LL
d
L
S
S
d
S (B.3)
where L1, L2 and L3 denote the three different probe liquids, respectively.
Table B.1 Three probe liquids for measuring the surface energy of phyllosilicates.
Liquid LW
L
L
L L
Water 21.8 25.5 25.5 72.8
Glycerol 34 3.92 57.4 64
Diiodomethane 50.8 0 0 50.8
Table B.2 Contact angles of three probe liquids on different surfaces.
Surface Contact angle (°)
Water Glycerol Diiodomethane
Muscovite basal 0 27.0 43.8
Talc basal 75.4 51.3 44.2
Silicon nitride tip 26.0 34.2 42.3
Silica 35.7 32.0 45.8
Table B.3 Surface energy of different surfaces.
Surface
Surface energy parameters (mJ/m-2
)
LW
Muscovite basal 37.7 1.6 56 56.5
Talc basal 37.4 2.8 2.8 43.1
Silicon nitride tip 38.5 1.2 46.8 53.7
Silica 36.6 2.4 34.9 55
Appendix B -157-
B.3 References
[1] Van Oss, C. J., 1993, "Acid-Base Interfacial Interactions in Aqueous Media,"
Colloids and Surfaces A: Physicochemical and Engineering Aspects, 78 pp. 1-49.
[2] Van Oss, C. J., Good, R. J., Chaudhury, M. K., 1986, "The Role of Van Der Waals
Forces and Hydrogen Bonds in “Hydrophobic Interactions” between Biopolymers
and Low Energy Surfaces," Journal of Colloid and Interface Science, 111(2) pp.
378-390.
[3] Volpe, C. D., Siboni, S., 1997, "Some Reflections on Acid–Base Solid Surface Free
Energy Theories," Journal of Colloid and Interface Science, 195(1) pp. 121-13.
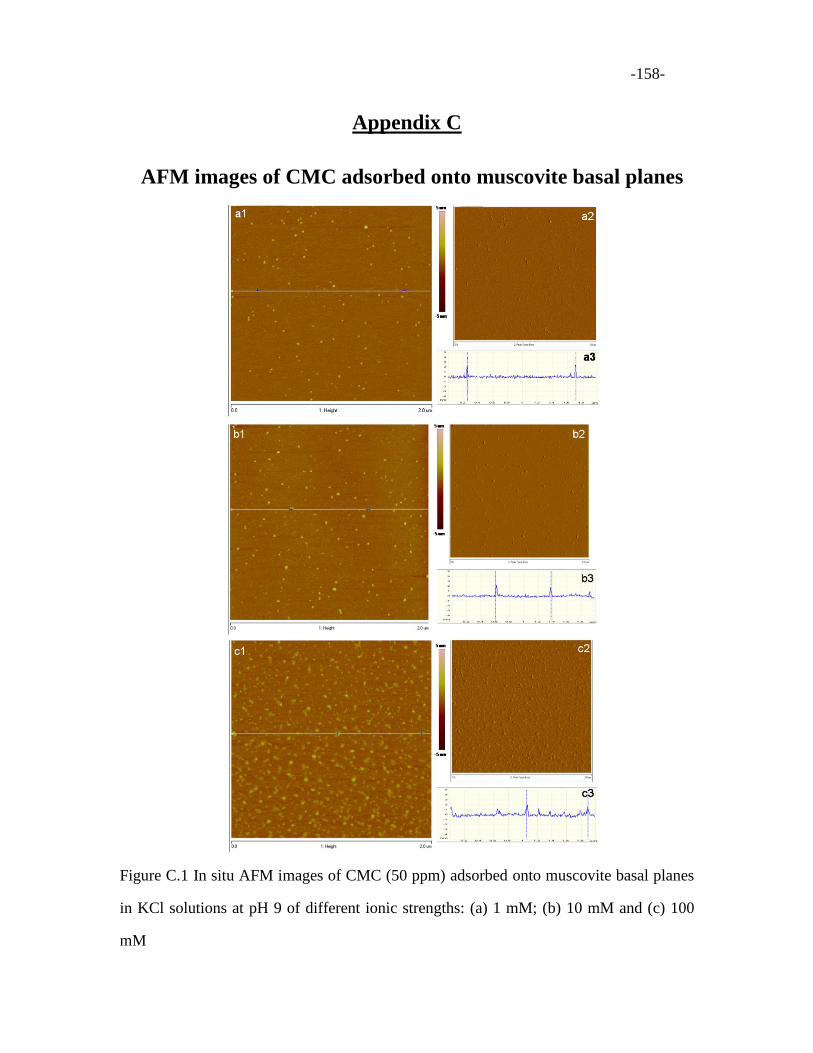
-158-
Appendix C
AFM images of CMC adsorbed onto muscovite basal planes
Figure C.1 In situ AFM images of CMC (50 ppm) adsorbed onto muscovite basal planes
in KCl solutions at pH 9 of different ionic strengths: (a) 1 mM; (b) 10 mM and (c) 100
mM
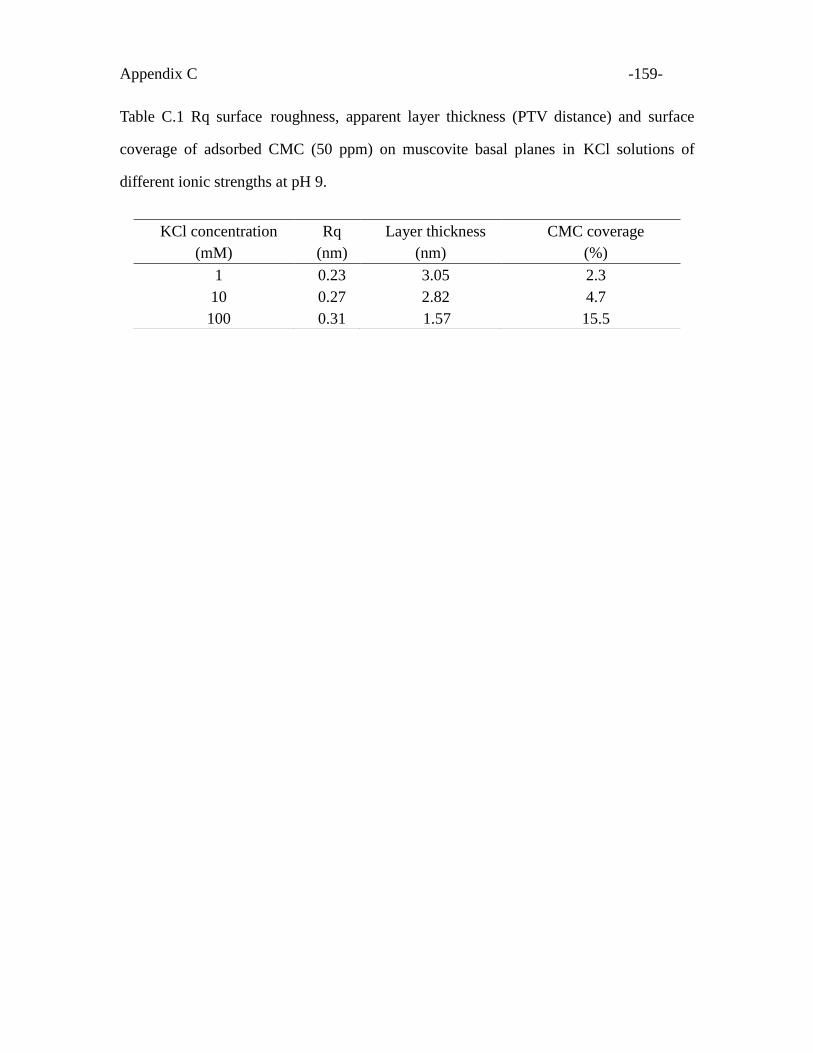
Appendix C -159-
Table C.1 Rq surface roughness, apparent layer thickness (PTV distance) and surface
coverage of adsorbed CMC (50 ppm) on muscovite basal planes in KCl solutions of
different ionic strengths at pH 9.
KCl concentration
(mM)
Rq
(nm)
Layer thickness
(nm)
CMC coverage
(%)
1 0.23 3.05 2.3
10 0.27 2.82 4.7
100 0.31 1.57 15.5
Recommended