What makesPrometheus a “next generation”monitoring system?
Björn “Beorn” Rabenstein, Production Engineer, SoundCloud Ltd.

1 Sales pitch.

It’s how “they” did it…

#GIFEE
Google Infrastructure For Everybody Else

Flow of inspiration – from 1st to 2nd systems
Borg
Borgmon
2005 2015

It’s an “industry standard”…


Consolidate monitoring and alerting

Network
Application
Host (OS, Hardware)

Network
Application
Host (OS, Hardware)

Network
Application
Container
Host (OS, Hardware)

Network
Application
Container
Orchestration
Host (OS, Hardware)

Network
Application
Container
Orchestration
Host (OS, Hardware)

Network
Application
Container
Orchestration
Host (OS, Hardware)
Heapster

Network
Application
Container
Orchestration
Host (OS, Hardware)
Heapster

Network
Application
Container
Orchestration
Host (OS, Hardware)node
exporter
SNMP exporter

Popular against all odds…


2 It’s a whole ecosystem!


Best 15m introduction talk:Brian Brazil at FOSDEM 2016

Best talk about Promethean philosophy:Julius Volz at PromCon 2016
“Prometheus is an opinionated monitoring system that chooses to do a lot of things differently from traditional monitoring systems. This leads to a culture clash for those used to other approaches, and raises questions as to why we didn't take a seemingly better approach.”

3 Blackbox vs. Whitebox.
Host vs. Service.

white-box(needs instrumentation)
black-box(no changes required)
host-based“traditional”
service-based“modern”
Dimensions of monitoring
& Graphite

Challenges of service-based monitoringScale and semantics➢ Way more targets to monitor.
○ A service has many instances.○ A hosts can run many instances of different services.
➢ And they constantly change.○ Deploys, rescheduling unhealthy instances …
➢ Need a fleet-wide 3,048m view.○ What’s my overall 99th percentile latency?
➢ Still need to be able to drill down for troubleshooting.○ Which instance causes those errors I’m seeing?
➢ Meaningful alerting.○ Symptom-based alerting for pages, cause-based alerting for warnings.○ See Rob Ewaschuk’s My philosophy on alerting https://goo.gl/2vrpSO

We combine heavy use of white-box monitoring with modest but critical uses of black-box monitoring. The simplest way to think about black-box monitoring versus white-box monitoring is that black-box monitoring is symptom-oriented and represents active—not predicted—problems. [...]
For paging, black-box monitoring has the key benefit of forcing discipline to only nag a human when a problem is both already ongoing and contributing to real symptoms. On the other hand, for not-yet-occurring but imminent problems, black-box monitoring is fairly useless.
Chapter 6: Monitoring Distributed Systems
Black-box vs. white-boxBlack-box is just perfect for symptom-based alerting, isn’t it?

Black-box:
● End-to-end test “as the user sees it”.● Probes may be different from current user traffic.● Tail latency and rare failures only visible over a long time.
White-box:
● Reported latency serving the frontend might be a lie, but reported latency of requests to the backend is “live-traffic probing”.
● Must resist temptation to alert on countless internal details.● Indispensable to detect imminent problems and to investigate causes.
Pros & cons

● Loss of redundancy (going from N+1 to N+0).● More complex reasoning based on insights into a system.● “Nearly full” scenarios.
[...] the idea of treating time-series data as a data source for generating alerts is now accessible to everyone through those open source tools like Prometheus, Riemann, Heka, and Bosun [...]
Chapter 10: Practical Alerting from Time-Series Data
Imminent problemsWhite-box and time-series based monitoring FTW.

4 Time series.

Static disk-full alert (e.g. Nagios)
100%
85%
100%
85%
Alert!!!
Alert here.
This is fine!?!

Time-series based disk-full alert (e.g. Prometheus)
100%
85%
100%
85%
This is actually fine!
Alert here… not there

5 Counter vs Gauge.
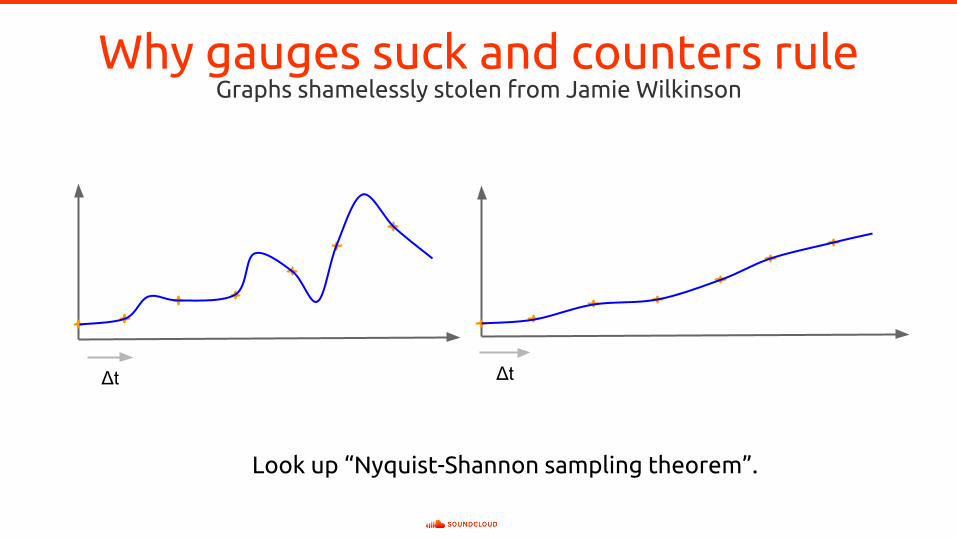
Why gauges suck and counters ruleGraphs shamelessly stolen from Jamie Wilkinson
Δt
Look up “Nyquist-Shannon sampling theorem”.
Δt
6 Labels are the new hierarchies.

We need monitoring systems that allow us to alert for high-level service objectives, but retain the granularity to inspect individual components as needed.
Chapter 10: Practical Alerting from Time-Series Data
2007 2011 2013 2016
Usage ofexternalmonitoring

ampelmann.ams3.ip-10-12-11-17.api-mobile.5xx.requests
ampelmann_requests_total{pool="ams3",instance="10.12.11.17:80", backend="api-mobile",code="5xx"}
sum(ampelmann.ams3.ip-10-12-11-17.*.*.requests)
sum(ampelmann.*.*.api-mobile.5xx.requests)
sum(ampelmann_requests_total{pool="ams3",instance="10.12.11.17:80"})
sum(ampelmann_requests_total{backend="api-mobile",code="5xx"})

app_env_zone:request_duration:99perc_5m{app="api",zone="ams",env="production"} 0.243app_env_zone:request_duration:99perc_5m{app="api",zone="ams",env="canary"} 0.219
Recommended


![Prometheus Bound by Aeschylus and Prometheus Unbound by … · 2014-05-19 · Prometheus Bound by Aeschylus and Prometheus Unbound by Percy Bysshe Shelley: [Prometheus Unbound] Translated](https://img.pdfslide.us/doc/110x75/5e6b69d324985e52ae4c9922/prometheus-bound-by-aeschylus-and-prometheus-unbound-by-2014-05-19-prometheus.jpg)