1
Preventing Lead Poisoning in Young Children
Ed Norman, MPH December 11, 2012
N.C. Division of Public Health Environmental Health Section
[email protected] / (919-707-5951)
What is Lead Poisoning?
� Disease caused by inhalation and/or
ingestion of lead in the body
� No useful purpose for lead in the body
� Travels from the blood to soft tissue to
bone
� Children not always symptomatic
Who is at Risk?
� Any young child is at risk regardless of
where they live, the family’s economic
status or the family’s race/ethnic background
Why?
� Children have more hand to mouth
activity
� Children have greater sensitivity to the toxic effects of lead
� Children absorb lead more easily than
adults
How?
� Lead is present in many sources
� Paint, dust, soil, vinyl mini-blinds,
drinking water, food, air, occupations and hobbies
� Exposure may at home, at school, in the
child care setting or on the playground
Signs and Symptoms
� Not always apparent; most children are
asymptomatic
� If symptoms are present, may mimic
other illnesses
� Stomach ache, cramps, irritability,
fatigue, vomiting, constipation, headache, sleeping problems or poor
appetite
2
Lower Levels of Lead Exposure
� May damage the central nervous
system especially the brain
� Interfere with growth
� Affect hearing
� Lower IQ
� Learning difficulties
� Behavioral problems
Higher Levels of Lead Exposure
� Symptoms may become more apparent
� Clumsiness, weakness or loss of
recently learned skills
� May result in coma, convulsions or death
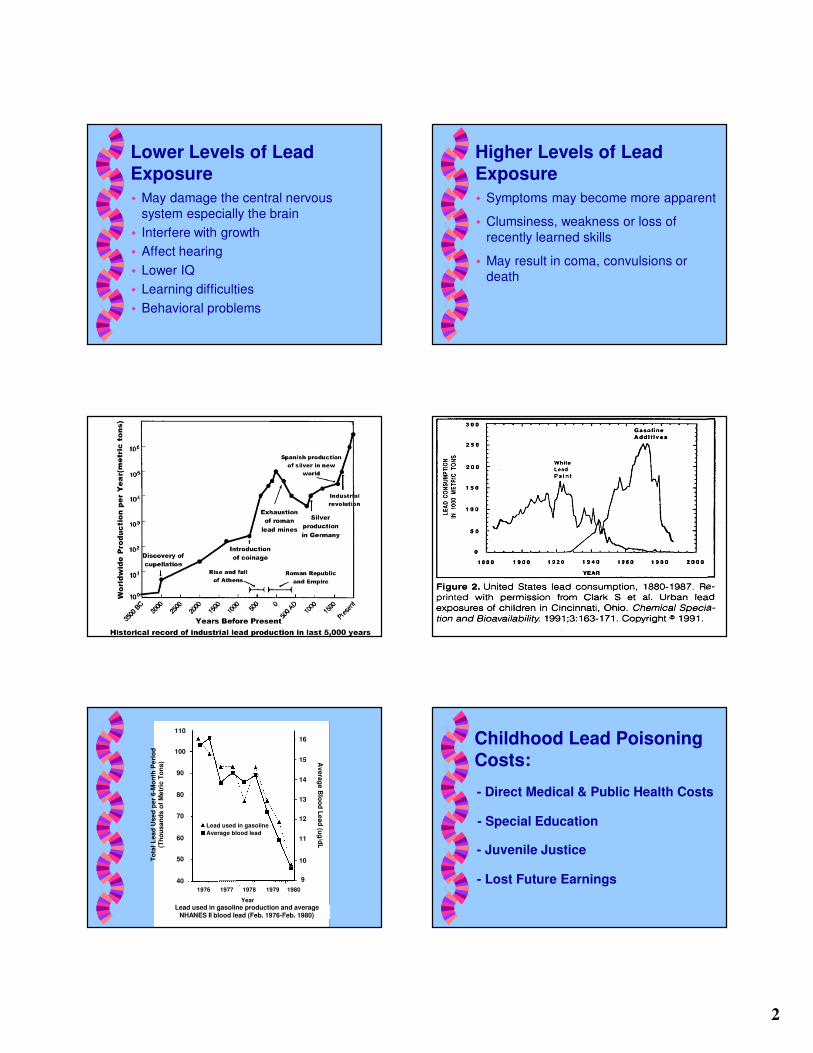
Average blood lead
Lead used in gasoline
1976 1977 1978 1979 1980
To
tal
Le
ad
Us
ed
pe
r 6
-Mo
nth
Pe
rio
d
(Th
ou
sa
nd
s o
f M
etr
ic T
on
s)
Year
Lead used in gasoline production and average NHANES II blood lead (Feb. 1976-Feb. 1980)
110
100
90
80
70
60
50
40
16
15
14
13
12
11
10
9
Av
era
ge
Blo
od
Le
ad
(ug
/dL
Childhood Lead Poisoning Costs:
- Direct Medical & Public Health Costs
- Special Education
- Juvenile Justice
- Lost Future Earnings
3
•Laboratory reporting of all blood lead test results
•Investigation of confirmed lead poisoning and EBL cases
•Remediation of identifiedhazards for confirmed lead
poisoning cases
Lab
Results
North Carolina Law:
Screening and Follow-upRecommendations from CDC
CDC Terminology
Elevated blood lead level (EBL):
10 µg/dL or greater
Confirmed lead poisoning:20 µg /dL or greater
North Carolina State Law
Reference Value:5 µg/dL or greater
CDC Guidelines:Universal assessment at 12 and 24months or at first entry before age 6
NC Requirements:Mandatory blood lead testing for population of children receiving
Medicaid (Health Check), WIC, &
Health Choice
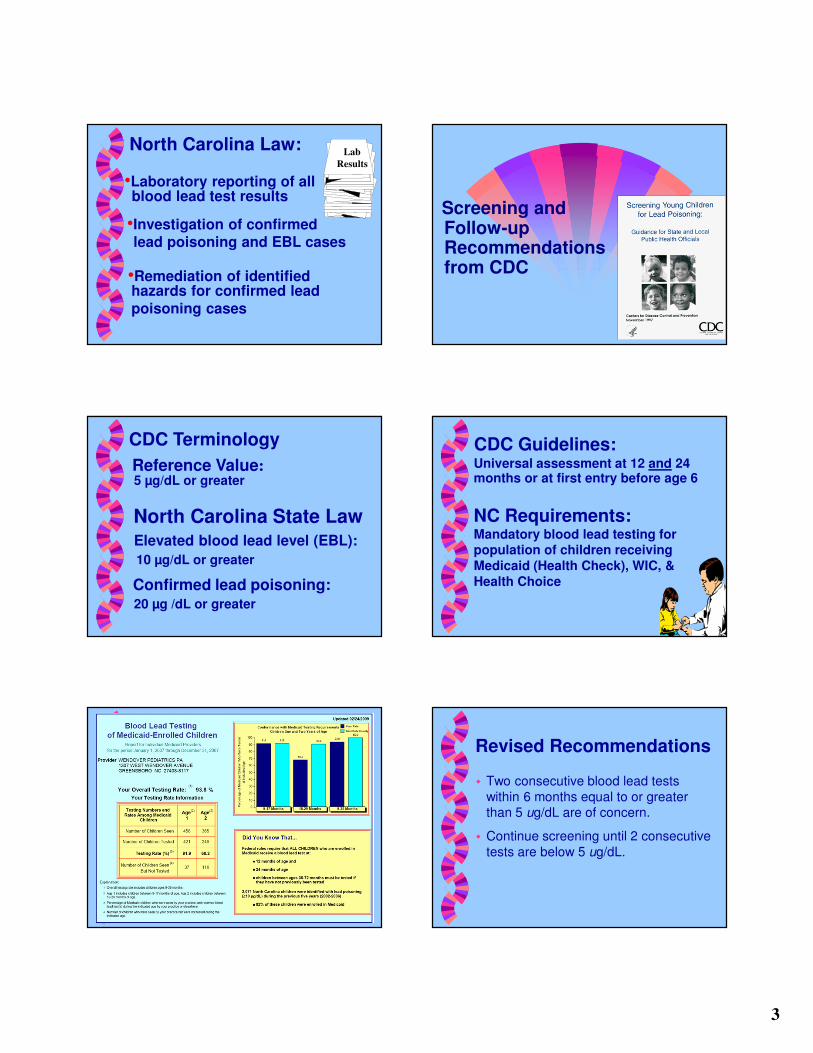
Revised Recommendations
� Two consecutive blood lead tests
within 6 months equal to or greater than 5 ug/dL are of concern.
� Continue screening until 2 consecutive
tests are below 5 ug/dL.
4
Screening Test
� A laboratory test for lead that is
performed on the blood of an asymptomatic child to determine
whether or not the child has an
elevated blood lead level.
Diagnostic Test
� A laboratory test for lead that is
performed on the blood of a child that has a screening blood lead level of 5
ug/dL or greater
� The diagnostic test is the first venous
blood test performed within 6 months of
the screening test
Follow-up Test
� A laboratory test for lead that is
performed on the blood that is used to monitor the status of a child with a
previously elevated diagnostic test for
lead
Direct blood measurement is the screening test of choiceFinger-stick adequate for screeningVenous preferred for diagnostic testState Laboratory will provide analysis of blood lead specimens for children less than six years of age at no charge
State Lab Slip
Print (make it readable)
Provide complete information
Street address versus P.O. Box
County where child lives
Interpretation of Screening Test Results
5
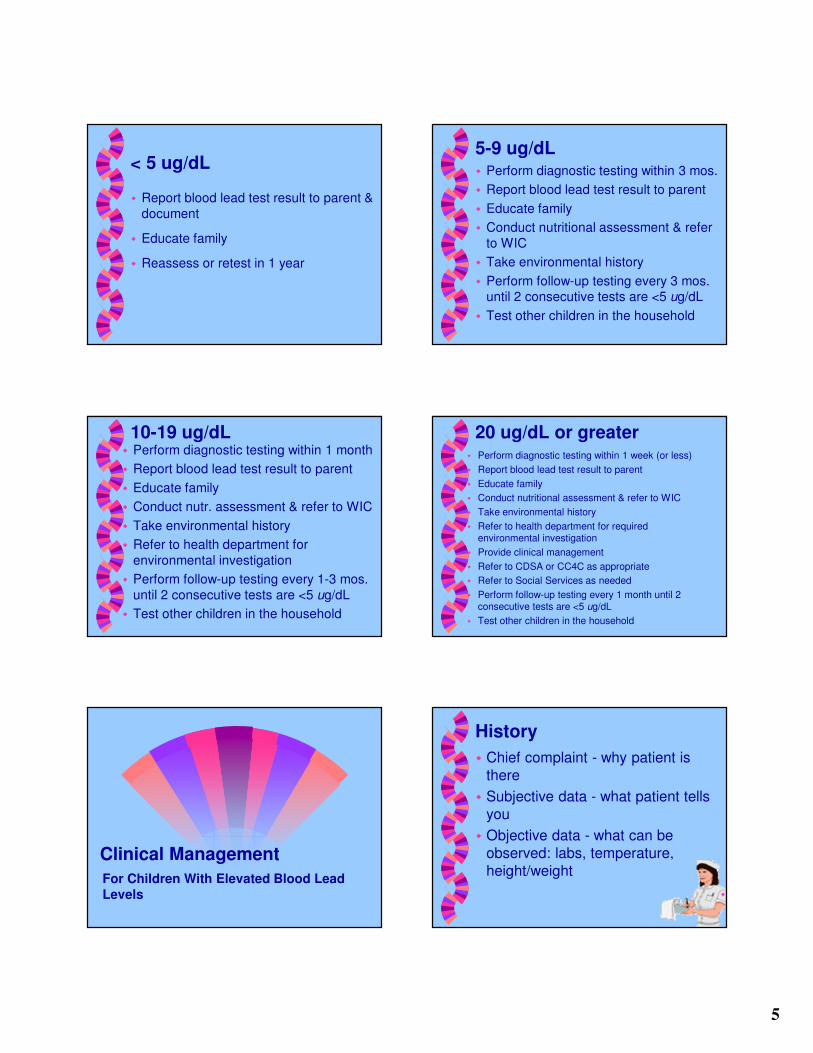
< 5 ug/dL
� Report blood lead test result to parent &
document
� Educate family
� Reassess or retest in 1 year
5-9 ug/dL� Perform diagnostic testing within 3 mos.
� Report blood lead test result to parent
� Educate family
� Conduct nutritional assessment & refer
to WIC
� Take environmental history
� Perform follow-up testing every 3 mos. until 2 consecutive tests are <5 ug/dL
� Test other children in the household
10-19 ug/dL� Perform diagnostic testing within 1 month
� Report blood lead test result to parent
� Educate family
� Conduct nutr. assessment & refer to WIC
� Take environmental history
� Refer to health department for
environmental investigation
� Perform follow-up testing every 1-3 mos.
until 2 consecutive tests are <5 ug/dL
� Test other children in the household
20 ug/dL or greater� Perform diagnostic testing within 1 week (or less)
� Report blood lead test result to parent
� Educate family
� Conduct nutritional assessment & refer to WIC
� Take environmental history
� Refer to health department for required environmental investigation
� Provide clinical management
� Refer to CDSA or CC4C as appropriate
� Refer to Social Services as needed
� Perform follow-up testing every 1 month until 2 consecutive tests are <5 ug/dL
� Test other children in the household
Clinical Management
For Children With Elevated Blood Lead
Levels
History
� Chief complaint - why patient is
there
� Subjective data - what patient tells
you
� Objective data - what can be
observed: labs, temperature,
height/weight
6
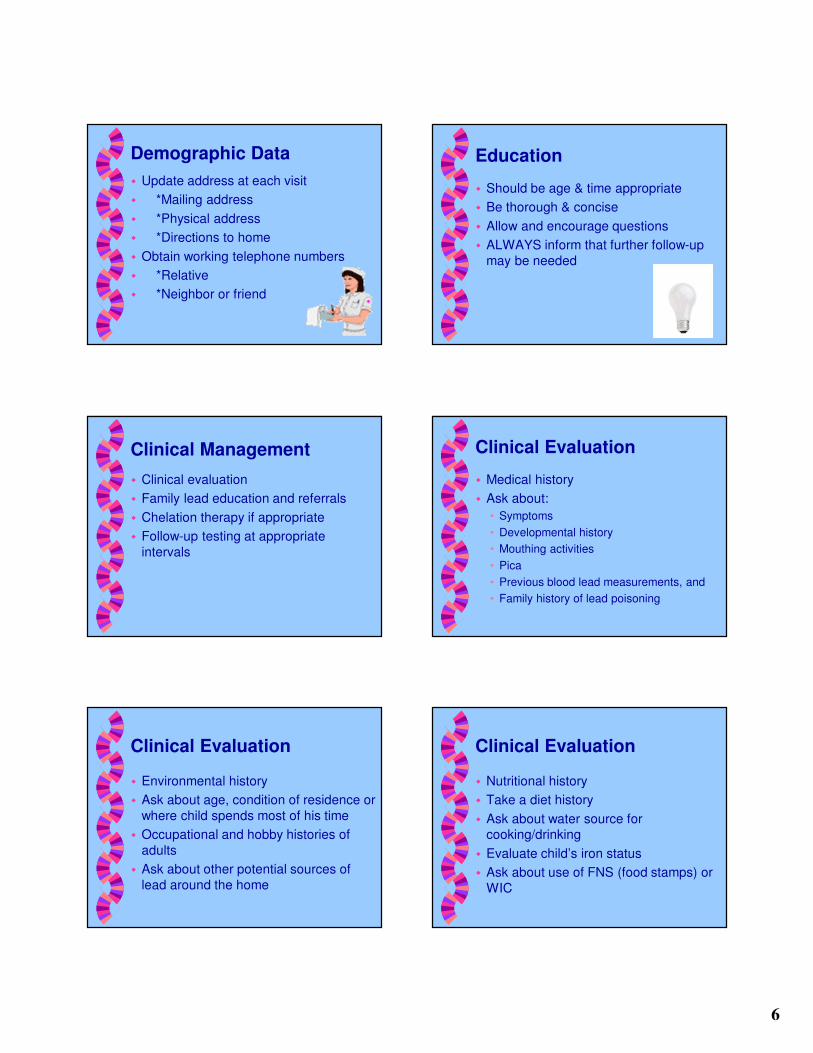
Demographic Data
� Update address at each visit
� *Mailing address
� *Physical address
� *Directions to home
� Obtain working telephone numbers
� *Relative
� *Neighbor or friend
Education
� Should be age & time appropriate
� Be thorough & concise
� Allow and encourage questions
� ALWAYS inform that further follow-up
may be needed
Clinical Management
� Clinical evaluation
� Family lead education and referrals
� Chelation therapy if appropriate
� Follow-up testing at appropriate
intervals
Clinical Evaluation
� Medical history
� Ask about:
• Symptoms
• Developmental history
• Mouthing activities
• Pica
• Previous blood lead measurements, and
• Family history of lead poisoning
Clinical Evaluation
� Environmental history
� Ask about age, condition of residence or
where child spends most of his time
� Occupational and hobby histories of
adults
� Ask about other potential sources of
lead around the home
Clinical Evaluation
� Nutritional history
� Take a diet history
� Ask about water source for cooking/drinking
� Evaluate child’s iron status
� Ask about use of FNS (food stamps) or
WIC
7
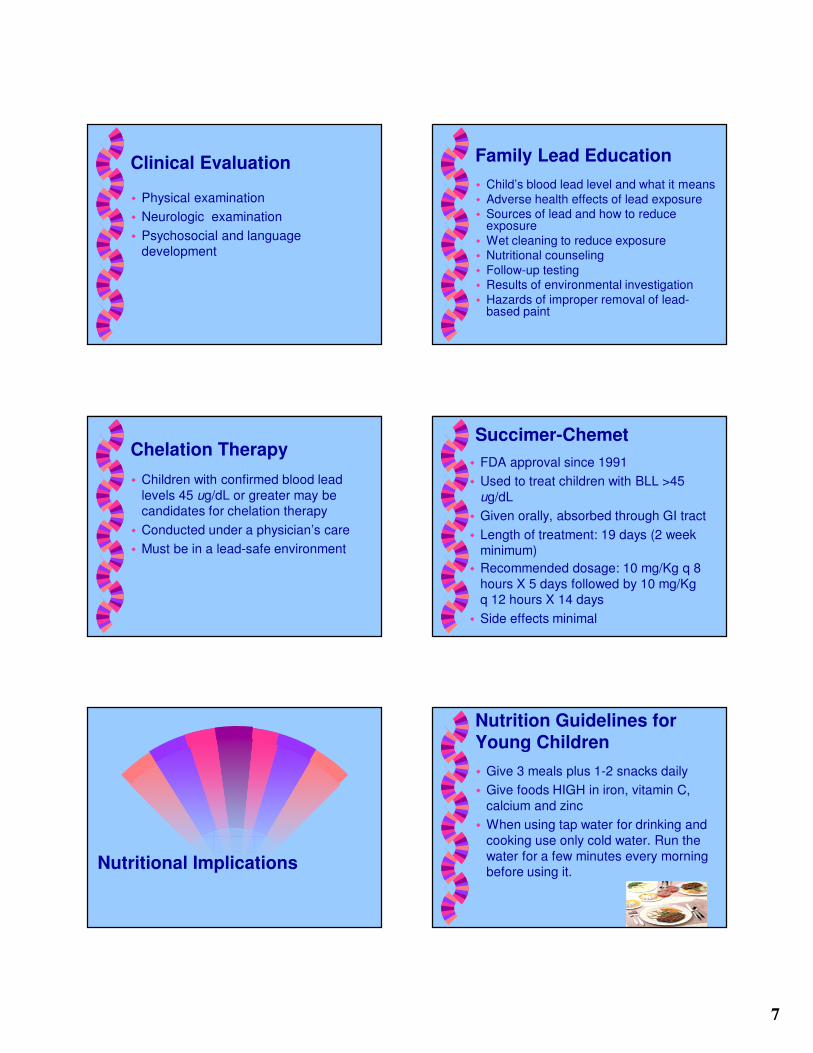
Clinical Evaluation
� Physical examination
� Neurologic examination
� Psychosocial and language development
Family Lead Education
� Child’s blood lead level and what it means
� Adverse health effects of lead exposure� Sources of lead and how to reduce
exposure
� Wet cleaning to reduce exposure� Nutritional counseling
� Follow-up testing� Results of environmental investigation
� Hazards of improper removal of lead-based paint
Chelation Therapy
� Children with confirmed blood lead
levels 45 ug/dL or greater may be candidates for chelation therapy
� Conducted under a physician’s care
� Must be in a lead-safe environment
Succimer-Chemet
� FDA approval since 1991
� Used to treat children with BLL >45
ug/dL
� Given orally, absorbed through GI tract
� Length of treatment: 19 days (2 week minimum)
� Recommended dosage: 10 mg/Kg q 8
hours X 5 days followed by 10 mg/Kg q 12 hours X 14 days
� Side effects minimal
Nutritional Implications
Nutrition Guidelines for Young Children
� Give 3 meals plus 1-2 snacks daily
� Give foods HIGH in iron, vitamin C,
calcium and zinc
� When using tap water for drinking and
cooking use only cold water. Run the
water for a few minutes every morning before using it.
8
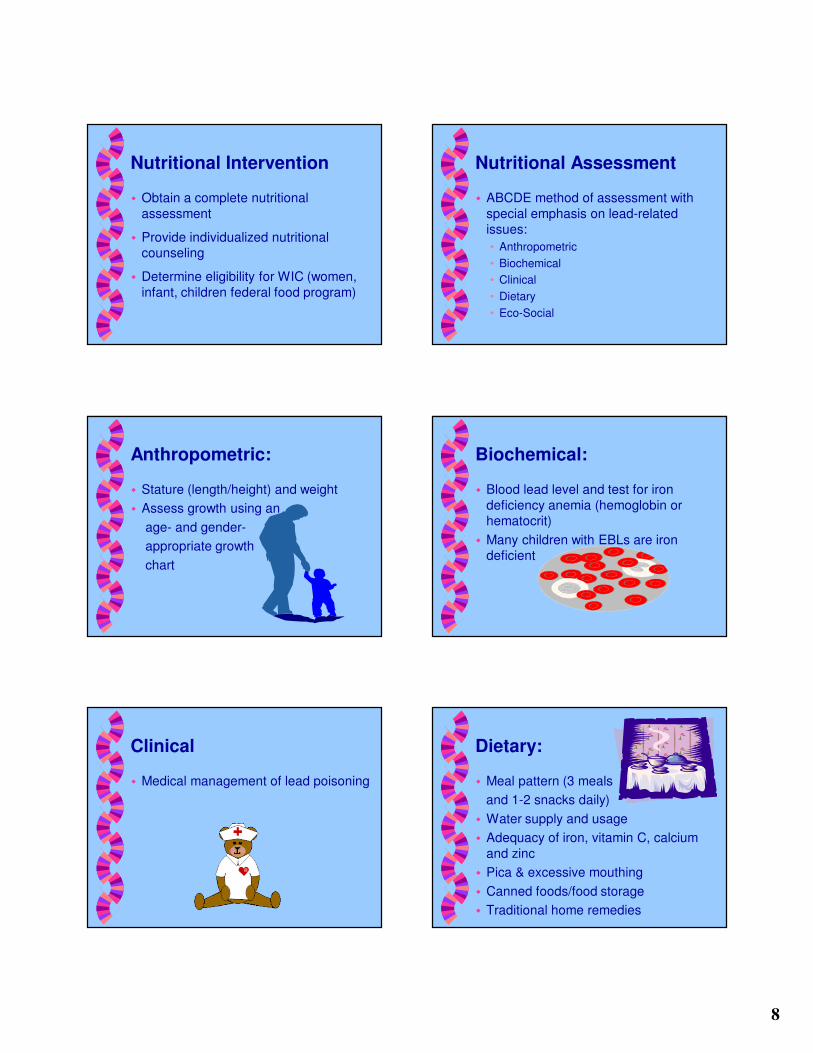
Nutritional Intervention
� Obtain a complete nutritional
assessment
� Provide individualized nutritional counseling
� Determine eligibility for WIC (women,
infant, children federal food program)
Nutritional Assessment
� ABCDE method of assessment with
special emphasis on lead-related issues:
• Anthropometric
• Biochemical
• Clinical
• Dietary
• Eco-Social
Anthropometric:
� Stature (length/height) and weight
� Assess growth using an
age- and gender-
appropriate growth
chart
Biochemical:
� Blood lead level and test for iron
deficiency anemia (hemoglobin or hematocrit)
� Many children with EBLs are iron deficient
Clinical
� Medical management of lead poisoning
Dietary:
� Meal pattern (3 meals
and 1-2 snacks daily)
� Water supply and usage
� Adequacy of iron, vitamin C, calcium
and zinc
� Pica & excessive mouthing
� Canned foods/food storage
� Traditional home remedies
9
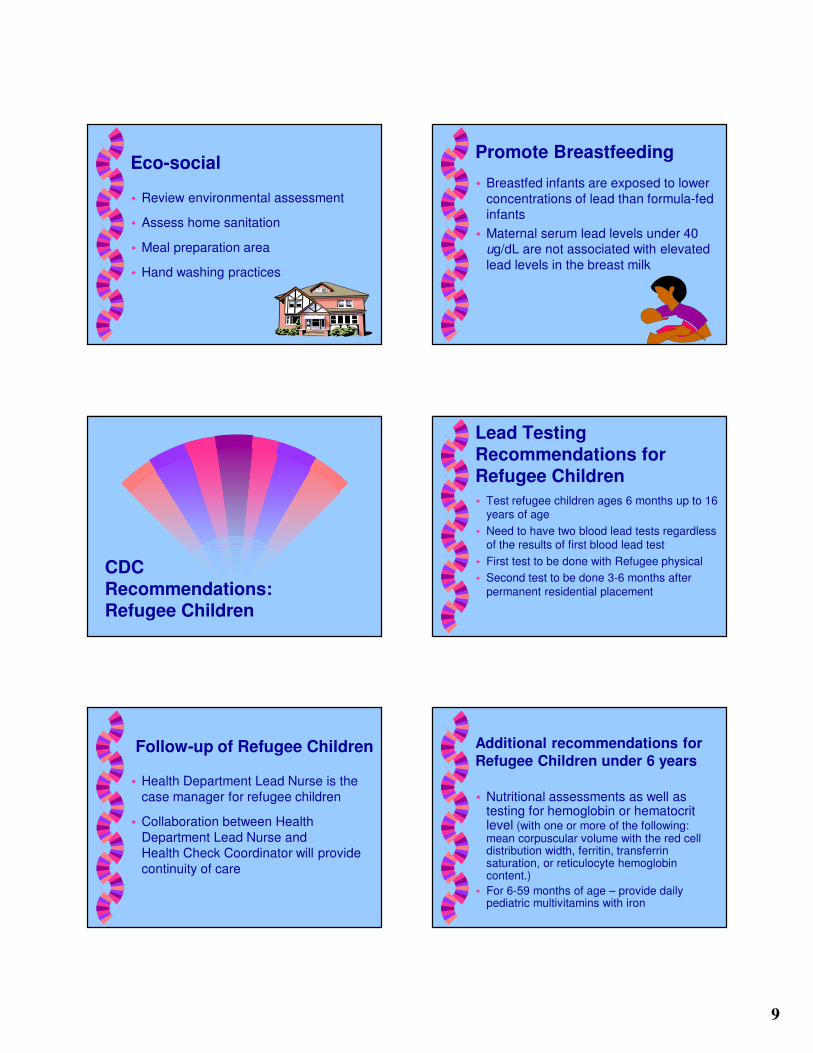
Eco-social
� Review environmental assessment
� Assess home sanitation
� Meal preparation area
� Hand washing practices
Promote Breastfeeding
� Breastfed infants are exposed to lower
concentrations of lead than formula-fed infants
� Maternal serum lead levels under 40 ug/dL are not associated with elevated
lead levels in the breast milk
CDC Recommendations: Refugee Children
Lead Testing Recommendations for Refugee Children
� Test refugee children ages 6 months up to 16 years of age
� Need to have two blood lead tests regardless of the results of first blood lead test
� First test to be done with Refugee physical
� Second test to be done 3-6 months after
permanent residential placement
Follow-up of Refugee Children
� Health Department Lead Nurse is the
case manager for refugee children
� Collaboration between Health
Department Lead Nurse and Health Check Coordinator will provide
continuity of care
Additional recommendations for
Refugee Children under 6 years
� Nutritional assessments as well as testing for hemoglobin or hematocrit level (with one or more of the following: mean corpuscular volume with the red cell distribution width, ferritin, transferrin saturation, or reticulocyte hemoglobin content.)
� For 6-59 months of age – provide daily pediatric multivitamins with iron
10
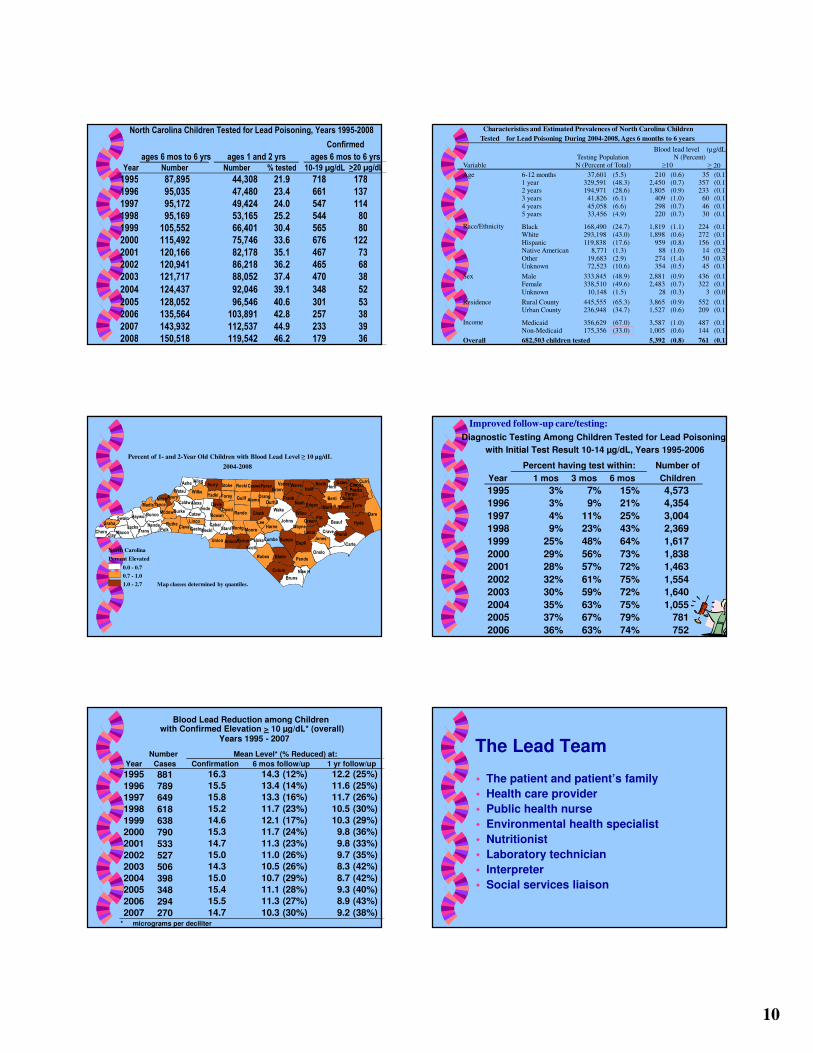
ages 6 mos to 6 yrs
Year Number % tested
1995 87,895 44,308 21.9 718 178
1996 95,035 47,480 23.4 661 137
1997 95,172 49,424 24.0 547 114
1998 95,169 53,165 25.2 544 80
1999 105,552 66,401 30.4 565 80
2000 115,492 75,746 33.6 676 122
2001 120,166 82,178 35.1 467 73
2002 120,941 86,218 36.2 465 68
2003 121,717 88,052 37.4 470 38
2004 124,437 92,046 39.1 348 52
2005 128,052 96,546 40.6 301 53
2006 135,564 103,891 42.8 257 38
2007 143,932 112,537 44.9 233 39
2008 150,518 119,542 46.2 179 36
ages 6 mos to 6 yrs
North Carolina Children Tested for Lead Poisoning, Years 1995-2008
Number
ages 1 and 2 yrs
10-19 µg/dL >20 µg/dL
Confirmed
Variable
Age 6-12 months 37,601 (5.5) 210 (0.6) 35 (0.1) 1 year 329,591 (48.3) 2,450 (0.7) 357 (0.1) 2 years 194,971 (28.6) 1,805 (0.9) 233 (0.1) 3 years 41,826 (6.1) 409 (1.0) 60 (0.1)
4 years 45,058 (6.6) 298 (0.7) 46 (0.1) 5 years 33,456 (4.9) 220 (0.7) 30 (0.1)
Race/Ethnicity Black 168,490 (24.7) 1,819 (1.1) 224 (0.1) White 293,198 (43.0) 1,898 (0.6) 272 (0.1)
Hispanic 119,838 (17.6) 959 (0.8) 156 (0.1) Native American 8,771 (1.3) 88 (1.0) 14 (0.2)
Other 19,683 (2.9) 274 (1.4) 50 (0.3) Unknown 72,523 (10.6) 354 (0.5) 45 (0.1)
Sex Male 333,845 (48.9) 2,881 (0.9) 436 (0.1) Female 338,510 (49.6) 2,483 (0.7) 322 (0.1)
Unknown 10,148 (1.5) 28 (0.3) 3 (0.0)
Residence Rural County 445,555 (65.3) 3,865 (0.9) 552 (0.1) Urban County 236,948 (34.7) 1,527 (0.6) 209 (0.1)
Income Medicaid 356,629 (67.0) 3,587 (1.0) 487 (0.1) Non-Medicaid 175,356 (33.0) 1,005 (0.6) 144 (0.1)
Overall 5,392 (0.8) 761 (0.1)
N (Percent of Total)
Blood lead level (µg/dL)N (Percent)
Characteristics and Estimated Prevalences of North Carolina Children
Tested for Lead Poisoning During 2004-2008, Ages 6 months to 6 years
Testing Population
≥10 ≥ 20
682,503 children tested
CarteDupli
BladeRobesPende
Onslo
SampsUnion Anson
Hyde
DarePitt
Beauf
Halif
Wake
Berti
Bruns
Colum
Wilke
Guilf
Crave
Johns
Rando
Tyrre
ChathIrede
Moore
Nash
Harne
Bunco
Pamli
Rocki
David
Surry North
Ruthe
Meckl
Cumbe
Marti
Swain
Curri
Granv
Frank
Burke
Jacks Cleve
Ashe
Wayne
Haywo
Edgec
Stoke
MontgStanlMacon
Jones
Chero
Caldw
Hoke
Rowan
Madis
Warre
Richm
Hertf
Forsy
Lenoi
Lee
Perso
Alama
Washi
Trans
WilsoCataw
Orang
Caswe
Mcdow
Scotl
Yadki
CabarGasto
Gates
Hende
Perqu
Linco
Polk
Yance
Watau
Clay
Graha
DurhaDavieAlexa
Pasqu
AllegVance
Green
Camde
AveryMitch
New H
Chowa
Percent of 1- and 2-Year Old Children with Blood Lead Level ≥ 10 µg/dL
2004-2008
Map classes determined by quantiles.
North Carolina
Percent Elevated
0.0 - 0.7
0.7 - 1.0
1.0 - 2.7
Year 1 mos 3 mos 6 mos
1995 3% 7% 15% 4,573
1996 3% 9% 21% 4,354
1997 4% 11% 25% 3,004
1998 9% 23% 43% 2,369
1999 25% 48% 64% 1,617
2000 29% 56% 73% 1,838
2001 28% 57% 72% 1,463
2002 32% 61% 75% 1,554
2003 30% 59% 72% 1,640
2004 35% 63% 75% 1,055
2005 37% 67% 79% 781
2006 36% 63% 74% 752
Children
Number ofPercent having test within:
Diagnostic Testing Among Children Tested for Lead Poisoning
with Initial Test Result 10-14 µg/dL, Years 1995-2006
Improved follow-up care/testing:
Number
Cases
881 16.3 14.3 (12%) 12.2 (25%)
789 15.5 13.4 (14%) 11.6 (25%)
649 15.8 13.3 (16%) 11.7 (26%)
618 15.2 11.7 (23%) 10.5 (30%)
638 14.6 12.1 (17%) 10.3 (29%)
790 15.3 11.7 (24%) 9.8 (36%)
533 14.7 11.3 (23%) 9.8 (33%)
527 15.0 11.0 (26%) 9.7 (35%)
506 14.3 10.5 (26%) 8.3 (42%)
398 15.0 10.7 (29%) 8.7 (42%)
348 15.4 11.1 (28%) 9.3 (40%)
294 15.5 11.3 (27%) 8.9 (43%)
270 14.7 10.3 (30%) 9.2 (38%)* micrograms per deciliter
2007
2006
2004
2005
2000
2001
2002
2003
1996
1997
1998
1999
Blood Lead Reduction among Children with Confirmed Elevation > 10 µg/dL* (overall)
Years 1995 - 2007
6 mos follow/up 1 yr follow/up
Mean Level* (% Reduced) at:
ConfirmationYear
1995
The Lead Team
� The patient and patient’s family
� Health care provider
� Public health nurse
� Environmental health specialist
� Nutritionist
� Laboratory technician
� Interpreter
� Social services liaison
Recommended