What Drives Manitoba Crop
RotationAnastasia KubinecMAFRI Oilseed Crop SpecialistCrops Knowledge Centre
Overview• Manitoba Crop Rotations have changed in the past 10‐20 years composition and specific crop frequency – How current acreage and rotations have evolved– What caused the shifts
Audience......From 1992 to 2012 Which Crop Type Has Declined the Most?
a. Barleyb. Flaxc. Field Pead. Sunflowere. Wheat
Overview• Current Rotation Decisions
– Based in Net Returns?– Cropping Ease, Management Issues– Other
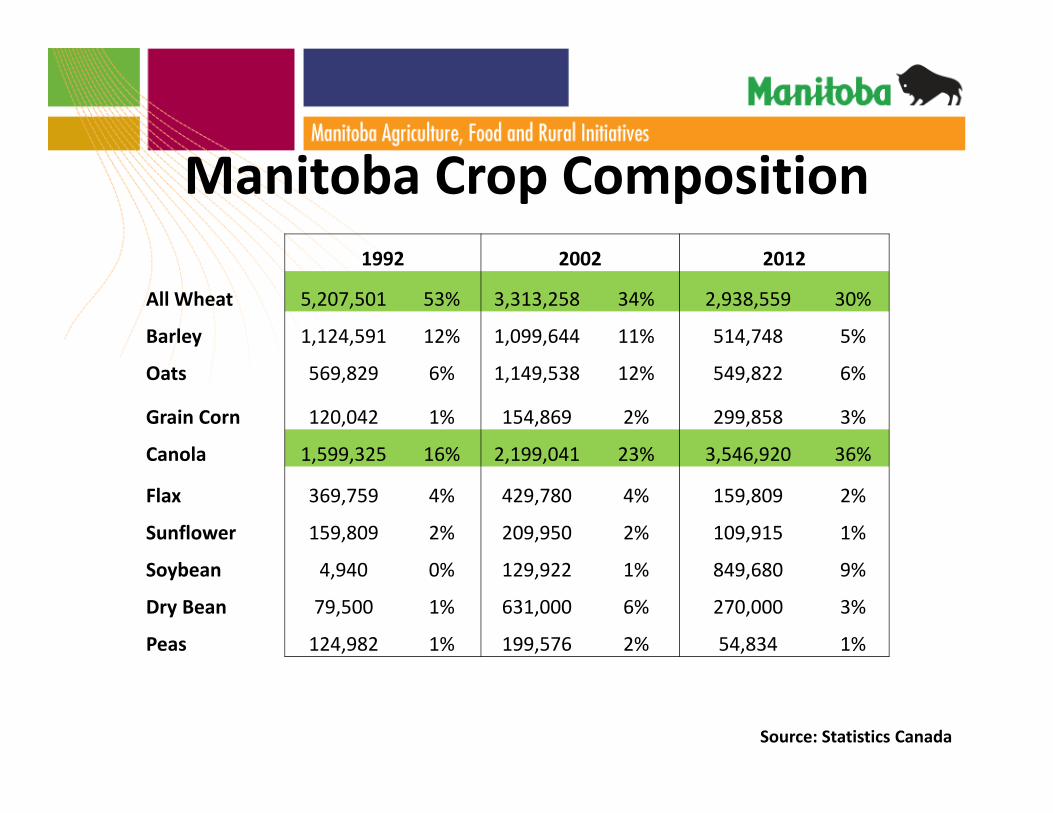
Manitoba Crop Composition 1992 2002 2012
All Wheat 5,207,501 53% 3,313,258 34% 2,938,559 30%
Barley 1,124,591 12% 1,099,644 11% 514,748 5%
Oats 569,829 6% 1,149,538 12% 549,822 6%
Grain Corn 120,042 1% 154,869 2% 299,858 3%
Canola 1,599,325 16% 2,199,041 23% 3,546,920 36%
Flax 369,759 4% 429,780 4% 159,809 2%
Sunflower 159,809 2% 209,950 2% 109,915 1%
Soybean 4,940 0% 129,922 1% 849,680 9%
Dry Bean 79,500 1% 631,000 6% 270,000 3%
Peas 124,982 1% 199,576 2% 54,834 1%
Source: Statistics Canada
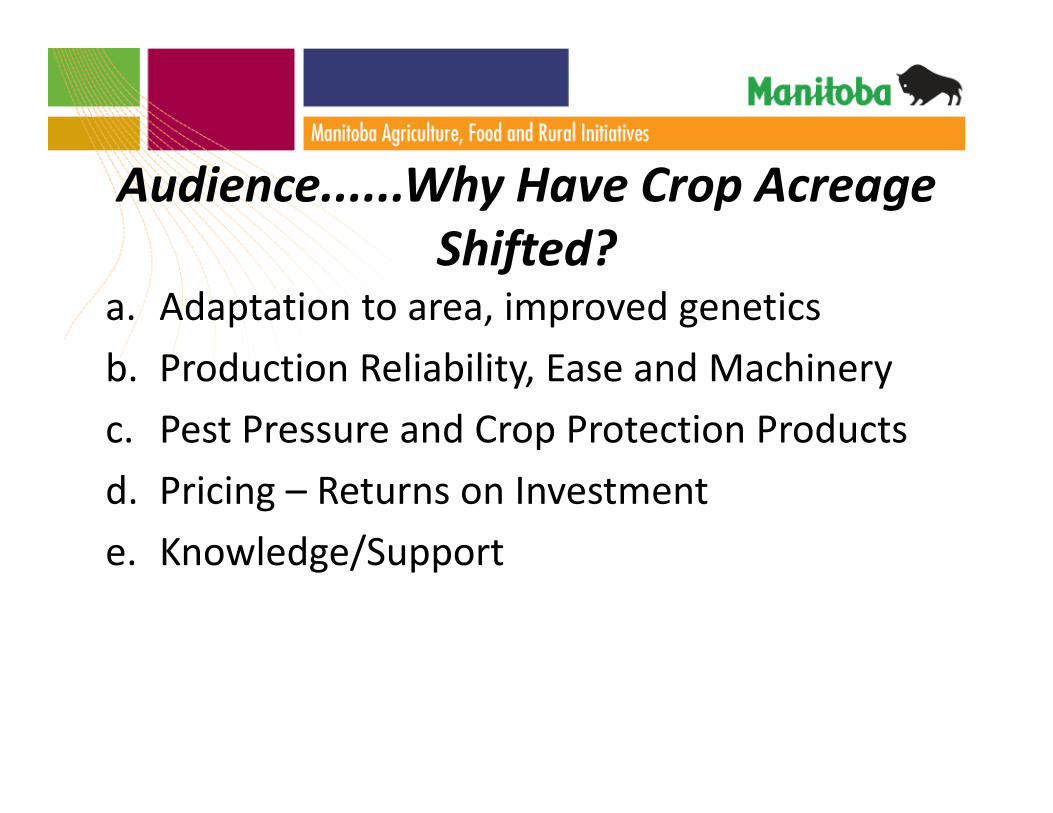
Audience......Why Have Crop Acreage Shifted?
a. Adaptation to area, improved geneticsb. Production Reliability, Ease and Machineryc. Pest Pressure and Crop Protection Productsd. Pricing – Returns on Investmente. Knowledge/Support
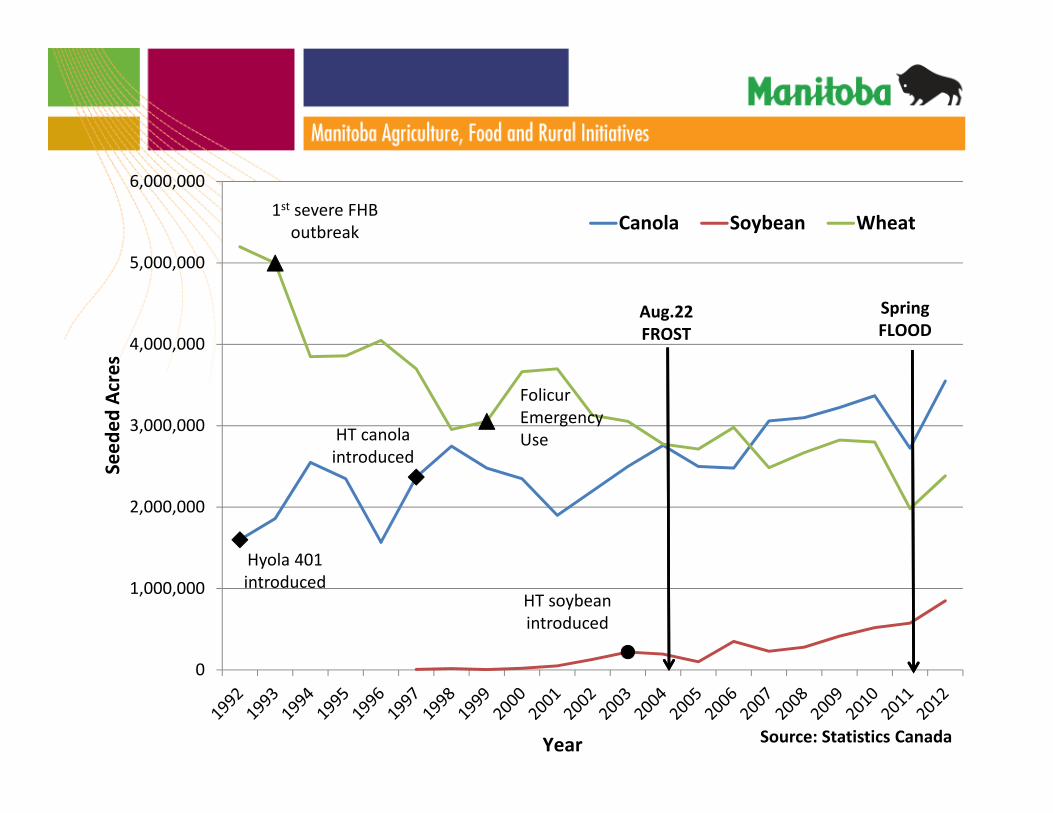
0
1,000,000
2,000,000
3,000,000
4,000,000
5,000,000
6,000,000
Canola Soybean Wheat
Seed
ed Acres
Year
Spring FLOOD
Aug.22 FROST
Source: Statistics Canada
1st severe FHB outbreak
Folicur EmergencyUseHT canola
introduced
HT soybean introduced
Hyola 401 introduced
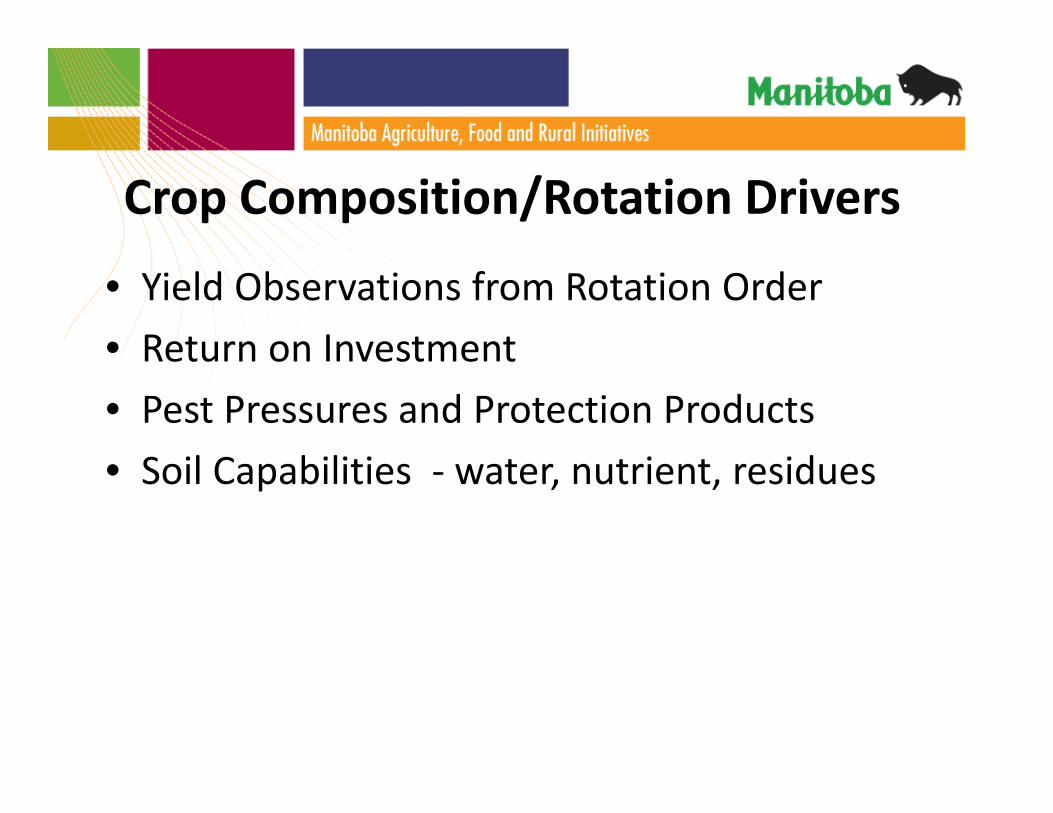
Crop Composition/Rotation Drivers
• Yield Observations from Rotation Order• Return on Investment• Pest Pressures and Protection Products• Soil Capabilities ‐ water, nutrient, residues
Documented Rotation Effects on Yields and Patterns
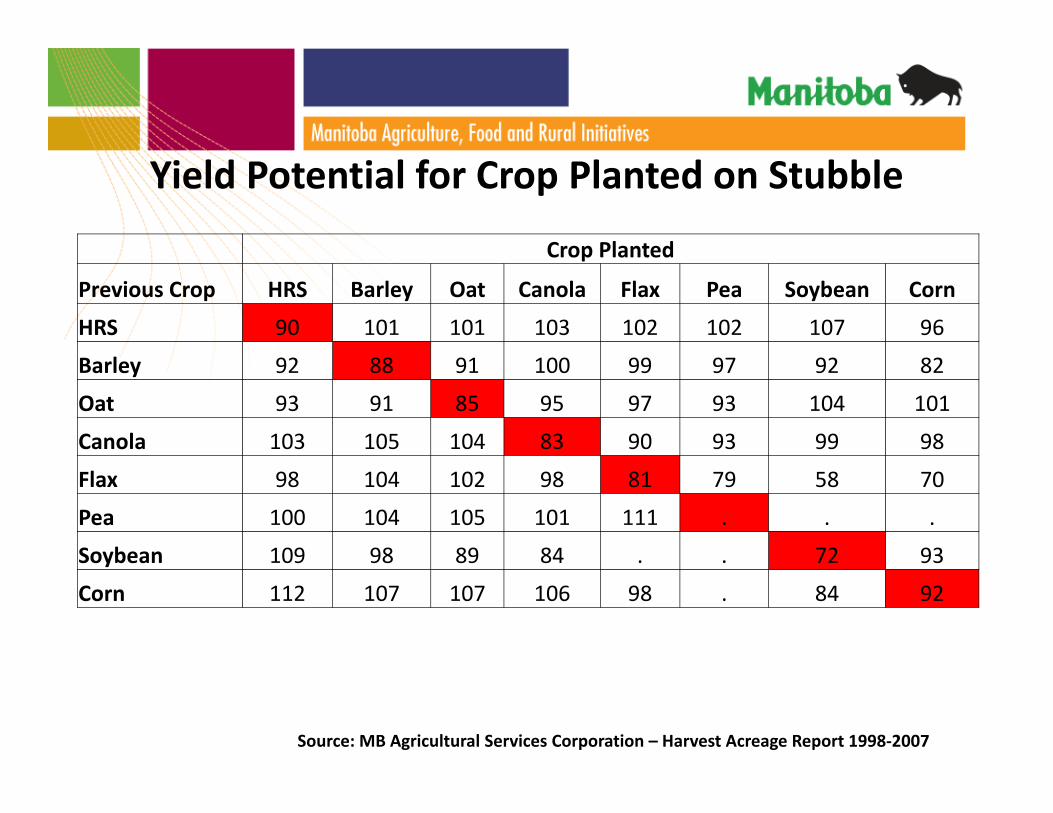
Yield Potential for Crop Planted on Stubble
Crop Planted
Previous Crop HRS Barley Oat Canola Flax Pea Soybean Corn
HRS 90 101 101 103 102 102 107 96
Barley 92 88 91 100 99 97 92 82
Oat 93 91 85 95 97 93 104 101
Canola 103 105 104 83 90 93 99 98
Flax 98 104 102 98 81 79 58 70
Pea 100 104 105 101 111 . . .
Soybean 109 98 89 84 . . 72 93
Corn 112 107 107 106 98 . 84 92
Source: MB Agricultural Services Corporation – Harvest Acreage Report 1998‐2007
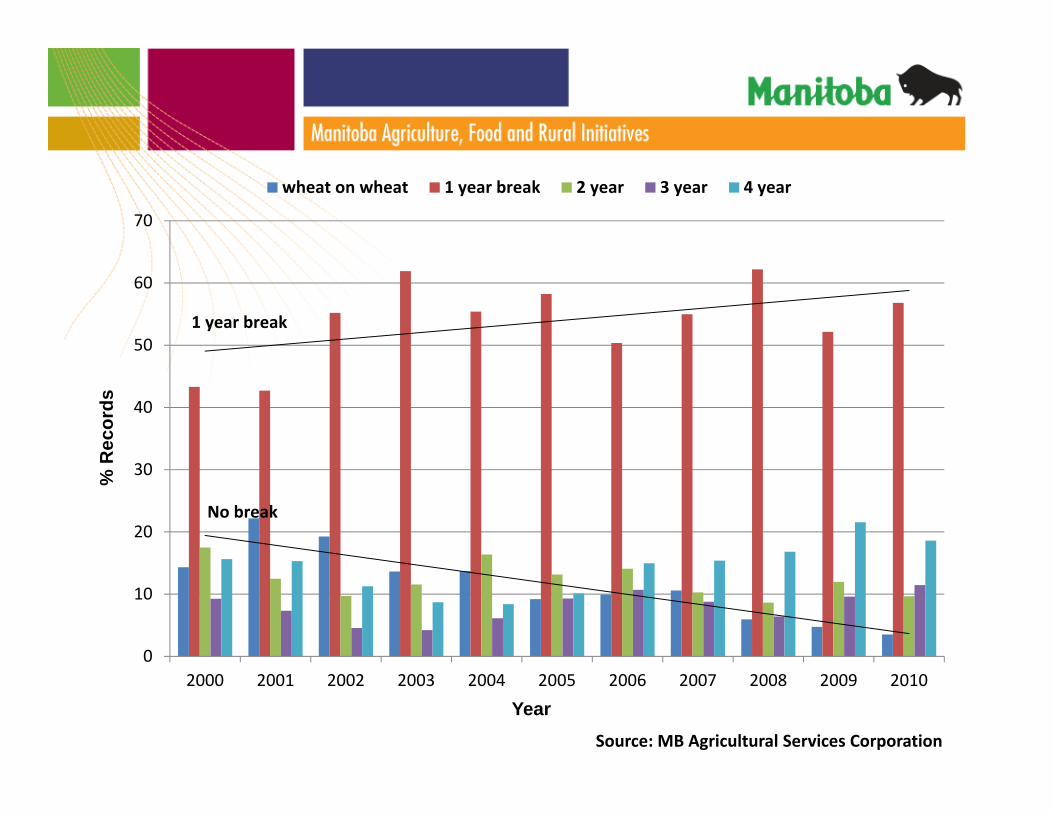
0
10
20
30
40
50
60
70
2000 2001 2002 2003 2004 2005 2006 2007 2008 2009 2010
wheat on wheat 1 year break 2 year 3 year 4 year
1 year break
No break
YearSource: MB Agricultural Services Corporation
% R
ecor
ds
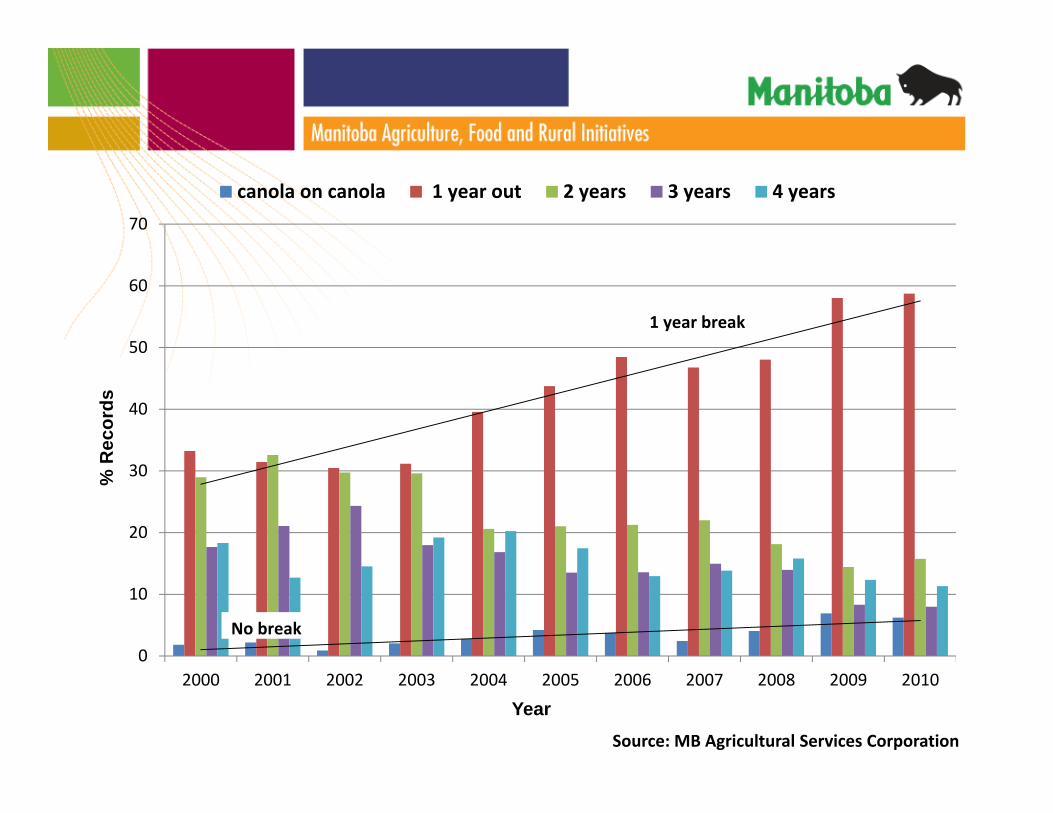
0
10
20
30
40
50
60
70
2000 2001 2002 2003 2004 2005 2006 2007 2008 2009 2010
canola on canola 1 year out 2 years 3 years 4 years
1 year break
No break
YearSource: MB Agricultural Services Corporation
% R
ecor
ds
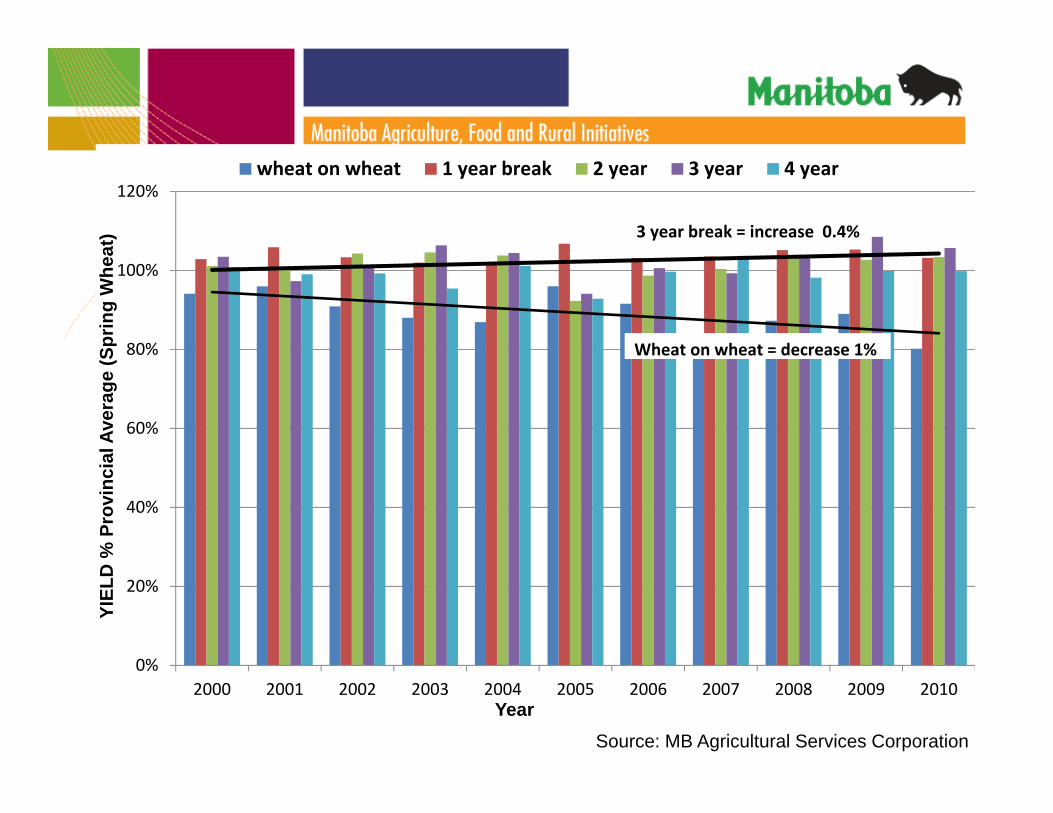
• Add yield cart of rotational sequence of wheat
0%
20%
40%
60%
80%
100%
120%
2000 2001 2002 2003 2004 2005 2006 2007 2008 2009 2010
wheat on wheat 1 year break 2 year 3 year 4 year
3 year break = increase 0.4%
Wheat on wheat = decrease 1%
Source: MB Agricultural Services Corporation
Year
YIEL
D %
Pro
vinc
ial A
vera
ge (S
prin
g W
heat
)
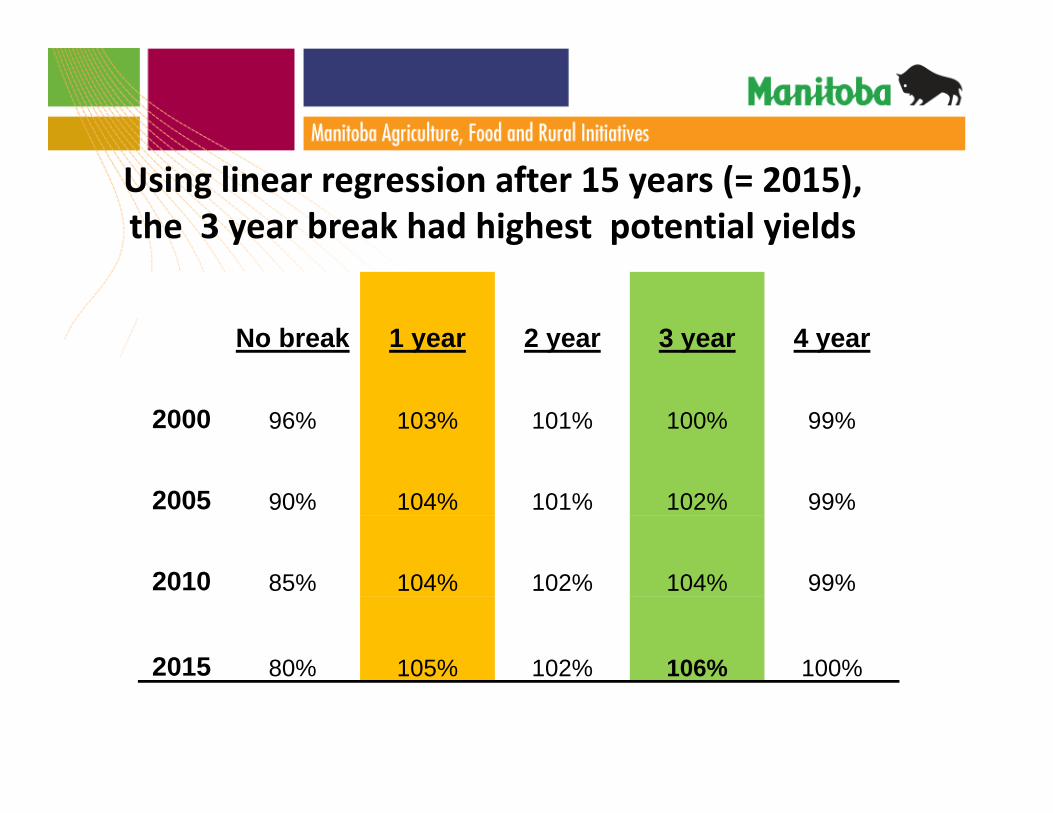
Using linear regression after 15 years (= 2015), the 3 year break had highest potential yields
No break 1 year 2 year 3 year 4 year
2000 96% 103% 101% 100% 99%
2005 90% 104% 101% 102% 99%
2010 85% 104% 102% 104% 99%
2015 80% 105% 102% 106% 100%
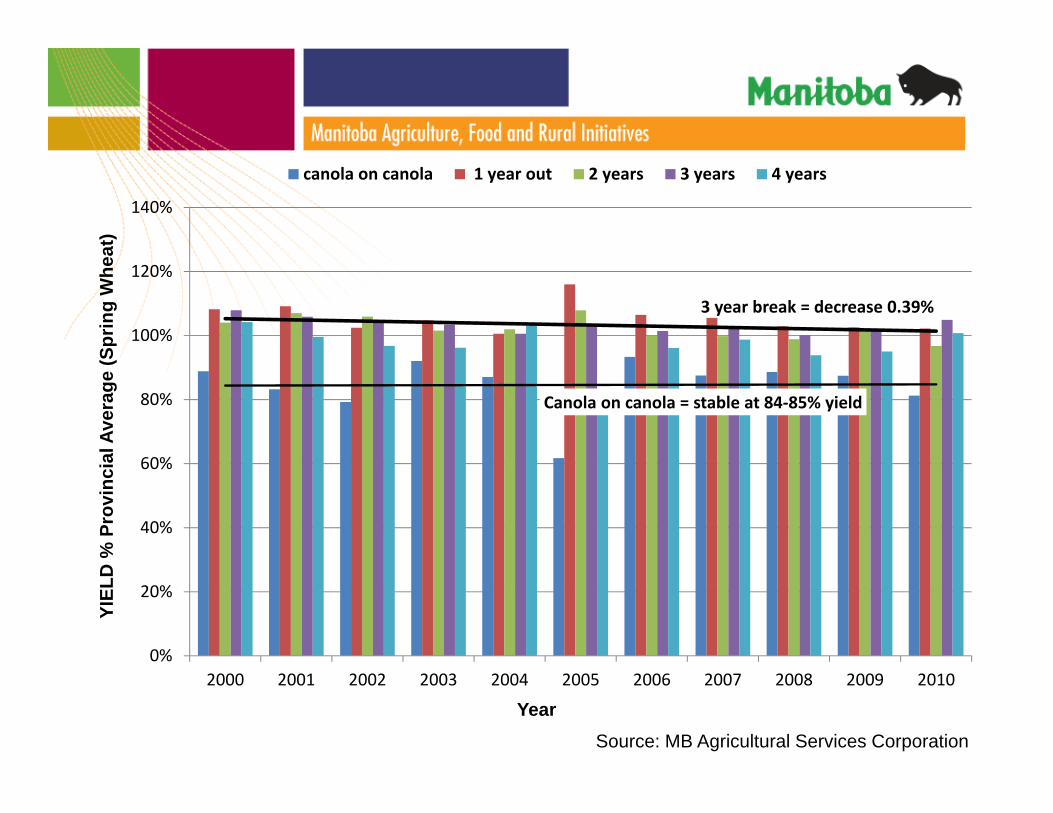
Canola on canola = stable at 84‐85% yield
3 year break = decrease 0.39%
0%
20%
40%
60%
80%
100%
120%
140%
2000 2001 2002 2003 2004 2005 2006 2007 2008 2009 2010
canola on canola 1 year out 2 years 3 years 4 years
Source: MB Agricultural Services Corporation
Year
YIEL
D %
Pro
vinc
ial A
vera
ge (S
prin
g W
heat
)
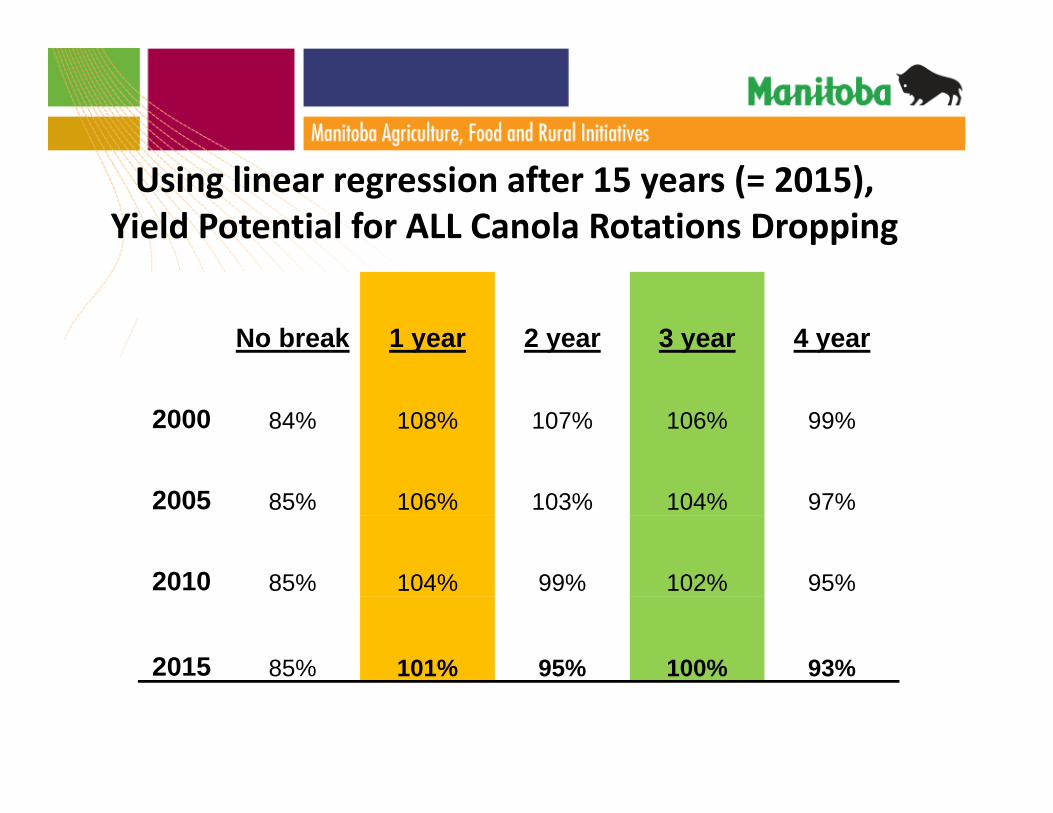
Using linear regression after 15 years (= 2015), Yield Potential for ALL Canola Rotations Dropping
No break 1 year 2 year 3 year 4 year
2000 84% 108% 107% 106% 99%
2005 85% 106% 103% 104% 97%
2010 85% 104% 99% 102% 95%
2015 85% 101% 95% 100% 93%
Audience......What Drives Crop Rotation in Your Area?
a. Crop Adaptation (Reliable Yields)b. Production Ease and Machinery Availabilityc. Ability to Control Pests (weed/disease/insect)d. Net Revenues per acree. Soil issues (erosion, residues, trash mgmt)
Economics, Returns and Seeded Acreage
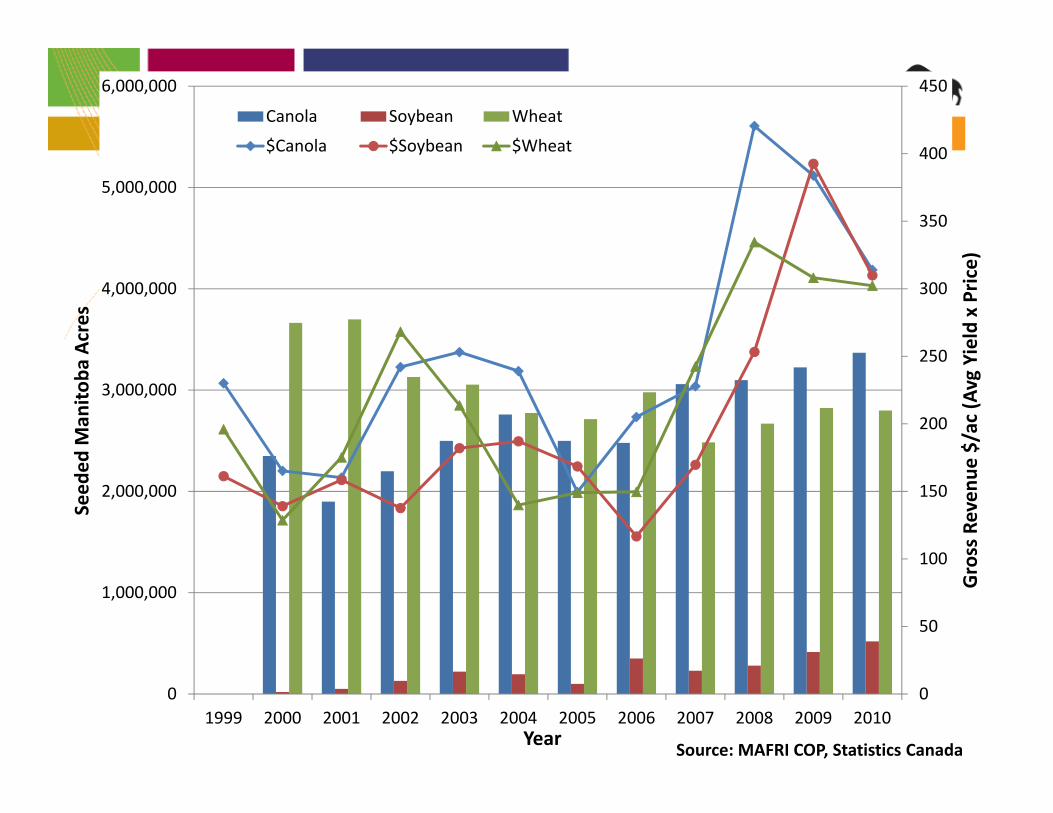
Source: MAFRI COP, Statistics CanadaYear
Seed
ed M
anito
ba Acres
Gross Reven
ue $/ac (Avg Yield x Pric
e)
0
50
100
150
200
250
300
350
400
450
0
1,000,000
2,000,000
3,000,000
4,000,000
5,000,000
6,000,000
1999 2000 2001 2002 2003 2004 2005 2006 2007 2008 2009 2010
Canola Soybean Wheat
$Canola $Soybean $Wheat
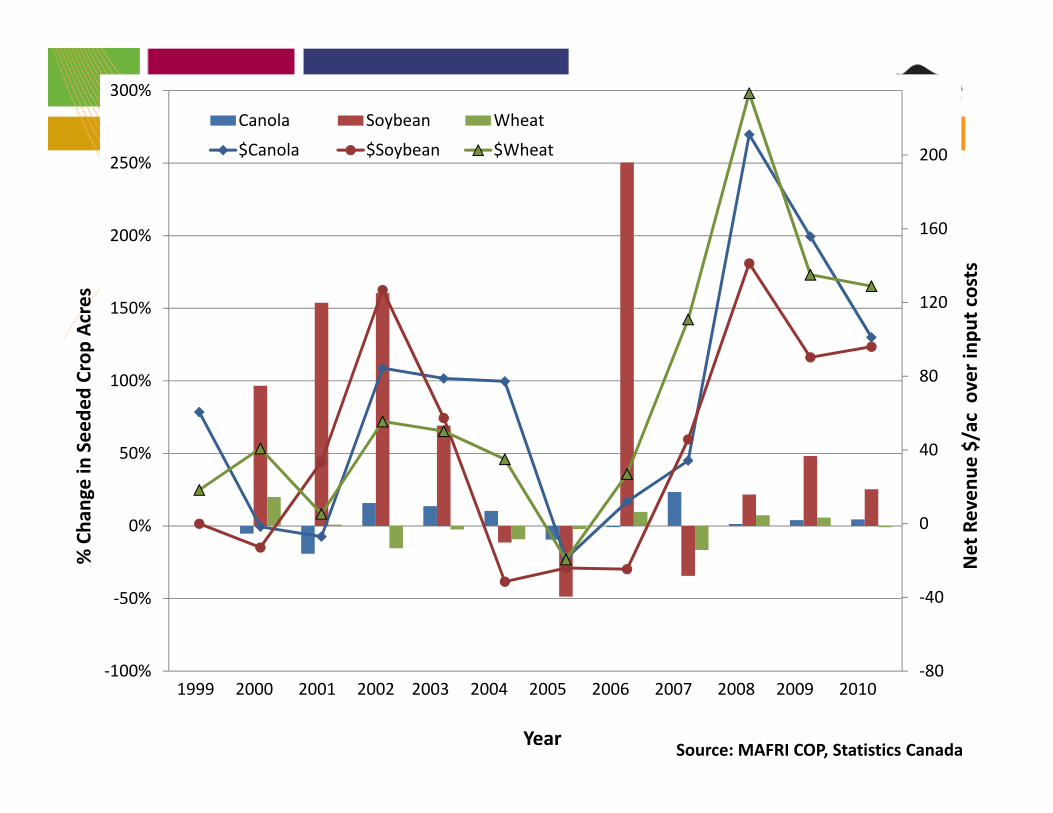
Source: MAFRI COP, Statistics CanadaYear
Net Reven
ue $/ac over inp
ut costs
% Cha
nge in Seede
d Crop
Acres
‐80
‐40
0
40
80
120
160
200
‐100%
‐50%
0%
50%
100%
150%
200%
250%
300%
Canola Soybean Wheat
$Canola $Soybean $Wheat
1999 2000 2001 2002 2003 2004 2005 2006 2007 2008 2009 2010
Rotation Planning Beyond Commodity Prices
• In‐crop contaminants from past crops• Disease Issues• Soil issues (water, salts, residues, nutrients)• Good/Bad Crop Sequences in Fields
Source: Dennis Lange, MAFRI
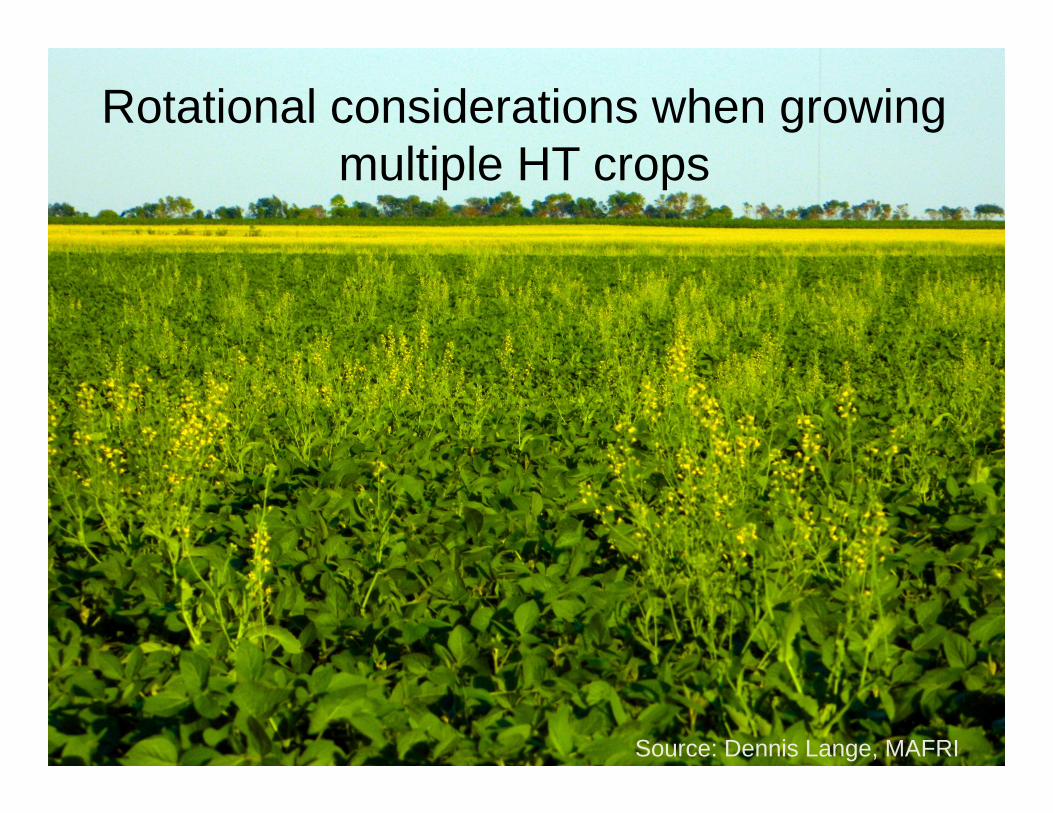
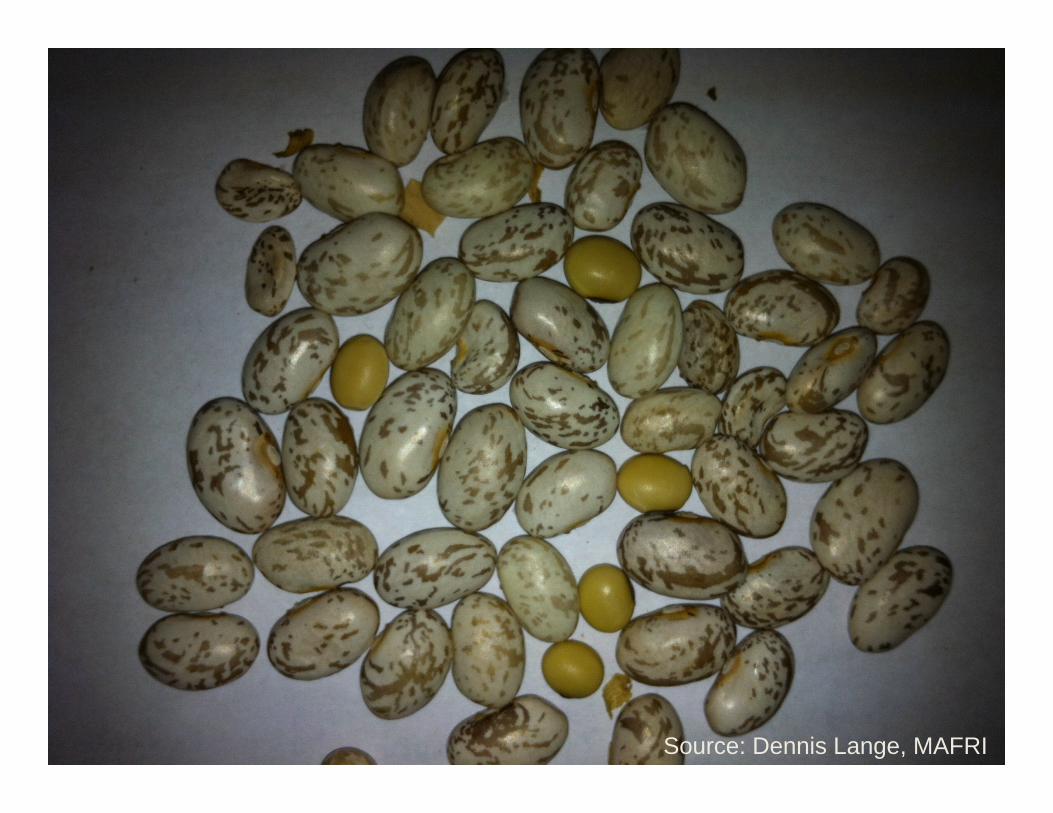
Rotational considerations when growing multiple HT crops
Source: Dennis Lange, MAFRI
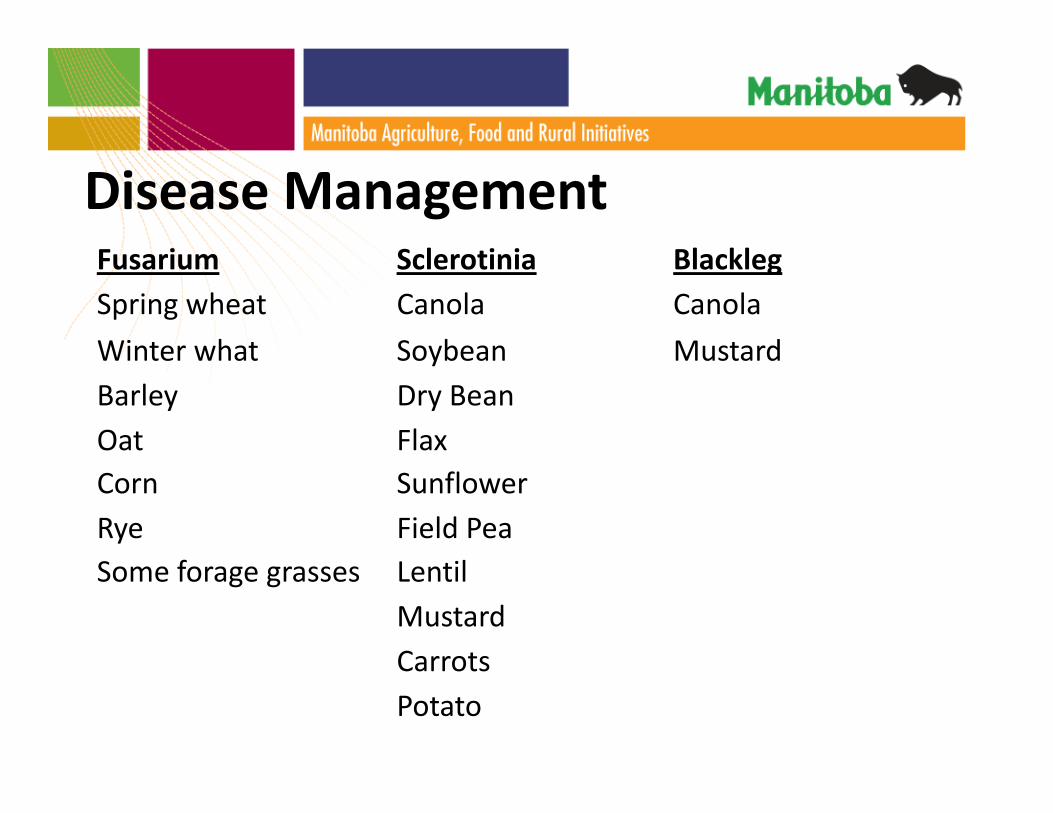
Disease ManagementFusarium Sclerotinia BlacklegSpring wheat Canola CanolaWinter what Soybean MustardBarley Dry BeanOat Flax Corn SunflowerRye Field PeaSome forage grasses Lentil
MustardCarrotsPotato
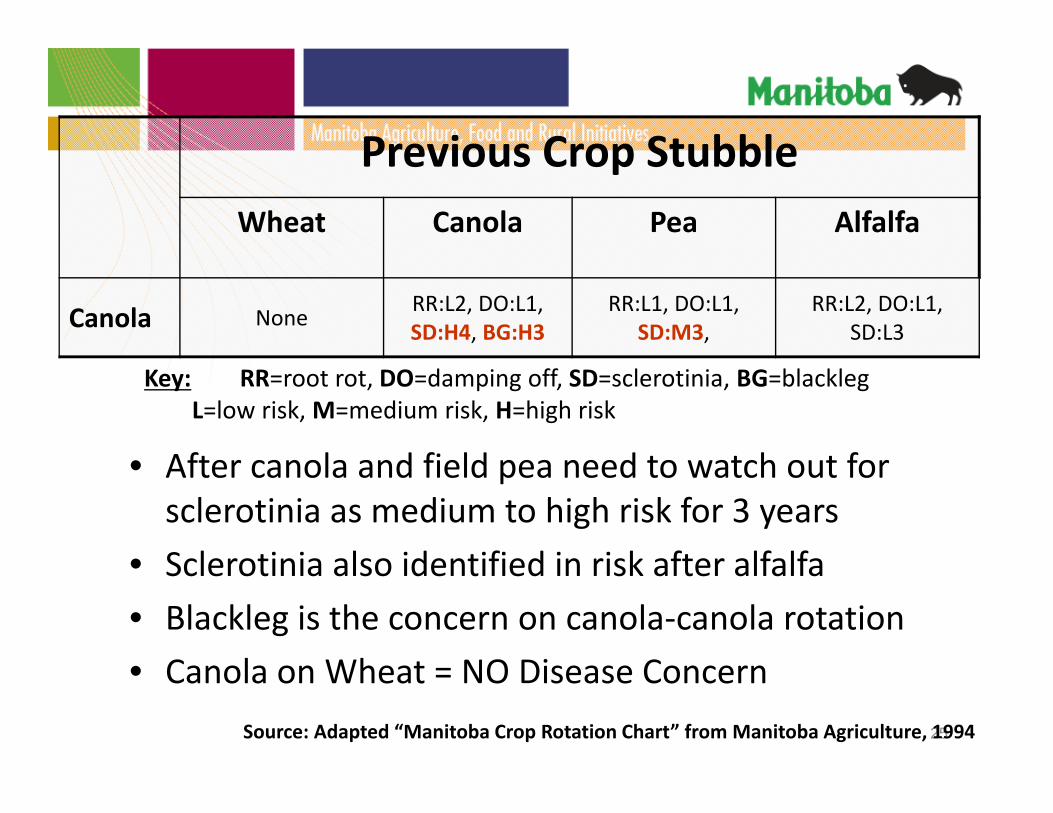
Previous Crop StubbleWheat Canola Pea Alfalfa
Canola None RR:L2, DO:L1, SD:H4, BG:H3
RR:L1, DO:L1, SD:M3,
RR:L2, DO:L1, SD:L3
25
• After canola and field pea need to watch out for sclerotinia as medium to high risk for 3 years
• Sclerotinia also identified in risk after alfalfa• Blackleg is the concern on canola‐canola rotation• Canola on Wheat = NO Disease Concern
Source: Adapted “Manitoba Crop Rotation Chart” from Manitoba Agriculture, 1994
Key: RR=root rot, DO=damping off, SD=sclerotinia, BG=blackleg L=low risk, M=medium risk, H=high risk
Soil Residual Herbicides and Cropping• Precipitation, soil type, pH, organic matter, soil temperatures and when product applied – all matter to the degradation of herbicides – what can be planted the following year
• If using residual product in the year, need to be conservative when planning for next year crop– See Guide to Crop Protection ‘Re‐cropping Restrictions for Residual Herbicides’
Soil Issues Driving Crop Rotation
• Short vs. Long Season Crops = water use over time• Crop rooting depth variation
– Overall water‐use, not just dry to certain depth– Deep rooted ‐ also reducing salinity build‐up and accessing deep nitrates
• Residues– Subsequent low residue crops = soil erosion– High residue = spring establishment issues next year
Sequences to Consider (or Not)• Good After Soybean
– Oats or flax: year after HT soybeans may have less weeds, not too many disease concerns, limited herbicide residues concerns
• Caution Crops After Canola– Flax and corn: need mycorrhizae for P uptake and after canola, the populations are reduced
– Sunflower: need at least a 3 year break to reduce potential for sclerots in soil for basal rot and potential for later mid‐stalk and head rots
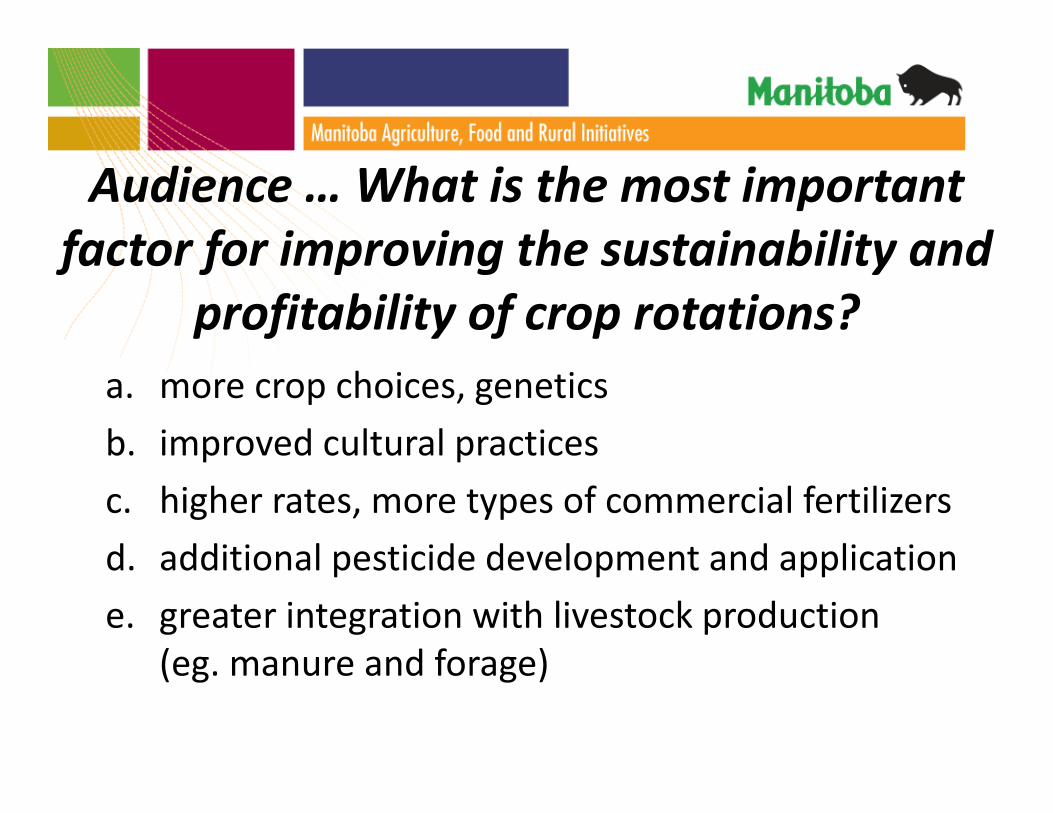
Audience … What is the most important factor for improving the sustainability and
profitability of crop rotations?a. more crop choices, geneticsb. improved cultural practicesc. higher rates, more types of commercial fertilizersd. additional pesticide development and applicatione. greater integration with livestock production
(eg. manure and forage)
Acknowledgements:Crop Research Organization of Portage (CROPS)Pam deRocquigny – MAFRI Cereal SpecialistHolly Derksen – MAFRI Field Crop Pathologist John Heard – MAFRI Crop Nutrition Specialist
Dennis Lange – MAFRI Pulse FPA, AltonaGrant Palmer – MAFRI Policy Economist
Recommended