WhatChinawants
AnalysisofChina'sfooddemandto2050PatrickHamshere,YuSheng,BrianMoir,FarazSyedandCarolineGunning‐Trant
Research by the Australian Bureau of Agricultural
and Resource Economics and Sciences
Conferencepaper14.3March 2014
Paper presented at the 44th ABARES Outlook conference 4–5 March 2014, Canberra, ACT

WhatChinawants ABARES
i
©CommonwealthofAustraliaOwnershipofintellectualpropertyrightsUnlessotherwisenoted,copyright(andanyotherintellectualpropertyrights,ifany)inthispublicationisownedbytheCommonwealthofAustralia(referredtoastheCommonwealth).CreativeCommonslicenceAllmaterialinthispublicationislicensedunderaCreativeCommonsAttribution3.0AustraliaLicence,saveforcontentsuppliedbythirdparties,logosandtheCommonwealthCoatofArms.
CreativeCommonsAttribution3.0AustraliaLicenceisastandardformlicenceagreementthatallowsyoutocopy,distribute,transmitandadaptthispublicationprovidedyouattributethework.Asummaryofthelicencetermsisavailablefromcreativecommons.org/licenses/by/3.0/au/deed.en.Thefulllicencetermsareavailablefromcreativecommons.org/licenses/by/3.0/au/legalcode.Thispublication(andanymaterialsourcedfromit)shouldbeattributedas:Hamshere,P,Sheng,Y,Moir,B,Syed,F&Gunning‐Trant,C2014,WhatChinawants:AnalysisofChina'sfooddemandto2050,ABARESconferencepaper14.3,Canberra,March.CCBY3.0.Coverphoto:AmyGuihotCataloguingdataHamshere,P,Sheng,Y,Moir,B,Syed,F&Gunning‐Trant,C2014,WhatChinawants:AnalysisofChina'sfooddemandto2050,ABARESconferencepaper14.3,Canberra,March.ISSN:1447‐3666ABARESproject:43433InternetWhatChinawantsisavailableat:daff.gov.au/abares/publications.DepartmentofAgricultureAustralianBureauofAgriculturalandResourceEconomicsandSciences(ABARES)PostaladdressGPOBox1563CanberraACT2601Switchboard+61262722010|[email protected]/abaresInquiriesregardingthelicenceandanyuseofthisdocumentshouldbesentto:copyright@daff.gov.au.TheAustralianGovernmentactingthroughtheDepartmentofAgriculturehasexercisedduecareandskillinthepreparationandcompilationoftheinformationanddatainthispublication.Notwithstanding,theDepartmentofAgriculture,itsemployeesandadvisersdisclaimallliability,includingliabilityfornegligence,foranyloss,damage,injury,expenseorcostincurredbyanypersonasaresultofaccessing,usingorrelyinguponanyoftheinformationordatainthispublicationtothemaximumextentpermittedbylaw.AcknowledgementsTheauthorsthankJammiePenmforhisinsightsduringtheprojectandforcommentsonthedraft.

WhatChinawants ABARES
ii
Contents
1 Summary....................................................................................................................................................1
2 Introduction..............................................................................................................................................3
3 Driversoffooddemand.......................................................................................................................4
Population.................................................................................................................................................4 Urbanisation.............................................................................................................................................5 Incomegrowth........................................................................................................................................6 Consumptiontrends..............................................................................................................................8
4 ProductionconstraintsinChineseagriculture.......................................................................10
Ahistoricalperspective....................................................................................................................10 Productivitygrowth...........................................................................................................................10 Inputuse..................................................................................................................................................11
5 Referencescenario.............................................................................................................................14
Consumption.........................................................................................................................................15 Production..............................................................................................................................................20 Imports....................................................................................................................................................21
6 Impactsoftheremovalofdomesticsupport...........................................................................24
Results......................................................................................................................................................24 7 Conclusion..............................................................................................................................................27
AppendixA:Sensitivityanalysis..............................................................................................................28
Populationassumptions...................................................................................................................28 Incomeassumptions..........................................................................................................................29
References..........................................................................................................................................................30
Figures
Figure1Chinapopulation,actualandprojected.................................................................................4
Figure2China,totalpopulation,male+female,distributionbyage..........................................5
Figure3China'surbanandruralpopulations......................................................................................6
Figure4Perpersonincomebyincomegroup......................................................................................7
Figure5Annualaverageincomegrowthrates.....................................................................................7
Figure6China–calorieconsumptionbysource.................................................................................8
Figure7Agriculturalmachinery,China................................................................................................12
Figure8FertiliseruseinChina.................................................................................................................12
Figure9Totalagrifoodconsumptionto2050,China.....................................................................15
Figure10Consumptionofselectedagriculturalcommodities,China.....................................16
Figure11Urbanconsumptionofselectedagriculturalcommodities,China.......................17
Figure12Urbanmediumandhighincomeconsumptionofselectedagriculturalcommodities,China............................................................................................................................17

WhatChinawants ABARES
iii
Figure13Ruralconsumptionofselectedagriculturalcommodities,China.........................18
Figure14Urbanperpersonconsumptionofselectedagriculturalcommodities,China20
Figure15Productionofselectedagriculturalcommodities,China..........................................21
Figure16Importsofselectedagriculturalcommodities,China................................................22
Figure17Removalofdomesticsupportscenario–totalagrifoodproductionin2050,China.........................................................................................................................................................25
Figure18Removalofdomesticsupportscenario–totalagrifoodconsumptionin2050,China.........................................................................................................................................................25
Figure19Removalofdomesticsupportscenario–totalagrifoodimportsin2050,China.....................................................................................................................................................................26
Figure20Removalofdomesticsupport–importsofselectedagriculturalcommoditiesin2050,China.......................................................................................................................................26
FigureA23Populationsensitivity–totalagrifoodconsumptionin2050,China...............28
FigureA24Populationsensitivity–totalagrifoodimportsin2050,China..........................29
FigureA25Incomegrowthsensitivity–totalagrifoodconsumptionin2050,China......29
Tables
Table1AverageproductivitygrowthratesbycommoditygroupinChina,from2009to2050..........................................................................................................................................................11

WhatChinawants ABARES
1
1 Summary China’seconomicgrowthandprocessofurbanisationarebringingaboutprofoundchangestoChina’sagrifoodsector.Withdemandforagrifoodproductsprojectedtodoublebetween2009and2050,China'sagriculturalsectorispoisedtocontendwiththechallengesofdepletingnaturalresourceandrisinginputcoststomaintainorimproveproductivitygrowthofmostmajoragriculturalcommodities.
WiththepopulationofChinaexpectedtoincreasetoabout1.38billionin2050,thenatureoffooddemandwilldependonanumberoffactors,includingincomegrowthandurbanisation.Toinvestigatethesedevelopingtrends,thisstudyconsidersdemandacrossthreedifferentincomegroups:urbanhighincome,urbanmediumincomeandruralhouseholds.AnupdatedversionoftheABARESagrifoodmodel(Linehanetal.2012a)wasusedfortheanalysis.Thismodelisaneconomicsimulationmodelofglobalagriculturalproduction,consumptionandtrade.Inthisreport,agrifoodproductsincludeprimaryagriculturalproductsandlightlytransformedagriculturalproducts,suchasflourandmeat,butexcludehighlyprocessedfooditems.
WhileitisprojectedthatthemajorityofChina'sfuturefooddemandwillbemetbyanincreaseindomesticproduction,therearesignificantchallengeswithwhichtheChineseagrifoodsectorwillneedtocontendtomaintainorincreaseproductivitygrowth.Investmentintheindustryisongoingandrequiredtoensurethedegradationandavailabilityoflandandwaterresources,andrisingcostsforintermediateinputs,donotimpedeproductiongrowth.
TheriseintherealvalueoffoodconsumptioninChinawillbecharacterisedbyamovetowardmorewesternstylediets,withhigherintakeofhigh‐valuefoods,suchasdairyproducts,beef,sheepandgoatmeat,fruitandvegetables,andlowerintakeofstarchystaplestoward2050.Specifically,between2009and2050,therealvalueofbeefconsumptioninChinaisprojectedtorise236percent,dairyconsumption74percent,sheepandgoatmeatconsumptionby72percentandsugarconsumptionby330percent(in2009USdollars),albeitallfromarelativelylowbasewhencomparedwithdevelopedcountries.Withtheexceptionofdairyproducts,thisprojectedriseintherealvalueofconsumptionisprincipallyattributedtoanincreaseinthequantitydemandedratherthanasignificantprojectedriseinrealprices.Formeatanddairyproductsinparticular,thetrendismostpronouncedamongurbanhighincomehouseholds,whoseincomegrowthisassumedtobesignificantlygreaterthanthetwootherincomegroups.
Forruralconsumers,growthinhighvaluecommoditiesisalsoprojectedbuttheincreasesaresmaller,onaverage,thanboththehighandmediumincomehouseholdsinurbanareas.Thisisattributabletotheassumeddeclineoftheruralpopulationcombinedwithrelativelylowerincomegrowth.
FortraditionallyimportantstaplegrainsinChina,suchasrice,therealvalueofconsumptionisexpectedtofallacrossallthreehouseholdgroupsgiventheincreasingtrendtomorewesternstyledietsinurbanareas,combinedwiththedecliningsizeoftheruralpopulation.
China'sproductionofagrifoodproductsisprojectedtoincreaseformostcommoditygroupsbuttheincreaseissmallerthanthatofconsumption.Asaresult,aportionofthedemandforbeef,sheepandgoatmeat,oilseedsanddairyproductsisprojectedtobemetbyimports.Forthesecommodities,mostoftheimportgrowthisprojectedtooccurbetween2009and2029,ratherthanbetween2030and2050,becauseofhigherpopulationgrowthexpectedovertheearlierperiod
WhatChinawants ABARES
2
Toinvestigatetheeffectpolicycanhaveonagriculturalprices,thisreportincludesascenariothatassumesthegradualremovalofalldomesticconsumerandproducersupportinChinabetween2030and2050.Inthisscenario,agrifoodproductionandconsumptioncontinuetorisemarkedlyoutto2050becauseofChina'sincomegrowth.However,therespectiveincreasesaremoresubduedthaninthereferencescenariobecausetheremovalofconsumerandproducersupportraisesproductioncostsandconsumerprices,andhencetotaldemandforagrifoodproductsislower.
TheopportunitiesthatChinesedemandgrowthwillprovidetofoodproducersandexportersto2050aresignificant.Tofullyrealisethoseopportunities,itwillbeimportantforAustralianindustriestoutilisetheworkingrelationshipswithdifferentagentsinthefoodsupplychaininChina.Forexample,supermarketsandhypermarkets,whichhaveanincreasingpresenceinurbanfoodretailinginChina,areplayinganimportantroleinmeetingthedemandforhigh‐valueproductsbyurbanconsumers.Withhigherincomes,urbanconsumersarealsoexpectedtoincreasetheirexpenditureonconveniencefoods,fastfoodandrestaurantfood.AustralianindustrieswillneedtoberesponsivetothesechangesiftheyaretosuccessfullycompeteintheChinesemarketoverthelongterm.

WhatChinawants ABARES
3
2 Introduction Worlddemandforagrifoodproductsisexpectedtoincreasesignificantlythroughto2050,withtherealvalueofAsianagrifooddemandexpectedtodouble(Linehanetal.2012b).Theriseintheglobalpopulation,perpersonincomesandratesofurbanisation,especiallyindevelopingcountries,aredrivingthisincrease.NowhereisthismorepronouncedthaninChina,theworld'smostpopulouscountry,whereoverthepasttwodecades,realgrossdomesticproduct(GDP)hasrisenbyanaverageof10percentayearandfoodconsumptionhasalsorisensharply.Overthelongterm,therealvalueoftheprojectedincreaseinfooddemandinChinaaccountsformorethan40percentoftheglobalincrease(Linehanetal.2012b).
GivenChina'sgrowingimportanceinworldagrifoodmarkets,theobjectiveofthisreport,thesecondintheWhatAsiawantsseries,istobuilduponexistingABARESanalysisofglobalfoodconsumptionandproduction(Linehanetal.2012b,2013;ABARES2013)byexaminingthefactorslikelytoinfluencethefuturepatternofChinesefoodconsumption.TheanalysisisdistinctfromthatcarriedoutinWhatAsiawants:Long‐termfoodconsumptiontrendsinAsia(2013)becauseitfocusesonprojectedhouseholdconsumptiontrendsacrossthreedifferentincomestratainChina:urbanhighincome,urbanmediumincomeandruralhouseholds.
Urbanconsumersgenerallyaccountformostofthegrowthinhigh‐valueproductsovertheprojectionperiodbecauseofrisingurbanpopulationsandincomes.Asaresult,perpersonconsumptionofhigh‐valuecommoditiessuchasmeat,eggs,dairyproductsandfruitismuchhigherinurbanareasthaninruralareas,whileconsumptionoffoodgrainsislower.Sinceincomegrowthamonghighincomehouseholdsisalmostthreetimesthatofurbanmiddleincomehouseholds,mostoftheconsumptiongrowthisoccurringinthehighincomegroup.Fortraditionallyimportantstaplegrainssuchasrice,consumptionisexpectedtofallacrossallthreehouseholdtypesashighincomehouseholdsmoveawayfromstaplegrainstomorehighvalueproductsandasthesizeoftheruralpopulationdeclines.
Forthisanalysis,anupdatedversionoftheABARESagrifoodmodel(Linehanetal.2012b)wasdeveloped.Thismodelisaneconomicsimulationmodelofglobalagriculturalsupply,demandandtrade.Theagrifoodproductsincludeprimaryagriculturalproductsandlightlytransformedagriculturalproducts,suchasflourandmeat.Highlyprocessedfooditemsarenotincluded.Themodelhasbeenupdatedtoanewbaseline(from2007to2009).Consumptioninthemodelisapparentconsumption,whichreflectsthetotaluseofagrifoodproducts(food,feedandindustrialuse).Incomegrowthestimatesacrossthethreeincomestrataarealsoincluded,asidentifiedabove.Otherdemandandsupply‐sideassumptionscanbefoundinLinehanandcolleagues(2012b,2013).
Section2ofthisreportexaminesthedemanddriversexpectedtoinfluenceChina'sfooddemandtrendsto2050andpresentssomeoftheincomeandpopulationassumptionsusedintheanalysis.Section3discussestheproductionconstraintsorchallengeswithwhichChinawillhavetocontendoverthelongerterminordertomaintaingrowthinitsagriculturaloutput.Section4providesresultsfromthereferencescenario,whichidentifyprojectedconsumption,productionandtradetrendsto2050.Section5investigatesanalternativesetofconsumption,productionandimporttrendsifalldomesticconsumerandproducersupportisgraduallyeliminatedbetween2030and2050.Section6summarisessomeofthemainfindingsoftheanalysisanddiscussessomeofitsimplicationsforAustralia.
WhatChinawants ABARES
4
3 Drivers of food demand Foodconsumptionatthenationallevelrelatestothesizeofthepopulationandtheamountoffoodconsumedbyeachperson.Changesinthetotalquantityoffoodconsumedperpersonaswellasinthemixoffoodsinthedietarelargelyinfluencedbydevelopmentsinlevelsofaffluenceandfactorssuchaschangesintheagestructureofthepopulationandlifestyle.Forthatreason,urbandwellerstypicallyhavedifferentdietsfromruraldwellers.Thischapterbrieflydiscussesthesefactorswiththeaimofdemonstratingtheireffectonfoodconsumptionovertime.
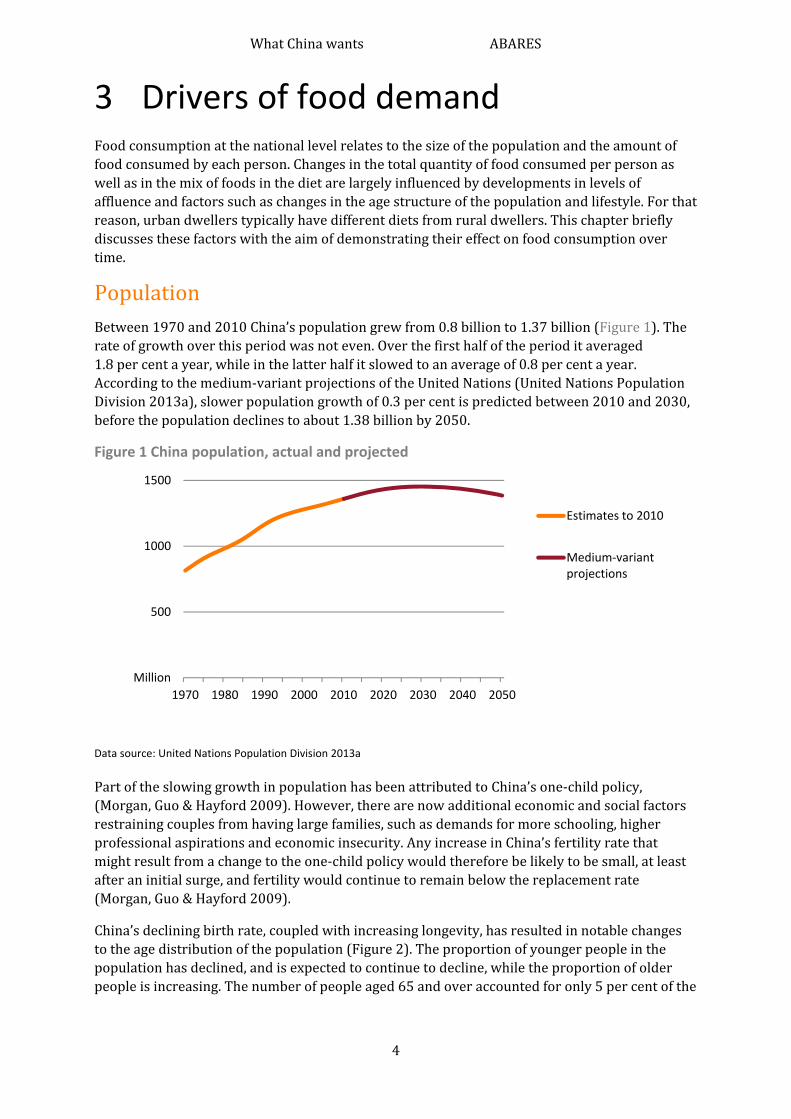
PopulationBetween1970and2010China’spopulationgrewfrom0.8billionto1.37billion(Figure1).Therateofgrowthoverthisperiodwasnoteven.Overthefirsthalfoftheperioditaveraged1.8percentayear,whileinthelatterhalfitslowedtoanaverageof0.8percentayear.Accordingtothemedium‐variantprojectionsoftheUnitedNations(UnitedNationsPopulationDivision2013a),slowerpopulationgrowthof0.3percentispredictedbetween2010and2030,beforethepopulationdeclinestoabout1.38billionby2050.
Figure 1 China population, actual and projected
Data source: United Nations Population Division 2013a
PartoftheslowinggrowthinpopulationhasbeenattributedtoChina’sone‐childpolicy,(Morgan,Guo&Hayford2009).However,therearenowadditionaleconomicandsocialfactorsrestrainingcouplesfromhavinglargefamilies,suchasdemandsformoreschooling,higherprofessionalaspirationsandeconomicinsecurity.AnyincreaseinChina’sfertilityratethatmightresultfromachangetotheone‐childpolicywouldthereforebelikelytobesmall,atleastafteraninitialsurge,andfertilitywouldcontinuetoremainbelowthereplacementrate(Morgan,Guo&Hayford2009).
China’sdecliningbirthrate,coupledwithincreasinglongevity,hasresultedinnotablechangestotheagedistributionofthepopulation(Figure2).Theproportionofyoungerpeopleinthepopulationhasdeclined,andisexpectedtocontinuetodecline,whiletheproportionofolderpeopleisincreasing.Thenumberofpeopleaged65andoveraccountedforonly5percentofthe
Million
500
1000
1500
1970 1980 1990 2000 2010 2020 2030 2040 2050
Estimates to 2010
Medium‐variant projections

WhatChinawants ABARES
5
populationin1990butisexpectedtoreachalmost25percentby2050(UnitedNationsPopulationDivision2013a).
Figure 2 China, total population, male + female, distribution by age
Data source: United Nations Population Division 2013a
Notes: 1970 and 2010: Estimates; 2050: Medium‐variant projections.
Thischangingagestructurehasaneffectonfooddemand.Olderpeoplehavelowernutritionalneedsandlowerfoodexpenditures.However,consumptionofdairyproducts,forexample,ishigherwhentherearechildreninthehousehold.
UrbanisationAnotherdriverofthechangesinfoodconsumptionistheproportionofthepopulationlivinginurbanareasinChina,whichhasincreasedmarkedlyinthepastfewdecades.In1990justover25percentofChina’spopulationlivedinurbanareas;in2011ithadincreasedto50percent;anditisprojectedtoincreasetomorethan75percentby2050(Figure3).Urbandwellershavehigherincomesanddifferentdietaryandshoppingpatternsfromruraldwellers.Perpersonconsumptionofmeats,eggs,dairyproductsandfruitismuchhigherinurbanareasthaninruralareas,whileconsumptionoffoodgrainsislower.
Whilemanyworkersfromruralareasmigratepermanentlytothecities,othersworkinthecitiesforanumberofyearsbeforereturninghome.PermanentmigrationhasbeendiscouragedbytheHukousystem,alsoknownasthehouseregistrysystem,thatrequirespeopletoregisterattheirplaceofresidenceandallowstheprovisionofhealth,educationandsocialwelfareservicesonlyintheplacetheyareregistered(Mullan,Grosjean&Kontoleon2011;Carrillo2004).
Million 50 100 150
0‐4
5‐9
10‐14
15‐19
20‐24
25‐29
30‐34
35‐39
40‐44
45‐49
50‐54
55‐59
60‐64
65‐69
70‐74
75‐79
80+
Age
group
1970
Million 50 100 150
2010
Million 50 100 150
2050

WhatChinawants ABARES
6
Inthisreport,theurbanpopulationisdividedintotwostrataaccordingtoincome.Theyaredefinedasurbanhighincomeandurbanmiddleincome.Theterm"middleincome"isusedtodistinguishitfromruralincomes,whichare,onaverage,lowerthanurban"middleincomes".In2009,urbanhighincomehouseholdswereconsideredtocomprisethetopthirdofurbanperpersonincomesinChina(NationalBureauofStatisticsofChina2013a,b,c).Inthisreport,thisdefinitionisassumedovertheprojectionperiod.
Figure 3 China's urban and rural populations
Data source: United Nations Population Division 2012, National Bureau of Statistics of China 2013c, ABARES model
assumption
IncomegrowthChina’sGDPhasgrownmorestronglythaninmanyothercountries.Therehavebeenonlyafewyearsinthepast3decadesthatgrowthdidnotexceed8percent.Chineseconsumersnowhavemuchhigherrealincomesthantheydid30yearsago.
Urbanincomesare,onaverage,threetimesthoseoftheruralpopulationandthegapbetweenurbanandruralincomeshasbeenincreasing(Figure4).Incomeinequalityisalsohighandincreasingwithineachgroup,anditisassumedtodosoovertheprojectionperiod.Despiteaverageincomeshavingincreasedmarkedlyoverrecentdecades,thereremainsaconsiderableportionofthepopulationlivinginpovertywithlimitedcapacitytobuyfood.
AplantoaddresstheseinequalitieswasreleasedbytheStateCouncilinFebruary2013.(Salidjanova2013).Areductioninincomeinequalitywouldbeexpectedtoleadtoincreasesinthelevelandchangesinthecompositionoffoodconsumption.
%
10
20
30
40
50
60
70
80
90
million
500
1000
1500
1950 1970 1990 2010 2030 2050
Urban high income
Urban middle income
Rural
Proportion of population in urban areas (right axis)

WhatChinawants ABARES
7
Figure 4 Per person income by income group
Note: 2009 incomes by income group were reported originally in yuan and were converted to US dollars according to a
fixed exchange rate of 6.8310 yuan/USD, as provided by the US Federal Reserve (2013). This exchange rate was applied
over the projection period.
Data source: Bureau of Statistics of China 2013a, b; ABARES agrifood model assumption
China'sGDPisexpectedtocontinuetogrowbutatadecliningrate.ItisassumedinthisanalysisthatChina’sGDPgrowthwilldeclineto5.5percentannuallyto2030,thentoanaverageof2.2percentayear.Despitethelowerassumedrateofgrowth,China’sGDPinrealtermswillneverthelessmorethanquadruplebetween2012and2050.Urbanhighincomesareassumedtocontinuetogrowfasterthanbothurbanmiddleandruralincomes,furtherwideningtheabsoluteincomedisparitybetweenthesegroups(Figure5).
Figure 5 Annual average income growth rates
10
20
30
40
50
2009 2020 2030 2040 2050
Urban high income
Urban middle income
Rural
Thousand(2009 US$)
%
5
10
15
2009–2019 2020–2029 2030–2039 2040–2049
Urban high income
Urban middle income
Rural income

WhatChinawants ABARES
8
Data source: ABARES agrifood model assumption
ConsumptiontrendsHigherincomesinChinahaveresultedinanincreaseinfoodconsumptionandinchangedpatternsoffoodconsumption.Between1980and2009,totalfoodconsumptionperperson,measuredincalories,increasedby40percent(Figure6).Totalproteinintakeincreasedby73percent.Thecontributionofcerealstothetotalcalorieintakedeclinedfrom66percentin1980to48percentin2009andconsumptionofpulsesandstarchyroots,particularlysweetpotato,alsodeclined.Consumptionofmeat,whichcontributed5.9percenttoChina'scalorieintakein1980,grewto14percentin2009.Consumptionoffruit,vegetablesandmilkalsoincreasedoverthisperiod(FAO2013a).
Figure 6 China – calorie consumption by source
Data source: FAO 2013a
ThechangingdemographicsanddietsoccurringinChinahaveledtoachangeinthewayfoodismarketed.Modernandefficientfoodmarketingchainswithestablishedqualityandsafetyregimeshavebecomeincreasinglyprevalentinresponsetoconsumers’changingdemands(OECD‐FAO2013).SupermarketsaccountforanincreasingproportionoffoodretailinginChinaandthisisexpectedtocontinueastheurbancentresexpand.
ConsumptionoffoodinrestaurantshasalsoincreasedinChinaasincomeshaverisenandasthepopulationhasbecomemoreurbanised.Expenditureonfoodconsumedoutsidethehomebyurbanconsumersincreasedfrom15percentoftotalfoodexpenditurein2000to22percentin2009(Zhouetal.2012).Consequently,theconsumptionofsomefoods,suchasmeat,hasrisenbecauseitformsalargercomponentofrestaurantmealsthanofmealsconsumedathome.
GrowthinChina'spopulationandincomeswillcontinuetoinfluencefoodconsumptionintheperiodto2050.Despitetheslowingrateofpopulationgrowth,Chinaisexpectedtohave26millionmorepeoplein2050thanin2010,withthemajoritylivinginurbanareas(UnitedNationsPopulationDivision2012).WithGDPgrowthexpectedtoremainstrongbyinternational
Kcal/capita/day
500
1000
1500
2000
2500
3000
3500
%
10
20
30
40
50
60
70
80
1980 1984 1988 1992 1996 2000 2004 2008
Total calorie intake (right axis)
Cereals
Meat
Vegetables+fruit
Starchy roots
Milk

WhatChinawants ABARES
9
standardsovertheprojectionperiod,China'spopulationwillenjoythebenefitsofeconomicdevelopment.Risingincomeswillensurethatdemandwillgrowforawidervarietyoffoodsthaninthepast.Theformofthatdemand,intermsofthecommoditiesthatwillbedemandedandbywhichconsumergroups,isthefocusofthisanalysis.

WhatChinawants ABARES
10
4 Production constraints in Chinese agriculture
China'sagriculturalsectorwillbechallengedtosupplythequantityandvarietyoffoodsbeingdemandedoverthenextfortyyears.WhileitisprojectedthatthemajorityofChina'sfuturefooddemandwillbemetbydomesticproduction(ABARES2013),thiswillnotbeeasy.Therearemanychallengestoimprovingproductivitygrowth,includingincreasinginputcostsanddepletedordeterioratednaturalresourcesusedinagriculturalproduction.Thischapterbrieflyaddressessomeoftheseissues.
AhistoricalperspectiveAgriculturalproductioninChinahasincreasedstronglyoverthepastthreedecades.Between1980and2011productionofvegetablesincreasedby10times,meatby5.5times,andwheatproductiondoubled(FAO2013b).Coarsegrainwasoneofthefewcommoditygroupswhereproductiondeclined.
Theincreaseinproductionhascomefromtheincreaseduseofsomeinputsandadvancesinproductivity,thatis,intheefficiencyofinputuse.Theinputsusedinagriculturalproductionincludelabour,land,capital(suchasmachineryandstructures)andintermediategoodssuchasfertiliser,pesticides,energy,seedandfeed.Wangandcolleagues(2013)estimatethatgrowthinproductivitycontributed2.7percentayeartoagriculturaloutputgrowth,equivalenttojustoverhalfofthetotal5.1percentannualgrowthbetween1985and2007.Theremaining2.4percentoftotalannualgrowthwasattributabletoincreasedinputuse.
Theuseofcapitalinagricultureexpandedby3.5percentandintermediategoodsby6.4percentayearbetween1985and2007.However,theuseoflabourandlandcontractedby0.4percentand0.6percentayear,respectively,throughthisperiod(Wangetal.2013).
Significantimprovementsinyieldscontributedtotheriseinproduction.Forexample,wheatyieldsincreasedfrom1.9to4.8tonnesperhectarebetween1980and2011,maizefrom3.1to5.7tonnesperhectareandsoybeansfrom1.1to1.8tonnesperhectare(FAO2013b).
ProductivitygrowthAgriculturalresearchanddevelopmenthasbeenamajorcontributortoproductivityadvancesandhencetogrowthinagriculturalproductioninChina.However,whileChina’saggregatespendingonagriculturalresearchexceedsthatofanycountryotherthantheUnitedStates,researchspendingrelativetothesizeoftheagriculturaleconomyhasbeenlowcomparedwithothercountries.Agriculturalresearchintensity(agriculturalresearchexpendituresasaproportionofagriculturalgrossdomesticproduct)inChinawas0.38percentin2000,whiletheaveragefordevelopingcountrieswas0.55percentandfordevelopedcountries2.35percent(Chen&Zhang2010).Whiletherehasbeensomeincreaseinprivateresearchexpendituresince2000,publicexpendituredominates.
GiventheongoinginvestmentinChina’sagriculturalsector,theanalysisinthisreportassumesproductivityinChineseagriculturewillcontinuetogrow,permittingChina'sfoodproductiontoincreasedespiteconstraintsontheavailabilityoflandandwater(discussedbelow).Theuseofcapitalandintermediateinputsisalsoassumedtoincrease.

WhatChinawants ABARES
11
TherearetwotypesofproductivityimprovementsintheABARESagrifoodmodel:improvementinlandproductivityandimprovementsintotalfactorproductivity(TFP).Improvementsinlandproductivityreflectareductionintheinputoflandperunitofoutputofcroppingorlivestockproduct.Thisisapartialmeasureofproductivity,wherethemoreeffectiveuseofasinglefactor,land,leadstotechnologicaladvancement.TFPisameasureoftheratiooftotaloutputrelativetototalinputs,ofwhichtherecouldbemany.MoredetailsaboutproductivityassumptionsinABARESagrifoodmodelcanbefoundinLinehanandcolleagues(2013)
TheproductivityprojectionsusedinthisstudyareprovidedinTable1.TFPandlandproductivitygrowthratesareprojectedtobehigherforlivestock‐basedindustriesthanforcropping.
Table 1 Average productivity growth rates by commodity group in China, from 2009 to 2050
Productivitytype
Meat
(%)
Dairyproducts
(%)
Cereals
(%)
Fruitandvegetables
(%)
Otherfood
(%)
Total
(%)
Landproductivity
2.35 2.35 1.12 0.54 0.18 n.a.
Totalfactorproductivity
1.58 1.55 1.06 0.71 1.54 0.97
Note: other food includes sugar, eggs and oilseeds.
Data source: Agricultural Modelling Intercomparison and Improvement Project (AgMIP); ABARES Global Trade and
Environment Model (GTEM); ABARES Agrifood Model
ProductivityprojectionsusedinthisstudyarelowerthanOECD–FAO(2012)2001–2040projections.Forworldagrifoodproductionasawhole,theOECD–FAO(2012)projectstheaverageTFPgrowthtobe1.38percentayearfrom2001to2040.Thiscompareswithanassumptionof1percentayearfrom2009to2050usedinthisstudy.
InputuseFormanydecadesChinahadapoolofexcessrurallabouravailabletoagriculture.However,withindustrialprogressandthemovementofthepopulationtocities,thisexcesslabourhasdiminished.Kwan,Wu&Zhuo(2012)estimatethatbetween1995and2009thelaboursurplusfellfrom119millionto55million,orfrom37percentoftheagriculturalworkforceto22percent.Mai&Peng(2009)forecastthatsurplusrurallabourwillfalltoabout25millionby2015.Asitcontracts,wagescanbeexpectedtorisefurther.Asaresult,increasesinfoodproductioncannolongerbebasedontheutilisationofcheapsurpluslabour.
Asthesupplyoflabourhasdecreased,theuseoffarmmachineryinChineseagriculturehasgrownmarkedly.China'sstockoftractorshasincreasedsteadily,from7.8millionin1990to22.5millionin2011,anincreaseinaggregatecapacityfrom287millionkilowattsto977millionkilowatts(Figure7).Notably,theuseoflargeandmediumtractorshasincreasedatafasterratethansmalltractorssincetheearly2000s,reflectingthemodernisationoftheagriculturalsectoraslandhasbeenconsolidatedintolarger,morecommercialholdingsthaninthepast(ChinaEconomicReview2013).

WhatChinawants ABARES
12
Figure 7 Agricultural machinery, China
Data source: National Bureau of Statistics of China 2013d
China'sagriculturaloutputgrowthcouldnothavebeenachievedwithouttheincreaseduseoffertiliser.Theannualuseofnitrogen,phosphorusandpotassiuminfertiliserincreasedby3.7percent,4.3percentand9.1percent,respectively,between1980and2012(Figure8),makingChinanowoneoftheworld’slargestusersoffertiliser.However,therateofgrowthinfertiliserusemaybereducedinthefutureastheircostsrise,particularlyifsubsidiesweretobereduced.Inaddition,restrictionsonfertiliserproductionandusecouldbemandatedinChinainthelongtermgiventheassociatednegativeenvironmentalimpacts.
GiventheresearchanddevelopmentbeingundertakeninChina’sagriculturesector,thereisconsiderablepotentialforChinatoimprovetheefficiencyoffertiliseruse,therebystabilisingorreducingthequantityoffertiliserrequiredbutstillachievingimprovementsinyields(Juetal.2009).
Figure 8 Fertiliser use in China
Data source: FAO 2013b
million tractors
200
400
600
800
1000
1200
1990 1995 2000 2005 2010
million kilowatts
5
10
15
20Small tractors
Large and medium sized tractors
Total capacity (right axis)
Mt
5
10
15
20
25
30
35
40
45
50
1983 1987 1991 1995 1999 2003 2007 2011
Nitrogen (N)
Phosphate (P2O5)
Potassium (K2O)
WhatChinawants ABARES
13
Likemanyagriculturalproducingcountries,Chinaischallengedbydecliningavailabilityoflandandwaterforproduction.Theconversionoflandfromfarmingtourbanandindustrialpurposeshasresultedinthelossofapproximately8.2millionhectaresofarablelandsince1997.Inthisreport,itisassumedthatlandavailableforcroppingwilldeclineby4.2percentandpastureby5.1percentovertheperiodto2050.
China'sagricultureisheavilydependentonirrigation.Some62millionhectares—55percentofthelandundercultivationinChina—isirrigated.Tosupportirrigatorsandotherwaterusers,Chinahasconstructed86000reservoirsanddrilledmorethanfourmillionwellssincethe1950s(Yu2011).TworecentprojectsaimedatprovidingadditionalwaterresourcesaretheThreeGorgesDamandtheSouth‐NorthWaterDiversion.Thelatterwasconstructedtocarrywaterfromthesouth,whichhasanabundanceofwater,tothedriernorth.
Historicallytheproductivityofwateruseinagriculturehasbeenlowbecauseofextensivewasteinirrigationsystemsandsub‐optimalallocationamongcropsandbetweenregions.However,investmentinthesectorhasledtoconsiderableachievementsinimprovingwaterefficiency.Annualwateruseperirrigatedhectarehasdroppednearly19percent,from7935to6450cubicmetresoverthepastdecade(FAO2011).
Whiletheavailabilityandcostofirrigationwaterislikelytocontinuetobeachallengetoagriculturalproduction,thereisscopeforfurtherefficienciestobefoundinavarietyofways,includingtheuseoftechnologiessuchasdripirrigation,coupledwithpricingpoliciesthatencourageeffectiveallocationofwater(FAO2010a).Continuedimprovementsintheefficiencyofwateruseareexpectedtopermitanincreaseinagriculturalproductionfromexistingwaterresources,andwillallowtheagriculturalsectortobeincreasinglyresilienttothepressuresplacedonitbycompetingdemandsforwater.
ThegradualdeteriorationinthequalityofarablelandandwateralsoposeschallengesforChina’sagriculture.Landdegradationisextensive,anditisestimatedthatpollutedwaterisusedon7.4percentofChina’sirrigatedland(Xie2009).Whilevariouspoliciesandprogramshavebeenimplementedtoaddresstheseproblems,andagriculturalproductionhascontinuedtorise,improvementsinresourceproductivityarenotaccountedforintheABARESagrifoodmodel.
DespitethechallengesChinaisfacingwiththedeterioratedstateofitsresourcebase,foodproductionhasincreasedmarkedlyoverthepastfewdecades,andisexpectedtocontinuetodoso.Asinothercountries,pastincreaseshavebeenbasedonimprovedyieldsthatwererealisedthroughtheeffectiveuseofinputsandimprovedtechnology.Theintroductionofmoreadvancedtechnologies,encouragedbyappropriatepoliciesandsupportedbyongoingresearchanddevelopment,isexpectedtodrivefutureproductivitygains.This,coupledwithongoingcapitalinvestmentinagriculture,shouldensurethatfoodproductioninChinacontinuestoincrease.

WhatChinawants ABARES
14
5 Reference scenario TheobjectiveofthisanalysisistoidentifyandtoquantifyprojectedchangesintheChinesedemandforarangeofagriculturalcommoditiesoverthelongertermacrossurbanandruralhouseholds.AnupdatedversionoftheABARESagrifoodmodel(Linehanetal.2012a)wasdevelopedtoinvestigatethesepotentialtrends.Amongthechangestothemodelwasanupdateofthebaselinedatafrom2007to2009.Otherchangesincludeare‐aggregationofsomecountryandcommoditygroupstoallowformoredetailedanalysis.
TheprojectionsdeterminedinthereferencescenarioforChinaoftheagrifoodmodelaredependentonasetofassumptions,asdiscussedinChapter2.Tosummarise,
populationgrowthwillaverage0.3percentbetween2010and2030,beforethepopulationdeclinestoabout1.38billionby2050
theproportionofthepopulationinurbanareasisassumedtoincreasefrom50percentin2009to75percentby2050
averageGDPgrowthof5.5percentayearisassumedforChinabetween2009and2030,and2.2percentayearfrom2030to2050
agriculturalproductivityinChinawillcontinuetogrowaccordingtotheestimatesprovidedinTable1
landavailableforcroppingwilldeclinebyatotalof4.2percentandpastureby5.1percentovertheperiodto2050.
Thepopulationisdividedintothreeincomestrata,includingurbanhighandmiddleincomehouseholds,andrurallowincomehouseholds.Acrossthesethreehouseholdtypes,theassumptionsonincomegrowthto2050aremadebasedonhistoricalincomedatafromtheNationalBureauofStatisticsofChina(2013a,b).Amongurbanhouseholds,incomegrowthisassumedtocontinueatahigherratethanruralhouseholdsgiventhefasterrateofeconomicdevelopmentinurbanareasandthewagespaidintheseregions.Additionally,withintheurbanconsumergroup,incomegrowthissignificantlyhigherforhighincomehouseholdsthanformediumincomehouseholds(Figure5).Thehighincomeurbanhouseholdsareassumedtocomprisethetopthirdoftheurbanpopulationovertheprojectionperiod.Chinesehouseholdfoodconsumptiondata(NationalBureauofStatisticsofChina2013e,f)havebeenusedasthebasisforaninvestigationofconsumptionacrossurbanandruralhouseholds.
China’sagriculturalsectorisheavilyprotected.Ontheproductionside,theprincipalformofmarketsupportisprovidedthroughtariffs,tariffratequotasandstatetrading.Additionally,Chinaoffersaguaranteedpriceforriceandwheatandhasotheradhocinterventionsonarangeofagriculturalcommodities.Producersalsobenefitfromdirectpaymentsforgrainproducers,agriculturalinputsubsidiesandsubsidiesonagriculturalinsurancepremiums(OECD2013).ThehighlevelofsupportfortheagriculturalsectorinChinahassignificantlyloweredthecostofproductionfacedbyproducersandhas,asaresult,ledtomuchhigheragriculturalproductionthanwouldhaveoccurredwithoutthesupport.Consumershavealsobenefittedfromgovernmentsupportsincethepricepaidforfoodislowerthanwouldotherwisebethecase,andhenceconsumptionishigher.Inthereferencescenario,nochangetoChina'smarketsupportpoliciesisassumed.However,apreliminaryexaminationoftheeffectonagrifoodconsumptionofchangestodomesticconsumerandproducersupportispresentedinsection6.

WhatChinawants ABARES
15
Asinanyforecastingexercise,thereisuncertaintyaroundtheprojectionsinthereferencescenarioforChina’sagrifoodconsumptionandproduction,astheyareconditionalontheassumptionsmade.Anychangestotheassumptionscouldresultinchangestotheprojections.Inordertoimproveunderstandingoftherelationshipsbetweentheassumptionsonincomeandpopulationgrowthusedinthereferencescenario,weconductsensitivityanalysis,resultsforwhicharereportedinAppendixA.
ConsumptionTherealvalueoffoodconsumptioninChinaisprojectedtoincreaseby104percentbetween2009and2050(Figure9).Theincreasereflectsadietaryshiftawayfromstarchystaplestohighvaluedproductsasrealperpersonincomesincrease.
Figure 9 Total agrifood consumption to 2050, China
Data source: ABARES model output
Whileconsumptionofmostcommoditiesisprojectedtorise,thelargestincreasesareforhighvalueproductssuchasbeef,dairy,sheepandgoatmeat,andsugar(Figure10).Consumptiongrowthisprojectedtobehigherbetween2009and2029thanbetween2030and2050becauseofprojectedhigherpopulationandincomegrowthovertheearlierperiod.
0 500 1000 1500 2000
2009
2050
Billion(2009 US$)

WhatChinawants ABARES
16
Figure 10 Consumption of selected agricultural commodities, China
Data source: ABARES model output
Between2009and2050,beefconsumptionisprojectedtorise236percenttoUS$37.4billion(in2009USdollars);dairyisprojectedtorise74percenttoUS$26.1billion;sheepandgoatmeatisprojectedtorise72percenttoUS$7.9billion;andsugarconsumptionisprojectedtorise330percenttoUS$8.2billion.
Forcerealsandstarchystaples(potatoes,yamsandsweetpotatoes),consumptionisprojectedtoeitherincreasemoreslowlythanhighervaluedproductsorevendeclinebetween2009and2050.Wheatconsumptionisprojectedtorise102percenttoUS$79.8billion(in2009USdollars),whileformaizeitisprojectedtorise9percenttoUS$27.0billion.Theseincreaseslargelyreflecttheprojectedincreaseinfeeddemandgiventheexpectedriseinlivestockproduction.Partlyoffsettingthisriseisthelowerconsumptionofriceandpotatoes,whichareprojectedtofall8percentand11percent,respectively,toUS$12.1billionandUS$10.5billion.
UrbanandruralconsumptionHighvaluecommoditiesUrbanconsumersgenerallyaccountformostofthegrowthinhighvaluedproductsovertheprojectionperiodbecauseofrisingurbanpopulationsandincomes.Between2009and2050,urbanbeefconsumptionisprojectedtorise328percenttoUS$36.9billion(in2009USdollars).Fordairy,urbanconsumptionisprojectedtorise88percenttoUS$22.6billion;andsheepandgoatmeatby162percenttoUS$6.8billion(Figure11).
0 50 100 150 200 250 300
Sheep and goat meat
Sugar
Dairy
Beef
Starches
Oilseeds
Cereals
Vegetables
2050
2009
Billion(2009 US$)
72%
74%
236%
52%
3%
866%
‐13%
330%

WhatChinawants ABARES
17
Figure 11 Urban consumption of selected agricultural commodities, China
Data source: ABARES model output
Withintheurbanpopulation,foodconsumptionanditsprojectedchangesto2050arenotthesameacrosshouseholds.AsillustratedinFigure12,consumptionofbeef,dairy,sheepandgoatmeatandsugarisfarmorepronouncedinthehighincomegroupthaninthemiddleincomegroup.Thisreflectsthehigherassumedincomegrowthfortheurbanhigh‐incomegroup.
Figure 12 Urban medium and high income consumption of selected agricultural commodities, China
0 20 40 60 80 100 120 140
Sheep and goat meat
Sugar
Dairy
Beef
Starches
Oilseeds
Cereals
Vegetables
2050
2009
7%
42%
320%
‐9%
328%
88%
Billion(2009 US$)
162%
309%
0 50 100
Sheep and goat meat
Sugar
Dairy
Beef
Starches
Oilseeds
Cereals
Vegetables 6%
45%
268%
72%
126%
Billion(2009 US$)
381%
‐12%
284%
Middle income
0 50 100
Sheep and goat meat
Sugar
Dairy
Beef
Starches
Oilseeds
Cereals
Vegetables
2050
2009
8%
39%
374%
99%
190%
Billion(2009 US$)
266%
‐7%
326%
High income

WhatChinawants ABARES
18
Data source: ABARES model output
Forruralconsumers,growthinhighvaluecommoditiesisalsoprojectedbuttheincreasesaresmaller,onaverage,thanforboththehighandmediumincomeurbanhouseholds.Thisisattributabletotheassumeddeclineoftheruralpopulationcombinedwithrelativelylowerincomegrowth.Thelargestincreaseinthevalueofruralconsumptionbetween2009and2050isforcereals,whichisprojectedtorise97percenttoUS$75.4billion(in2009USdollars).Ofthat,about72percentofmaizeandaround36percentofothercerealsareusedforlivestockfeed.Theriseinconsumptionofsomeproducts,suchasbeefanddairyproducts,islargeinpercentagetermsbutfromaverylowbase(Figure13).
Figure 13 Rural consumption of selected agricultural commodities, China
Data source: ABARES model output
Forallincomegroups,theriseintotalconsumptionofbeef,sheepandgoatmeat,andsugarin2050isprincipallytheresultofanincreaseinthequantitydemandedratherthanasignificantprojectedriseintherealprice.Thisisespeciallypronouncedinurbanhouseholds.Beefconsumptionbyurbanhouseholdsin2050isprojectedtorise234percentfrom2009to10.8milliontonnes,sheepandgoatmeat193percentto4.3milliontonnesandsugar93percentto10.8milliontonnes.Incontrast,ruralbeefconsumptionin2050isprojectedtorise49percentfrom2009to1.4milliontonnes,andsheepandgoatmeat37percentto1.5milliontonnes.
Thechangeintotalvegetableconsumptionin2050isprojectedtobedrivenbyincreaseddemandforhighvaluevegetablesinurbanhouseholdsandis,again,mostpronouncedinhighincomehouseholds.Inquantityterms,totalurbanvegetableconsumptionisprojectedtorise6percentbetween2009and2050to138.4milliontonnes.Forhighincomehouseholds,growthisexpectedtobehigherat7percentwhileformiddleincomehouseholdsitisprojectedtobeslightlylessat5percent.Theprojectedmarginaldeclineinruralvegetableconsumptionisattributableprincipallytotheexpecteddeclineintheruralpopulation.
Growthindairyconsumptionisprojectedinbothurbanandruralhouseholds,althoughthegrowthismoreprominentinurbanhouseholdsbecauseofhigherincomegrowth.Growthin
0 20 40 60 80 100 120
Sheep and goat meat
Sugar
Dairy
Beef
Starches
Oilseed
Cereals
Vegetables
2050
2009
839%
‐3%
97%
‐13%
91%
22%
Billion(2009 US$)
33%
726%

WhatChinawants ABARES
19
urbandairyconsumption,particularlyinhighincomehouseholds,isexpectedtobedrivenbythedemandforhighvaluedproductssuchascheeseandmilk,whilegrowthinruralconsumptionisprojectedtobelargelyformilk.
Whilethepercentageriseindairyconsumptioninrealvaluetermsissignificant(Figure12),itreflectstheprojectedincreaseindairypricestoward2050.Theprojectedriseinthequantityofdairyproductsdemanded—asreportedinmilkequivalents—ismoremodest,withurbanhighincomeconsumersprojectedtoincreaseconsumptionby62percent,mediumincomehouseholdsby40percentandruralhouseholdsby8percent.
Cereals
Thevalueofcerealconsumptionisprojectedtoincreasethemostamongruralhouseholds.Thisispartlybecauseofariseinfeeddemand,giventheprojectedincreaseinlivestockproductiontoward2050.Between2009and2050,ruralconsumptionofwheatandmaizeisprojectedtorise128percentand110percent,respectively,toUS$64.2billionandUS$2.5billion(in2009USdollars).Riceconsumptionisprojectedtofall3percenttoUS$8.3billionastheruralpopulationdeclines.
Amongurbanconsumers,consumptiongrowthisprojectedtoincreasethemostamongurbanmiddleincomehouseholdsbecauseoftheirrelativelylowerincomesandhigherpopulationgrowthratesthanhighincomehouseholds.Between2009and2050,consumptionofwheatbyurbanmiddleincomehouseholdsisprojectedtorise65percenttoUS$6.7billionandmaizeby30percenttoUS$0.2billion(in2009USdollars).Riceconsumptionisprojectedtofallby5percenttoUS$1.5billion.
Forurbanhighincomeconsumers,theconsumptiongrowthoutto2050forthethreecerealgrainsarelowerthantheothertwoincomegroupsasthesehouseholdssubstituteawayfromgrainstomeatandotherhighvalueproducts.Wheatconsumptionisprojectedtorise61percenttoUS$5.8billionandmaizeby27percenttoUS$0.3billion.Riceconsumptionisprojectedtofall8percenttoUS$1.5billion.
DietsonaperpersonbasisAsagreaterproportionofChina'spopulationisexpectedtoliveinurbanareasin2050,moreChineseconsumerswillhavemorewesternstylediets,characterisedbyloweramountsofcerealsandvegetables,andgreateramountsoffruit,meatsanddairyproducts.Thisdietarychangeismostpronouncedforurbanhighincomeconsumersandisexpectedtodrivedemandforhighvalueproducts.
Invalueterms,totalurbanperpersonconsumptionofbeefisprojectedtoriseby195percentbetween2009and2050,dairyby27percent,sheepandgoatmeatby81percentandsugarby175percent.Thiscompareswithadeclineof29percentforvegetablesand7percentforcereals(Figure14).

WhatChinawants ABARES
20
Figure 14 Urban per person consumption of selected agricultural commodities, China
Data source: ABARES model output
Ruraldiets,incontrast,areprojectedbeorientedaroundcerealsandstarchyvegetables,suchaspotatoesandyams.Perpersonconsumptionofcerealsisprojectedtorise357percentbetween2009and2050,whileconsumptionofstarchyvegetablesisprojectedtodouble.Althoughruralperpersonconsumptionofbeef,dairy,sheepandgoatmeatandfruitisexpectedtorisesignificantlyinpercentageterms,itisfromamuchlowerbasethanurbanconsumers.
ProductionChina'sproductionofmostagrifoodcommoditiesisprojectedtoincreasebutatalowerratethanconsumption.Asaresult,foodimportswillbeanincreasinglyimportantcomponentofChina’sfoodsupplytoward2050.
Chinaisprojectedtoproducesignificantlymorelivestockproductsin2050(Figure15).Therealvalueofbeefproduction,forexample,isprojectedtorisebetween2009and2050by171percent,andsheepandgoatmeatby30percent.Dairyproductionisprojectedtoriseby70percent.
0 100 200 300 400 500
Sheep and goat meat
Sugar
Dairy
Beef
Starches
Oilseeds
Cereals
Vegetables
2050
2009
‐7%
162%
‐40%
195%
27%
81%
2009 US$
‐29%
175%

WhatChinawants ABARES
21
Figure 15 Production of selected agricultural commodities, China
Data source: ABARES model output
Theincreaseddemandforfeedwillbeamajorfactordrivingtheprojectedincreaseincerealandoilseedproductionoutto2050.China'sproductionofwheatandmaizeisprojectedtorise58percentand4percent,respectively.Theincreasedproductionofthosetwograinswilloffsettheprojected8percentfallinriceproductionstemmingfromthedeclineindemand.Theproductionofoilseedsandmeal,namelysoybeans,isalsoprojectedtoincreasesignificantlygiventherisingdemandforbothfeedandfoodproducts.
ImportsChina'sconsumptionofrice,wheat,vegetables,pigmeatandpoultrymeathasbeenmetmainlybydomesticproduction,withtradeplayingarelativelyminorrole.Toward2050,thesituationforthesecommoditiesisnotexpectedtochangesignificantly.
Incontrast,asignificantportionofChina'sbeef,sheepandgoatmeat,oilseedsanddairyproductconsumptionisprojectedtobemetbyimports.Forthesecommodities,mostoftheimportgrowthisprojectedtooccurbetween2009and2030becauseofhighpopulationgrowthoverthisperiod.
Chinaisprojectedtoremainanimporterofbeefin2050,withtherealvalueofbeefimportsprojectedtoincreasetoUS$8.3billion(in2009USdollars)(Figure16).Whilethisprojectedincreasemaybelarge,inthefouryearsto2013,annualaverageimportgrowthwas132percentinvalueterms.Underthisprojectedgrowth,theimportshareoftotalChinesebeefconsumptionwouldbeabout22percentin2050,comparedwithjust7percentin2009.
0 50 100 150 200 250 300
Sheep and goat meat
Sugar
Dairy
Beef
Starches
Oilseeds
Cereals
Vegetables
2050
2009
4%
29%
1%
171%
70%
30%
Billion(2009 US$)
198%
308%

WhatChinawants ABARES
22
Figure 16 Imports of selected agricultural commodities, China
Data source: ABARES model output
Chinaisprojectedtoremainanimporterofdairyproductsin2050withtherealvalueofimportsprojectedtoincrease165percenttoUS$2.1billionin2050(in2009USdollars).Onthisbasis,theimportshareoftotalChinesedairyconsumptionwillincreasefromaround3percentin2009to8percentin2050.
TherealvalueofChina’ssheepandgoatmeatimportsisprojectedtoincreasesignificantlybetween2009and2050toUS$2.0billion(in2009USdollars),albeitfromalowbase.TheimportshareoftotalChinesesheepandgoatmeatconsumptionwillincreasefromaround2percentin2009to26percentin2050.Inquantityterms,China'ssheepandgoatmeatimportsareprojectedtorisefrom50000tonnestoabout1.3milliontonnes.
Chinaimportsandexportsawiderangeofvegetables.Givenrisingdomesticfooddemand,therealvalueofChina’svegetableimportsisprojectedtofallby44percentbetween2009and2050toUS$183.0million(in2009USdollars).Forfruit,Chinaisprojectedtoswitchfrombeinganexportertoanimporterby2050.DomesticproductionisprojectedtomeetmostofChina'sfruitdemand,withimportsprojectedtoaccountfor2percentoftotalfruitconsumptionin2050,downfrom4percentin2009.TherealvalueofChina'sfruitimportsin2050isprojectedtobearoundUS$7.2billion(in2009USdollars).
Chinaisprojectedtobeanetimporterofwheatby2050.Wheatimportsareprojectedtoincrease299percenttoUS$951.4million(in2009USdollars).WhiledomesticproductionisprojectedtomeetmostofChina'swheatdemand,importswillaccountforabout1.2percentofChina'stotalwheatconsumptionin2050,doublethatof2009.
AlthoughChinaisprojectedtoremainanimporterofmaizeovertheprojectionperiod,therealvalueofChina’smaizeimportsisprojectedtodeclineby14percentbetween2009and2050toUS$588.5million(in2009USdollars).TheimportshareoftotalChinesemaizeconsumptionwillfallfrom2.7percentin2009to2.2percentin2050,whichisequivalenttoa7percentfallinthequantityofmaizeimportsto2.8milliontonnes.
0 2 4 6 8 10
Sheep and goat meat
Sugar
Dairy
Beef
Starches
Cereals
Vegetables
Fruit
2050
2009
198%
‐44%
50%
985%
165%
1844%
Billion(2009 US$)
‐7%
101%

WhatChinawants ABARES
23
Chinaisprojectedtoremainanimporterofricein2050,withtherealvalueofimportsprojectedtoincreaseby43percenttoUS$431.9million(in2009USdollars).Thiswouldincreasetheimportshareoftotalconsumptionslightly,from2percentto3percent,overtheprojectionperiod.Inquantityterms,riceimportsareprojectedtoincrease59percentto1.7milliontonnesby2050.
WhatChinawants ABARES
24
6 Impacts of the removal of domestic support
InthereferencescenarioitwasassumedthatChina'smarketsupportremainsunchangedovertheprojectionperiod.However,China'sagriculturalandfoodsectorsaredevelopingquickly,becomingnotonlymoremodernbutalsomorereliantoninternationaltrade.Overthenextfortyyearsitislikelythatthedegreeofmarketsupportreceivedbyagriculturalproducers,aswellasthegovernmenttransfersbenefittingconsumers,willbereducedasincomegrowthcontinues.Exactlywhatareasofsupportmightbechangedandwhothosechangeswouldaffectremainsuncertainatthisstage.
Intheagrifoodmodeltherearetwoformsofagriculturalsupportorprotection:producersubsidyequivalents(PSEs),whichactasasubsidyontheproductionofeachcommodity,andconsumersubsidyequivalents(CSEs),whichactasasubsidyontheconsumptionofeachcommodity.Subsidiesservetolowerthecostsfacedbyproducersorconsumers.
Becauseitisimpossibletoknowwhichformsofsupportwillchangeinthefuture,andtowhichdegree,noassumptionsaremadeinthatregardforthisanalysis.Rather,inthisscenario,allformsofproducerandconsumersupportareremovedgraduallyandevenlyfrom2030onwards.Whilenotrealistic,thisheavilystylisedscenarioprovidesanindicationofpossiblefoodproduction,consumptionandtraderesponsesinChina.Theseresponsescould,byconstruction,befarmoresignificantthanwouldbethecaseundermorerealisticandtargetedscenarios.MorerefinedanalysisoneachofthesupportpoliciesandtheirimpactonthedomesticmarketinChinaisanareaforfutureresearch.
ResultsWhendomesticsupportisremovedby2050,productionandconsumptionareprojectedtoincreasebutlessthaninthereferencescenario.Themoresubduedincreaseistheresultofconsumptionandproductionnolongerbeingsubsidised.Asaresult,productionandconsumptionarerespondingmoretomarketsignals.Thereisupwardpressureonbothproductioncostsfacedbyproducersandfoodpricesfacedbyconsumers(assumingotherfactorsremainunchanged).Notably,bothproductionandconsumptiondocontinuetoincreasesignificantlyovertheprojectionperiodbecauseoftheexpectedincreaseindemandarisingfromthelargerpopulationandhigherhouseholdincomes.
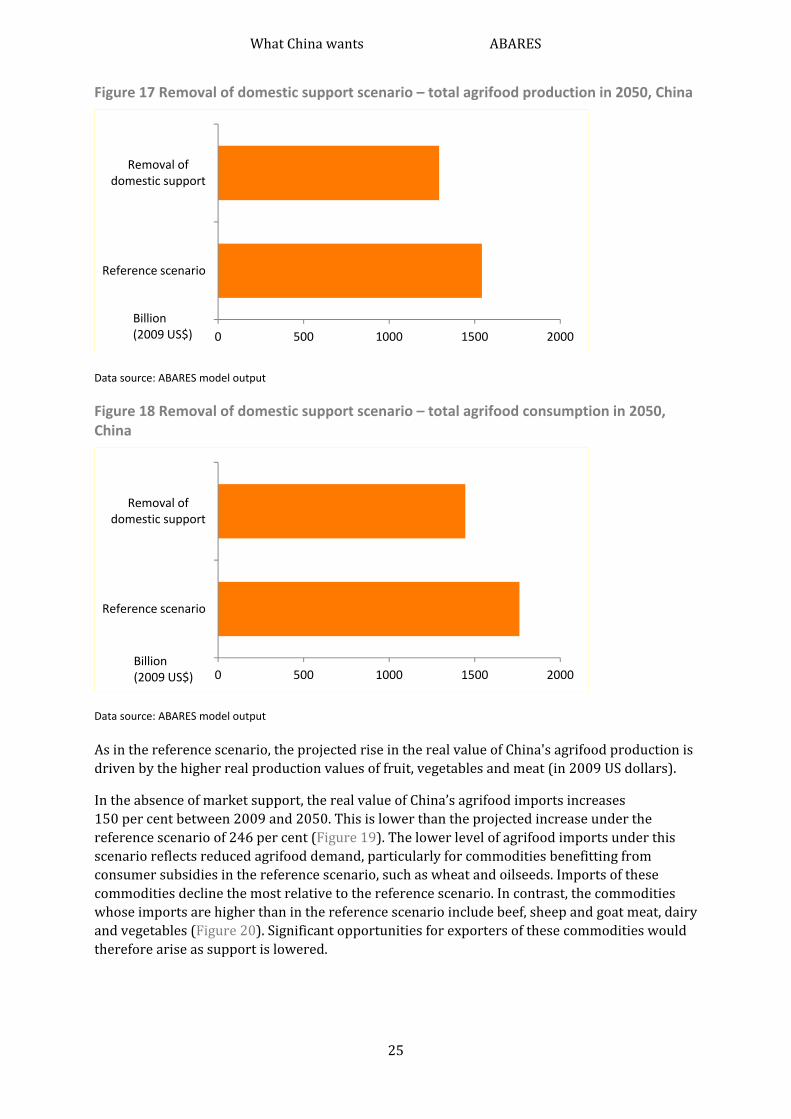
Withtheremovalofdomesticsupport,therealvalueofChina’sagrifoodproduction(in2009USdollars)between2009and2050isprojectedtoincrease75percent,aresultthatislowerthanthereferencescenarioprojectionof109percent(Figure17).Atthesametime,agrifoodconsumptionisprojectedtobe67percenthigherthanin2009,aresultthatis37percentagepointslowerthanthereferencescenario(Figure18).
WhatChinawants ABARES
25
Figure 17 Removal of domestic support scenario – total agrifood production in 2050, China
Data source: ABARES model output
Figure 18 Removal of domestic support scenario – total agrifood consumption in 2050, China
Data source: ABARES model output
Asinthereferencescenario,theprojectedriseintherealvalueofChina'sagrifoodproductionisdrivenbythehigherrealproductionvaluesoffruit,vegetablesandmeat(in2009USdollars).
Intheabsenceofmarketsupport,therealvalueofChina’sagrifoodimportsincreases150percentbetween2009and2050.Thisislowerthantheprojectedincreaseunderthereferencescenarioof246percent(Figure19).Thelowerlevelofagrifoodimportsunderthisscenarioreflectsreducedagrifooddemand,particularlyforcommoditiesbenefittingfromconsumersubsidiesinthereferencescenario,suchaswheatandoilseeds.Importsofthesecommoditiesdeclinethemostrelativetothereferencescenario.Incontrast,thecommoditieswhoseimportsarehigherthaninthereferencescenarioincludebeef,sheepandgoatmeat,dairyandvegetables(Figure20).Significantopportunitiesforexportersofthesecommoditieswouldthereforeariseassupportislowered.
0 500 1000 1500 2000
Reference scenario
Removal of domestic support
Billion(2009 US$)
0 500 1000 1500 2000
Reference scenario
Removal of domestic support
Billion(2009 US$)

WhatChinawants ABARES
26
Figure 19 Removal of domestic support scenario – total agrifood imports in 2050, China
Data source: ABARES model output
Figure 20 Removal of domestic support – imports of selected agricultural commodities in 2050, China
Data source: ABARES model output
0 20 40 60 80 100 120
Reference scenario
Removal of domestic support
Billion(2009 US$)
0 2 4 6 8 10
Sheep and goat
Sugar
Dairy
Beef
Starches
Cereals
Vegetables
Fruit
Reference scenario
Removal of domestic support scenario
Billion(2009 US$)

WhatChinawants ABARES
27
7 Conclusion Undertheassumptionsestablishedinthereferencescenario,therealvalueoffoodconsumptioninChinaisprojectedtomorethandoublebetween2009and2050.Mostofthisincreasewilloriginatefromurbanhighincomehouseholdsgiventheirrapidshifttomorewesternstyledietsanddemandforhighvaluecommoditiessuchasbeef,dairyproductsandsheepandgoatmeat.
Thehighrateofurbanisation,combinedwithslowingpopulationgrowth,willresultintheruralpopulationdecliningbetween2009and2050.Thiswillresultinslowertotalfoodconsumptiongrowththantheurbanpopulations.GiventheprojectedincreaseddemandformeatbyeachincomestrataofChina'spopulation,thesizeofthedomesticlivestocksectorisexpectedtoincreasesignificantlyto2050.Thefeedrequirementswillthereforealsoincrease.Theprojectedriseindomesticgrainproductionisexpectedtobeinadequatetomeettheresultingriseinfeeddemand,causingimportstorise.
Whileimportsofmanyagrifoodcommoditiesareexpectedtoincreaseto2050,China'sownagriculturalproductionisalsoprojectedtoriseinresponsetotheincreaseindemandforfood.Thiswillrequireongoinginvestmentandinnovation.Notonlymustproductivityincrease,butmoremodernapproachestocontendwiththechallengesofadeterioratingresourcebasewillneedtobeadopted.
Whentheassumptionsforthereferencescenariorelatingtoproducerandconsumersupportareremovedgraduallystartingin2030,therealvalueoftotalagrifoodimportsinChinacontinuestoincreasebutbylessthaninthereferencescenario.Thisoccursbecause,assupportisremoved,thecostofproductionrises,totalagrifoodproductionfallsandpricesrise.Consumersdemandlessofthosecommoditieswhichoriginallybenefittedmostfromsubsidies,suchaswheatandoilseeds,andhenceimportsarelower.Incontrast,importsofcommoditiesfromindustriesthatwereoriginallylesssupported,suchasbeef,sheepandgoatmeat,dairyproductsandvegetables,risemorethaninthereferencescenario.Thisscenariohighlightstheeffectpolicycanhaveonagriculturalprices,andthemarketresponsetotheremovalofdistortions.
Thesignificantriseinfoodconsumptionbyhighincome,urbanhouseholdswill,toalargeextent,bemetbysupermarketsandhypermarketsthatareabletomeetthespecificdemandsofthatmarket.SupermarketsandhypermarketshaveanincreasingretailmarketshareinurbanareasinChina.Between2003and2010foodsalesbymodernretailchainsgrewby24percentayear(ABARES2013).Becausemorethanhalfofthetop50globalfoodretailersareactiveinChina,thereisclosecoordinationalongvaluechainsasthesupermarketsdeveloprelationshipswiththeirsuppliers,bothinChinaandabroad.ExportersoffreshfoodtoAsiacouldbenefitfromenteringintorelationshipsdirectlywiththesesupermarketchainsinordertocapturethehighvaluesegmentofthemarket.
WhatChinawants ABARES
28
Appendix A: Sensitivity analysis Inordertoimproveunderstandingoftherelationshipsbetweentheassumptionsusedinthesimulationsandthemodelprojections,sensitivityanalysisaroundthepopulationandincomegrowthassumptionswasapplied.
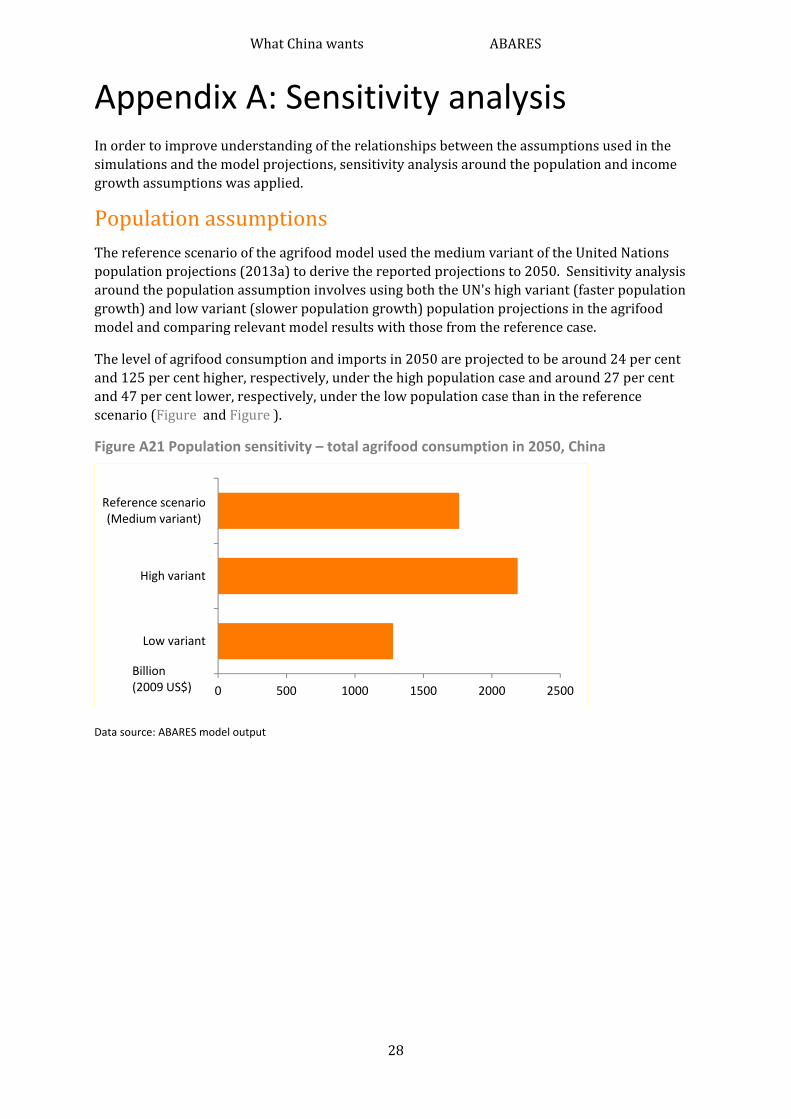
PopulationassumptionsThereferencescenariooftheagrifoodmodelusedthemediumvariantoftheUnitedNationspopulationprojections(2013a)toderivethereportedprojectionsto2050.SensitivityanalysisaroundthepopulationassumptioninvolvesusingboththeUN'shighvariant(fasterpopulationgrowth)andlowvariant(slowerpopulationgrowth)populationprojectionsintheagrifoodmodelandcomparingrelevantmodelresultswiththosefromthereferencecase.
Thelevelofagrifoodconsumptionandimportsin2050areprojectedtobearound24percentand125percenthigher,respectively,underthehighpopulationcaseandaround27percentand47percentlower,respectively,underthelowpopulationcasethaninthereferencescenario(FigureandFigure).
Figure A21 Population sensitivity – total agrifood consumption in 2050, China
Data source: ABARES model output
0 500 1000 1500 2000 2500
Low variant
High variant
Reference scenario (Medium variant)
Billion(2009 US$)

WhatChinawants ABARES
29
Figure A22 Population sensitivity – total agrifood imports in 2050, China
Data source: ABARES model output
IncomeassumptionsSensitivityanalysisaroundtheincomeassumptionsisconductedbyincreasinganddecreasingtheannualgrowthrateofincomeinthereferencescenarioforallhouseholdsby0.5percentagepointsfrom2009onward,whileholdingallothervariablesconstant.Resultsfromtheagrifoodmodelundereachofthesescenariosarethencomparedwiththereferencescenario.
Whenannualincomegrowthis0.5percentagepointshigherthaninthereferencescenario,therealvalueoftotalagrifoodconsumptionin2050(in2009USdollars)isprojectedtobearound41percenthigherthanthereferencescenario.Incontrast,itisaround18percentlowerin2050whenannualincomegrowthis0.5percentagepointsslowerthaninthereferencescenario(Figure).
Figure A23 Income growth sensitivity – total agrifood consumption in 2050, China
Data source: ABARES model output
0 50 100 150 200 250 300
Low variant
High variant
Reference scenario (Medium variant)
Billion(2009 US$)
0 500 1000 1500 2000 2500 3000
Low income growth
High income growth
Reference scenario
Billion(2009 US$)
WhatChinawants ABARES
30
References ABARES2013,WhatAsiawants:Long‐termfoodconsumptiontrendsinAsia,Andrews,NandGunning‐Trant,C(eds.),AustralianBureauofAgriculturalandResourceEconomicsandSciences,Canberra,availableatdaff.gov.au/abares/publications.
Alexandratos,N&Bruinsma,J2012,'Worldagriculturetowards2030/2050:the2012revision',ESAWorkingpaperno.12‐03,June,FoodandAgricultureOrganizationoftheUnitedNations,Rome,availableatfao.org/docrep/016/ap106e/ap106e.pdf(pdf2.85mb).
Carrillo,B2004,‘Rural‐UrbanMigrationinChina:TemporaryMigrantsinSearchofPermanentSettlement’,PortalJournalofMultidisciplinaryInternationalStudies,vol.1,no.4,availableatepress.lib.uts.edu.au/journals/index.php/portal/article/view/58.
Chen,K&Zhang,Y2010,AgriculturalR&Dasanengineofproductivitygrowth:ThecaseofChina,reportpreparedforUKGovernment’sForesightFoodandFarmingFuturesproject,InternationalFoodPolicyResearchInstitute(forthcoming),availableatbis.gov.uk/assets/foresight/docs/food‐and‐farming/regional/11‐591‐r2‐agricultural‐r‐and‐d‐productivity‐growth‐china(pdf4.7mb).
ChinaEconomicReview2013,China’sfactoryfarms:Beijingisdelicatelysuper‐sizingthecountry'sfarms,15July,availableatchinaeconomicreview.com/beijing‐land‐reform‐Brazil‐rural‐farms‐Wuliming‐industrial‐farming.
DierckeInternationalAtlas2013,MainagriculturalregionsinChina,availableatdiercke.com/kartenansicht.xtp?artId=978‐3‐14‐100790‐9&seite=94&id=17554&kartennr=1,accessed20December2013.
FAO2013a,‘FAOSTAT’[foodsupply],FoodandAgricultureOrganizationoftheUnitedNations,Rome,availableatfaostat.fao.org/site/609/default.aspx,accessed13August2013.
——2013b,'FAOSTAT',FoodandAgricultureOrganizationoftheUnitedNations,Rome,availableatfaostat.fao.org/site/339/default.aspx,accessed6September2013.
——2011,Thestateoftheworld’slandandwaterresourcesforfoodandagriculture(SOLAW)—managingsystemsatrisk,FoodandAgricultureOrganizationoftheUnitedNations,RomeandEarthscan,London,availableatfao.org/nr/solaw/the‐book/en/.
——2010a,China,'AQUASTAT',FoodandAgricultureOrganizationoftheUnitedNations,Rome,availableatfao.org/nr/water/aquastat/countries_regions/china/index.stm.
Ju,X,Xing,G,Chen,X,Zhang,S,Zhang,L,Liu,X,Cui,Z,Yin,B,Christie,P,Zhu,Z&Zhang,F2009,'ReducingenvironmentalriskbyimprovingmanagementinintensiveChineseagriculturalsystems',ProceedingsoftheNationalAcademyofSciencesoftheUnitedStatesofAmerica,February,availableatpnas.org/content/early/2009/02/13/0813417106.
Kwan,F,Wu,Y,&Zhuo,S2012,'Re‐examinationofthesurplusagriculturallabourinChina',DiscussionPaper12.25,UniversityofWesternAustraliaDepartmentofEconomics,availableatbusiness.uwa.edu.au/__data/assets/pdf_file/0018/2254005/12‐25‐Re‐examination‐of‐the‐surplus‐agricultural‐labour‐in‐China.pdf(pdf498kb).
WhatChinawants ABARES
31
Linehan,V,Thorpe,S,Gunning‐Trant,C,Heyhoe,E,Harle,K,Hormis,M&Harris‐Adams,K2013,'Globalfoodproductionandpricesto2050:scenarioanalysisunderpolicyassumptions',ABARESconferencepaper13.6,Canberra,5–6March.
Linehan,V,Thorpe,S,Andrews,N&Beaini,F2012a,'Fooddemandto2050:opportunitiesforAustralianagriculture—algebraicdescriptionofagrifoodmodel',technicalannextoABARESOutlookconferencepaper,Canberra,May.
Linehan,V,Thorpe,S,Andrews,N&Beaini,F2012b,'Fooddemandto2050:opportunitiesforAustralianagriculture',ABARESOutlookconferencepaper,Canberra,6–7March.
Mai,Y&Peng,X2009,'EstimatingtheSizeofRuralLabourSurplusinChina–ADynamicGeneralEquilibriumAnalysis',GeneralPaperNo.G‐189,CentreofPolicyStudies,MonashUniversity,June,availableatusitc.gov/research_and_analysis/documents/Mai_Peng_2012.pdf(pdf408kb).
Morgan,S,GuoZ,&Hayford,S2009,'China’sbelow‐replacementfertility:Recenttrendsandfutureprospects',PopulationandDevelopmentReview,vol.35,no.3,pp.605‐629,availablefromncbi.nlm.nih.gov/pmc/articles/PMC2849170/.
Mullan,K,Grosjean,P&Kontoleon,A2011,'LandTenureArrangementsandRural‐UrbanMigrationinChina',WorldDevelopment,vol.39,no.1,availableatrdi.cass.cn/uploadfile/2011711120822.pdf(pdf164kb).
NationalBureauofStatisticsofChina2013a,'Percapitaannualincomeofurbanhouseholdsbysourcesandregion',ChinaStatisticalYearbook2013,andearlierissues,dataaccessed5November2013,availableatstats.gov.cn/english/statisticaldata../AnnualData/.
——2013b,'Percapitanetincomeofruralhouseholdsbysourcesandregion",ChinaStatisticalYearbook2013,andearlierissues,dataaccessed5November2013,availableatstats.gov.cn/english/statisticaldata../AnnualData/.
——2013c'Basicconditionsofurbanhouseholdsbyincomepercentile(2012)'ChinaStatisticalYearbook2013,andearlierissues,dataaccessed5November2013,availableatstats.gov.cn/english/statisticaldata../AnnualData/.
——2013d,'Farmmachineryuse',ChinaStatisticalYearbook2013,andearlierissues,dataaccessed5November2013,availableatstats.gov.cn/english/statisticaldata../AnnualData/.
——2013e,'Percapitaannualpurchasesofmajorcommoditiesofurbanhouseholdsbylevelofincome',ChinaStatisticalYearbook2013,andearlierissues,dataaccessed5November2013,availableatstats.gov.cn/english/statisticaldata../AnnualData/.
——2013f'Percapitaconsumptionofmajorfoodsbyruralhouseholds'ChinaStatisticalYearbook2013,andearlierissues,dataaccessed5November2013,availableatstats.gov.cn/english/statisticaldata../AnnualData/.
——2013,'Percapitaannualcashconsumptionexpenditureofurbanhouseholdsbyregion(2012)'ChinaStatisticalYearbook2013,andearlierissues,dataaccessed5November2013,availableatstats.gov.cn/english/statisticaldata../AnnualData/.
OECD2013,AgriculturalPolicyMonitoringandEvaluation2013:OECDCountriesandEmergingEconomies,OECDPublishing,Paris,availableatoecd‐ilibrary.org/agriculture‐and‐food/agricultural‐policy‐monitoring‐and‐evaluation‐2013_agr_pol‐2013‐en.
WhatChinawants ABARES
32
OECD–FAO2013,OECD–FAOAgriculturaloutlook2013–2022,OECDPublishingandFoodandAgricultureOrganizationoftheUnitedNations,Paris,availableatoecd.org/site/oecd‐faoagriculturaloutlook/.
OECD–FAO2012,OECD–FAOAgriculturaloutlook2013–2021,OECDPublishingandFoodandAgricultureOrganizationoftheUnitedNations,Paris,availableatdx.doi.org/10.1787/agr_outlook‐2012‐en.
Salidjanova,N2013,China’snewincomeinequalityreformplanandimplicationsforrebalancing,US‐ChinaEconomicandSecurityReviewCommissionStaffResearchBackgrounder,March,availableatorigin.www.uscc.gov/sites/default/files/Research/China%20Inequality%20‐%203%2012%2013.pdf(pdf1.21mb).
UnitedNationsPopulationDivision2013a,Worldpopulationprospects,the2012revision,UnitedNations,NewYork,availableathttp://www.un.org/en/development/desa/publications/world‐population‐prospects‐the‐2012‐revision.html,accessed7August2013.
UnitedNationsPopulationDivision2012,Worldurbanisationprospects,the2011revision,UnitedNations,NewYork,availableatesa.un.org/unup,accessed12August2013.
UnitedStatesFederalReserve2013,‘DataDownloadProgram’,availableatfederalreserve.gov/datadownload/default.htm,accessed10November2013.
Wang,S,Tuan,F,Gale,F&Hansen,J2013,'China'sregionalagriculturalproductivitygrowthin1985–2007:Amultilateralcomparison',AgriculturalEconomics,vol.44,no.2,availableatonlinelibrary.wiley.com/doi/10.1111/agec.12008/abstract;jsessionid=7158C530B689AB70B0FD5B062DA4987D.d04t02.
WorldBank2013,'Fertilizerconsumption(kilogramsperhectareofarableland)',availableatdata.worldbank.org/indicator/AG.CON.FERT.ZS,accessed10September.
Xie,J2009,AddressingChina’sWaterScarcity,WorldBank,availableatideas.repec.org/b/wbk/wbpubs/2585.html.
Yu,C2011,'China'swatercrisisneedsmorethanwords',Nature,vol.470,no.307,publishedonline,16February,availableatnature.com/news/2011/110216/full/470307a.html.
Zhou,Z,Tian,W,Wang,J,Liu,H&Cao,L2012,FoodconsumptiontrendsinChina,April2012,reportsubmittedtotheAustralianGovernmentDepartmentofAgriculture,FisheriesandForestry,Canberra,availableatdaff.gov.au/__data/assets/pdf_file/0006/2259123/food‐consumption‐trends‐in‐china‐v2.pdf(pdf2.8mb).
Recommended