Victorian Rock Lobster and Giant Crab Fisheries Status Report - 2013/2014 Fishing Year
A. Linnane, R. McGarvey, L. McLeay, J. Feenstra and D. Reilly
SARDI Publication No. F2012/000434-4SARDI Research Report Series No. 863
SARDI Aquatic SciencesPO Box 120 Henley Beach SA 5024
September 2015
Fishery Status Report to Fisheries Victoria

Linnane et al. 2015 Victorian Rock Lobster and Giant Crab Fisheries Status Report
Victorian Rock Lobster and Giant Crab Fisheries Status Report - 2013/2014 Fishing Year
Fishery Status Report to Fisheries Victoria
A. Linnane, R. McGarvey, L. McLeay, J. Feenstra and D. Reilly
SARDI Publication No. F2012/000434-4SARDI Research Report Series No. 863
September 2015
ii

Linnane et al. 2015 Victorian Rock Lobster and Giant Crab Fisheries Status Report
This publication may be cited as:Linnane, A., McGarvey, R., McLeay, L., Feenstra, J. and Reilly, D. (2015). Victorian Rock Lobster and Giant Crab Fisheries Status Report - 2013/2014 Fishing Year. Fishery Status Report to Fisheries Victoria. South Australian Research and Development Institute (Aquatic Sciences), Adelaide. SARDI Publication No. F2012/000434-4. SARDI Research Report Series No. 863. 41pp.
South Australian Research and Development InstituteSARDI Aquatic Sciences2 Hamra AvenueWest Beach SA 5024
Telephone: (08) 8207 5400Facsimile: (08) 8207 5406http://www.pir.sa.gov.au/research
DISCLAIMERThe authors warrant that they have taken all reasonable care in producing this report. The report has been through the SARDI internal review process, and has been formally approved for release by the Research Chief, Aquatic Sciences. Although all reasonable efforts have been made to ensure quality, SARDI does not warrant that the information in this report is free from errors or omissions. SARDI does not accept any liability for the contents of this report or for any consequences arising from its use or any reliance placed upon it. The SARDI Report Series is an Administrative Report Series which has not been reviewed outside the department and is not considered peer-reviewed literature. Material presented in these Administrative Reports may later be published in formal peer-reviewed scientific literature.
© 2015 SARDIThis work is copyright. Apart from any use as permitted under the Copyright Act 1968 (Cth), no part may be reproduced by any process, electronic or otherwise, without the specific written permission of the copyright owner. Neither may information be stored electronically in any form whatsoever without such permission.
Printed in Adelaide: September 2015
SARDI Publication No. F2012/000434-3SARDI Research Report Series No. 863
Author(s): A. Linnane, R. McGarvey, L. McLeay, J. Feenstra and D. Reilly
Reviewer(s): S. Mayfield and O. Burnell
Approved by: Dr S MayfieldScience Leader – Fisheries
Signed:
Date: September 2015
Distribution: Department of Economic Development, Jobs, Transport and Resources (Victoria), Victorian Rock Lobster and Giant Crab Fishery licence holders, SAASC Library, University of Adelaide Library, Parliamentary Library, State Library and National Library
Circulation: Public Domainiii

Linnane et al. 2015 Victorian Rock Lobster and Giant Crab Fisheries Status Report
TABLE OF CONTENTS
1. Introduction...........................................................................................................31.1. Rock Lobster Fishery....................................................................................................31.2. Giant Crab Fishery........................................................................................................4
2. Methods 63. Western Zone Rock Lobster Fishery (WZRLF)...................................................8
3.1. Fishery statistics............................................................................................................83.1.1. Zonal catch and effort.........................................................................................83.1.2. Zonal catch per unit effort (CPUE)....................................................................103.1.3. Within season trends in CPUE..........................................................................113.1.4. Spatial analyses................................................................................................11
3.2. Settlement and pre-recruit indices..............................................................................143.2.1. Puerulus settlement index.................................................................................143.2.2. Pre-recruit indices.............................................................................................14
3.3. Zonal length-frequency distributions...........................................................................173.4. Length-structured assessment model outputs............................................................19
3.4.1. Model estimated recruitment (to 60 mm carapace length (CL))........................193.4.2. Biological reference points................................................................................20
3.5. Summary.....................................................................................................................22
4. Eastern Zone Rock Lobster Fishery (EZRLF)...................................................244.1. Fishery statistics..........................................................................................................24
4.1.1. Zonal catch and effort.......................................................................................244.1.2. Zonal catch per unit effort (CPUE)....................................................................264.1.3. Within season trends in CPUE..........................................................................274.1.4. Spatial analyses................................................................................................27
4.2. Settlement and pre-recruit indices..............................................................................304.2.1. Puerulus settlement index.................................................................................304.2.2. Pre-recruit indices.............................................................................................30
4.3. Zonal length-frequency distributions...........................................................................314.4. Length-structured assessment model outputs............................................................33
4.4.1. Model estimated recruitment (to 60 mm carapace length; (CL)).......................334.4.2. Biological reference points................................................................................34
4.5. Summary.....................................................................................................................36
5. Giant Crab Fishery..............................................................................................385.1. Fishery statistics..........................................................................................................385.2. Summary.....................................................................................................................40
6. References...........................................................................................................41
iv

Linnane et al. 2015 Victorian Rock Lobster and Giant Crab Fisheries Status Report
LIST OF TABLESTable 3.1 Western Zone catch (t and numbers of lobsters), fishing effort (potlifts), CPUE (kg per potlift)
and mean mass of lobsters (kg). (Fishing Year: November-September; SRL: Southern Rock Lobster; CPUE: Catch per unit effort). (Fishing Year: November-September; SRL: Southern rock lobster; CPUE: Catch per unit effort). Data Source: Fisheries Victoria Catch and Effort Database (December 2014) for period 1978-79 to 2013-14...................................................9
Table 3.2 Western Zone history of TACCs for each quota period from 2001-02 to 2013-14 (TACC: Total Allowable Commercial Catch). *Quota was introduced 1 November 2001 for a shortened quota period. Data Source: Fisheries Victoria FILS..............................................................10
Table 4.1 Eastern Zone catch (t and numbers of lobsters), fishing effort (potlifts), CPUE (kg per potlift) and mean mass of lobsters (kg). (Fishing Year: November-September; SRL: Southern Rock Lobster; CPUE: Catch per unit effort). Data Source: Fisheries Victoria Catch and Effort Database (December 2014) for period 1978-79 to 2013-14.................................................25
Table 4.2 Eastern Zone history of TACCs for each quota period from 2002/03 to 2013/14 (TACC: Total Allowable Commercial Catch). *Quota was introduced 1 November 2001 for a shortened quota period. Data Source: Fisheries Victoria FILS Database.............................................26
Table 5.1 Catch and corresponding TACCs for Giant Crab in each licensing season between 1990/91 and 2013/14................................................................................................................................ 39
LIST OF FIGURESFigure 1.1 Extent and spatial structure of the Victorian Rock..................................................................4Figure 3.1 Total catch (t) and nominal effort (x1000 potlifts) in the WZRLF from 1978/79–2012/13.
Arrow indicates the introduction of a TACC in 2001/02 of 450 t.............................................8Figure 3.2 Nominal and standardised CPUE (kg/potlift) in the WZRLF from 1978/79–2013/14.................10Figure 3.3 Within season trends in nominal CPUE (kg/potlift) for the quota years 2013/14 and 2014/15 in
the WZRLF. Source: Monthly Victorian Rock Lobster catch based on data from the Fisheries Integrated Licensing System and Quota Monitoring Interactive Voice Response (IVR) system.................................................................................................................................. 11
Figure 3.4 Regional catch (t), effort (x1000 potlifts), and nominal and standardised CPUE (kg/potlift) in the WZRLF from 1978 to 2013.............................................................................................13
Figure 3.5 Puerulus settlement index in the Southern Zone (SZ), Northern Zone (NZ) rock lobster fisheries of South Australia and Western Zone (WZ) rock lobster fishery of Victoria from 1998-2013. Note: PSI data for WZ Victoria in 2005 and 2006 are from Port Campbell only, as collectors at Apollo Bay were removed during harbour redevelopment...........................14
Figure 3.6 Number of legal-sized and undersized female (LML = 105 mm CL) and male (LML = 110 mm CL) lobsters per potlift in fixed-site surveys (top graph) and onboard observer program (bottom graph) in the WZRLF. Note: escape gaps open on pots for the onboard observer program and closed for the fixed-site survey...........................................16
Figure 3.7 Comparison of South Australian Southern Zone and Victorian Western Zone pre-recruit indices.................................................................................................................................. 17
Figure 3.8 Length-frequency distributions of male and female lobsters sampled on fixed-site surveys from 2008/09 to 2013/14 in the WZRLF. Blue and red dashed vertical lines represent minimum legal sizes for male and female lobsters, respectively..........................................18
Figure 3.9 Relative abundance of recruitment to 60 mm CL in the WZRLF, as used in the length-frequency model. Long-term historical average (solid black line) also indicated..................19
Figure 3.10 Model estimated level of egg production through time in the WZRLF (above, with 75% probability; blue line). Limit reference point (35% of egg production in 2001/02; red line)....20
Figure 3.11 Model-estimated levels of available biomass in the WZRLF (solid red line). Target reference point is 159% of available biomass in 2001/02 (dashed green line). Projected available biomass (dashed red line) given a TACC of 165 t for the 2015/16 quota year to rebuild available biomass to the biological reference point target by 2020/21. Backward projection of the biomass model (dotted red line).................................................................................21
Figure 3.12 Model estimated available biomass in the WZRLF (black line) from fitting standardised CPUE, compared with measures of nominal CPUE (red line) and nominal CPUE from November to February (inclusive; blue line) from 2006/07 to 2013/14. The most recent two year period for comparison of model and CPUE trends is indicated by the green line.........22
v

Linnane et al. 2015 Victorian Rock Lobster and Giant Crab Fisheries Status Report
Figure 4.1 Total catch (t) and nominal effort (x1000 potlifts) in the EZRLF from 1978/79–2013/14. Arrow indicates the introduction of a TACC in the 2001/02 season of 60 t...........................24
Figure 4.2 Nominal and standardised CPUE (kg/potlift) in the EZRLF from 1978/79–2013/14.............26Figure 4.3 Within season trends in nominal CPUE (kg/potlift) from July to June for the quota years
2013/14 and 2014/15 in the EZRLF. Source: Monthly Victorian Rock Lobster catch based on data from the Fisheries Integrated Licensing and Quota Monitoring Interactive Voice Response (IVR) system.......................................................................................................27
Figure 4.4 Catch (t), effort (x1000 potlifts) and nominal and standardised CPUE (kg/potlift) in the EZRLF from 1978/79 to 2013/14..........................................................................................29
Figure 4.5 Number of undersized female (LML = 105 mm CL) and male (LML = 110 mm CL) lobster per potlift in fixed-site surveys and onboard observer program in the EZRLF......................30
Figure 4.6 Length-frequency distributions of male and female lobsters sampled on fixed-site surveys from 2008/09 to 2013/14 in the EZRLF. Blue and red dashed vertical lines represent minimum legal sizes for male and female lobsters, respectively..........................................32
Figure 4.7 Relative abundance of recruitment to 60 mm CL in the EZRLF, as used in the length-frequency model. Long-term historical average (solid black line) is also indicated...............33
Figure 4.8 Model estimated level of egg production through time in the EZRLF (above, with 75% probability; blue line). Limit reference point is 104% of egg production in 2001/02 (dashed red line)................................................................................................................................ 34
Figure 4.9 Model estimated levels of available biomass in the EZRLF (solid red line). Target reference point is 184% of available biomass in 2001/02 (dashed green line). Projected available biomass (dashed red line) given a TACC of 51 t for the 2015/16 quota year to rebuild available biomass to the biological reference point target by 2020/21. Backward projection of the biomass model is represented by red dotted line.......................................................35
Figure 4.10 Model-estimated available biomass in the EZRLF (black line) using standardised CPUE data compared with 1) measures of nominal CPUE (red line) and 2) nominal CPUE from November to February (inclusive; blue line) from 2006/07 to 2013/14. The most recent two year period for comparison of model and CPUE trends is indicated by the green line.........36
Figure 5.1 Total catch (t) and targeted catch history for the Victorian Giant Crab Fishery. (Black line indicates a TACC introduction in 2001 of 25 t).....................................................................38
Figure 5.2 Catch rate (CPUE (kg/24 hr potlift)) from targeted fishing by fishers with >1 t catch of giant crab and corrected for a maximum of 4 days soak using a slope of 0.38. Dashed red line and solid black line represent limit and trigger reference points, respectively......................40
vi

Linnane et al. 2015 Victorian Rock Lobster and Giant Crab Fisheries Status Report
ACKNOWLEDGEMENTS
Funds for this report and the research underpinning it were provided by the Department of
Economic Development, Jobs, Transport and Resources (DEDJTR) (Victoria). The report was
formally reviewed by Dr. Stephen Mayfield (SARDI Aquatic Sciences), Dr. Owen Burnell (SARDI
Aquatic Sciences), Professor Gavin Begg (Research Chief - SARDI Aquatic Sciences) and
Melissa Schubert (DEDJTR, Victoria). It was formally approved for release by Dr. Stephen
Mayfield (SARDI Aquatic Sciences).
vii

Linnane et al. 2015 Victorian Rock Lobster and Giant Crab Fisheries Status Report
EXECUTIVE SUMMARY
This status report is the fourth South Australian Research and Development Institute (SARDI) assessment for the Victorian Rock Lobster Fishery (RLF) and Giant Crab Fishery (GCF), and was undertaken on behalf of the Department of Economic Development, Jobs, Transport and Resources (DEDJTR) (Victoria).The RLF and GCF are divided into two separately managed zones, the Eastern Zone (EZ) and Western Zone (WZ). Currently, fishing for giant crabs only occurs in the WZ. A Total Allowable Commercial Catch (TACC) and individual transferable quota management system has been in place since 2001.
Western Zone Rock Lobster Fishery (WZRLF)During the 1990s and early 2000s, catches in the WZRLF ranged between 408 and 525 t. In 2001, a TACC of 450 t was set for the 2002/03 fishing season, and remained at this level until 2007/08 when it was reduced to 380 t. By 2009/10, catch had declined to 230 t and the TACC was reduced to 240 t. Over the last six seasons, fishing year catch has remained stable. In 2013/14, the TACC was 260 t and was the fifth consecutive season that the TACC was fully taken.In contrast to catch, effort in the WZRLF between 2001/02 and 2010/11 remained relatively stable at an average of 657,000 potlifts. In the last four seasons, effort has declined, and in 2013/14 was 479,000 potlifts, representing a 26% decrease since 2009/10 (650,000 potlifts).Throughout the 1990s, nominal catch per unit effort (CPUE) ranged between 0.49 and 0.60 kg/potlift for each fishing year. By 2003/04, CPUE had increased to 0.70 kg/potlift before declining to 0.37 kg/potlift in 2009/10, the lowest CPUE in the history of the fishery. Over the past three fishing years, nominal CPUE has increased and in 2013/14 was 0.56 kg/potlift, representing a 51% increase from 2009/10. Patterns of catch, effort and CPUE within each region of the WZRLF (Portland, Warrnambool and Apollo Bay) are similar to those of the whole fishery. Trends in puerulus settlement within Victoria resemble those in South Australia, with peaks in the puerulus settlement index recorded in 2002, 2005 and 2006. Puerulus settlement has been below the respective long-term averages in both States for the last three seasons. The above average recruitment (to 60 mm CL) in 2007/08 and 2008/09 is likely to be a product of the strong settlement in 2005 and 2006, and reflected in the increases in commercial catch rates recorded between 2010/11 and 2013/14. These patterns indicate that lobsters in the WZRLF recruit to the fishable biomass after a period of approximately five years following settlement.While CPUE of legal-size lobsters has recently increased, the number of pre-recruits obtained via fixed-site surveys has decreased since 2010/11, indicating reduced settlement levels post-2006. Combined with the low model-estimated recruitment (to 60 mm CL) between 2009/10 and 2012/13, these data indicate that the number of legal-size lobsters entering the fishery may be reduced from 2014/15. The model-estimated level of egg production in 2013/14 was 71% of that in 2001/02 (the reference year) and above the reference limit point of 35%. The level of available biomass was 73% of that in 2001/02 and below the target reference point of 159%. Therefore, while model outputs indicate that biomass is increasing, based on historical recruitment trends, biomass will not rebuild to the target by 2020/21 at the current TACC level of 260 t. Under the existing harvest strategy, the model estimates that a TACC of 165 t would be required for the 2015/16 quota year to maintain biomass rebuilding on the target trajectory based on a 50% probability forward projection.
Eastern Zone Rock Lobster Fishery (EZRLF)Annual catch in the EZRLF declined from 143 t in 1982/83 to 40 t in 2008/09. An initial TACC of 60 t was introduced in 2001 for the 2002/03 quota year, where it remained until 2006/07. Since the implementation of a TACC, catches have ranged between 40 t (2008/09) and 65 t (2010/11). In 2013/14, the TACC increased to 51 t and was the fourth consecutive season that the TACC was fully taken. Between 2002/03 and 2013/14, annual effort has reflected levels of catch and
1

Linnane et al. 2015 Victorian Rock Lobster and Giant Crab Fisheries Status Report
has averaged approximately 126,000 potlifts/yr. In 2013/14, effort was 114,000 potlifts, the fourth lowest measure of effort recorded and representing a decrease of 24% since 2010/11 (150,000 potlifts).Nominal CPUE was at its lowest in 1995/96 at 0.26 kg/potlift. By the time quota was introduced in 2001/02, CPUE had increased to 0.35 kg/pot lift and remained between 0.35 and 0.44 kg/potlift until 2010/11. In 2011/12, CPUE increased to 0.54 kg/potlift and was 0.52 kg/potlift in 2013/14. Patterns of catch, effort and CPUE in each region of the EZRLF (Queenscliff, San Remo and Lakes Entrance) are similar to those for the whole fishery. The EZRLF and WZRLF have broadly similar trends in model-estimated recruitment (to 60 mm CL). Similar to the WZRLF, the stronger levels of puerulus settlement in 2005 and 2006 are likely reflected in the relatively high catch rates recently recorded in the EZRLF between 2010/11 and 2013/14, indicating that lobsters in the EZRLF reach legal-size after a period of approximately five years following settlement.While CPUE of legal-size lobsters has recently increased, the numbers of pre-recruits obtained via fixed-site surveys have decreased since 2011/12, indicating reduced settlement levels post-2006. Combined with the low model-estimated recruitment (to 60 mm CL) between 2009/10 and 2012/13, these data indicate that the number of legal-size lobsters entering the fishery may be reduced from 2014/15.The model estimated level of egg production in 2013/14 was 155% of that in 2001/02 (the reference year) and above the limit reference point of 104% of that in 2001/02. The level of available biomass was 141% of that in 2001/02 and below the target reference point of 184%. Under the existing harvest strategy, the model estimates that a TACC of 51 t would be required for the 2015/16 quota year to maintain biomass rebuilding on the target trajectory based on a 50% probability forward projection.
Giant Crab Fishery (GCF)The GCF currently only operates in the WZ, and the possession of both a RL and GC licence is required to access the fishery. There has been no reported catch of giant crab in the EZ for the past decade and there are no licences in this fishery.Based on data for the licensing year between 1 July and 30 June, the total annual catch (targeted and non-targeted) of giant crab peaked at 170 t in 1993/94. Since then, catches have generally declined to a record low level (8.0 t) in 2001/02.Quota management was introduced in 2001/02 and the TACC was set at 25 t. Total catch averaged around 20 t per year between 2004/05 and 2009/10. Between 2009/10 and 2012/13, catch decreased from 13 t to 8 t with the TACC subsequently reduced to 12 t. In 2013/14, the TACC was 9.5 t and the total catch was 6.5 t, of which 6.4 t was targeted.The primary indicator for the WZ GCF is CPUE (kg/24 hr potlift) based on fishing season data (November to September). Since 2005/06, CPUE has decreased from 1.35 kg/24 hr potlift to 0.53 kg/24 hr potlift in 2013/14. The 2013/14 estimate represents one of the lowest catch rates on record but remains marginally above the Limit Reference Point of 0.52 kg/24 hr potlift. In 2014/15, the TACC was 10.5 t. Based on the 2013/14 CPUE estimate, the current harvest strategy recommends retaining the TACC at 10.5 t for the 2015/16 season.
2

Linnane et al. 2015 Victorian Rock Lobster and Giant Crab Fisheries Status Report
1. INTRODUCTIONThis is the fourth fishery status report undertaken as part of the South Australian Research and
Development Institute (SARDI), Aquatic Sciences assessment program for the Victorian Rock
Lobster Fishery (RLF; Western Zone and Eastern Zone; hereafter the WZRLF and EZRLF,
respectively) and Giant Crab Fishery (GCF). This report complements the three Victorian Rock
Lobster and Giant Crab fisheies stock status reports published in 2012, 2013 and 2014 (Linnane
et al. 2012; 2013; 2014). The aim of the report is to assess the current status of the Victorian
rock lobster and giant crab resources. These assessments include data to the end of the
2013/14 fishing year (i.e. 14 September 2014), as well as monthly catch rate data to May 2015
based on data collected via Fisheries Integrated Licensing and Quota Monitoring Interactive
Voice Response (IVR) systems. The report is divided into five sections, including this
introduction which (1) outlines the structure of the report; and (2) provides a brief description of
the extent and structure of both the RLF and GCF.
Section 2 provides an overview of the methods used in the report. Sections 3 and 4 summarise
the information available for the WZRLF and EZRLF, respectively, and provide assessments of
their current status in relation to the performance indicators, biological reference points, triggers,
and rebuild rates. The levels of risk associated with uncertainty in the assessments are also
described as listed under Objective 1, Strategy 1 – 'Rebuild the stock biomass', in the Victorian
Rock Lobster Fishery Management Plan (VicDPI 2009) and modified following review by the
Rock Lobster Resource Assessment Group (RLRAG). Where appropriate, this includes spatial
and temporal analyses of data relating to catch, effort and catch per unit effort (CPUE), indices
of recruitment and pre-recruitment, length-frequency distributions of all rock lobsters measured
from fixed-site surveys, and outputs from the Southern Rock Lobster (SRL) stock assessment
model, including trajectories of estimated egg production and available biomass.
Section 5 presents information available for the GCF and assesses its current status in relation
to the performance indicators described under Objective 1, Strategy 1 – 'Rebuild the stock
biomass', in the Victorian Giant Crab Fishery Management Plan (VicDPI 2010). The information
presented includes targeted and non-targeted catch, and targeted CPUE.
1.1. Rock Lobster Fishery
The Victorian RLF is divided into two separately managed zones, the Western and Eastern
Zones (Figure 1.1). The WZRLF extends east from the Victorian border with South Australia to
Apollo Bay and incorporates the three separate regions of Portland, Warrnambool and Apollo
Bay. The EZRLF extends east from Apollo Bay to the Victorian border with New South Wales
and incorporates the three regions, Queenscliff, San Remo and Lakes Entrance. In November
2001, the RLF became quota managed with the principal management controls including an
annual Total Allowable Commercial Catch (TACC) divided into individual transferable quota
3

Linnane et al. 2015 Victorian Rock Lobster and Giant Crab Fisheries Status Report
units, and restrictions on the number of licences and pots allocated within a zone. For both
zones, there exists a difference between the allocated quota year (prior to 2009 it was
1 April - 31 March; from 2009 it is 1 July - 30 June) and the fishing year or season
(16 November - 14 September).
Figure 1.1 Extent and spatial structure of the Victorian RockLobster Fishery.
The number of licences and vessels operating in the WZRLF has decreased over the last
decade, in part due to the structural adjustment program undertaken during 2008/09 (VicDPI
2009). In the quota year 2013/14, there were 48 active licences and 48 vessels operating in the
WZRLF, with a TACC set at 260 t. In the same quota year in the EZRLF, there were 27 active
licences and 27 vessels, with a TACC set at 51 t.
The RLF Management Plan describes the policy and management arrangements for the fishery.
The objectives and strategies of the RLF Management Plan are assessed against a series of
performance indicators and associated limit and target reference points. Performance indicators
are used within a management decision framework and hierarchical decision tree to establish
the TACC (VicDPI 2009).
1.2. Giant Crab Fishery
The GCF is closely linked to the RLF and defined to operate within the same two zones, i.e. the
Western and Eastern Zones (Figure 1.1). However, the commercial fishery is only active in the
4

Linnane et al. 2015 Victorian Rock Lobster and Giant Crab Fisheries Status Report
Western Zone, with little effort reported from the Eastern Zone (VicDPI 2010). Commercial
access to the resource is through the issue of a GCF licence to Western Zone fishers. In the
Eastern Zone, access is provided by a general permit, and the fishery is managed as a
developing fishery (VicDPI 2010). In November 2001, the GCF became quota managed and a
logbook, separate to that of the RLF, was initiated. Prior to 2001, the catch of giant crab was
reported as by-catch in the RLF and targeted effort on giant crab was defined using decision
rules relating to the depth of pot-sets and where giant crab comprised >70% of the total catch.
To further improve measures of fishery performance, subsequent reporting criteria have been
implemented to assess catch and effort data from those licences landing >1 t per year only.
The GCF fishing year extends from 16 November to 14 September the following year. Thirty
licences were initially issued for the fishery, but by 2013/14 that number had declined to 20. In
2013/14, only five licence holders reported catch of giant crab and, with the exception of fishing
years 2007/08 and 2009/09, fewer than five licences have landed >1 t of giant crabs in a fishing
year since 2001/02 (Walker et al. 2012a). In 2013/14, the TACC was 9.5 t.
The GCF Management Plan (VicDPI 2010) details the policy and management arrangements for
the fishery. The objectives and strategies of the management plan are assessed against a series
of performance indicators with associated limit and target reference points to inform the
establishment of the TACC for giant crab (VicDPI 2010).
5

Linnane et al. 2015 Victorian Rock Lobster and Giant Crab Fisheries Status Report
2. METHODSFishery statistics for the WZRLF and EZRLF are provided at two spatial scales: (1) the whole
zone; and (2) regions within each zone. Fishery data for the GCF are presented at the scale of
the area defined for the commercial fishery (i.e. that area describing the Western Zone of the
RLF).
For the RLF and GCF, fishery-dependent data including catch (t), effort (x1000 potlifts) and
nominal catch per unit effort (CPUE; kg/potlift) are derived from all available logbook data
managed by the Department of Economic Development, Jobs, Transport and Resources
(DEJTR, formerly Department of Primary Industries).
For the RLF, data are filtered by fisher, requiring fishers to have been in the fishery 200 days
and more than two separate fishing years. CPUE is then standardised for the main effects of
fishing-year, fishing-month, region, depth category, fisher and vessel using the statistical model
detailed in Walker et al. (2012b) and is used as an input into the stock assessment model. Data
relating to carapace length-frequency and CPUE (number per potlift) of both pre-recruit
(undersized) and legal-sized male and female lobsters are collected from rock lobster sampled
in fixed site (pots with escape gap closed) and on-board observer programs (escape gaps open)
since 2001 and 2004, respectively. Data relating to carapace length (CL) frequency are also
collected from commercial processors. These data sets are used for the model-based
assessment of the WZRLF and EZRLF.
Puerulus monitoring is undertaken at sites located at Port Campbell and Apollo Bay (Figure 1.1).
Data from these sites is combined for this report. The puerulus settlement index (PSI) is used as
a fishery-independent measure of the future recruitment of rock lobster to the fishable biomass.
The annual PSI is calculated as the mean monthly settlement of puerulus sampled from the
collectors. Trends in both pre-recruit and puerulus settlement indices recorded for Victoria were
compared with those recorded within the Southern Zone Rock Lobster Fishery (SZRLF) of South
Australia.
The 'Rock Lobster Fishery assessment model' is a length-structured model (LenMod) that was
used to provide outputs for assessment against fishery reference points (target and limit) and
performance indicators (PIs) (Section 3.4 and Section 4.4) using levels of risk associated with
uncertainty described as listed in the RLF Management Plan, and as modified following review
by the Rock Lobster Resource Assessment Group (RLRAG). To summarise, LenMod is a
population dynamics model that fits to catch in weight and CPUE. In addition, it also incorporates
length-frequency data from catch sampling, where the lobster population is broken down into
different size categories. André Punt (Washington University) first developed the basic model
structure in the 1990s (Punt and Kennedy 1997). Variants of this length-based lobster model are
now used for management and quota setting in most J. edwardsii fisheries, notably in New
6

Linnane et al. 2015 Victorian Rock Lobster and Giant Crab Fisheries Status Report
Zealand, Victoria and Tasmania. Details of the length structured model, with simulation testing of
its performance, have been described in Hobday and Punt (2001) and Punt (2003).
For the GCF, estimates of CPUE (kg/24 hr potlift) were calculated from data collected for the
fishing season (November to September), and using only data effort targeted towards giant crab
(i.e. fishers with >1 t catch/yr; two fishers in 2013/14). Estimates of CPUE were standardised to
account for pot soak time using a maximum of four days soak time per pot.
7

Linnane et al. 2015 Victorian Rock Lobster and Giant Crab Fisheries Status Report
3. WESTERN ZONE ROCK LOBSTER FISHERY (WZRLF)
3.1. Fishery statistics
3.1.1. Zonal catch and effort
With the exception of the 2003/04 fishing year, catch in the WZRLF decreased by 55% between
2000/01 (525 t) and 2008/09 (235 t; Figure 3.2; Table 3.1). With the implementation of quota
management in 2001, an initial TACC of 450 t was set for the 2002/03 season, but was reduced
to 380 t in 2007/08 (Table 3.2). By 2009/10, catch had declined to 230 t, with a reduced TACC
of 240 t. Over the last six seasons, fishing year catch has remained stable. In 2013/14, the
TACC was 260 t and was the fifth consecutive season that the TACC was fully taken.
Total effort did not decrease at the same rate as catch, averaging approximately 657,000 potlifts
between 2001/02 and 2010/11. In the last four seasons, effort has declined, and in 2013/14 was
479,000 potlifts, representing a 26% decrease since 2009/10 (650,000 potlifts).
Figure 3.2 Total catch (t) and nominal effort (x1000 potlifts) in the WZRLF from 1978/79–2012/13. Arrow indicates the introduction of a TACC in 2001/02 of 450 t.
8

Linnane et al. 2015 Victorian Rock Lobster and Giant Crab Fisheries Status Report
Table 3.1 Western Zone catch (t and numbers of lobsters), fishing effort (potlifts), CPUE (kg per potlift) and mean mass of lobsters (kg). (Fishing Year: November-September; SRL: Southern Rock Lobster; CPUE: Catch per unit effort). (Fishing Year: November-September; SRL: Southern rock lobster; CPUE: Catch per unit effort). Data Source: Fisheries Victoria Catch and Effort Database (December 2014) for period 1978-79 to 2013-14.
FishingYear
Catch(t)
Catch (number
)(‘000)
Nominal effort(‘000 potlifts)
Nominal CPUE(kg per potlifts)
Standardised CPUE
(kg per potlifts)
Mean mass of SRL(kg)
1951-52 102 42 2.411952-53 132 54 2.431953-54 177 69 2.561954-55 292 115 2.541955-56 177 87 2.031956-57 134 75 1.791957-58 152 93 1.641958-59 147 84 1.751959-60 182 104 1.751960-61 268 138 1.951961-62 396 202 1.961962-63 326 226 1.441963-64 279 201 1.391964-65 233 175 1.331965-66 325 250 1.301966-67 308 288 1.071967-68 372 373 1.001968-69 413 455 0.911969-70 430 495 0.871970-71 441 497 0.891971-72 458 583 0.791972-73 463 638 0.731973-74 429 555 0.771974-75 286 430 0.671975-76 303 406 0.751976-77 339 464 0.731977-78 309 433 0.711978-79 486 485 622 0.78 0.88 1.001979-80 453 444 576 0.79 0.76 1.021980-81 549 548 680 0.81 0.76 1.001981-82 499 499 637 0.78 0.73 1.001982-83 460 455 608 0.76 0.75 1.011983-84 421 414 571 0.74 0.68 1.021984-85 406 394 578 0.70 0.62 1.031985-86 345 346 569 0.61 0.54 1.001986-87 351 353 595 0.59 0.53 0.991987-88 345 349 557 0.62 0.53 0.991988-89 304 322 577 0.53 0.47 0.941989-90 331 355 613 0.54 0.48 0.931990-91 317 337 650 0.49 0.44 0.941991-92 408 439 712 0.57 0.54 0.931992-93 408 433 779 0.52 0.50 0.941993-94 448 456 754 0.59 0.52 0.981994-95 435 444 789 0.55 0.46 0.981995-96 423 442 761 0.56 0.45 0.961996-97 402 414 787 0.51 0.40 0.971997-98 466 492 841 0.55 0.44 0.951998-99 516 568 861 0.60 0.48 0.911999-00 521 592 897 0.58 0.46 0.882000-01 525 598 895 0.59 0.45 0.882001-02 438 510 704 0.62 0.48 0.862002-03 430 495 630 0.68 0.51 0.872003-04 461 515 659 0.70 0.51 0.892004-05 408 451 667 0.61 0.45 0.902005-06 358 405 705 0.51 0.37 0.882006-07 336 392 698 0.48 0.36 0.862007-08 289 338 668 0.43 0.32 0.852008-09 235 268 606 0.39 0.29 0.882009-10 239 277 650 0.37 0.29 0.862010-11 254 307 590 0.43 0.35 0.832011-12 233 279 475 0.49 0.38 0.832012-13 259 296 485 0.53 0.40 0.872013-14 266 296 479 0.56 0.41 0.90
9

Fishing Year (Nov-Sept)
1978/791979/801980/811981/821982/831983/841984/851985/861986/871987/881988/891989/901990/911991/921992/931993/941994/951995/961996/971997/981998/991999/002000/012001/022002/032003/042004/052005/062006/072007/082008/092009/102010/112011/122012/132013/14
CP
UE
(kg/potlift-1
)
0.0
0.2
0.4
0.6
0.8
1.0
NominalStandardised
Linnane et al. 2015 Victorian Rock Lobster and Giant Crab Fisheries Status Report
Table 3.2 Western Zone history of TACCs for each quota period from 2001-02 to 2013-14 (TACC: Total Allowable Commercial Catch). *Quota was introduced 1 November 2001 for a shortened quota period. Data Source: Fisheries Victoria FILS.
TACC set
TACC Caught Number of
months fished
Number of active
licenses
Number of
vesselsQuota year Period (tonne) (t) %
2001/02* 1 Nov - 31 Mar 3202002/03 1 Apr - 31 Mar 450 440 98 12 79 832003/04 1 Apr - 31 Mar 450 436 97 12 80 792004/05 1 Apr - 31 Mar 450 421 94 12 79 862005/06 1 Apr - 31 Mar 450 405 90 12 75 772006/07 1 Apr - 31 Mar 450 329 73 12 71 682007/08 1 Apr - 31 Mar 380 319 84 12 68 642008/09 1 Apr - 31 Mar 320 244 76 12 61 60
2009 1 Apr– 30 Jun 55.2 36 64 3 54 532009/10 1 Jul – 30 Jun 240 230 96 12 54 552010/11 1 Jul – 30 Jun 240 237 99 12 54 552011/12 1 Jul – 30 Jun 240 237 99 12 51 542012/132013/14
1 Jul – 30 Jun1 Jul – 30 Jun
260260
258260
99100
1212
4748
4648
3.1.2. Zonal catch per unit effort (CPUE)
Nominal and standardised CPUE (kg/potlift) show similar trends to those exhibited by catch
over time. Since the 1992/93 fishing year, standardised CPUE has been lower than nominal
CPUE (Figure 3.3; Table 3.1). From 2003/04 to 2009/10, nominal CPUE decreased by 47%
from 0.70 kg/potlift to 0.37 kg/potlift, the lowest on record. Nominal CPUE increased from
0.37 kg/potlift in 2009/10 to 0.56 kg/potlift in 2013/14. Similarly, standardised CPUE increased
from 0.30 kg/potlift to 0.41 kg/potlift over the same period (2009/10–2013/14).
10

Linnane et al. 2015 Victorian Rock Lobster and Giant Crab Fisheries Status Report
Figure 3.3 Nominal and standardised CPUE (kg/potlift) in the WZRLF from 1978/79–2013/14.
3.1.3. Within season trends in CPUE
Patterns of CPUE between July and March were similar among the last two quota years
(2013/14 and 2014/15; Figure 3.4). In both quota years, lower catch rates were observed from
July to September and the highest catch rates were recorded between November and February.
Peak catch rates recorded in December and January in 2014/15 and 2013/14, respectively,
were 39–45% higher than the average CPUE recorded between July and September. In
2014/15, estimates of CPUE were slightly higher between July and December compared to
CPUE recorded over the same period in 2013/14. In 2013/14 and 2014/15, CPUE was lowest in
June at 0.21 and 0.32 kg/potlift, respectively. Estimates of CPUE were highest in January
2013/14 at 0.68 kg/potlift and in December 2014/15 at 0.70 kg/potlift (Figure 3.4).
Figure 3.4 Within season trends in nominal CPUE (kg/potlift) for the quota years 2013/14 and 2014/15 in the WZRLF. Source: Monthly Victorian Rock Lobster catch based on data from the Fisheries Integrated Licensing System and Quota Monitoring Interactive Voice Response (IVR) system.
3.1.4. Spatial analyses
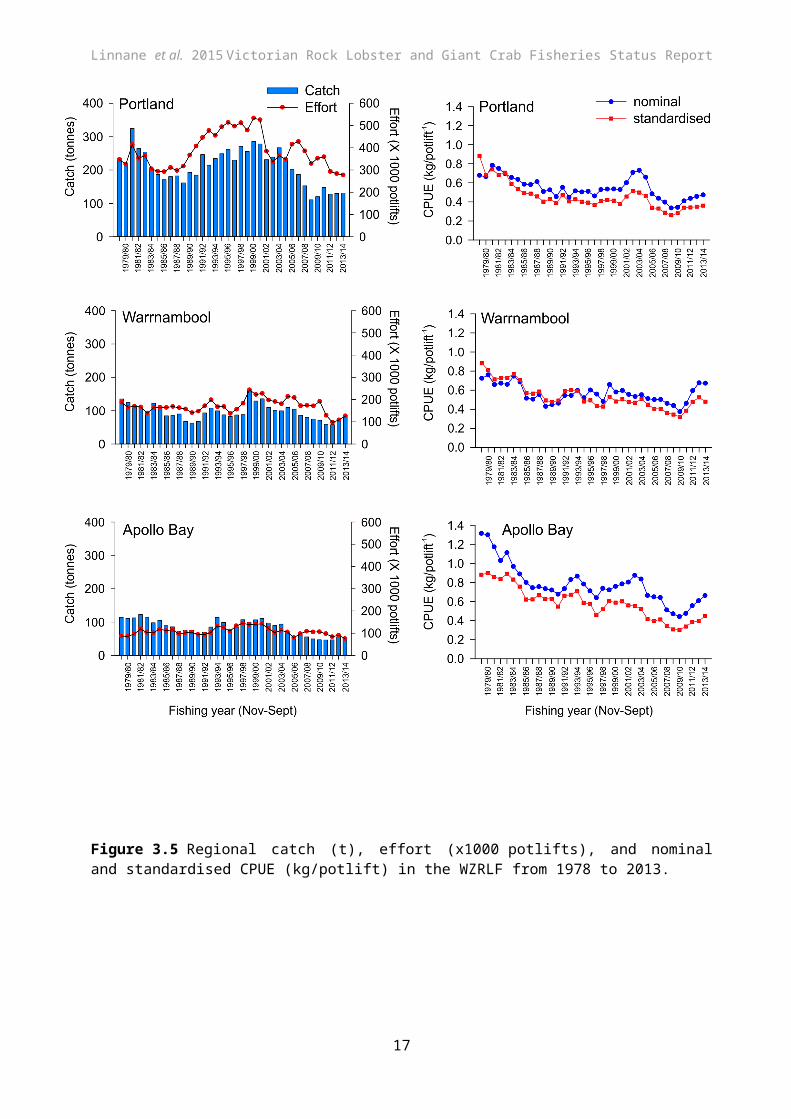
Regional (refer to Figure 1.1) trends in catch, effort and CPUE broadly reflect estimates for the
whole zone (Figure 3.4). In all three regions, the last six fishing years (2008-2013) have seen
catch decrease from the historically high levels taken during the late 1990s to some of the
lowest levels of catch recorded.
11

Linnane et al. 2015 Victorian Rock Lobster and Giant Crab Fisheries Status Report
Trends in effort within each region have generally reflected those of catch, however some
notable exceptions have occurred. For example, in Portland, from 2000/01 to 2004/05, effort
decreased by approximately 34% to 348,000 potlifts while catch during the same period
declined by approximately 18% to 229 t. In 2013/14, levels of effort in Portland, Warrnambool
and Apollo Bay had declined to historically low levels of 277,000 and 126,000 and 76,000
potlifts, respectively.
Regional levels of nominal and standardised CPUE generally declined from the late 1970s and
from recent peaks in 2002/03 to be at, or near historically low levels of CPUE in 2009/10.
However, since 2009/10 CPUE has generally increased across all regions. Most notably, the
2013/14 estimate of nominal CPUE in Warrnambool of 0.67 kg/potlift was the second highest
recorded since 1984/85 (0.69 kg/potlift), and the estimate of nominal CPUE in Apollo Bay of
0.66 kg/potlift was the highest recorded since 2004/05 (0.66 kg/potlift).
.
12
Linnane et al. 2015 Victorian Rock Lobster and Giant Crab Fisheries Status Report
Figure 3.5 Regional catch (t), effort (x1000 potlifts), and nominal and standardised CPUE (kg/potlift) in the WZRLF from 1978 to 2013.
13

Linnane et al. 2015 Victorian Rock Lobster and Giant Crab Fisheries Status Report
3.2. Settlement and pre-recruit indices
3.2.1. Puerulus settlement index
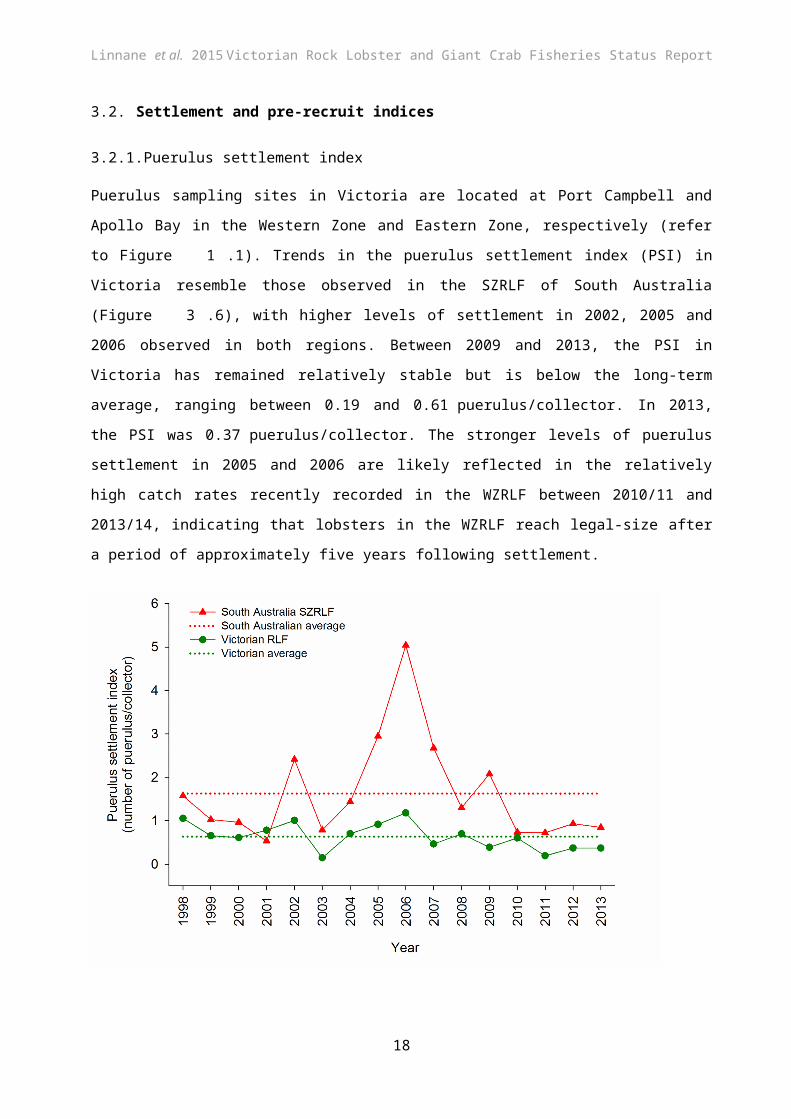
Puerulus sampling sites in Victoria are located at Port Campbell and Apollo Bay in the Western
Zone and Eastern Zone, respectively (refer to Figure 1.1). Trends in the puerulus settlement
index (PSI) in Victoria resemble those observed in the SZRLF of South Australia (Figure 3.6),
with higher levels of settlement in 2002, 2005 and 2006 observed in both regions. Between
2009 and 2013, the PSI in Victoria has remained relatively stable but is below the long-term
average, ranging between 0.19 and 0.61 puerulus/collector. In 2013, the PSI was
0.37 puerulus/collector. The stronger levels of puerulus settlement in 2005 and 2006 are likely
reflected in the relatively high catch rates recently recorded in the WZRLF between 2010/11 and
2013/14, indicating that lobsters in the WZRLF reach legal-size after a period of approximately
five years following settlement.
Figure 3.6 Puerulus settlement index in the Southern Zone (SZ), Northern Zone (NZ) rock lobster fisheries of South Australia and Western Zone (WZ) rock lobster fishery of Victoria from 1998-2013. Note: PSI data for WZ Victoria in 2005 and 2006 are from Port Campbell only, as collectors at Apollo Bay were removed during harbour redevelopment.
3.2.2. Pre-recruit indices
Catch rates of pre-recruits (undersized lobsters) are estimated from fixed-site surveys
undertaken annually since 2001 and the onboard observer program since 2004. Catch rates of
14

Linnane et al. 2015 Victorian Rock Lobster and Giant Crab Fisheries Status Report
undersized male and female lobsters sampled in fixed-site surveys decreased by >50% from
2001/02 to 2007/08 (Figure 3.7). From 2007/08 to 2010/11, the catch rates of undersized
lobsters of both sexes then increased, before declining over the next four seasons to all time
historical lows of 0.37 undersized/potlift (male) and 0.48 undersized/potlift (female) in 2014/15.
In the onboard observer program, the catch rates of undersized male and female lobsters
increased between 2004/05 and 2005/06, decreased to low levels in 2007/08 and 2008/09,
before increasing in 2011/12 to 0.43 and 0.59 undersized/potlift, for males and females,
respectively. In 2013/14, the catch rates of undersized male and female lobsters decreased to
0.23 and 0.33 undersized/potlift, respectively.
From 2001/02 to 2009/10, the catch rates of legal-size male and female lobsters sampled in
fixed-site surveys generally decreased (Figure 3.7). The catch rate of legal sized lobsters of
both sexes generally increased in fixed-site surveys between 2009/10 and 2013/14 but declined
in 2014/15. These trends generally reflect the trends observed for undersized lobsters lagged
by two to three years.
Consistency in the relationship between catch rates of pre-recruits (undersize lobsters) and
legal-size lobsters from the onboard observer program is less clear. From 2005/06 to 2009/10,
the CPUE of legal-sized lobsters of both sexes generally decreased (Figure 3.7). However, in
2011/12 CPUE of legal-size males and female lobsters increased to 0.52 and
0.37 lobsters/potlift respectively, the highest recorded by the onboard observer program for both
sexes. In 2013/14, the CPUE of legal-size male lobsters was 0.48 a slight decline since 2012/13
(0.50 lobsters/potlift). In contrast, in the same period, the CPUE of legal size females increased
from 0.35 to 0.41 lobsters/potlift (Figure 3.7).
15

Linnane et al. 2015 Victorian Rock Lobster and Giant Crab Fisheries Status Report
Figure 3.7 Number of legal-sized and undersized female (LML = 105 mm CL) and male (LML = 110 mm CL) lobsters per potlift in fixed-site surveys (top graph) and onboard observer program (bottom graph) in the WZRLF. Note: escape gaps open on pots for the onboard observer program and closed for the fixed-site survey.
The trends in the pre-recruit indices recorded for Victoria resembled those recorded from
logbook data of the SZRLF of South Australia for the fishing seasons between 2001/02 and
2014/15. In the SZRLF, catch rates of pre-recruits peaked in 2001 at 1.84 undersized/potlift
(Figure 3.8), but declined over the next seven seasons to a historical low of
0.86 undersized/potlift in 2008/09. Catch rates of pre-recruits then increased to
1.44 undersized/potlift in 2010/11 before decreasing to 0.96 undersized/potlift in 2014/15. These
results are broadly consistent with those recorded in the Western Zone of Victoria, where the
catch rates of pre-recruits sampled in fixed-site surveys decreased between 2001/02 and
2007/08, then increased up to 2010/11, before subsequently declining over the next four
seasons between 2011/12 and 2014/15 (Figure 3.7). The consistencies between the two
independent sources of pre-recruit data in Victoria and South Australia indicate that the factors
driving recruitment in these fisheries are common across both areas.
16

Linnane et al. 2015 Victorian Rock Lobster and Giant Crab Fisheries Status Report
Figure 3.8 Comparison of South Australian Southern Zone and Victorian Western Zone pre-recruit indices.
3.3. Zonal length-frequency distributions
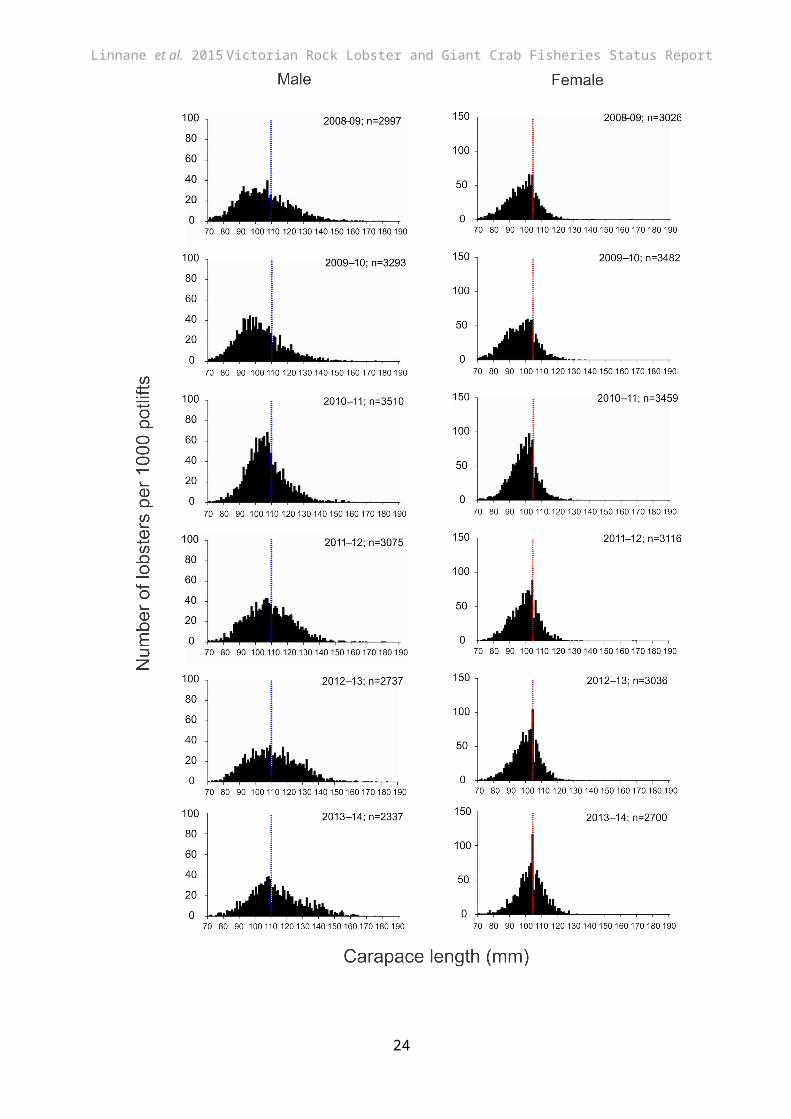
Length-frequency data of male and female lobsters obtained through fixed-site surveys support
the observed trends in pre-recruit indices and legal-size commercial catch rates (Figure 3.9).
Specifically, from 2008/09 to 2009/10, the number of male and female lobsters sampled in size
classes below the legal minimum length (LML) (per 1000 potlifts) was higher compared with
other years, reflecting the increase in abundance of pre-recruits observed in both fixed site
surveys and observer programs over the same period (Figure 3.7). The frequency of lobsters in
size classes below the LML has decreased since 2010/11 reflecting the trends observed in fixed
site survey pre-recruit outputs (Figure 3.7). The increased commercial catch rates seen across
the fishery between 2010/11 and 2013/14 reflect the increase in number of legal-sized lobsters
(105-130 mm CL) entering the fishable biomass, especially for male lobsters (Figure 3.3 and
Figure 3.9).
17

Linnane et al. 2015 Victorian Rock Lobster and Giant Crab Fisheries Status Report
Figure 3.9 Length-frequency distributions of male and female lobsters sampled on fixed-site surveys from 2008/09 to 2013/14 in the WZRLF. Blue and red dashed vertical lines represent minimum legal sizes for male and female lobsters, respectively.
18

Western Zone
Fishing Year (Nov-Sept)
1980/811981/821982/831983/841984/851985/861986/871987/881988/891989/901990/911991/921992/931993/941994/951995/961996/971997/981998/991999/002000/012001/022002/032003/042004/052005/062006/072007/082008/092009/102010/112011/122012/132013/14
Relative abundance
60 mm pre-recruitment projectionLong-term average
Linnane et al. 2015 Victorian Rock Lobster and Giant Crab Fisheries Status Report
3.4. Length-structured assessment model outputs
3.4.1. Model estimated recruitment (to 60 mm carapace length (CL))
Model-estimated recruitment (to 60 mm CL) has been highly variable over the last 30 years
(Figure 3.10). From the late 1980s to the late 1990s, recruitment was mostly above the long-
term average, however between 2000/01 and 2013/14, recruitment has largely been below
average. The above average recruitment in 2007/08 and 2008/09 is likely to be a product of
strong settlement seen in 2005 and 2006 and reflected in the increases in commercial catch
rates recorded between 2010/11 and 2013/14 (Figure 3.3). It is important to note that
recruitment (to 60 mm CL) estimates between 2009/10 and 2012/13 are below average.
Although these low recruitment estimates are not yet reflected in 2013/14 catch rates due to the
stronger recruitment years of 2007/08 and 2008/09 that are likely sustaining the fishery, the
model estimates indicate that the number of legal-size lobsters entering the fishery may be
reduced from 2014/15.
Figure 3.10 Relative abundance of recruitment to 60 mm CL in the WZRLF, as used in the length-frequency model. Long-term historical average (solid black line) also indicated.
19
Linnane et al. 2015 Victorian Rock Lobster and Giant Crab Fisheries Status Report
3.4.2. Biological reference points
3.4.2.1. Egg production
The level of egg production in 2013/14 was estimated to be 71% of that estimated in 2001/02
(the reference year) with at least 75% probability (Figure 3.11). This 2013/14 estimate was
above the biological limit reference point of 35% of egg production in 2001/02.
Figure 3.11 Model estimated level of egg production through time in the WZRLF (above, with 75% probability; blue line). Limit reference point (35% of egg production in 2001/02; red line).
20
Linnane et al. 2015 Victorian Rock Lobster and Giant Crab Fisheries Status Report
3.4.2.2. Available biomass
The level of available biomass in 2013/14 was estimated with 50% probability to be 73% of that
in 2001/02 (reference year). This was below the target biological reference point (BRP) of 159%
of 2001/02 (Figure 3.12). Under the existing harvest strategy for the fishery, the model
estimates that a TACC of 165 t would be required for the 2015/16 quota year to maintain
biomass rebuilding on the target trajectory based on a 50% probability forward projection.
Figure 3.12 Model-estimated levels of available biomass in the WZRLF (solid red line). Target reference point is 159% of available biomass in 2001/02 (dashed green line). Projected available biomass (dashed red line) given a TACC of 165 t for the 2015/16 quota year to rebuild available biomass to the biological reference point target by 2020/21. Backward projection of the biomass model (dotted red line).
Effects of CPUE standardisation on model estimates of available biomass
The current decision framework for the Victorian RLF states that modelled estimates of
biomass, which use standardised CPUE data, are to be compared with trends in nominal
(unstandardised or ‘raw’) CPUE over the most recent two year period. Modelled trends in
available biomass for the WZRLF were similar to trends seen in nominal CPUE, and nominal
CPUE collected in November to February of each fishing year (Figure 3.13). These data
highlight the consistency between the model-estimated biomass outputs and nominal CPUE
estimates.
21
Fishing Year (Nov-Sept)
2006/07
2007/08
2008/09
2009/10
2010/11
2011/12
2012/13
2013/14
Relative abundance
Nominal CPUE Nominal Nov-Feb CPUE Model projection
Linnane et al. 2015 Victorian Rock Lobster and Giant Crab Fisheries Status Report
Figure 3.13 Model estimated available biomass in the WZRLF (black line) from fitting standardised CPUE, compared with measures of nominal CPUE (red line) and nominal CPUE from November to February (inclusive; blue line) from 2006/07 to 2013/14. The most recent two year period for comparison of model and CPUE trends is indicated by the green line.
3.5. Summary
From 2000/01 to 2008/09, annual catches in the WZRLF decreased by 55% from 525 t to 235 t.
This is consistent with reductions in the TACC over the same period, from 450 t in 2001/02
(quota period 1 April to 31 March) to 240 t in 2009/10 (change in quota period; 1 July to 30
June; Walker et al. 2012c). Over the last six fishing years, fishing-year catch has remained
stable and in 2013/14 was 266 t. Effort did not decline at the same rate as catch, and as a result
in 2009/10 the fishery recorded a nominal CPUE estimate of 0.37 kg/potlift, the lowest on record
and representing a 47% decrease since 2003/04 (0.70 kg/potlift).
Nominal CPUE has increased over the last four fishing years and in 2013/14 was 0.56 kg/potlift,
representing a 51% increase from 2009/10. Standardised CPUE has increased by 37% from
0.30 kg/potlift to 0.41 kg/potlift over the same period. Patterns of catch and CPUE in each
region of the WZRLF are similar to those in the whole fishery. Most notably, the 2013/14
nominal CPUE estimates recorded in Warrnambool (0.67 kg/potlift), and Apollo Bay (0.66
kg/potlift) were the highest since 1984/85 and 2004/05, respectively.
22

Linnane et al. 2015 Victorian Rock Lobster and Giant Crab Fisheries Status Report
Puerulus settlement indices (PSIs) across South Australia and Victoria indicate large-scale
consistent patterns in settlement, with recent peaks in 2005 and 2006 evident in both States.
The data presented indicate that the period from settlement to recruitment at 60 mm CL is
approximately two years, with recruitment to legal-size approximately three years later. Overall,
this suggests that the total period from settlement to legal-size is approximately five years in the
WZRLF. Based on these data, this indicates that the latest increases in catch rates between
2010/11 and 2013/14 reflect the strong PSIs observed across South Australia and Victoria in
2005 and 2006. However, while CPUE of legal-sized lobsters has recently increased, fixed site
surveys indicate that the number of pre-recruits in the fishery has steadily decreased since
2010/11 reflecting declining settlement levels after 2006/07. This, combined with low model-
estimated recruitment (to 60 mm CL) between 2009/10 and 2013/14 suggest that future
recruitment to the fishery may be reduced.
The model estimated level of egg production in 2013/14 was 71% of the reference year and
above the reference limit point of 35%. In contrast, the level of available biomass was estimated
to be 73% of the reference year and below the reference target of 159%. Therefore, while
model outputs indicate that biomass is increasing, it is expected that low recent recruitment
trends will not allow biomass to rebuild to the 2020/21 target under a TACC level of 260 t.
Based on a 50% probability, model outputs indicate that a 165 t TACC would be required for the
2015/16 quota year to maintain biomass rebuilding on the target trajectory.
23

Linnane et al. 2015 Victorian Rock Lobster and Giant Crab Fisheries Status Report
4. EASTERN ZONE ROCK LOBSTER FISHERY (EZRLF)
4.1. Fishery statistics
4.1.1. Zonal catch and effort
From 1982/83 to 1988/89, catch in the EZRLF decreased annually from 143 t to 64 t (Figure 4.14,
Table 4.1). Over the next 12 years (1989–2000), total catch was stable and averaged 69 t/yr
(range 57–83 t/yr). In 2001, an initial TACC of 60 t was introduced for the 2002/03 season, where
it remained until 2006/07 (Table 4.2). In 2007/08, the TACC was increased to 66 t where it
remained until a reduction in 2012/13 to 48 t. Since the implementation of a TACC, catches have
ranged between 40 t (2008/09) and 65 t (2010/11). In 2013/14, the TACC increased to 51 t and
was the fourth consecutive season that the TACC was fully taken.
Annual changes in effort generally reflected changes in catch from 1978/79 to 1987/88. From
1988/89, effort increased substantially relative to catch, reaching a historical peak of
260,000 potlifts in 1993/94 and remaining above 200,000 potlifts/yr until 2000/01. Since 2002/03,
annual effort has reflected levels of catch, averaging approximately 126,000 potlifts/yr. Effort in
2013/14 was 114,000 potlifts/yr, which was a slight increase since 2012/13 (94,000 potlifts/yr), but
the fourth lowest estimate on record and a decrease of 24% since 2010/11 (150,000 potlifts).
Figure 4.14 Total catch (t) and nominal effort (x1000 potlifts) in the EZRLF from 1978/79–2013/14. Arrow indicates the introduction of a TACC in the 2001/02 season of 60 t.
24

Linnane et al. 2015 Victorian Rock Lobster and Giant Crab Fisheries Status Report
Table 4.1 Eastern Zone catch (t and numbers of lobsters), fishing effort (potlifts), CPUE (kg per potlift) and mean mass of lobsters (kg). (Fishing Year: November-September; SRL: Southern Rock Lobster; CPUE: Catch per unit effort). Data Source: Fisheries Victoria Catch and Effort Database (December 2014) for period 1978-79 to 2013-14.
Fishing year
Catch(t)
Catch
(‘000)
Nominal effort(‘000
potlifts)
Nominal CPUE
(kg per potlifts)
Standardised CPUE
(kg per potlifts)
Mean mass of SRL(kg)
1951-52 92 34 2.701952-53 141 68 2.071953-54 166 77 2.161954-55 182 66 2.751955-56 116 51 2.271956-57 116 57 2.011957-58 147 76 1.931958-59 123 82 1.501959-60 135 73 1.841960-61 147 86 1.701961-62 177 92 1.921962-63 158 84 1.881963-64 139 91 1.521964-65 121 99 1.221965-66 131 105 1.251966-67 120 109 1.101967-68 77 77 1.011968-69 107 93 1.151969-70 174 159 1.101970-71 160 176 0.911971-72 123 183 0.971972-73 118 169 0.701973-74 128 152 0.841974-75 93 114 0.811975-76 104 123 0.841976-77 108 130 0.831977-78 102 122 0.831978-79 139 123 192 0.72 0.71 1.131979-80 116 108 171 0.67 0.55 1.071980-81 133 123 180 0.74 0.56 1.091981-82 131 120 193 0.68 0.49 1.091982-83 143 132 212 0.68 0.53 1.091983-84 136 128 230 0.59 0.48 1.061984-85 113 96 201 0.56 0.40 1.171985-86 95 81 175 0.54 0.35 1.171986-87 78 66 145 0.54 0.36 1.181987-88 70 62 130 0.54 0.32 1.131988-89 64 60 145 0.44 0.30 1.061989-90 83 85 198 0.42 0.30 0.991990-91 72 72 172 0.42 0.32 1.001991-92 65 64 175 0.37 0.29 1.021992-93 69 63 224 0.31 0.24 1.101993-94 79 68 260 0.30 0.21 1.161994-95 72 58 253 0.28 0.19 1.241995-96 57 48 220 0.26 0.19 1.191996-97 60 48 222 0.27 0.18 1.251997-98 66 54 221 0.30 0.19 1.231998-99 67 58 220 0.31 0.22 1.161999-00 75 71 232 0.32 0.23 1.052000-01 73 67 219 0.33 0.23 1.082001-02 53 50 151 0.35 0.25 1.082002-03 52 48 134 0.39 0.27 1.092003-04 56 51 133 0.42 0.30 1.092004-05 55 49 136 0.40 0.30 1.132005-06 52 46 122 0.43 0.31 1.142006-07 54 48 136 0.40 0.31 1.132007-08 46 39 123 0.37 0.28 1.192008-09 39 32 108 0.37 0.29 1.242009-10 55 50 146 0.38 0.30 1.112010-11 66 62 150 0.44 0.33 1.052011-12 62 55 114 0.54 0.40 1.132012-13 48 43 94 0.51 0.42 1.112013-14 59 48 114 0.52 0.44 1.22
25

Linnane et al. 2015 Victorian Rock Lobster and Giant Crab Fisheries Status Report
Table 4.2 Eastern Zone history of TACCs for each quota period from 2002/03 to 2013/14 (TACC: Total Allowable Commercial Catch). *Quota was introduced 1 November 2001 for a shortened quota period. Data Source: Fisheries Victoria FILS Database.
TACC set
TACC Caught Number of
months fished
Number of activelicenses
Number of
vesselsQuota year Period (t) (tonne)
%
2001/02* 1 Nov - 31 Mar
42
2002/03 1 Apr - 31 Mar 60 49.9 83 12 39 342003/04 1 Apr - 31 Mar 60 54.4 91 12 41 362004/05 1 Apr - 31 Mar 60 53.2 89 12 41 392005/06 1 Apr - 31 Mar 60 55.7 93 12 30 292006/07 1 Apr - 31 Mar 60 53.5 89 12 30 302007/08 1 Apr - 31 Mar 66 50.1 76 12 31 312008/09 1 Apr - 31 Mar 66 41.3 63 12 26 242009/09 1 Apr - 30 Jun 6.9 5.8 84 3 19 202009/10 1 Jul - 30 Jun 66 43.9 67 12 22 212010/11 1 Jul - 30 Jun 66 64.8 98 12 29 282011/12 1 Jul - 30 Jun 66 65.3 99 12 25 262012/13 1 Jul - 30 Jun 48 47.3 99 12 26 252013/14 1 Jul - 30 Jun 51 50.8 100 12 27 27
4.1.2. Zonal catch per unit effort (CPUE)
Nominal and standardised CPUE show similar trends through time although standardised CPUE
is consistently lower (Figure 4.15). Nominal CPUE decreased from 1978/79 (0.72 kg/potlift) to
1995/96 (0.26 kg/potlift), the lowest level on record. Following annual increases from 1996/97 to
2003/04, nominal CPUE decreased from 0.43 kg/potlift in 2005/06 to 0.37 kg/potlift in 2008/09.
Nominal CPUE has increased since 2008/09 and in 2013/14 was 0.52 kg/potlift. Standardised
CPUE increased from 0.29 kg/potlift to 0.44 kg/potlift in the same five year period.
Fishing Year
1978/791979/801980/811981/821982/831983/841984/851985/861986/871987/881988/891989/901990/911991/921992/931993/941994/951995/961996/971997/981998/991999/002000/012001/022002/032003/042004/052005/062006/072007/082008/092009/102010/112011/122012/132013/14
CP
UE
(kg/potlift-1
)
0.0
0.2
0.4
0.6
0.8
1.0
NominalStandardised
26

Linnane et al. 2015 Victorian Rock Lobster and Giant Crab Fisheries Status Report
Figure 4.15 Nominal and standardised CPUE (kg/potlift) in the EZRLF from 1978/79–2013/14.
27
Linnane et al. 2015 Victorian Rock Lobster and Giant Crab Fisheries Status Report
4.1.3. Within season trends in CPUE
Trends in CPUE between July and March were similar in the last two quota years (2013/14 and
2014/15; Figure 4.16). However, catch rates in 2014/15 were 4.1% to 21.2% higher between July
and December compared to 2013/14. In both 2013/14 and 2014/15, the highest catch rates were
recorded in December, at 0.66 and 0.79 kg/potlift, respectively. In 2013/14 and 2014/15, the
lowest catch rates were recorded in June at 0.27 and 0.36 kg/potlift, respectively (Figure 4.16).
Figure 4.16 Within season trends in nominal CPUE (kg/potlift) from July to June for the quota years 2013/14 and 2014/15 in the EZRLF. Source: Monthly Victorian Rock Lobster catch based on data from the Fisheries Integrated Licensing and Quota Monitoring Interactive Voice Response (IVR) system.
4.1.4. Spatial analyses
Among the three regions of the EZRLF (refer to Figure 1.1) catches have generally declined from
the historical peaks observed during the late 1970s and early 1980s (Figure 4.17). After the
implementation of quota in 2001/02, catches decreased in each region. Some of the lowest levels
in catch were recorded as recently as 2008/09 at Queenscliff (21.2 t) and Lakes Entrance (1.3 t).
At San Remo, the lowest annual catch recorded was 13.2 t in 2002/03, with <14 t/yr caught in the
following two years. From 2005/06 to 2012/13, annual catches at San Remo averaged 21.6 t/yr,
and in 2013/14 the catch was 19.2 t. In Queenscliff the catch has increased since 2008/09 and in
2013/14 was 37.6 t. The least amount of catch recorded in 2013/14 was 2.0 t from Lakes
Entrance.
28

Linnane et al. 2015 Victorian Rock Lobster and Giant Crab Fisheries Status Report
Trends in effort generally followed those of catch until the late 1980s and early 1990s, after which
effort increased to historically high levels in 1993/94 at Queenscliff (147,000 potlifts) and San
Remo (101,000 potlifts), and in 1994/95 at Lakes Entrance (22,000 potlifts). Since this time, effort
has decreased to historically low levels at Queenscliff in 2012/13 (54,000 potlifts), at San Remo in
2003/04 (34,000 potlifts), and at Lakes Entrance in 2008/09 (2,000 potlifts). In 2013/14, the effort
estimates for Queenscliff, San Remo and Lakes Entrance were 72,000, 38,000 and 4,000 potlifts,
respectively. These levels of effort are at, or close to, historical lows recorded in all regions.
Nominal and standardised CPUE (kg/potlift) show similar tends through time at Queenscliff and
San Remo. Nominal CPUE generally declined from 1978/79 to historically low levels in 1996/97 in
both regions, whereafter it has increased to 0.52 kg/potlift (Queenscliff) and 0.50 kg/potlift (San
Remo) in 2013/14. The 2012/13 CPUE estimate of 0.52 kg/potlift in Queenscliff is the second
highest on record since 1983/84 (0.58 kg/potlift). Trends in CPUE at Lakes Entrance have been
more variable than the other regions, with less agreement between nominal and standardised
CPUE. In 2013/14, levels of CPUE at Lakes Entrance were 0.53 kg/potlift (nominal) and
0.26 kg/potlift (standardised). Estimates of CPUE from this region should be viewed with caution
considering the overall low levels of catch and effort in recent years.
29

Linnane et al. 2015 Victorian Rock Lobster and Giant Crab Fisheries Status Report
Figure 4.17 Catch (t), effort (x1000 potlifts) and nominal and standardised CPUE (kg/potlift) in the EZRLF from 1978/79 to 2013/14.
30

Linnane et al. 2015 Victorian Rock Lobster and Giant Crab Fisheries Status Report
4.2. Settlement and pre-recruit indices
4.2.1. Puerulus settlement index
As detailed in Section 3.2.1, trends in the puerulus settlement index (PSI) in Victoria resemble
those observed in the Southern Zone Rock Lobster Fishery (SZRLF) of South Australia (Figure
3.6), with higher levels of settlement in 2002, 2005 and 2006 observed in both regions. The
stronger levels of puerulus settlement in 2005 and 2006 are likely reflected in the relatively high
catch rates recently recorded in the EZRLF between 2010/11 and 2013/14, indicating that
lobsters in the EZRLF reach legal-size after a period of approximately five years following
settlement.
4.2.2. Pre-recruit indices
The catch rates of pre-recruits (undersized lobsters) are estimated from fixed-site surveys
undertaken annually since 2001 and the onboard observer program since 2004 (Figure 4.18).
Overall, the catch rates of undersized lobsters are approximately 50% greater in fixed-site
surveys, compared to the onboard observer program, possibly reflecting the different seasonal
timing in the surveys.
Figure 4.18 Number of undersized female (LML = 105 mm CL) and male (LML = 110 mm CL) lobster per potlift in fixed-site surveys and onboard observer program in the EZRLF.
31

Linnane et al. 2015 Victorian Rock Lobster and Giant Crab Fisheries Status Report
The catch rates of undersized male and female lobsters in fixed-site surveys showed peaks in
2002/03, 2005/06 and 2011/12, and generally increased from 2006/07 to 2011/12 (Figure 4.18).
The relatively high catch rates of undersize lobsters recorded between 2008/09 and 2011/12 in
the fixed-site surveys are likely reflected in the relatively high levels of CPUE observed for legal
sized lobsters between the 2010/11 and 2013/14 fishing seasons (Figure 4.2) and are consistent
with the progression of lobsters from pre-recruit to legal-size over a period of two to three years.
Since 2011/12, the catch rates of undersized male and female lobsters have declined in the fixed
site surveys, reaching 0.02 and 0.04 undersized/potlift, respectively. Catch rates of undersized
male and female lobsters in the onboard observer program have also declined since 2011/12 to
0.06 to 0.08 undersized/potlift, respectively. These results indicate that the number of legal-sized
lobsters entering the fishable biomass may be reduced in future years.
4.3. Zonal length-frequency distributions
Length-frequency data obtained through fixed-site surveys support changes in commercial catch
rates despite low sample sizes in some years (e.g. 2008/09 and 2009/10) (Figure 4.6). The
relative increase in male and female lobster abundance within the 105-130 mm CL size range,
between 2010/11 and 2013/14 reflects the increase in catch rates of legal size lobsters observed
across the fishery during these seasons (Figure 4.15). It should be noted that escape gaps are
not closed in fixed site surveys in the EZRLF. Consequently, the number of male lobsters <110
mm (CL) and female lobsters <105 mm (CL) sampled is relatively less in the EZRLF than occurs
during fixed site surveys in the WZRLF (Section 3.3).
32

Linnane et al. 2015 Victorian Rock Lobster and Giant Crab Fisheries Status Report
Figure 4.19 Length-frequency distributions of male and female lobsters sampled on fixed-site surveys from 2008/09 to 2013/14 in the EZRLF. Blue and red dashed vertical lines represent minimum legal sizes for male and female lobsters, respectively.
33

Linnane et al. 2015 Victorian Rock Lobster and Giant Crab Fisheries Status Report
4.4. Length-structured assessment model outputs
4.4.1. Model estimated recruitment (to 60 mm carapace length; (CL))
Model-estimated recruitment has been highly variable over the last 30 years. From 2001/02 to
2006/07, recruitment strength was below the long-term average for the fishery (Figure 4.20).
However, levels in 2007/08 and 2008/09 were the highest on record and have likely resulted in
the recent increases in CPUE over the last three seasons (Figure 4.15). Recruitment estimates
from 2009/10 to 2012/13 were below the long-term average. In 2013/14, recruitment levels were
slightly above the long term average and the highest recorded in the last five years (Figure 4.20).
Figure 4.20 Relative abundance of recruitment to 60 mm CL in the EZRLF, as used in the length-frequency model. Long-term historical average (solid black line) is also indicated.
Eastern Zone
Fishing Year (Nov-Sept)
1980/811981/821982/831983/841984/851985/861986/871987/881988/891989/901990/911991/921992/931993/941994/951995/961996/971997/981998/991999/002000/012001/022002/032003/042004/052005/062006/072007/082008/092009/102010/112011/122012/132013/14
Relative abundance
60 mm pre-recruitment projectionLong-term average
34

Linnane et al. 2015 Victorian Rock Lobster and Giant Crab Fisheries Status Report
4.4.2. Biological reference points
4.4.2.1. Egg production
The level of egg production in 2013/14 was estimated to be 155% of that estimated for 2001/02
(the reference year) with at least 75% probability. The 2013/14 estimate was above the biological
reference point limit of 104% of egg production in 2001/02 (Figure 4.21).
Figure 4.21 Model estimated level of egg production through time in the EZRLF (above, with 75% probability; blue line). Limit reference point is 104% of egg production in 2001/02 (dashed red line).
35

Linnane et al. 2015 Victorian Rock Lobster and Giant Crab Fisheries Status Report
4.4.2.2. Available biomass
The model estimated level of available biomass in 2013/14 was 141% of that in 2001/02 (the
reference year). This estimate was below the biological reference point target of 184% of the
estimated available biomass in 2001/02 (Figure 4.22). Under the existing harvest strategy, the
model estimates that a TACC of 51 t would be required for the 2015/16 quota year to maintain
biomass rebuilding on the target trajectory based on a 50% probability forward projection.
Figure 4.22 Model estimated levels of available biomass in the EZRLF (solid red line). Target reference point is 184% of available biomass in 2001/02 (dashed green line). Projected available biomass (dashed red line) given a TACC of 51 t for the 2015/16 quota year to rebuild available biomass to the biological reference point target by 2020/21. Backward projection of the biomass model is represented by red dotted line.
Effects of CPUE standardisation on available biomass trajectories
The current decision framework for the Victorian RLF states that modelled estimates of biomass
are to be compared with trends in nominal (unstandardised or ‘raw’) CPUE over the most recent
two year period (Figure 4.23). Analyses showed a divergence in trends from 2011/12 to 2013/14,
with nominal CPUE marginally decreasing while biomass estimates continued to increase. A
further analysis of the data revealed that this divergence was a function of the filtering process
requiring fishers to have been in the fishery 200 days and more than 2 separate fishing years.
36

Fishing Year (Nov-Sept)
2006/07
2007/08
2008/09
2009/10
2010/11
2011/12
2012/13
2013/14
Relative abundance
Model projection Nominal CPUE Nominal Nov-Feb CPUE
Linnane et al. 2015 Victorian Rock Lobster and Giant Crab Fisheries Status Report
Figure 4.23 Model-estimated available biomass in the EZRLF (black line) using standardised CPUE data compared with 1) measures of nominal CPUE (red line) and 2) nominal CPUE from November to February (inclusive; blue line) from 2006/07 to 2013/14. The most recent two year period for comparison of model and CPUE trends is indicated by the green line.
4.5. Summary
Annual catches have generally declined over the history of the fishery, to their lowest level in
2008/09 (39.5 t). Since the implementation of a TACC in 2001, catches have ranged between 40 t
(2008/09) and 65 t (2010/11). In 2013/14, the TACC increased to 51 t, and was the fourth
consecutive season that the TACC was fully taken.
Since 2002/03, annual effort has generally reflected levels of catch. Nominal CPUE increased
since 1995/96, but declined from 0.43 kg/potlift in 2005/06 to 0.37 kg/potlift in 2008/09. Since
2008/09, nominal CPUE has increased and in 2013/14 was 0.52 kg/potlift, representing a 41%
increase since 2008/09. Patterns of catch, effort and CPUE among regions are similar to those
recorded for the whole fishery.
Consistent large-scale patterns in puerulus settlement indices (PSIs) in Victoria and South
Australia have been recorded. The EZRLF and WZRLF also indicate broadly similar trends in
model-estimated recruitment. The stronger levels of puerulus settlement in 2005 and 2006 are
likely reflected in the relatively high catch rates recently recorded in the EZRLF between 2010/11
and 2013/14, indicating that lobsters in the EZRLF reach legal-size after a period of
approximately five years following settlement.
37

Linnane et al. 2015 Victorian Rock Lobster and Giant Crab Fisheries Status Report
The relatively high catch rates of undersize lobsters recorded between 2008/09 and 2011/12 in
the fixed-site surveys are likely reflected in the relatively high levels of CPUE observed for legal
sized lobsters between the 2010/11 and 2013/14 fishing seasons (Figure 4.2) and are consistent
with the progression of lobsters from pre-recruit to legal-size over a period of two to three years.
Overall, as with the WZRLF, this suggests that the EZRLF is currently experiencing an increase in
recruitment of legal-sized lobsters to the fishery. However since 2011/12, the catch rates of
undersized lobsters have declined indicating that the number of legal-sized lobsters entering the
fishable biomass may be reduced in future years.
The level of egg production in 2013/14 was 155% of that in 2001/02 and above the limit reference
point of 104%. In contrast, the level of available biomass was estimated to be 141% of that in the
reference year and below the target reference point of 184%. The forward projection model
indicated with 50% probability that a TACC of 51 t in the 2015/16 quota year would maintain the
rebuild rate required to achieve the target biomass by 2020/21.
38

Linnane et al. 2015 Victorian Rock Lobster and Giant Crab Fisheries Status Report
5. GIANT CRAB FISHERY
5.1. Fishery statistics
Based on data for the quota (licensing) year (July to June), the total annual catch (targeted and
non-targeted) of giant crab peaked at 170 t in 1993/94 (Figure 5.1). Since then, catches have
generally declined, reaching a record low of 8.0 t in 2001/02. Quota management was
introduced in 2001/02 and the TACC was set at 25 t. Between 2004/05 and 2009/10, catches
averaged approximately 20 t but then began to decline. TACCs have been reduced accordingly.
In 2013/14, the TACC was 9.5 t with a total catch of 6.5 t, of which 6.4 t was targeted (Figure
5.1; Table 5.1).
Figure 5.24 Total catch (t) and targeted catch history for the Victorian Giant Crab Fishery. (Black line indicates a TACC introduction in 2001 of 25 t).
39

Linnane et al. 2015 Victorian Rock Lobster and Giant Crab Fisheries Status Report
Table 5.1 Catch and corresponding TACCs for Giant Crab in each licensing season between 1990/91 and 2013/14.
Licensing season TACC (t)Total catch
(t) Licensing season TACC (t)Total catch
(t)1990/91 No TACC 14.3 2003/04 25 11.91991/92 No TACC 54.6 2004/05 25 20.41992/93 No TACC 148.8 2005/06 25 21.41993/94 No TACC 170.5 2006/07 25 21.81994/95 No TACC 66.8 2007/08 25 22.71995/96 No TACC 36.1 2008/09 25 20.01996/97 No TACC 57.6 2009/10 25 24.31997/98 No TACC 57.7 2010/11 25 17.41998/99 No TACC 51.3 2011/12 18 13.01999/00 No TACC 34.4 2012/13 12 10.22000/01 No TACC 23.6 2013/14 9.5 6.52001/02 25 7.9 2014/15 10.5 10.12002/03 25 9.2 2015/16 10.5
CPUE peaked in 1993/94 at 3.21 kg/24 hr potlift; before generally declining to 0.28 kg/24 hr
potlift in 2002/03. CPUE then increased to 1.35 kg/24 hr potlift in 2005/06 but has since declined
reaching 0.53 kg/24 hr potlift in 2013/14. The 2013/14 estimate represents one of the lowest
catch rates on record but remains marginally above the limit reference point of 0.52 kg/24 hr
potlift.
40

Linnane et al. 2015 Victorian Rock Lobster and Giant Crab Fisheries Status Report
Figure 5.25 Catch rate (CPUE (kg/24 hr potlift)) from targeted fishing by fishers with >1 t catch of giant crab and corrected for a maximum of 4 days soak using a slope of 0.38. Dashed red line and solid black line represent limit and trigger reference points, respectively.
5.2. Summary
A TACC and individually transferable quota was implemented in the GCF in the 2001/02 season.
Management changes required catches to be reported as either targeting fishing of giant crab or
as by-catch from the Rock Lobster Fishery. Over the last three years, total catches have
declined from 24.3 t in 2009/10 to 6.5 t in 2013/14. Catch rates (kg/24 hr potlift), as estimated
from targeted fishing by fishers with >1 t catch/yr, have generally declined over the last decade
but have stabilised in the last three fishing seasons (Figure 5.2). In 2013/14, the estimate of
0.53 kg/24 hr potlift was one of the lowest estimates on record but remains marginally above the
limit reference point of 0.52 kg/24 hr potlift. In 2014/15, the TACC was 10.5 t. Based on the
2013/14 CPUE estimate, the current harvest strategy recommends retaining the TACC at 10.5 t
for the 2015/16 season.
41

Linnane et al. 2015 Victorian Rock Lobster and Giant Crab Fisheries Status Report
6. REFERENCESHobday, D. and Punt, A.E. 2001. Size-structured population modelling and risk assessment of the
Victorian southern rock lobster, Jasus edwardsii, fishery. Marine and Freshwater Research 52: 1495-1507.
Linnane, A., Chick, R.C., Walker, T., Trinnie, F. and D. Reilly 2012. Victorian Rock Lobster and Giant Crab Fisheries Status Report 2011/2012. Fishery Status Report to Fisheries Victoria. South Australian Research and Development Institute (Aquatic Sciences), Adelaide. SARDI Publication No. F2012/000434-1. SARDI Research Report Series No. 663. 36pp.
Linnane, A., Chick, R.C., Walker, T., Trinnie, F. and Reilly, D. 2013. Victorian Rock Lobster and Giant Crab Fisheries Fishery Status Report - 2011/2012 Fishing Year. Fishery Status Report to Fisheries Victoria. South Australian Research and Development Institute (Aquatic Sciences), Adelaide. SARDI Publication No. F2012/000434-2. SARDI Research Report Series No. 744. 36pp.
Linnane, A., McGarvey, R., Feenstra, J. Reilly, D. and McLeay L. 2014. Victorian Rock Lobster and Giant Crab Fisheries Fishery Status Report - 2012/2013 Fishing Year. Fishery Status Report to Fisheries Victoria. South Australian Research and Development Institute (Aquatic Sciences), Adelaide. SARDI Publication No. F2012/000434-3. SARDI Research Report Series No. 806. 39pp.
Punt, A.E. 2003. The performance of a size-structured stock assessment method in the face of spatial heterogeneity in growth. Fisheries Research 65: 391-409.
VicDPI. 2009. Victorian Rock Lobster Fishery Management Plan. Fisheries Victoria. Management Report Series No. 70. Department of Primary Industries. Fisheries Victoria. 85pp.
VicDPI. 2010. Victorian Giant Crab Fishery Management Plan (Second Edition). Fisheries Victoria. Management Report Series No. 70. Department of Primary Industries. Fisheries Victoria. 65pp.Walker, T.I., F.I. Trinnie and D.J. Reilly. 2012a. Victorian giant crab fishery stock assessment report 2012. Fisheries Victoria, Department of Primary Industries, Queenscliff, Victoria. 5pp.
Walker, T.I., K. Giri, F.I. Trinnie and D.J. Reilly. 2012b. CPUE data screening, selection and standardisation for stock assessment of southern rock lobster (Jasus edwardsii) in Victoria. Report to Rock Lobster and Giant Crab Resource Assessment Group. Meeting 7. 8 March 2012. Fisheries Victoria, Department of Primary Industries, Queenscliff, Victoria, Australia. 50pp.
Walker, T.I., F.I. Trinnie and D.J. Reilly. 2012c. Victorian rock lobster fishery stock assessment report 2012. Fisheries Victoria, Department of Primary Industries, Queenscliff, Victoria. 16pp.
42
Recommended