1 Montana Consolidated Plan Focus Groups: May 1-2, 2014
Welcome to the Affordable Housing Focus
Group Sponsored by the
Montana Department of Commerce In Support of Montana’s
Five-Year Consolidated Plan
2 Montana Consolidated Plan Focus Groups: May 1-2, 2014
Why Prepare a Consolidated Plan?
In 1994, HUD combined the planning and application process of four programs: HOME, CDBG, ESG and HOPWA
In exchange for receiving funds, required to prepare a Five-Year Consolidated Plan, an Annual Action Plan and Analysis of Impediments to Fair Housing Choice
3 Montana Consolidated Plan Focus Groups: May 1-2, 2014
Purpose of the Consolidated Plan
Identify housing and community development needs, priorities and strategies
Indicate how state and federal funds will be allocated to address these needs and activities
4 Montana Consolidated Plan Focus Groups: May 1-2, 2014
Consolidated Plan Objectives
Provide decent housing Provide a suitable living environment Expand economic opportunities for lower-
income citizens of the state
5 Montana Consolidated Plan Focus Groups: May 1-2, 2014
Consolidated Plan Outcomes
Sustainability – enhance communities in the state
Availability/Accessibility – benefit eligible individuals and families
Affordability – create and/or maintain affordable housing
6 Montana Consolidated Plan Focus Groups: May 1-2, 2014
Consolidated Plan Resources in FY 2014
Housing Opportunities for Persons with AIDS (HOPWA): Tri-State Consortium
Emergency Solutions Grant (ESG): $638,154 HOME Investment Partnership (HOME):
$3,017,887 Community Development Block Grant
(CDBG): $5,847,967
7 Montana Consolidated Plan Focus Groups: May 1-2, 2014
Consolidated Plan Planning Process
Analysis of quantitative and qualitative data regarding need
Public involvement and other agency input about need
Development of strategy in response to identified needs
8 Montana Consolidated Plan Focus Groups: May 1-2, 2014
Consolidated Plan Components
Assessment of Need and a Five Year Strategy to Address the Needs
Annual Action Plans A Fair Housing Analysis and Plan Consolidated Annual Performance and
Evaluation Report (CAPER)
9 Montana Consolidated Plan Focus Groups: May 1-2, 2014
Contents of the Consolidated Plan
Needs Assessment and Strategic Plan: Housing Homeless Community Development Non-Housing Special Needs
Documentation of Entire Process
10 Montana Consolidated Plan Focus Groups: May 1-2, 2014
Contents of the Housing Needs Assessment
Housing: Housing Market Housing Needs Housing Priorities Public Housing Barriers to Affordable Housing
11 Montana Consolidated Plan Focus Groups: May 1-2, 2014
Purpose of Today’s Meeting is to Support the CP
We hope to answer some of these questions:
1. What are our greatest housing needs? 2. What are our market barriers? 3. What policy barriers are there? 4. Are there land use or zoning constraints
on affordable housing?
12 Montana Consolidated Plan Focus Groups: May 1-2, 2014
A Situation Review What is the environment like today and what
can we expect in the near future?
1. Demographic trends 2. Economic influences 3. Housing situation 4. Preliminary findings of surveys
13 Montana Consolidated Plan Focus Groups: May 1-2, 2014
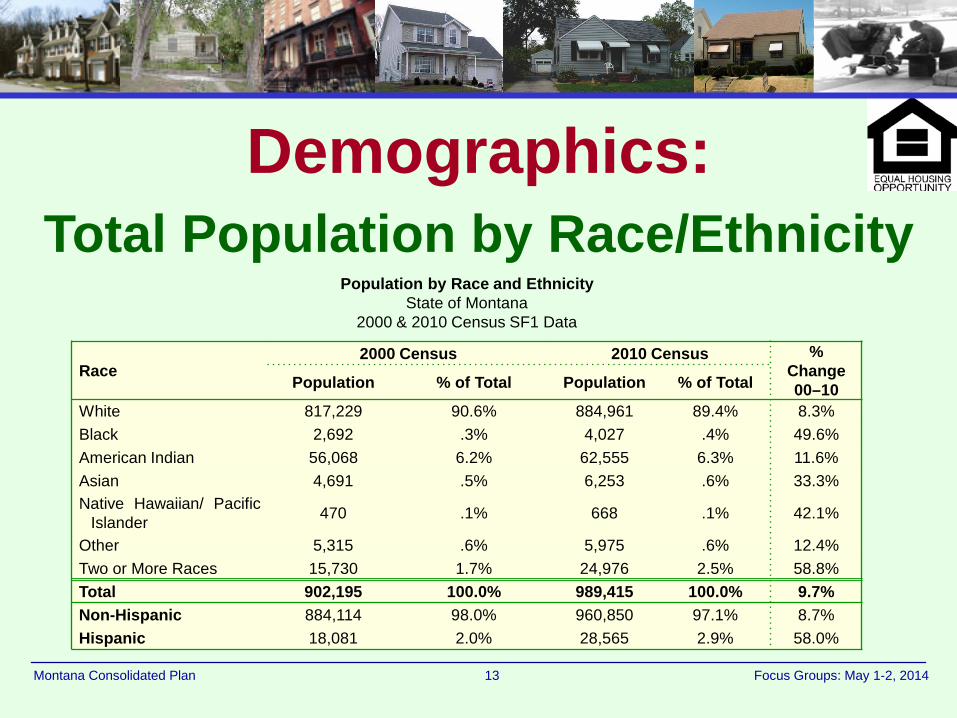
Demographics: Total Population by Race/Ethnicity
Population by Race and Ethnicity State of Montana
2000 & 2010 Census SF1 Data
Race 2000 Census 2010 Census %
Change 00–10 Population % of Total Population % of Total
White 817,229 90.6% 884,961 89.4% 8.3% Black 2,692 .3% 4,027 .4% 49.6% American Indian 56,068 6.2% 62,555 6.3% 11.6% Asian 4,691 .5% 6,253 .6% 33.3% Native Hawaiian/ Pacific
Islander 470 .1% 668 .1% 42.1%
Other 5,315 .6% 5,975 .6% 12.4% Two or More Races 15,730 1.7% 24,976 2.5% 58.8% Total 902,195 100.0% 989,415 100.0% 9.7% Non-Hispanic 884,114 98.0% 960,850 97.1% 8.7% Hispanic 18,081 2.0% 28,565 2.9% 58.0%
14 Montana Consolidated Plan Focus Groups: May 1-2, 2014
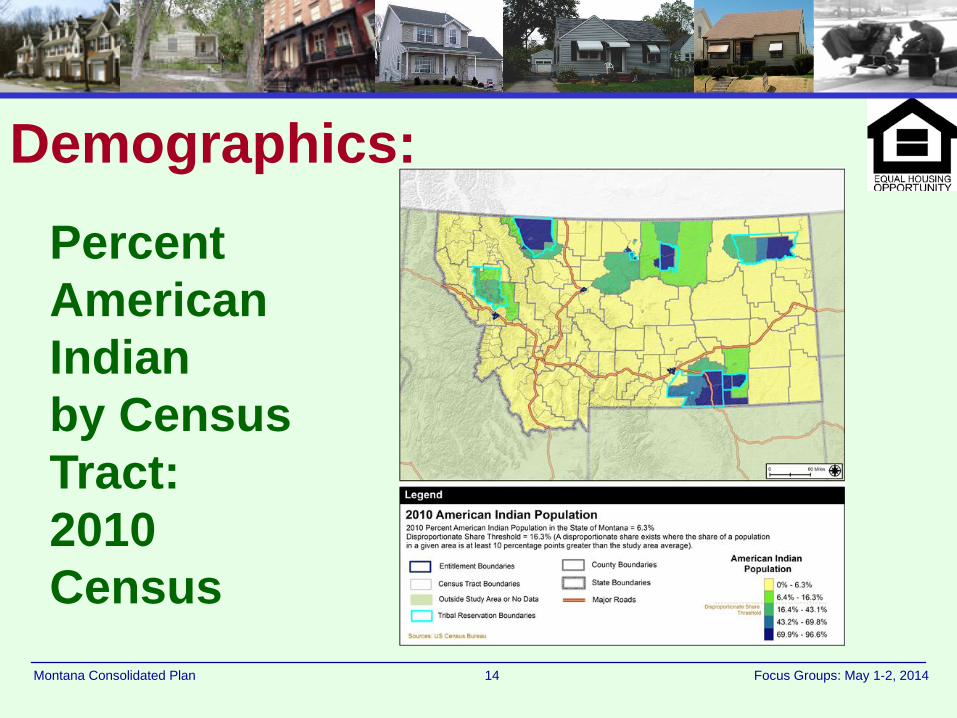
Percent American Indian by Census Tract: 2010 Census
Demographics:
15 Montana Consolidated Plan Focus Groups: May 1-2, 2014
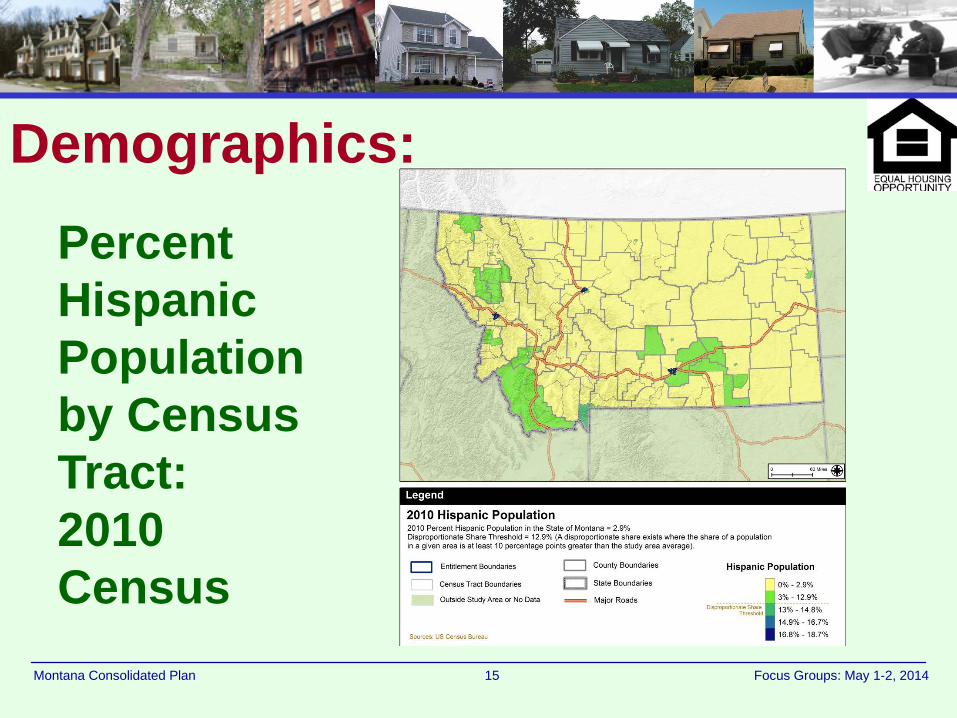
Percent Hispanic Population by Census Tract: 2010 Census
Demographics:
16 Montana Consolidated Plan Focus Groups: May 1-2, 2014
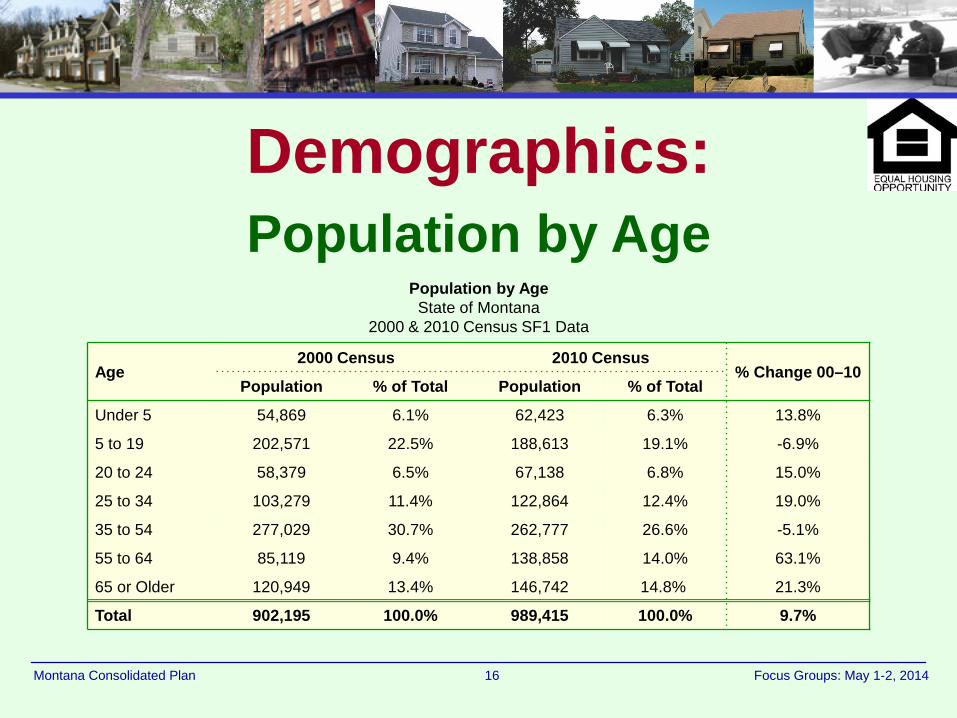
Demographics: Population by Age
Population by Age State of Montana
2000 & 2010 Census SF1 Data
Age 2000 Census 2010 Census
% Change 00–10 Population % of Total Population % of Total
Under 5 54,869 6.1% 62,423 6.3% 13.8%
5 to 19 202,571 22.5% 188,613 19.1% -6.9%
20 to 24 58,379 6.5% 67,138 6.8% 15.0%
25 to 34 103,279 11.4% 122,864 12.4% 19.0%
35 to 54 277,029 30.7% 262,777 26.6% -5.1%
55 to 64 85,119 9.4% 138,858 14.0% 63.1%
65 or Older 120,949 13.4% 146,742 14.8% 21.3%
Total 902,195 100.0% 989,415 100.0% 9.7%
17 Montana Consolidated Plan Focus Groups: May 1-2, 2014
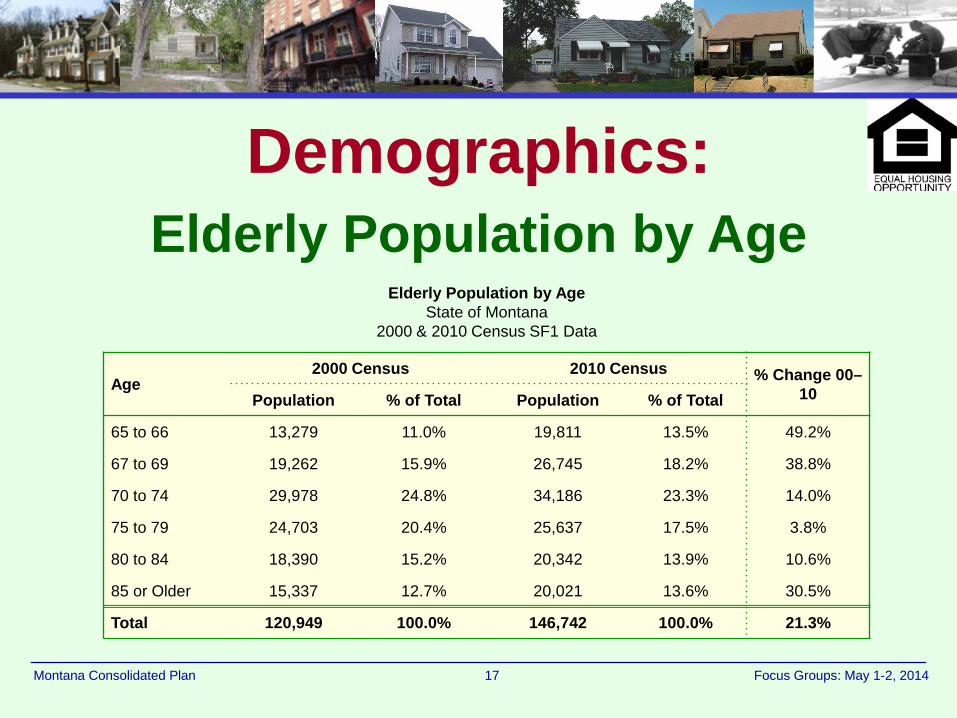
Demographics: Elderly Population by Age
Elderly Population by Age State of Montana
2000 & 2010 Census SF1 Data
Age 2000 Census 2010 Census % Change 00–
10 Population % of Total Population % of Total
65 to 66 13,279 11.0% 19,811 13.5% 49.2%
67 to 69 19,262 15.9% 26,745 18.2% 38.8%
70 to 74 29,978 24.8% 34,186 23.3% 14.0%
75 to 79 24,703 20.4% 25,637 17.5% 3.8%
80 to 84 18,390 15.2% 20,342 13.9% 10.6%
85 or Older 15,337 12.7% 20,021 13.6% 30.5%
Total 120,949 100.0% 146,742 100.0% 21.3%
18 Montana Consolidated Plan Focus Groups: May 1-2, 2014
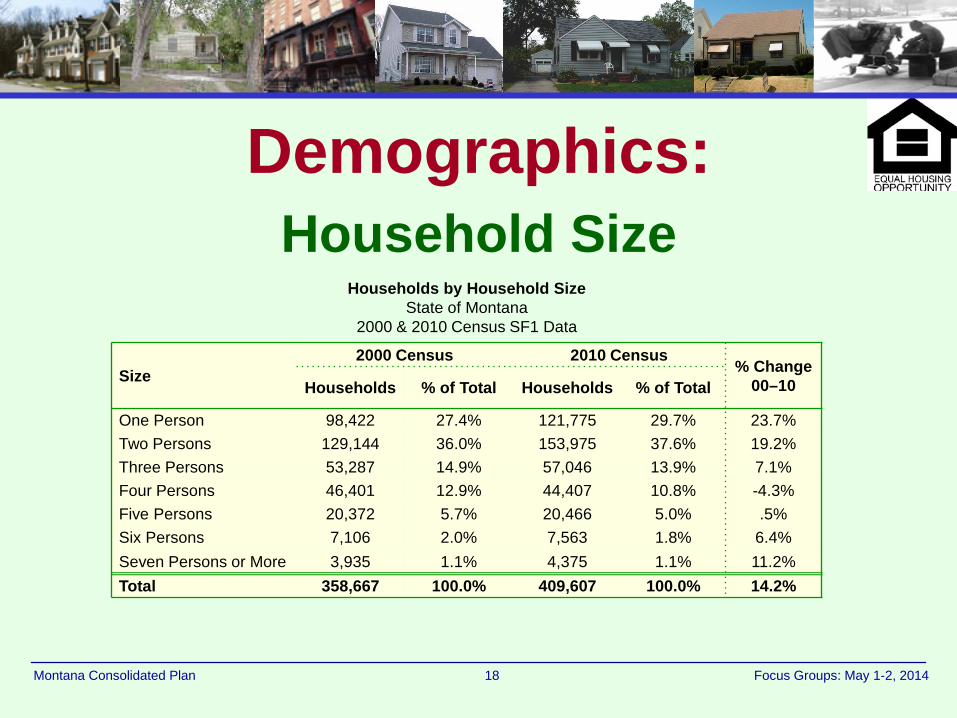
Demographics: Household Size
Households by Household Size State of Montana
2000 & 2010 Census SF1 Data
Size 2000 Census 2010 Census
% Change 00–10 Households % of Total Households % of Total
One Person 98,422 27.4% 121,775 29.7% 23.7% Two Persons 129,144 36.0% 153,975 37.6% 19.2% Three Persons 53,287 14.9% 57,046 13.9% 7.1% Four Persons 46,401 12.9% 44,407 10.8% -4.3% Five Persons 20,372 5.7% 20,466 5.0% .5% Six Persons 7,106 2.0% 7,563 1.8% 6.4% Seven Persons or More 3,935 1.1% 4,375 1.1% 11.2% Total 358,667 100.0% 409,607 100.0% 14.2%
19 Montana Consolidated Plan Focus Groups: May 1-2, 2014
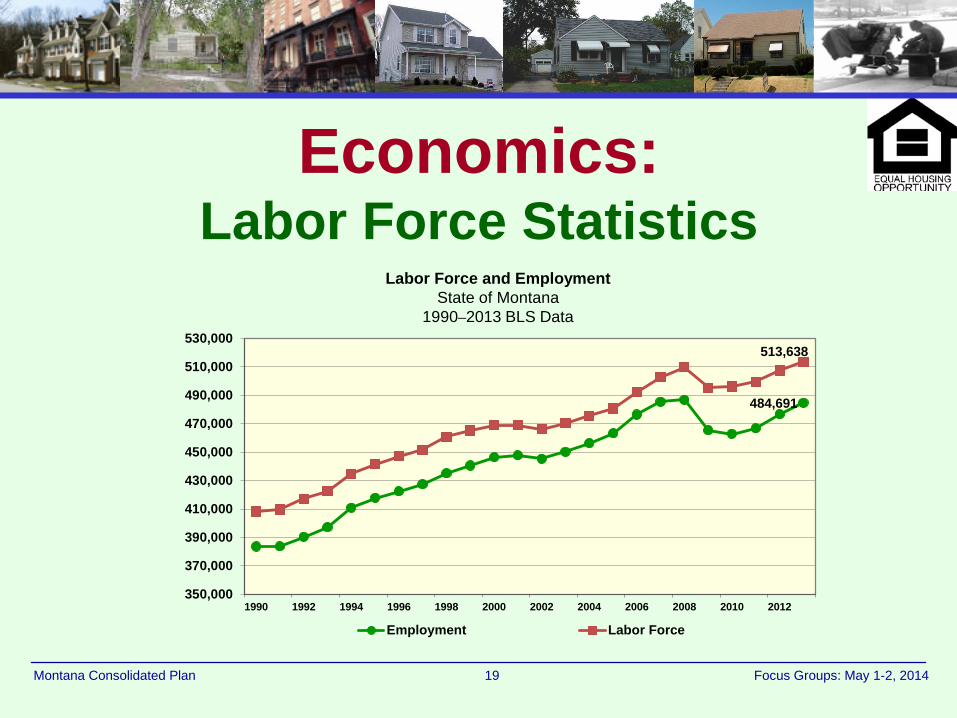
Economics: Labor Force Statistics
Labor Force and Employment State of Montana
1990–2013 BLS Data
484,691
513,638
350,000
370,000
390,000
410,000
430,000
450,000
470,000
490,000
510,000
530,000
1990 1992 1994 1996 1998 2000 2002 2004 2006 2008 2010 2012
Employment Labor Force
20 Montana Consolidated Plan Focus Groups: May 1-2, 2014
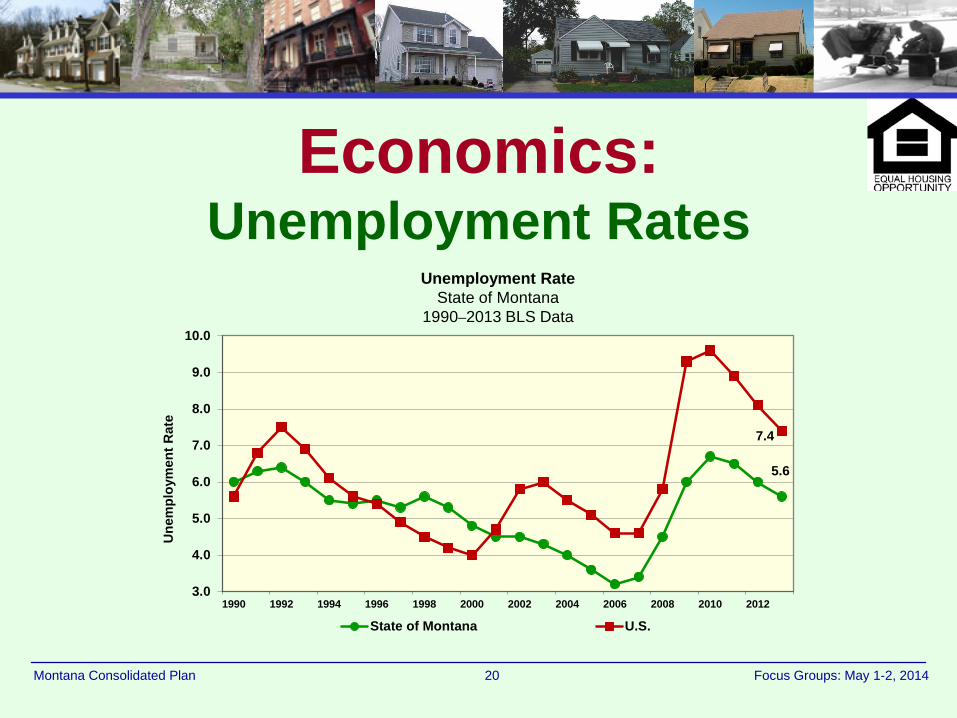
Economics: Unemployment Rates
5.6
7.4
3.0
4.0
5.0
6.0
7.0
8.0
9.0
10.0
1990 1992 1994 1996 1998 2000 2002 2004 2006 2008 2010 2012
Une
mpl
oym
ent R
ate
State of Montana U.S.
Unemployment Rate State of Montana
1990–2013 BLS Data
21 Montana Consolidated Plan Focus Groups: May 1-2, 2014
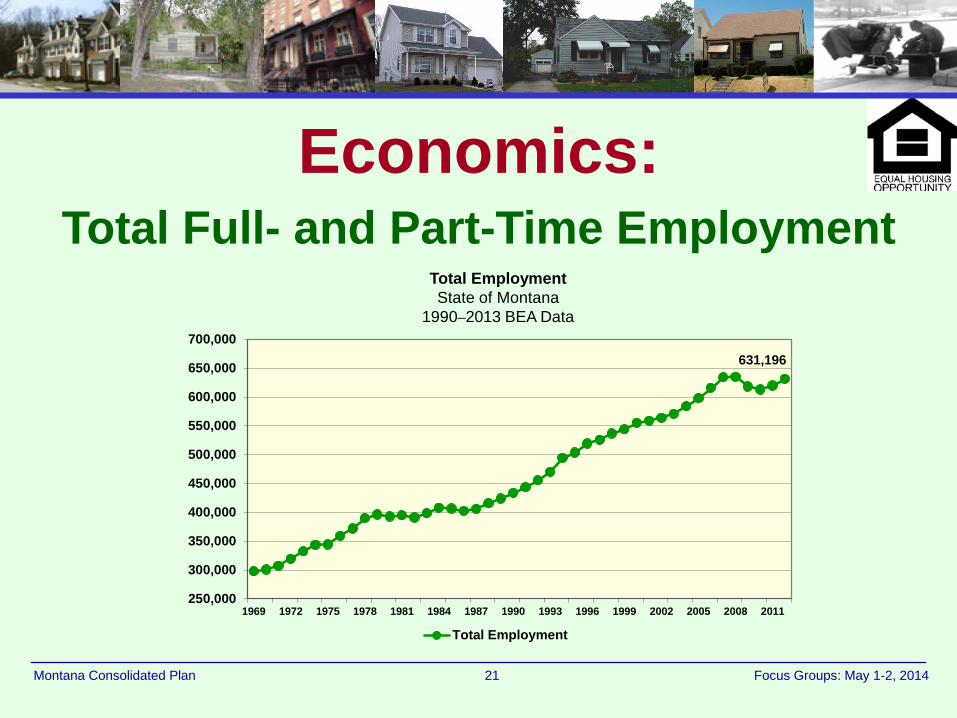
Economics: Total Full- and Part-Time Employment
631,196
250,000
300,000
350,000
400,000
450,000
500,000
550,000
600,000
650,000
700,000
1969 1972 1975 1978 1981 1984 1987 1990 1993 1996 1999 2002 2005 2008 2011
Total Employment
Total Employment State of Montana
1990–2013 BEA Data
22 Montana Consolidated Plan Focus Groups: May 1-2, 2014
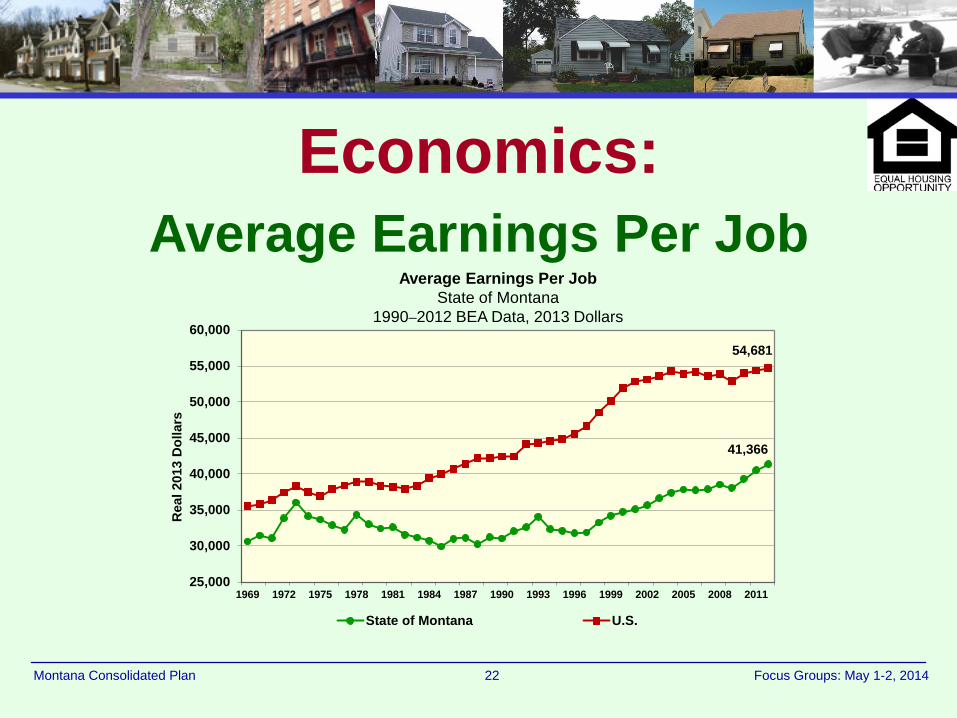
Economics: Average Earnings Per Job
41,366
54,681
25,000
30,000
35,000
40,000
45,000
50,000
55,000
60,000
1969 1972 1975 1978 1981 1984 1987 1990 1993 1996 1999 2002 2005 2008 2011
Rea
l 201
3 D
olla
rs
State of Montana U.S.
Average Earnings Per Job State of Montana
1990–2012 BEA Data, 2013 Dollars
23 Montana Consolidated Plan Focus Groups: May 1-2, 2014
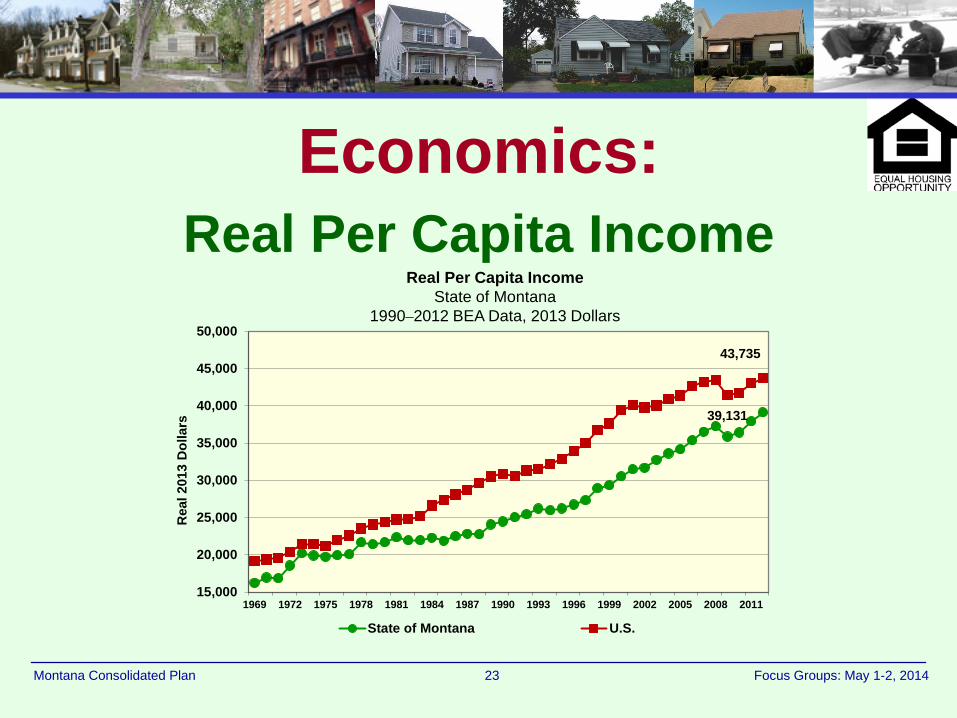
Economics: Real Per Capita Income
39,131
43,735
15,000
20,000
25,000
30,000
35,000
40,000
45,000
50,000
1969 1972 1975 1978 1981 1984 1987 1990 1993 1996 1999 2002 2005 2008 2011
Rea
l 201
3 D
olla
rs
State of Montana U.S.
Real Per Capita Income State of Montana
1990–2012 BEA Data, 2013 Dollars
24 Montana Consolidated Plan Focus Groups: May 1-2, 2014
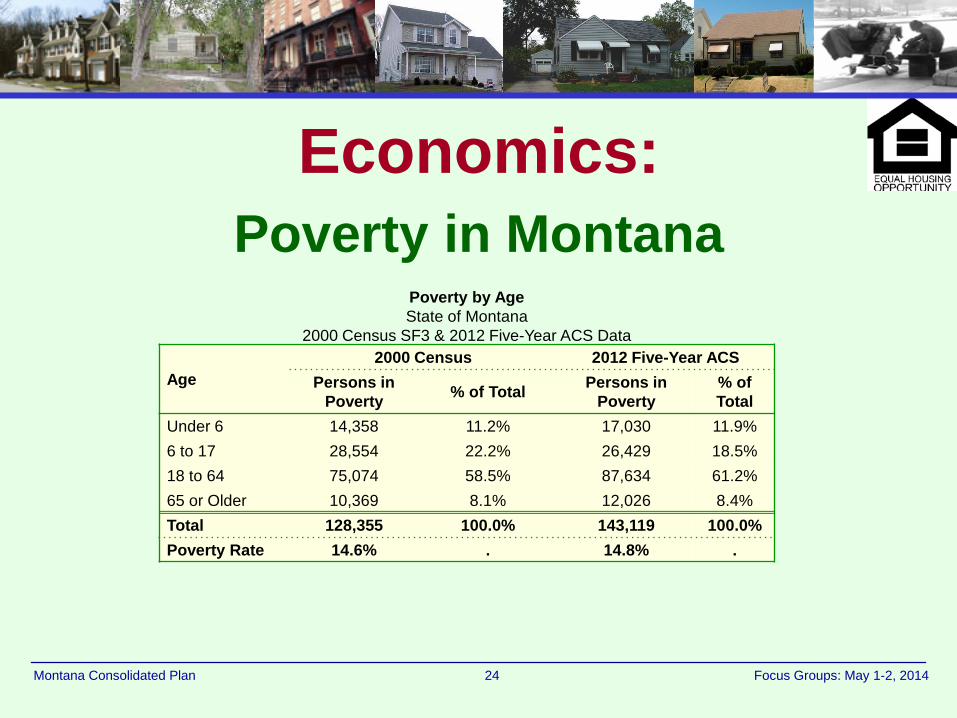
Economics: Poverty in Montana
Poverty by Age State of Montana
2000 Census SF3 & 2012 Five-Year ACS Data
Age 2000 Census 2012 Five-Year ACS
Persons in Poverty % of Total Persons in
Poverty % of Total
Under 6 14,358 11.2% 17,030 11.9% 6 to 17 28,554 22.2% 26,429 18.5% 18 to 64 75,074 58.5% 87,634 61.2% 65 or Older 10,369 8.1% 12,026 8.4% Total 128,355 100.0% 143,119 100.0% Poverty Rate 14.6% . 14.8% .
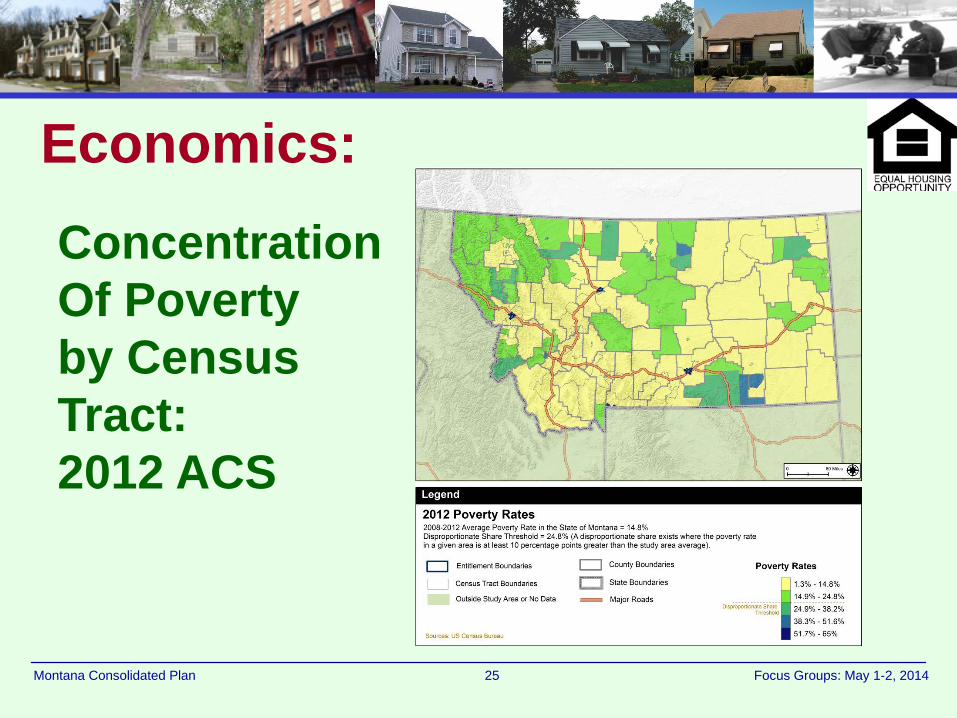
25 Montana Consolidated Plan Focus Groups: May 1-2, 2014
Concentration Of Poverty by Census Tract: 2012 ACS
Economics:
26 Montana Consolidated Plan Focus Groups: May 1-2, 2014
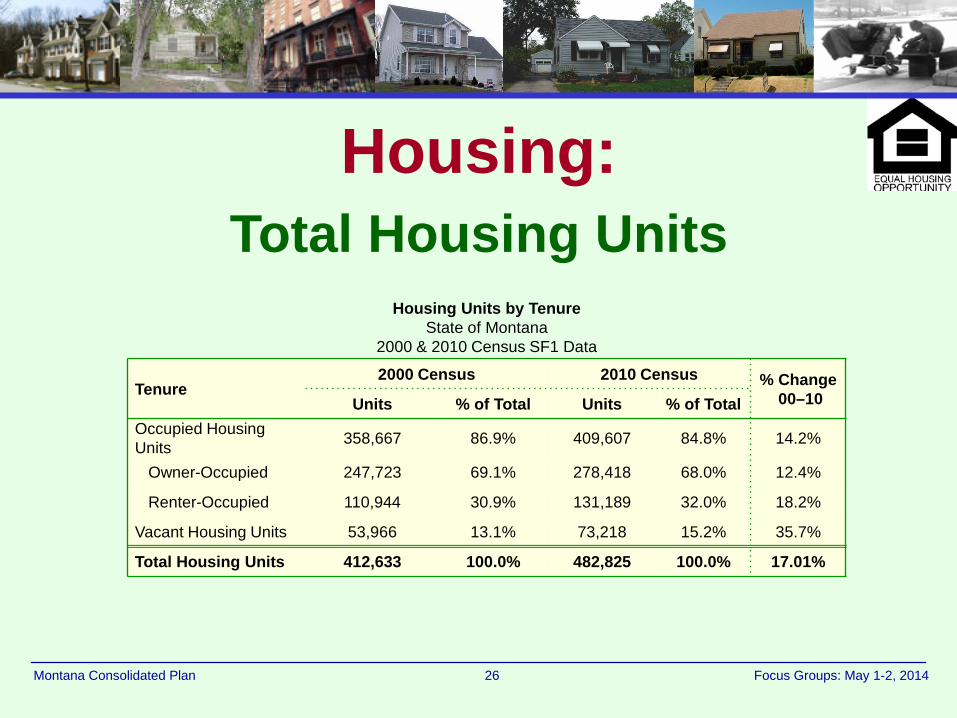
Housing: Total Housing Units
Housing Units by Tenure State of Montana
2000 & 2010 Census SF1 Data
Tenure 2000 Census 2010 Census % Change
00–10 Units % of Total Units % of Total Occupied Housing Units 358,667 86.9% 409,607 84.8% 14.2%
Owner-Occupied 247,723 69.1% 278,418 68.0% 12.4%
Renter-Occupied 110,944 30.9% 131,189 32.0% 18.2%
Vacant Housing Units 53,966 13.1% 73,218 15.2% 35.7%
Total Housing Units 412,633 100.0% 482,825 100.0% 17.01%
27 Montana Consolidated Plan Focus Groups: May 1-2, 2014
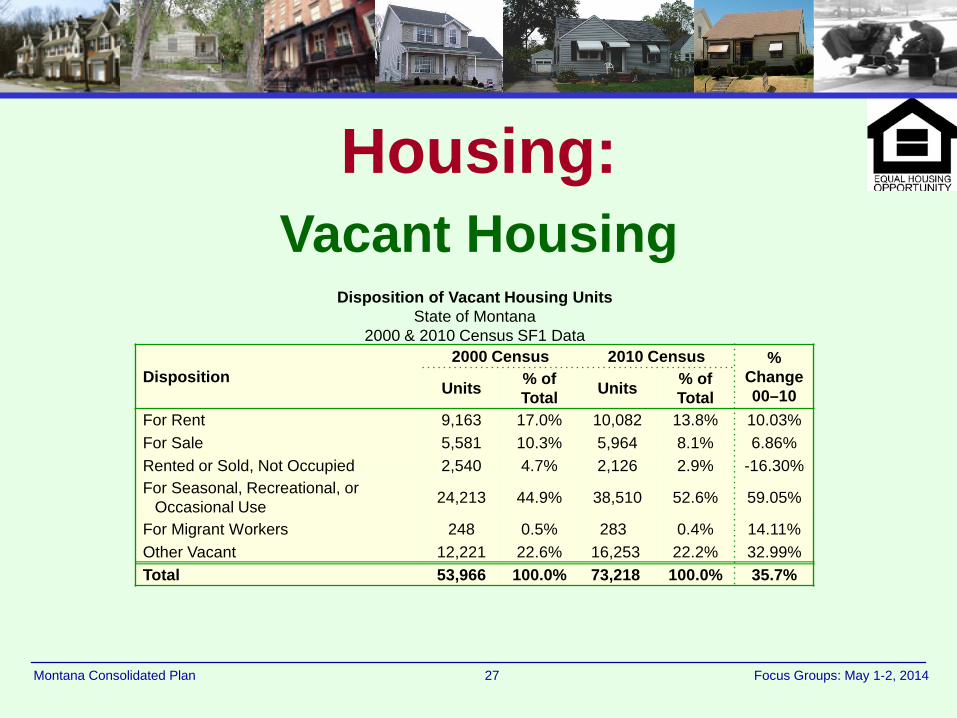
Housing: Vacant Housing
Disposition of Vacant Housing Units State of Montana
2000 & 2010 Census SF1 Data
Disposition 2000 Census 2010 Census %
Change 00–10 Units % of
Total Units % of Total
For Rent 9,163 17.0% 10,082 13.8% 10.03% For Sale 5,581 10.3% 5,964 8.1% 6.86% Rented or Sold, Not Occupied 2,540 4.7% 2,126 2.9% -16.30% For Seasonal, Recreational, or
Occasional Use 24,213 44.9% 38,510 52.6% 59.05%
For Migrant Workers 248 0.5% 283 0.4% 14.11% Other Vacant 12,221 22.6% 16,253 22.2% 32.99% Total 53,966 100.0% 73,218 100.0% 35.7%
28 Montana Consolidated Plan Focus Groups: May 1-2, 2014
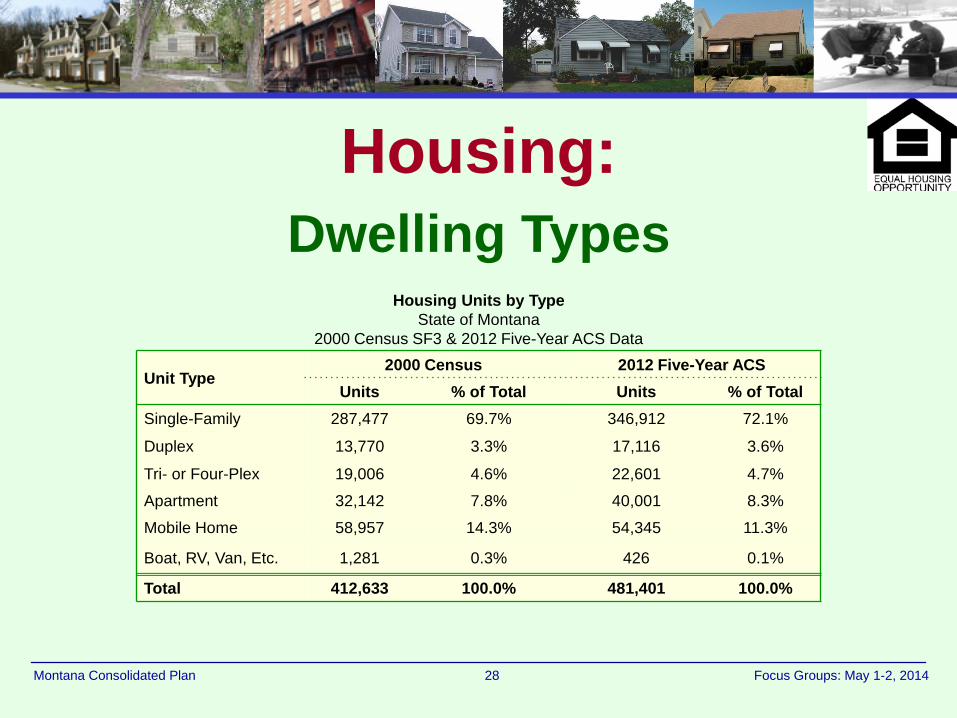
Housing: Dwelling Types
Housing Units by Type State of Montana
2000 Census SF3 & 2012 Five-Year ACS Data
Unit Type 2000 Census 2012 Five-Year ACS
Units % of Total Units % of Total Single-Family 287,477 69.7% 346,912 72.1%
Duplex 13,770 3.3% 17,116 3.6%
Tri- or Four-Plex 19,006 4.6% 22,601 4.7%
Apartment 32,142 7.8% 40,001 8.3%
Mobile Home 58,957 14.3% 54,345 11.3%
Boat, RV, Van, Etc. 1,281 0.3% 426 0.1%
Total 412,633 100.0% 481,401 100.0%
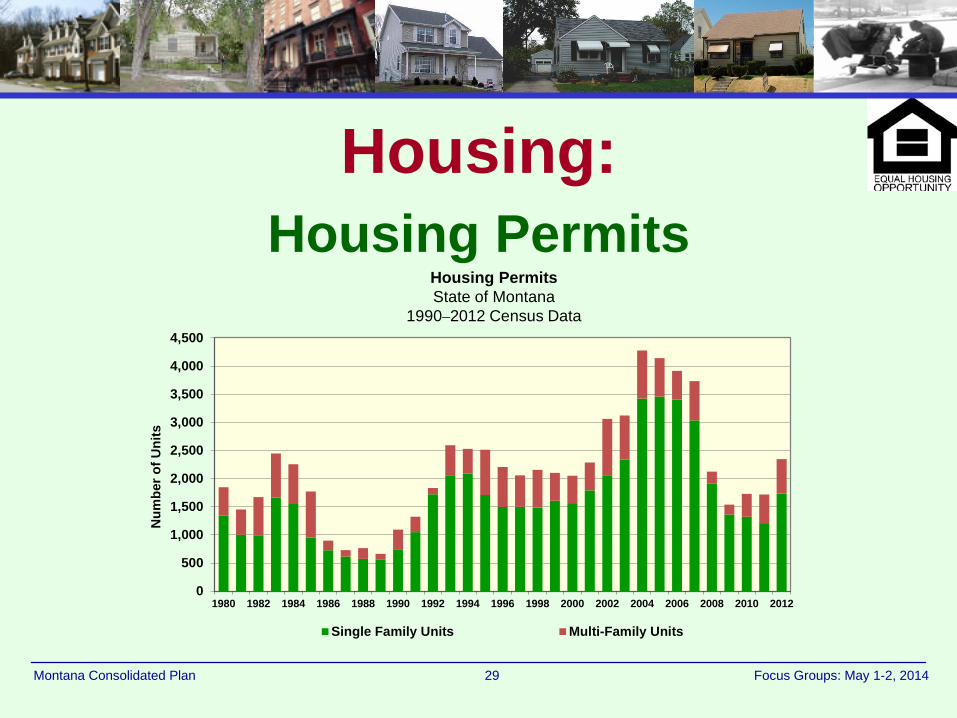
29 Montana Consolidated Plan Focus Groups: May 1-2, 2014
Housing: Housing Permits
0
500
1,000
1,500
2,000
2,500
3,000
3,500
4,000
4,500
1980 1982 1984 1986 1988 1990 1992 1994 1996 1998 2000 2002 2004 2006 2008 2010 2012
Num
ber o
f Uni
ts
Single Family Units Multi-Family Units
Housing Permits State of Montana
1990–2012 Census Data
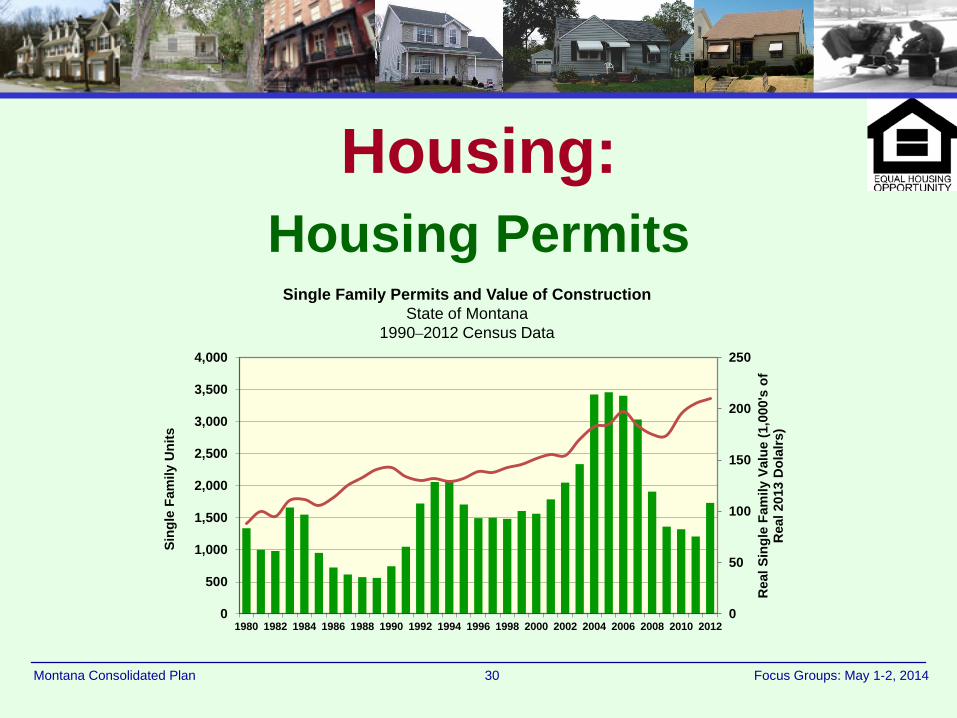
30 Montana Consolidated Plan Focus Groups: May 1-2, 2014
Housing: Housing Permits
Single Family Permits and Value of Construction State of Montana
1990–2012 Census Data
0
50
100
150
200
250
0
500
1,000
1,500
2,000
2,500
3,000
3,500
4,000
1980 1982 1984 1986 1988 1990 1992 1994 1996 1998 2000 2002 2004 2006 2008 2010 2012
Rea
l Sin
gle
Fam
ily V
alue
(1,0
00's
of
Rea
l 201
3 D
olal
rs)
Sing
le F
amily
Uni
ts
31 Montana Consolidated Plan Focus Groups: May 1-2, 2014
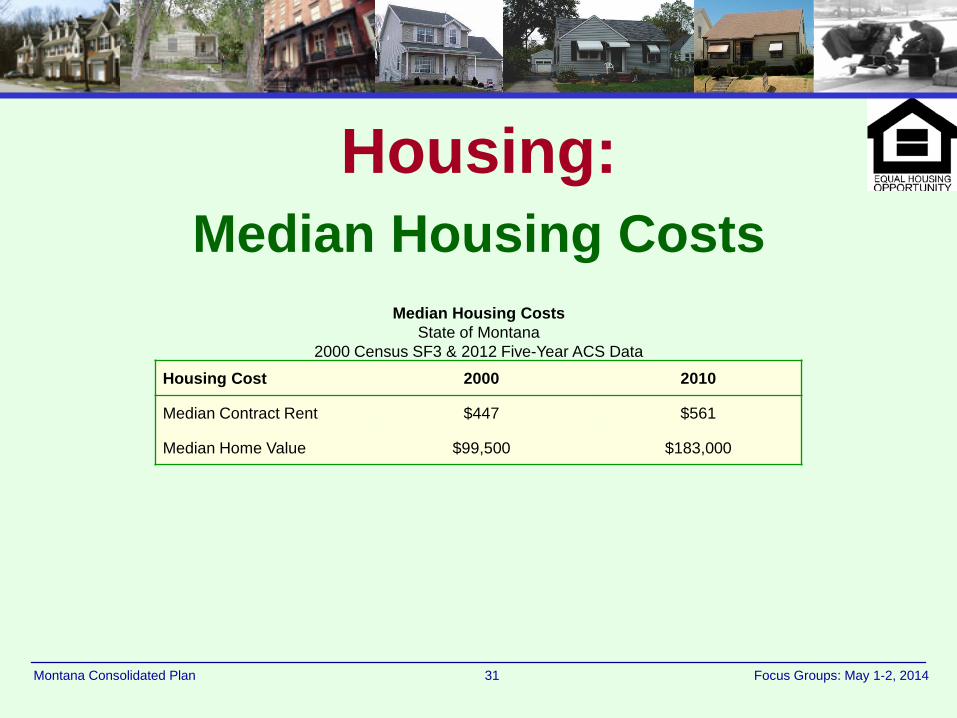
Housing: Median Housing Costs
Median Housing Costs State of Montana
2000 Census SF3 & 2012 Five-Year ACS Data
Housing Cost 2000 2010
Median Contract Rent $447 $561
Median Home Value $99,500 $183,000
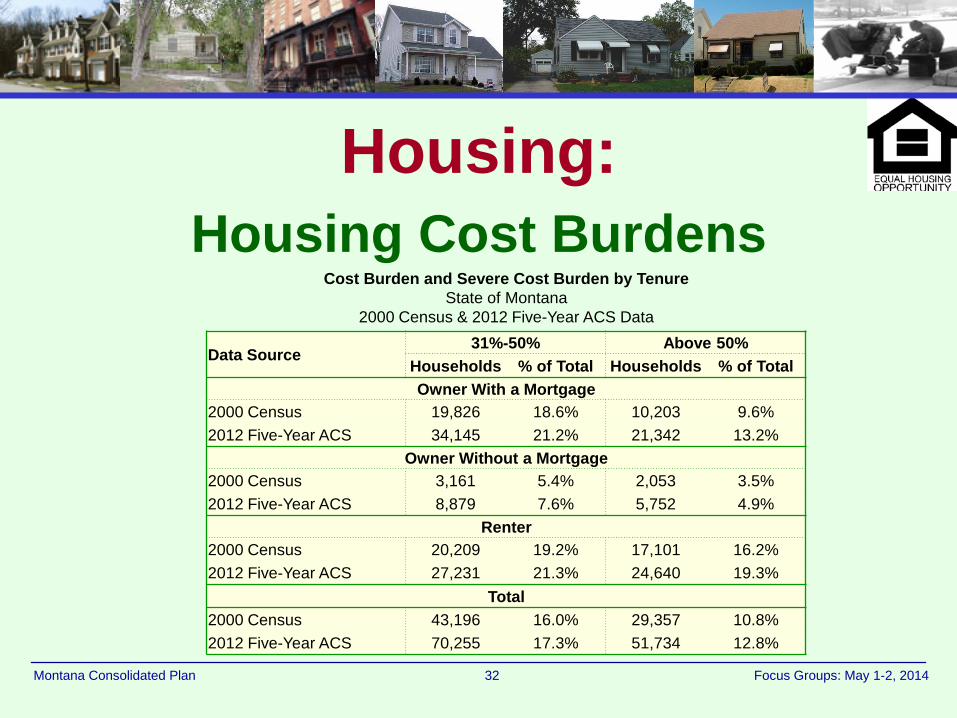
32 Montana Consolidated Plan Focus Groups: May 1-2, 2014
Housing: Housing Cost Burdens
Cost Burden and Severe Cost Burden by Tenure State of Montana
2000 Census & 2012 Five-Year ACS Data
Data Source 31%-50% Above 50%
Households % of Total Households % of Total Owner With a Mortgage
2000 Census 19,826 18.6% 10,203 9.6% 2012 Five-Year ACS 34,145 21.2% 21,342 13.2%
Owner Without a Mortgage 2000 Census 3,161 5.4% 2,053 3.5% 2012 Five-Year ACS 8,879 7.6% 5,752 4.9%
Renter 2000 Census 20,209 19.2% 17,101 16.2% 2012 Five-Year ACS 27,231 21.3% 24,640 19.3%
Total 2000 Census 43,196 16.0% 29,357 10.8% 2012 Five-Year ACS 70,255 17.3% 51,734 12.8%
33 Montana Consolidated Plan Focus Groups: May 1-2, 2014
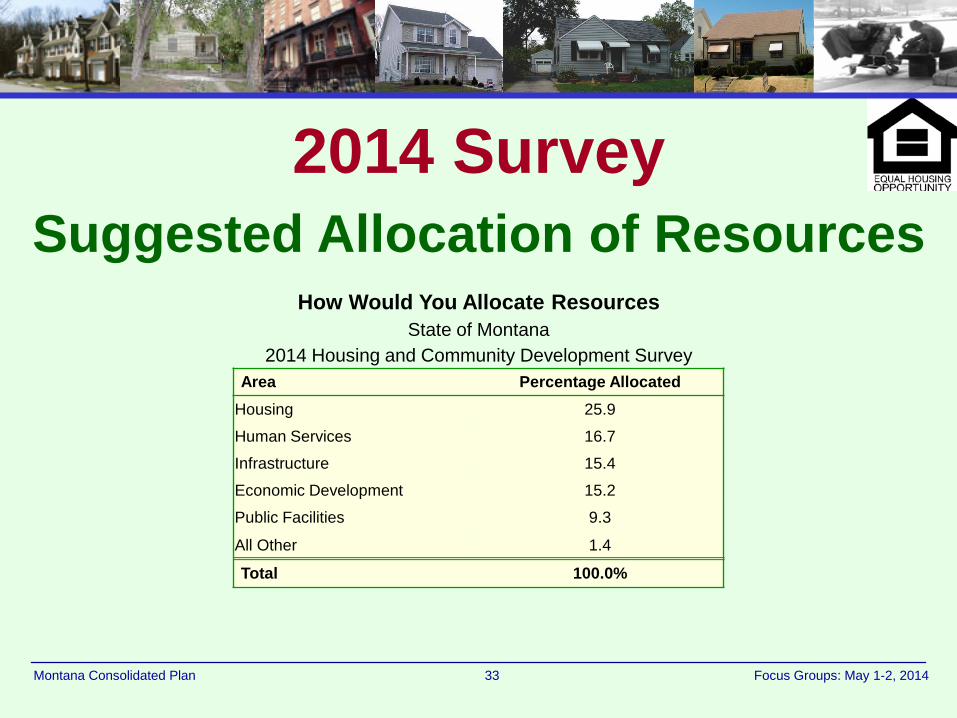
2014 Survey Suggested Allocation of Resources
How Would You Allocate Resources State of Montana
2014 Housing and Community Development Survey Area Percentage Allocated
Housing 25.9
Human Services 16.7
Infrastructure 15.4
Economic Development 15.2
Public Facilities 9.3
All Other 1.4
Total 100.0%
34 Montana Consolidated Plan Focus Groups: May 1-2, 2014
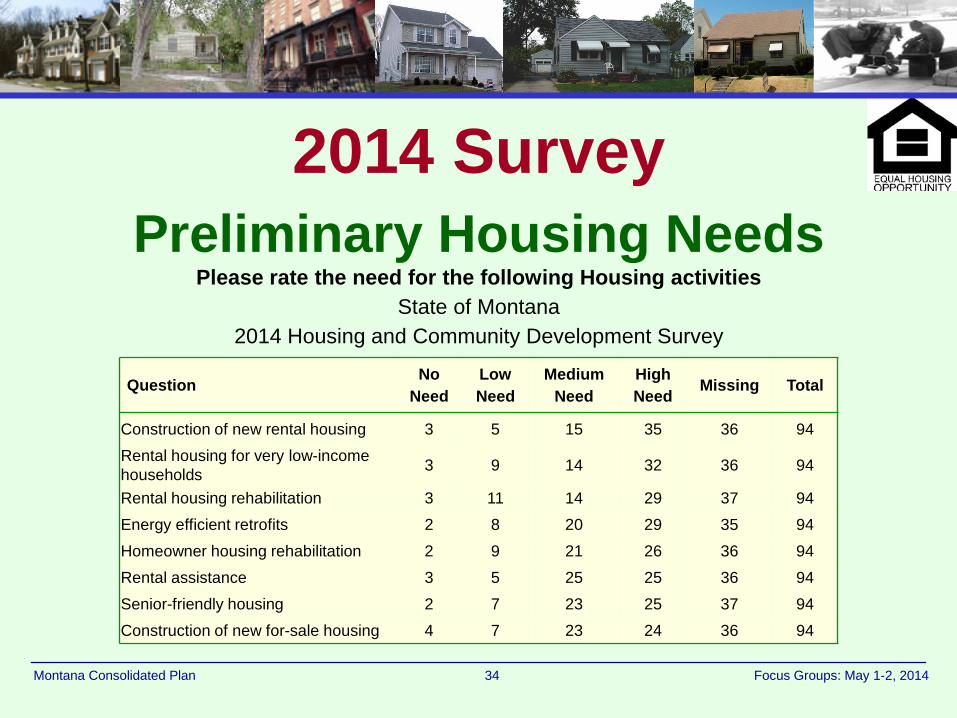
2014 Survey Preliminary Housing Needs
Please rate the need for the following Housing activities State of Montana
2014 Housing and Community Development Survey
Question No
Need Low Need
Medium Need
High Need
Missing Total
Construction of new rental housing 3 5 15 35 36 94 Rental housing for very low-income households 3 9 14 32 36 94
Rental housing rehabilitation 3 11 14 29 37 94 Energy efficient retrofits 2 8 20 29 35 94 Homeowner housing rehabilitation 2 9 21 26 36 94 Rental assistance 3 5 25 25 36 94 Senior-friendly housing 2 7 23 25 37 94 Construction of new for-sale housing 4 7 23 24 36 94
35 Montana Consolidated Plan Focus Groups: May 1-2, 2014
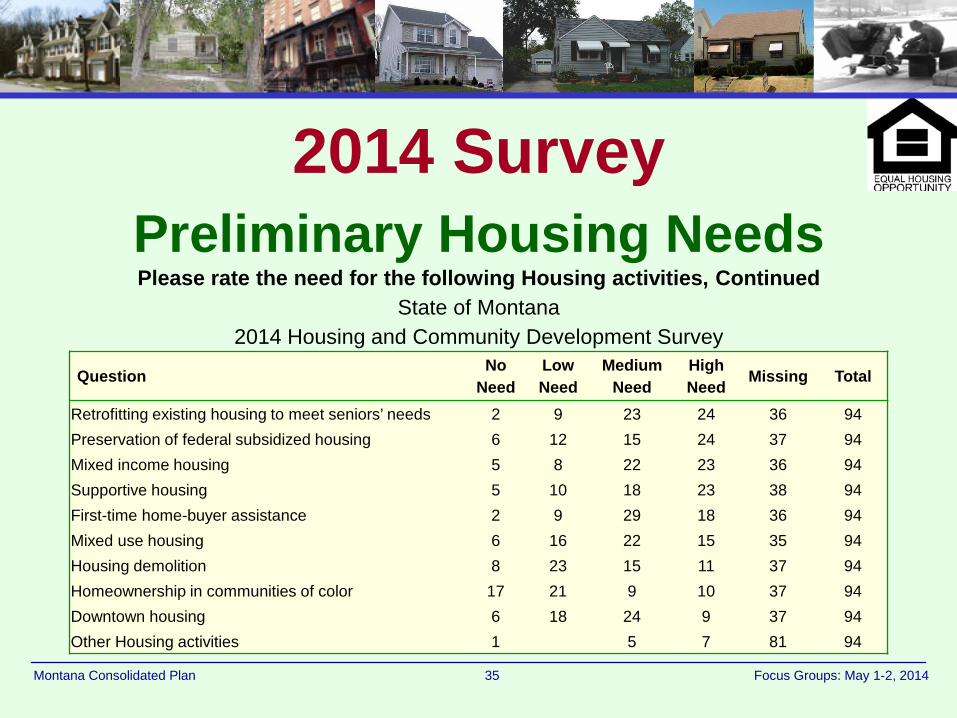
2014 Survey Preliminary Housing Needs Please rate the need for the following Housing activities, Continued
State of Montana 2014 Housing and Community Development Survey
Question No
Need Low Need
Medium Need
High Need
Missing Total
Retrofitting existing housing to meet seniors’ needs 2 9 23 24 36 94 Preservation of federal subsidized housing 6 12 15 24 37 94 Mixed income housing 5 8 22 23 36 94 Supportive housing 5 10 18 23 38 94 First-time home-buyer assistance 2 9 29 18 36 94 Mixed use housing 6 16 22 15 35 94 Housing demolition 8 23 15 11 37 94 Homeownership in communities of color 17 21 9 10 37 94 Downtown housing 6 18 24 9 37 94 Other Housing activities 1 5 7 81 94
36 Montana Consolidated Plan Focus Groups: May 1-2, 2014
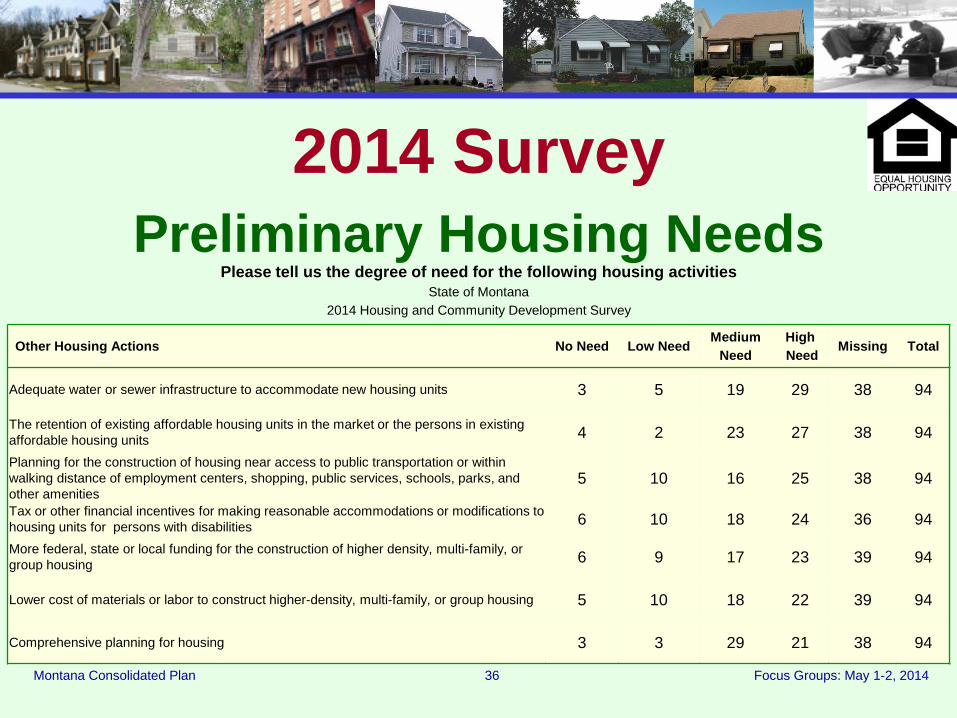
2014 Survey Preliminary Housing Needs
Please tell us the degree of need for the following housing activities State of Montana
2014 Housing and Community Development Survey
Other Housing Actions No Need Low Need Medium
Need High Need
Missing Total
Adequate water or sewer infrastructure to accommodate new housing units 3 5 19 29 38 94
The retention of existing affordable housing units in the market or the persons in existing affordable housing units 4 2 23 27 38 94
Planning for the construction of housing near access to public transportation or within walking distance of employment centers, shopping, public services, schools, parks, and other amenities
5 10 16 25 38 94
Tax or other financial incentives for making reasonable accommodations or modifications to housing units for persons with disabilities 6 10 18 24 36 94
More federal, state or local funding for the construction of higher density, multi-family, or group housing 6 9 17 23 39 94
Lower cost of materials or labor to construct higher-density, multi-family, or group housing 5 10 18 22 39 94
Comprehensive planning for housing 3 3 29 21 38 94
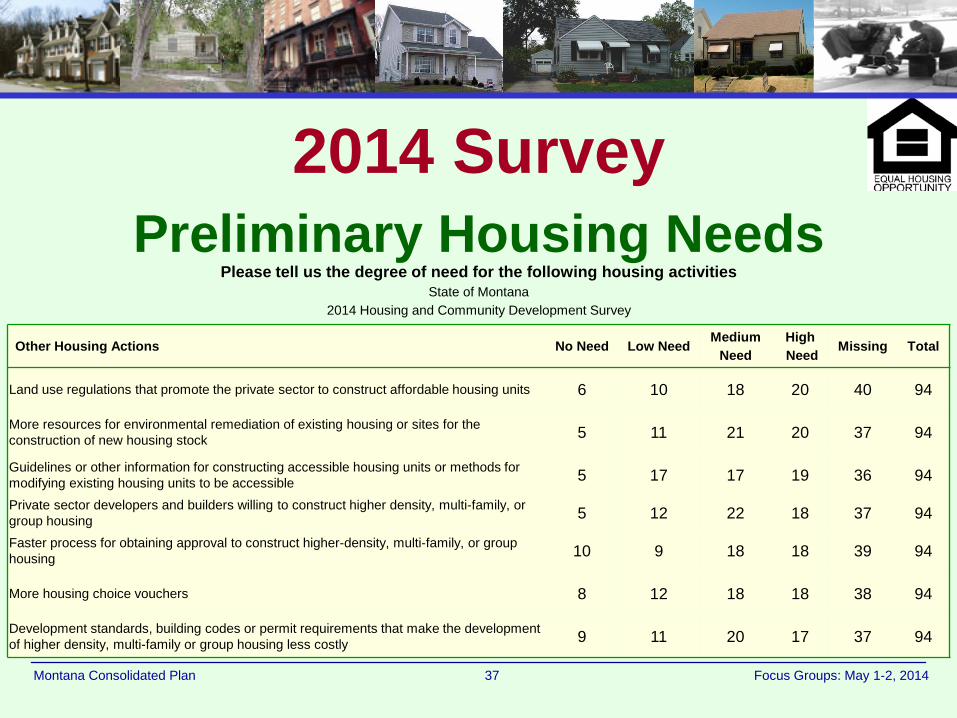
37 Montana Consolidated Plan Focus Groups: May 1-2, 2014
2014 Survey Preliminary Housing Needs
Please tell us the degree of need for the following housing activities State of Montana
2014 Housing and Community Development Survey
Other Housing Actions No Need Low Need Medium
Need High Need
Missing Total
Land use regulations that promote the private sector to construct affordable housing units 6 10 18 20 40 94
More resources for environmental remediation of existing housing or sites for the construction of new housing stock 5 11 21 20 37 94
Guidelines or other information for constructing accessible housing units or methods for modifying existing housing units to be accessible 5 17 17 19 36 94
Private sector developers and builders willing to construct higher density, multi-family, or group housing 5 12 22 18 37 94
Faster process for obtaining approval to construct higher-density, multi-family, or group housing 10 9 18 18 39 94
More housing choice vouchers 8 12 18 18 38 94
Development standards, building codes or permit requirements that make the development of higher density, multi-family or group housing less costly 9 11 20 17 37 94
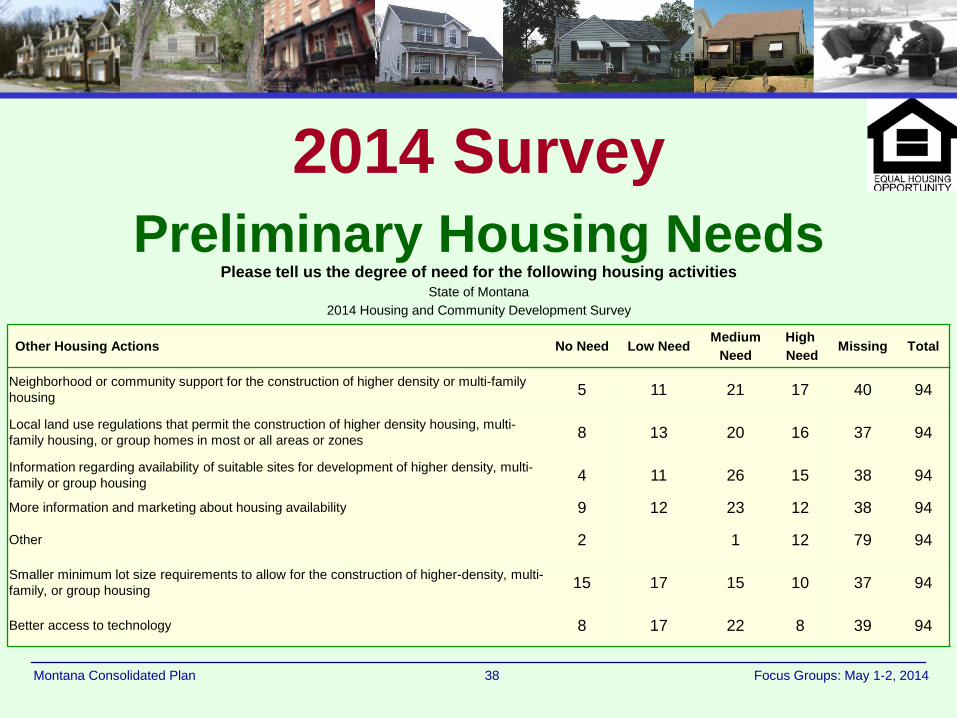
38 Montana Consolidated Plan Focus Groups: May 1-2, 2014
2014 Survey Preliminary Housing Needs
Please tell us the degree of need for the following housing activities State of Montana
2014 Housing and Community Development Survey
Other Housing Actions No Need Low Need Medium
Need High Need
Missing Total
Neighborhood or community support for the construction of higher density or multi-family housing 5 11 21 17 40 94
Local land use regulations that permit the construction of higher density housing, multi-family housing, or group homes in most or all areas or zones 8 13 20 16 37 94
Information regarding availability of suitable sites for development of higher density, multi-family or group housing 4 11 26 15 38 94
More information and marketing about housing availability 9 12 23 12 38 94
Other 2 1 12 79 94
Smaller minimum lot size requirements to allow for the construction of higher-density, multi-family, or group housing 15 17 15 10 37 94
Better access to technology 8 17 22 8 39 94
39 Montana Consolidated Plan Focus Groups: May 1-2, 2014
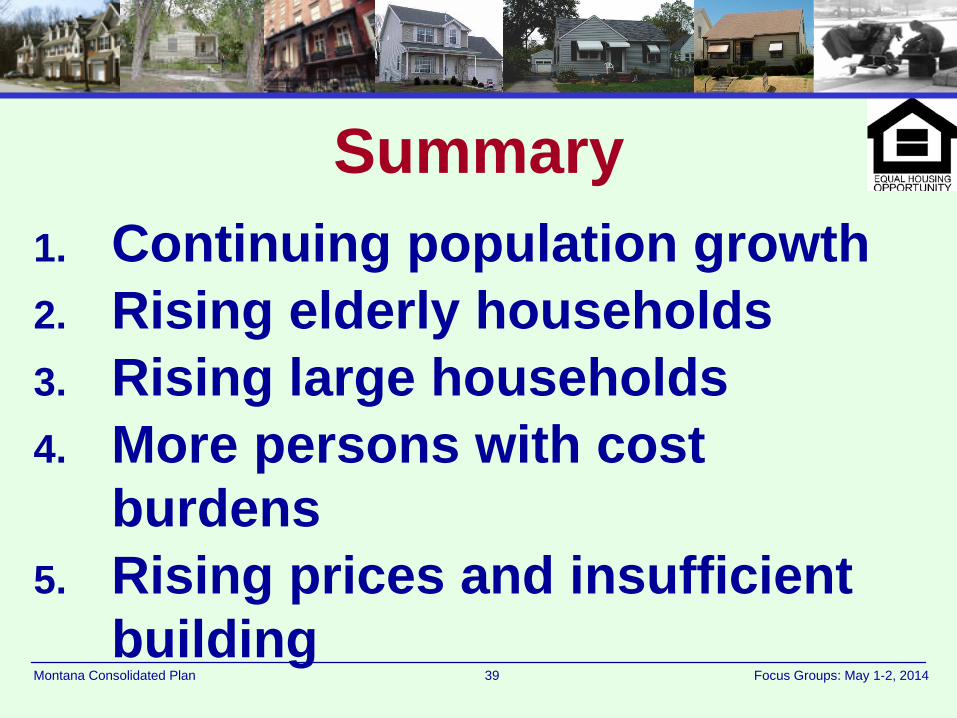
Summary
1. Continuing population growth 2. Rising elderly households 3. Rising large households 4. More persons with cost
burdens 5. Rising prices and insufficient
building
40 Montana Consolidated Plan Focus Groups: May 1-2, 2014
Discussion 1. What are our greatest needs? 2. What are our most difficult
barriers and constraints? 3. What can we do about these
barriers and constraints? 4. Are there other concerns?
41 Montana Consolidated Plan Focus Groups: May 1-2, 2014
Discussion 1. What activities should we
undertake in the next five years?
2. How can we influence local public policy?
3. Other?
42 Montana Consolidated Plan Focus Groups: May 1-2, 2014
Conclusion Contact Information:
Ms. Jennifer H. Olson Grants Bureau Chief
406-841-2770 [email protected]
Recommended