23.01.201816.01.2018 14.02.2018
Weekly report06/2018
Data source: MerlinX*
* MerlinX is one of the most popular reservation systems used by travel agency offices in Poland
23.01.201816.01.201814.02.2018
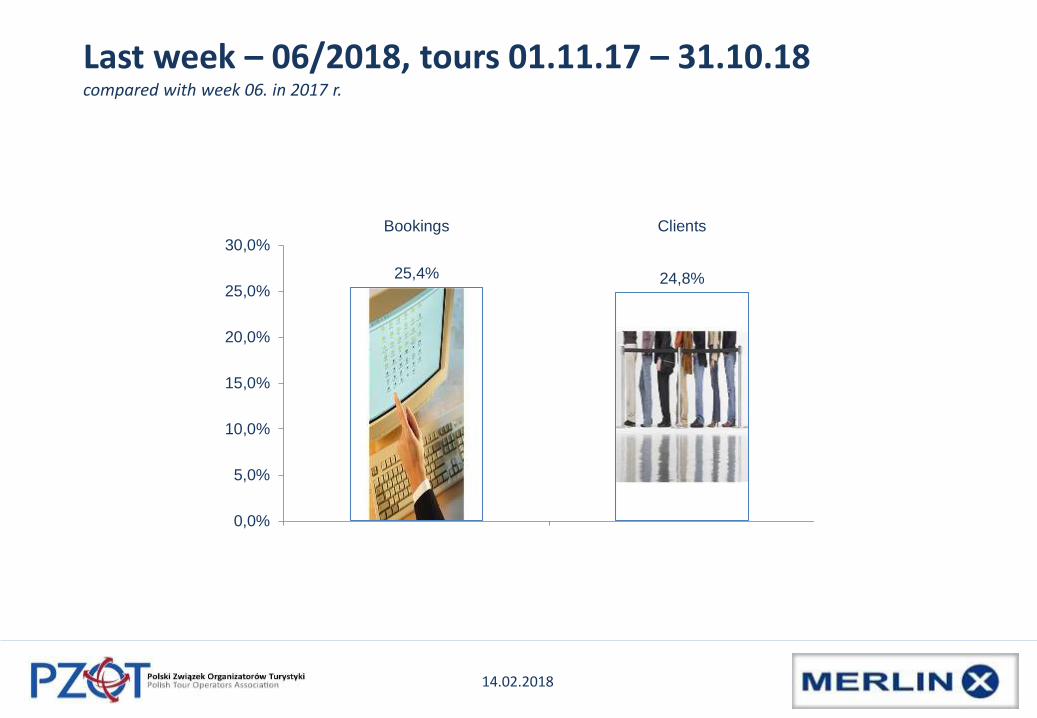
Last week – 06/2018, tours 01.11.17 – 31.10.18compared with week 06. in 2017 r.
25,4% 24,8%
0,0%
5,0%
10,0%
15,0%
20,0%
25,0%
30,0%
Bookings Clients

23.01.201816.01.201814.02.2018
Last week – 06/2018, tours 01.11.17 – 31.10.18compared with week 06. in 2017 r.
9,4%
6,5%
28,8%
Bus Own journey Flight
Clients +/-%Bus
6,7%
Own journey9,2%Flight
83,9%
Share %

23.01.201816.01.201814.02.2018
Ranking of the most popular countries & destinations in CW06tours from 01.11.17 to 31.10.18
2 1 3
Rank Country Price/booking Price/person
1 Grecja 7 146 2 656
2 Turcja 6 981 2 424
3 Egipt 5 657 2 286
4 Hiszpania 6 859 2 863
5 Bułgaria 5 274 1 991
6 Włochy 5 324 2 294
7 Albania 4 859 1 963
8 Chorwacja 4 054 1 674
9 Tunezja 5 001 1 936
10 Portugalia 7 036 3 035
Rank Destination Price/booking Price/person
1 Antalya 6 855 2 389
2 Hurghada 5 386 2 242
3 Burgas 5 863 2 063
4 Heraklion 7 325 2 695
5 Korfu 5 628 2 200
6 Zakynthos 7 011 2 657
7 Tirana 5 698 2 233
8 Bodrum 5 890 2 272
9 Marsa Alam 5 133 2 296
10 Sharm El Sheikh 5 334 2 181
11 Varna 4 544 1 851
12 Chania 8 667 3 063
13 Rodos 6 151 2 386
14 Alanya 6 355 2 268
15 Monastyr 4 645 1 852
16 CHORWACJA 4 236 1 841
17 Kos 7 997 2 839
18 Malta 3 245 1 556
19 Girona 5 392 2 231
20 Majorka 6 924 2 935
23.01.201816.01.201814.02.2018
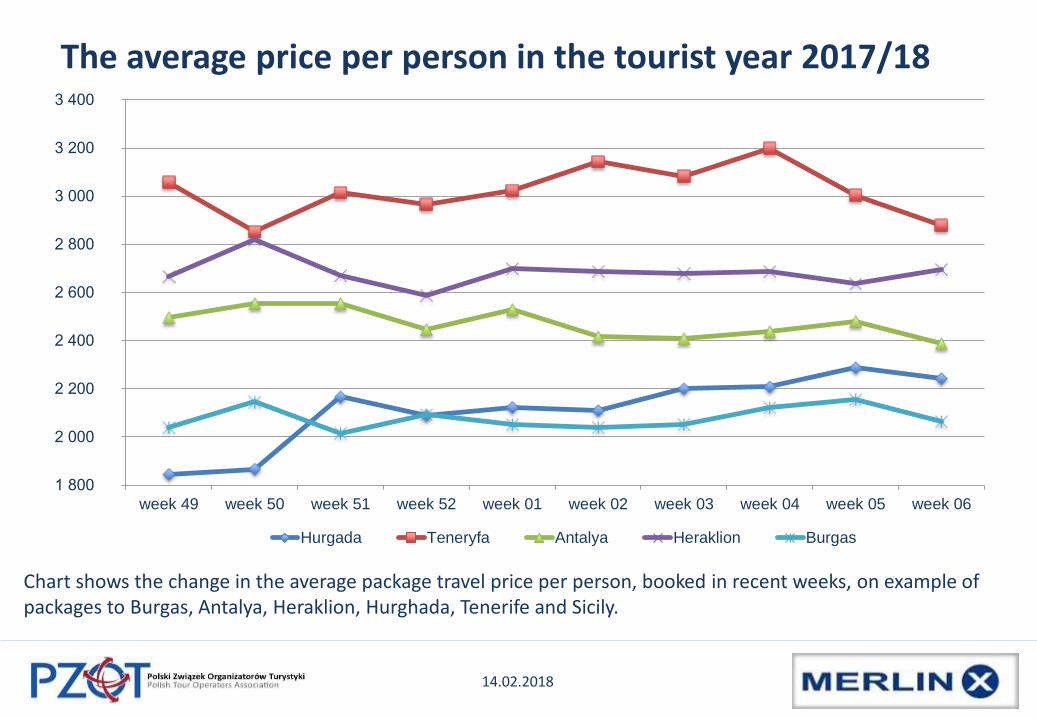
The average price per person in the tourist year 2017/18
Chart shows the change in the average package travel price per person, booked in recent weeks, on example ofpackages to Burgas, Antalya, Heraklion, Hurghada, Tenerife and Sicily.
1 800
2 000
2 200
2 400
2 600
2 800
3 000
3 200
3 400
week 49 week 50 week 51 week 52 week 01 week 02 week 03 week 04 week 05 week 06
Hurgada Teneryfa Antalya Heraklion Burgas

23.01.201816.01.201814.02.2018
Average price per booking and the price per person in 06. week
7 146 6 981
5 657
6 859
5 274 5 324
4 859
4 054
5 001
7 036
2 6562 424 2 286
2 863
1 9912 294
1 9631 674
1 936
3 035
Grecja Turcja Egipt Hiszpania Bułgaria Włochy Albania Chorwacja Tunezja Portugalia
Price/booking Price/person
23.01.201816.01.201814.02.2018
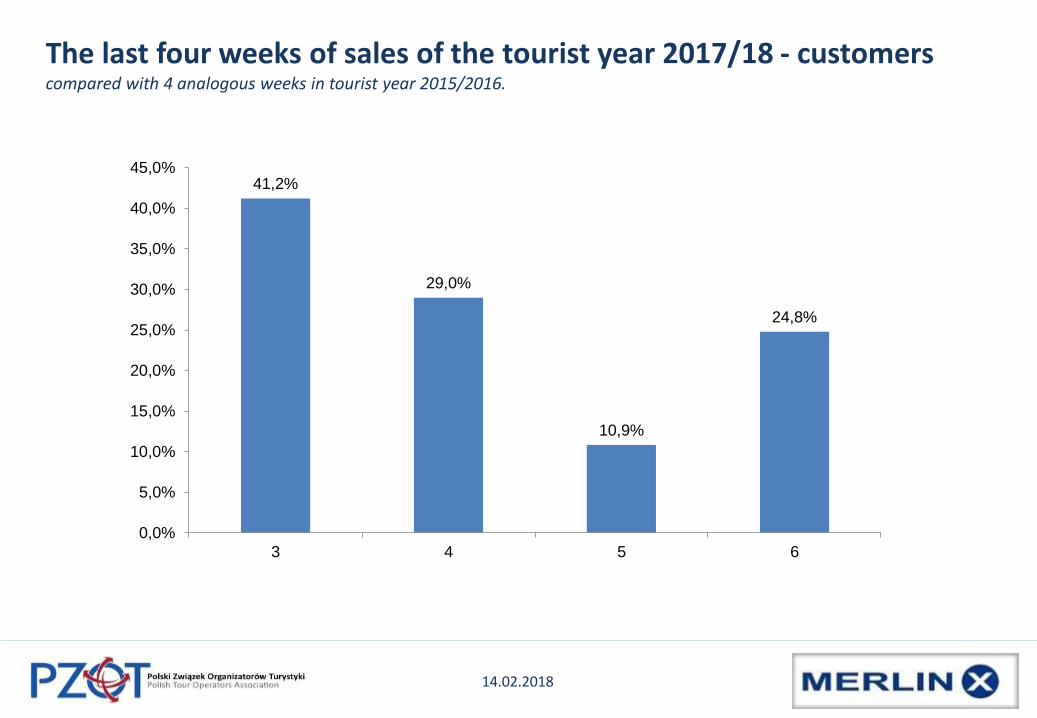
The last four weeks of sales of the tourist year 2017/18 - customerscompared with 4 analogous weeks in tourist year 2015/2016.
41,2%
29,0%
10,9%
24,8%
0,0%
5,0%
10,0%
15,0%
20,0%
25,0%
30,0%
35,0%
40,0%
45,0%
3 4 5 6

23.01.201816.01.201814.02.2018
The sales trend of the last four weekscompared with 4 analogous weeks in tourist year 2016/2017.
31,3%
10,5%
0,7%
26,3%
0%
5%
10%
15%
20%
25%
30%
35%
Flight Bus Own journey Total
Clients +/- %
Flight85,0%
Bus6,2%
Own journey8,6%
Share %

23.01.201816.01.201814.02.2018
Weekly sales compared with the previous tourist year
40 41 42 43 44 45 46 47 48 49 50 51 52 1 2 3 4 5 6 7 8 9 10 11 12 13 14 15 16 17 18 19 20 21 22 23 24 25 26 27 28 29 30 31 32 33 34 35 36 37 38 39 40 41 42 43
Bookings weekly 17/18 vs. 16/17
2017/18 2016/17

23.01.201816.01.201814.02.2018
Cumulative sales of 2017/18compared to sales in the same period last tourist year 2016/17
14,1%
10,7%
35,63%
31,2%
Bus Own journey Flight Total
Clients +/- %
Bus6,1%
Own journey9,9%
Flight83,9%
Share %
23.01.201816.01.201814.02.2018
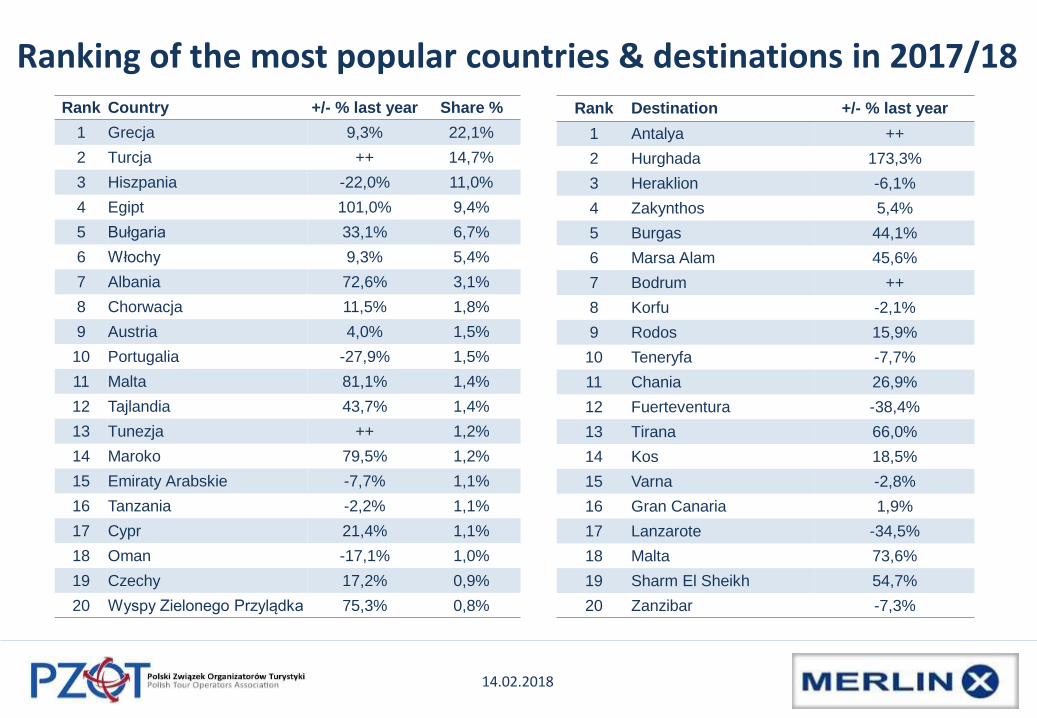
Ranking of the most popular countries & destinations in 2017/18Rank Destination +/- % last year
1 Antalya ++
2 Hurghada 173,3%
3 Heraklion -6,1%
4 Zakynthos 5,4%
5 Burgas 44,1%
6 Marsa Alam 45,6%
7 Bodrum ++
8 Korfu -2,1%
9 Rodos 15,9%
10 Teneryfa -7,7%
11 Chania 26,9%
12 Fuerteventura -38,4%
13 Tirana 66,0%
14 Kos 18,5%
15 Varna -2,8%
16 Gran Canaria 1,9%
17 Lanzarote -34,5%
18 Malta 73,6%
19 Sharm El Sheikh 54,7%
20 Zanzibar -7,3%
Rank Country +/- % last year Share %
1 Grecja 9,3% 22,1%
2 Turcja ++ 14,7%
3 Hiszpania -22,0% 11,0%
4 Egipt 101,0% 9,4%
5 Bułgaria 33,1% 6,7%
6 Włochy 9,3% 5,4%
7 Albania 72,6% 3,1%
8 Chorwacja 11,5% 1,8%
9 Austria 4,0% 1,5%
10 Portugalia -27,9% 1,5%
11 Malta 81,1% 1,4%
12 Tajlandia 43,7% 1,4%
13 Tunezja ++ 1,2%
14 Maroko 79,5% 1,2%
15 Emiraty Arabskie -7,7% 1,1%
16 Tanzania -2,2% 1,1%
17 Cypr 21,4% 1,1%
18 Oman -17,1% 1,0%
19 Czechy 17,2% 0,9%
20 Wyspy Zielonego Przylądka 75,3% 0,8%

23.01.201816.01.201814.02.2018
Ostrzeżenie
PZOT nie ponosi odpowiedzialności za komentarze publikowane w oparciu o dane zawarte w tym raporcie.
W mediach branżowych, portalach turystycznych i blogach tzw. ekspertów od turystyki można znaleźć,
każdorazowo po publikacji kolejnego raportu tygodniowego, komentarze w których autorzy podejmują
próby interpretowania treści raportu.
Autorom komentarzy bardzo dziękujemy za ich zainteresowanie raportami PZOT.
Często publikowane opinie dalece odbiegają od rzeczywistości prezentowanej w raporcie.
PZOT gwarantuje, że dane zawarte w raporcie tygodniowym są wiernym odzwierciedleniem stanu bazy
danych systemu MerlinX w dniu publikacji raportu.
Warning
PZOT is not responsible for comments published on the basis of the data contained in this report.
In trade media, tourist portals and blogs of so-called tourism experts, comments can be found, each time
after the publication of the next weekly report, in which the authors make attempts to interpret the content
of the report.
We thank the authors of the comments for their interest in the PZOT reports.
Often, opinions published deviate significantly from the reality presented in the report.
PZOT fully guarantees that the data contained in the weekly report is a true reflection of the state of the
MerlinX database on the date of publication of the report.

23.01.201816.01.201814.02.2018
Detailed reports are available for PZOT membersQuestions regarding market data please send to [email protected]
Recommended