Institute of Economics IE SB RAS,Novosibirsk State University
Russia
Tagaeva T., Gilmundinov V.
Ways to Improve Environmental Policy in Russia
Inforum 2014 Conference, Alexandria, USA

OutlineTopicalityModel complexResultsConclusions
Inforum 2014 Conference, Alexandria, USA

Russia in the World
CO2 emissionmln tons % in the world
emissionChine 8476,6 27,3USA 5459,7 17,6India 2168,5 6,9Russia 1642,7 5,3Japan 1149,5 3,7Germany 765,1 2,5Iran 608,2 2,0

Stationary emission (mln. tons) andGDP (bln. Rbl, before 1998 - trln. Rbl, prices of 2000)
0
5
10
15
20
25
30
1992 1993 1994 1995 1996 1997 1998 1999 2000 2001 2002 2003 2004 2005 2006 2007 2008 2009 2010 2011
Emission GDP
Inforum 2014 Conference, Alexandria, USA
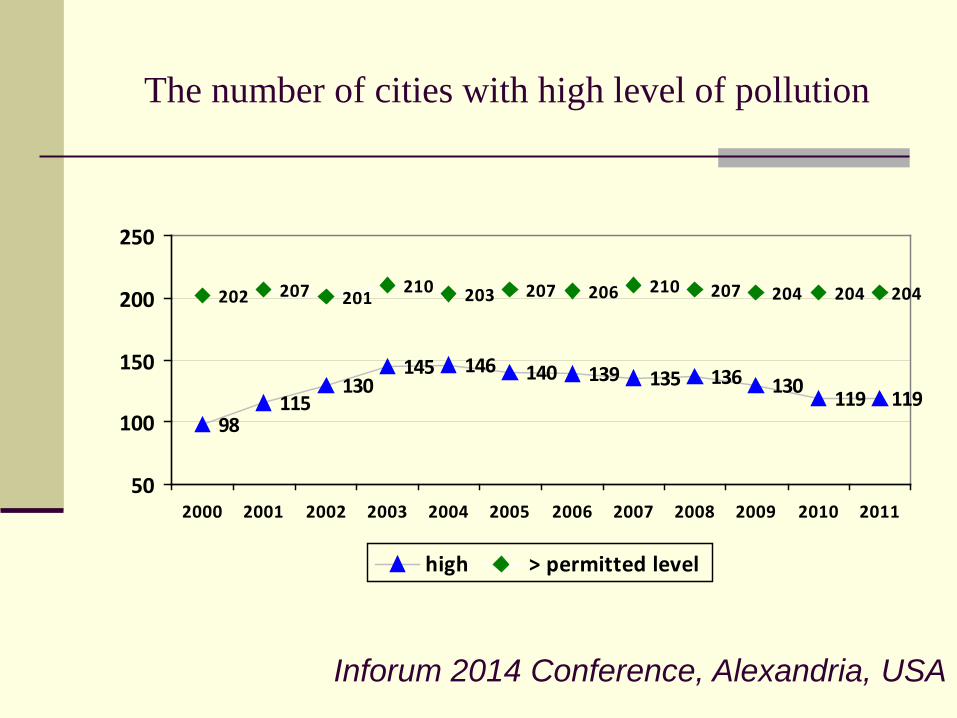
The number of cities with high level of pollution
98
145 140 135 130 119 119
202 207 201 210 203 207 206 210 207 204 204 204
146130 139 136
115
50
100
150
200
250
2000 2001 2002 2003 2004 2005 2006 2007 2008 2009 2010 2011
high > permitted level
Inforum 2014 Conference, Alexandria, USA

Motor transport emission of polluting substances into atmosphere (thousand tons)
10000
11000
12000
13000
14000
15000
16000
17000
18000
1995 1996 1997 1998 1999 2000 2001 2002 2003 2004 2005 2006 2007 2008 2009 2010 2011

The proportion of sewage purification and pollution liquidation in total volume of their formation (%) in Russia
01020304050607080
1985 1990 1995 2000 2005 2008 2011
Sew age pur if ication Pollution liquidation

Morbidity in Russia(registered patients with the first diagnosed disease for every thousand people)
600
650
700
750
800
850
92 93 94 95 96 97 98 99 2000 2001 2002 2003 2004 2005 2006 2007 2008 2009 2010 2011
Inforum 2014 Conference, Alexandria, USA

Morbidity of Cancer in Russia(registered patients with the first diagnosed disease for every
thousand people)
56789
1011121314
1995 1996 1997 1998 1999 2000 2001 2002 2003 2004 2005 2006 2007 2008 2009 2010 2011
North-West Federal Okrug Privolzhskiy Federal OkrugUrals Federal Okrug Siberian Federal OkrugFar East Federal Okrug
Inforum 2014 Conference, Alexandria, USA
0
50
100
150
200
250
300
35019
95
1996
1997
1998
1999
2000
2001
2002
2003
2004
2005
2006
2007
2008
2009
2010
2011
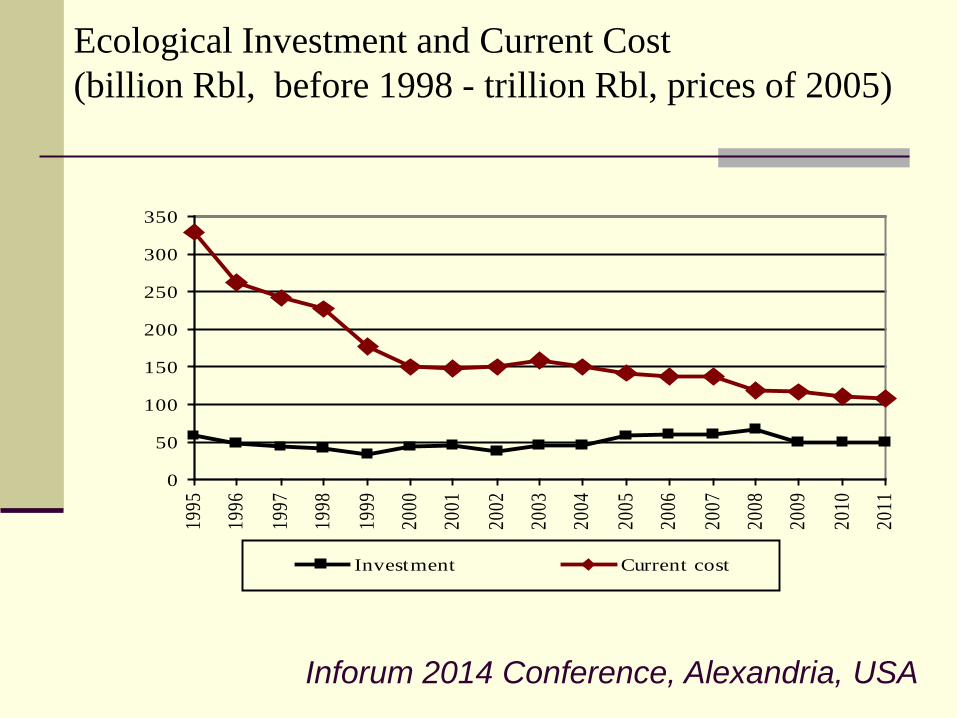
Investment Current cost
Ecological Investment and Current Cost(billion Rbl, before 1998 - trillion Rbl, prices of 2005)
Inforum 2014 Conference, Alexandria, USA

Environmental Protection Cost in 2005-2009($ per 1000 $ of GDP)
0 5 10 15 20 25
Great Britain (2005) Finland (2005) Germany (2007) The Netherlands (2007) Austria (2007)
USA (2006) Bulgaria (2005) Greece (2007) Russia (2009)

Putting into Operation of Environmental Fixed Assets
1990 1997 2005 2009 2011
Putting into service the production facilities for sewage treatment (thou cubic m per day)
2000
1004
1300
1500
700
Putting into service the production facilities for pollution trapping (thou cubic m hour )
16400
3101
4200
3600
9700
Inforum 2014 Conference, Alexandria, USA

Pollution taxes for SO2 and NOx in 2005(euro per ton)
Country Pollution taxesSO2 NOx
Czech Republic 28 22Estonia 3,52 8,5Poland 85 85Slovakia 22,7 18,2Slovenia 14 -Finland 17,1 -France 27,4 38,1Italy 53,2 105Russia 2,6 5,5

Model Complex of Forecast Calculations
X ii = 1,..,n
X n+hh = 1,..,m
DynamicInput-Output Model
of Russia
Block of EnvironmentalProtection
generation ofpollution
liquidation of pollution
emission

( ) ( ) ( ) ( ) ( )( )tmnxtnxtnxtxtx ++= ,...,1,,...,1( ) nitix ,...,1, = - gross output of industry i in year t
( )thnx + h=1,…,m - current environmental protection cost for natural resource h
)()()(1
)( thDtixtn
ihwtghV +∑
==
i
wih – coefficient of pollutant h generation (volume of polluted natural resource h, referred to manufacturing of a unit of production of industry i)
)(thD - output of pollutant h (volume of pollution or destruction of a natural resource) inhousehold.
)()(1
)( tlihVt
nihgthnx ∑
==+ i
gih (t) – current cost to recover unit of natural resource h (to destroy or to trap unit of pollutant h) in industry i
lhV (t) – volume of a recovered natural resource (destroyed or trapped pollutant) of type h
)()()( tlhVtg
hVtphV −=
)(1
)( tlihV
ntl
hV ∑=
=i
- volume of pollutant h (a polluted natural resource) that gets into the natural environment without purification (or by volume of destroyed but not reproduced natural resource)

Forecast key factors of national economy in Russia in 2014-2020
2014 2015 2016 2017 2018 2019 2020
Urals Price (in USD per barrel)
101.6 103.7 105.7 107.8 110.0 112.2 114.4
Change in GDP (in %) +2.3 +2.5 +2.8 +3.0 +3.6 +3.9 +4.1
Change in M2 (in %) +10 +10 +10 +10 +10 +10 +10

Forecast industry outputs in 2014-2020 (growth rate, % )The industries 2014 2015 2016 2017 2018 2019 2020
Agriculture 102.3 103.9 102.5 102.6 102.7 102.9 103.0
Coal 97.4 104.6 101.8 102.9 103.3 103.8 104.3
Oil 100.9 101.5 101.0 101.0 101.0 101.0 101.0
Gas 100.9 101.5 101.0 101.0 101.0 101.0 101.0
Other minerals 103.7 99.3 102.0 104.0 103.2 103.7 104.1
Food industry 101.6 103.0 103.6 103.1 103.3 103.4 103.5
Light industry 102.2 101.7 104.6 104.8 104.7 105.2 105.6
Logging, wood-working, pulp and paper 96.9 91.7 95.4 97.5 96.7 97.3 97.7
Oil products and coke 103.8 102.4 102.0 103.0 102.6 102.6 102.7
Chemical and petrochemical industry 106.5 100.8 105.8 107.7 107.1 107.8 108.3
Other non-metal mineral products 100.8 100.4 100.8 102.8 101.8 102.4 102.9
Metallurgy 99.5 96.4 102.5 101.8 102.0 103.0 103.8
Metal-working industry 101.9 99.0 103.9 104.9 104.5 105.3 105.8
Machine-building industry 104.1 95.8 99.8 105.1 102.9 104.1 105.0
Power engineering 102.7 99.9 101.3 102.6 102.1 102.4 102.6
Collection, sewage treatment and distribution of water 102.7 99.9 101.3 102.6 102.1 102.4 102.6
Construction 103.7 102.2 96.4 100.4 98.5 98.5 98.6
Trade 105.6 105.7 102.3 104.3 103.3 103.4 103.4
Transport and communication 104.8 103.8 102.0 103.8 103.0 103.1 103.2
Services 103.0 104.4 101.4 103.7 103.0 103.3 103.6
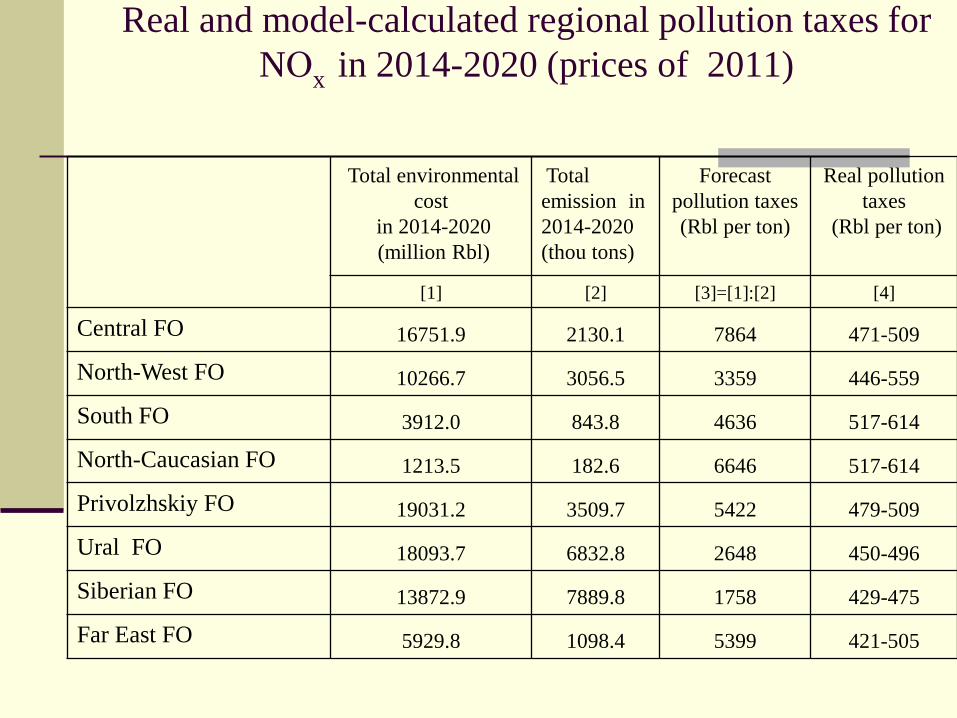
Real and model-calculated regional pollution taxes for NОx in 2014-2020 (prices of 2011)
Total environmentalcost
in 2014-2020(million Rbl)
Total emission in 2014-2020(thou tons)
Forecast pollution taxes(Rbl per ton)
Real pollution taxes
(Rbl per ton)
[1] [2] [3]=[1]:[2] [4]
Central FO 16751.9 2130.1 7864 471-509
North-West FO 10266.7 3056.5 3359 446-559
South FO 3912.0 843.8 4636 517-614
North-Caucasian FO 1213.5 182.6 6646 517-614
Privolzhskiy FO 19031.2 3509.7 5422 479-509
Ural FO 18093.7 6832.8 2648 450-496
Siberian FO 13872.9 7889.8 1758 429-475
Far East FO 5929.8 1098.4 5399 421-505

Conclusions
The Russian ecological situation is gettingworse. The health and demographic situationin Russia very strongly depends onenvironment. Significant deterioration ofenvironment attends high morbidity andmortality. In 2011 the number of cities withnegative ecological situation was 119 (in2000 it was 98). The number of yearlyregistered patients with the first diagnoseddisease for every thousand people hasincreased by 30% in 1992-2011.

Conclusions
Russian economy spends impermissibly little on environmental protection. A proportion of environmental protection investments in the total volume of national investments is about 1.5 % per year, the growth rate of environmental protection investment in 2011 in Russia constituted 84% of the 1995 level. The growth rate of the current environmental costs in 2011 constituted only 33% of the 1995 level. The main way to augment environmental protection expenditure is to increase size of ecological taxes in 10 times on average. The ecological taxes should to realize compensation and stimulation functions.
Conclusions The improvement of the environmental legislation should
occur in a complex interactive way with the improvement of the entire tax system. In particular, it is proposed to aim fiscal policy at solving environmental problems with a general decline in direct taxes. In addition, in order to reduce tax burden, the practice of granting tax reliefs and other financial incentives should be more widely used (offsets of environmental payments in the amount of the environmental costs incurred, provision of favorable loans, state guarantees for environmental loans, schemes of accelerated depreciation of environmental capital stock) to stimulate the implementation of advanced environmental protection technologies. All these measures are obviously an effective means of economic and environmental mechanism.
Recommended