Water ResourcesWater Resources
All water Fresh water Readily accessible fresh water
Oceans andsaline lakes97.4%
Fresh water2.6%
Groundwater0.592%
Ice capsand glaciers1.984%
Lakes0.007%
Soilmoisture0.005%
Biota0.0001%
Rivers0.0001%
Atmosphericwater vapor0.001%
0.014%
Oceans
Ice
Lakes
Soilmoisture
77 trillion gallons/person
240,000 gallons/person
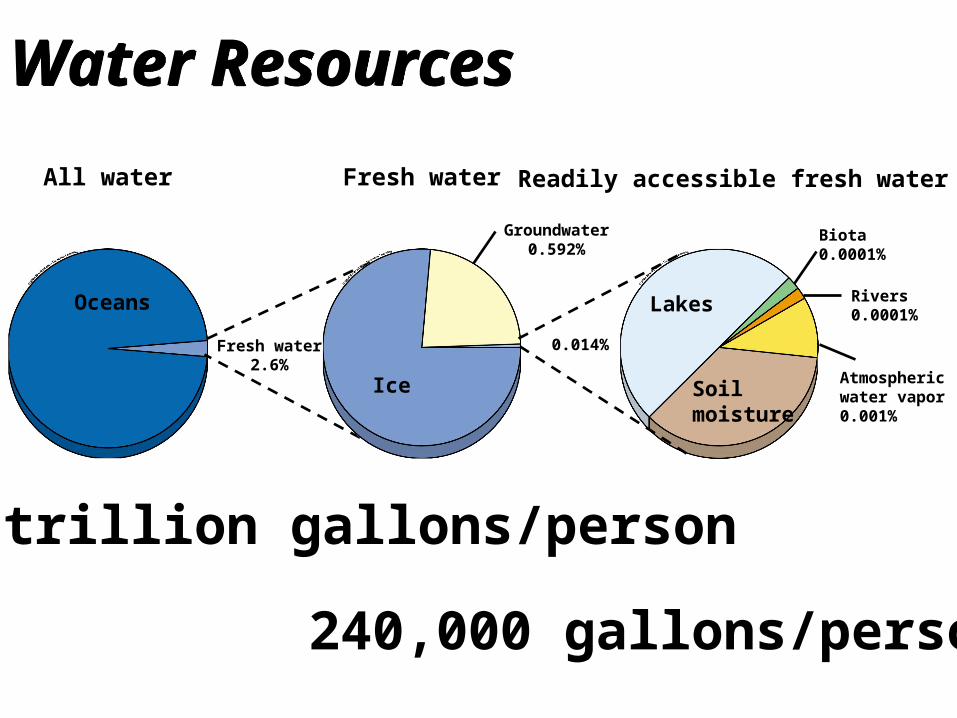
Evaporation and transpiration
Evaporation
Stream
Infiltration
Water tableInfiltration
Unconfined aquifer
Confined aquifer
Lake
Well requiring a pump
Flowingartesian well
Runoff
Precipitation
ConfinedRecharge Area
Less permeable materialsuch as clay Confirming permeable rock layer
Watershed, water table, aquiferWatershed, water table, aquifer
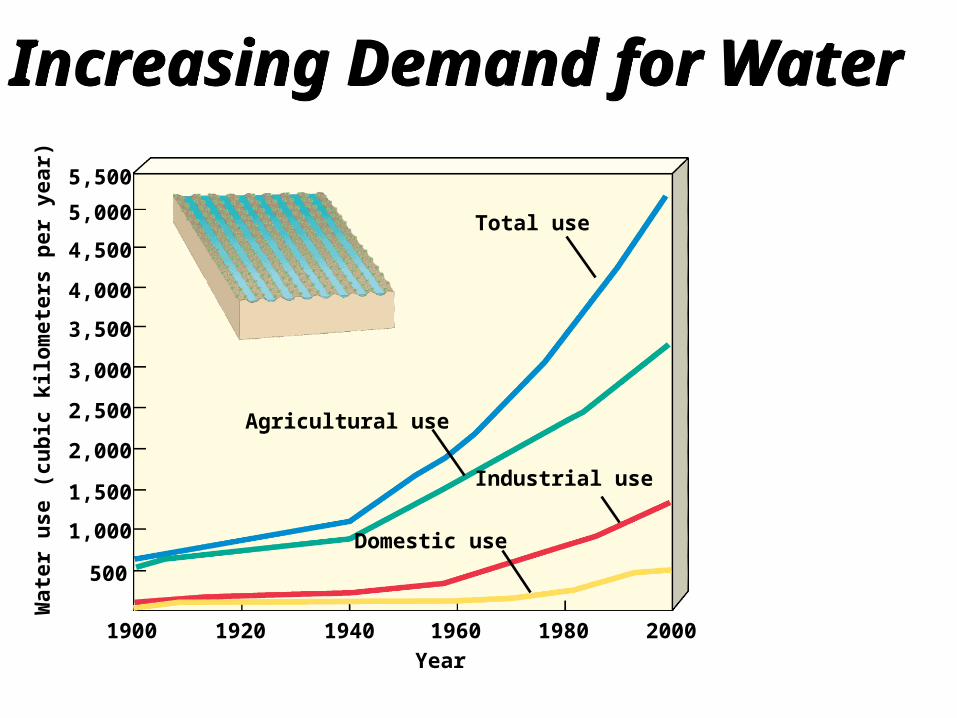
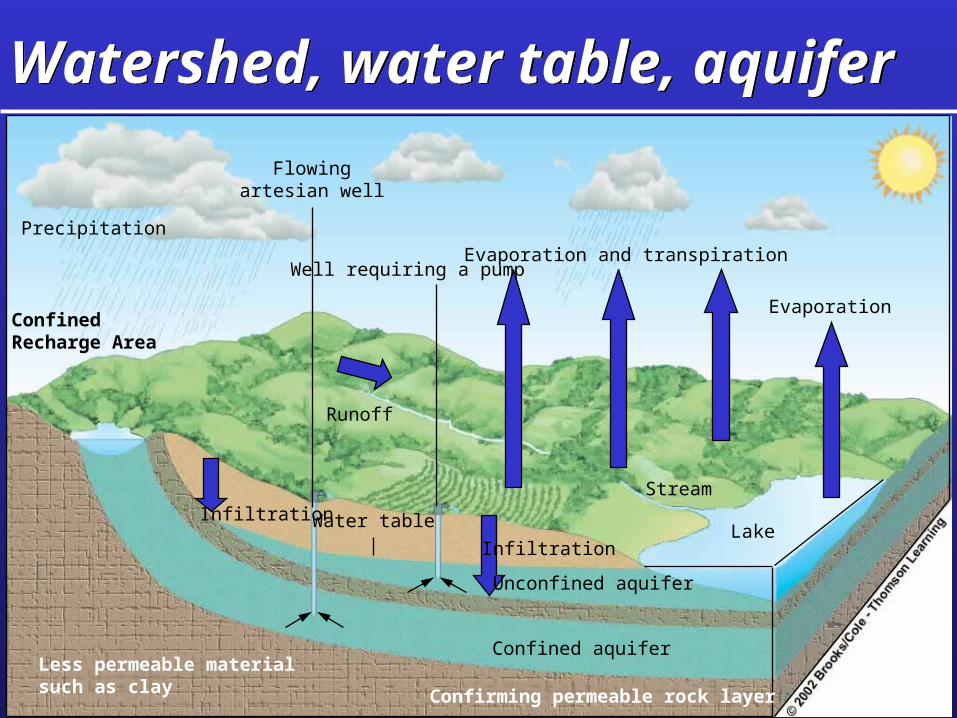
Increasing Demand for WaterIncreasing Demand for Water
5,500
5,000
4,500
4,000
3,500
3,000
2,500
2,000
1,500
1,000
500
1900 1920 1940 1960 1980 2000
Wat
er u
se (
cub
ic k
ilom
eter
s p
er y
ear)
Total use
Agricultural use
Industrial use
Domestic use
Year
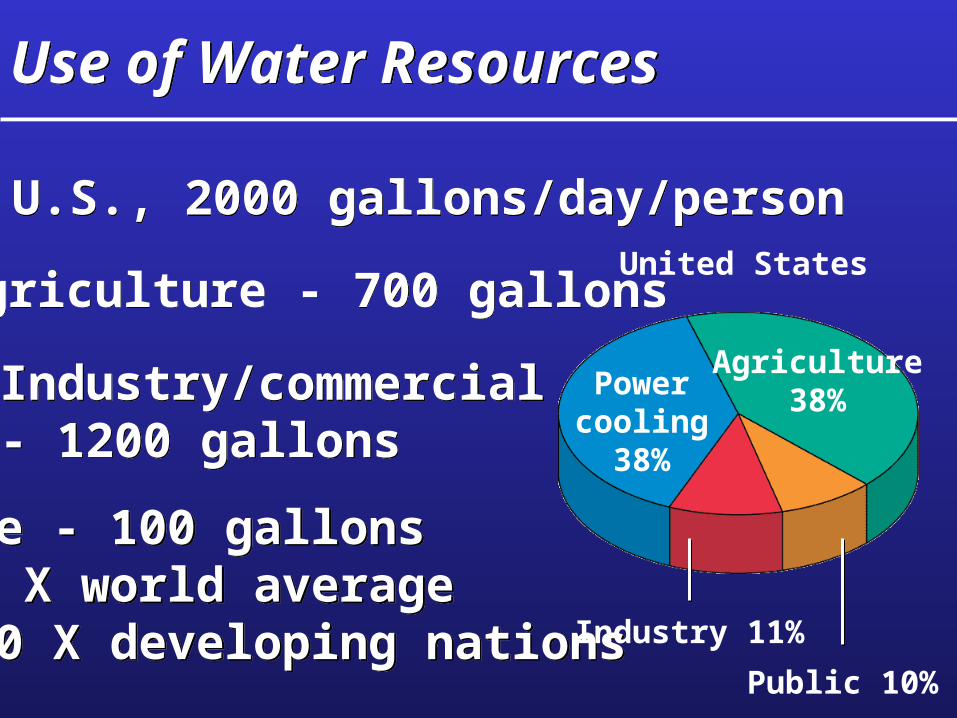
Use of Water ResourcesUse of Water Resources
In U.S., 2000 gallons/day/person In U.S., 2000 gallons/day/person
Agriculture - 700 gallons Agriculture - 700 gallons
Industry/commercial- 1200 gallons
Industry/commercial- 1200 gallons
Home - 100 gallons- 3 X world average- 20 X developing nations
Home - 100 gallons- 3 X world average- 20 X developing nations
United States
Industry 11%
Public 10%
Powercooling
38%
Agriculture38%
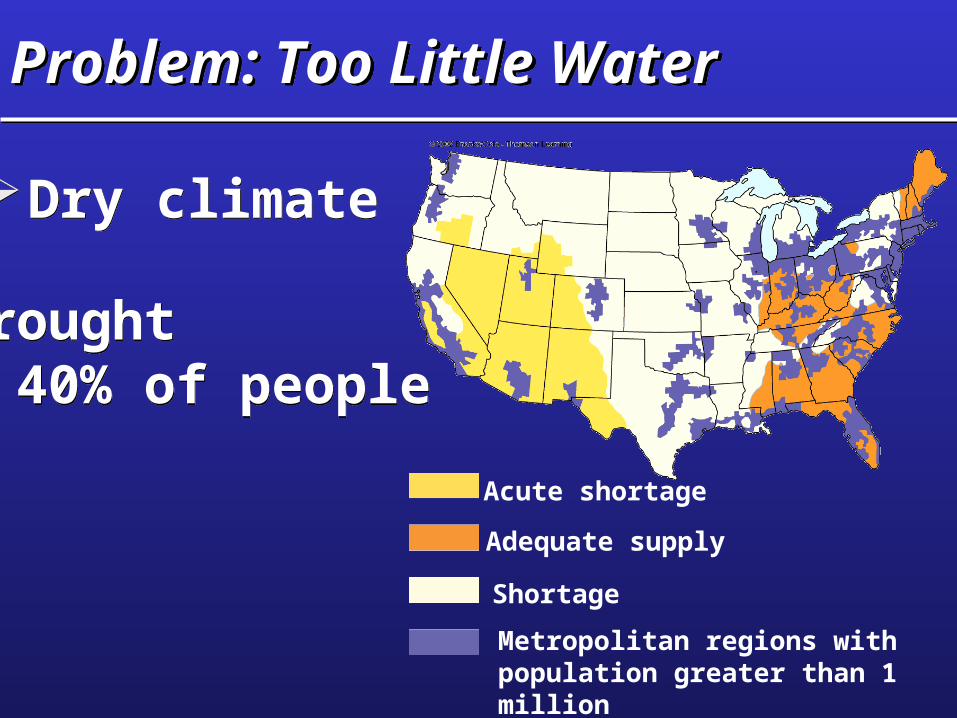
Problem: Too Little WaterProblem: Too Little Water
Dry climateDry climate
Drought- 40% of people
Drought- 40% of people
Acute shortage
Adequate supply
Shortage
Metropolitan regions with population greater than 1 million
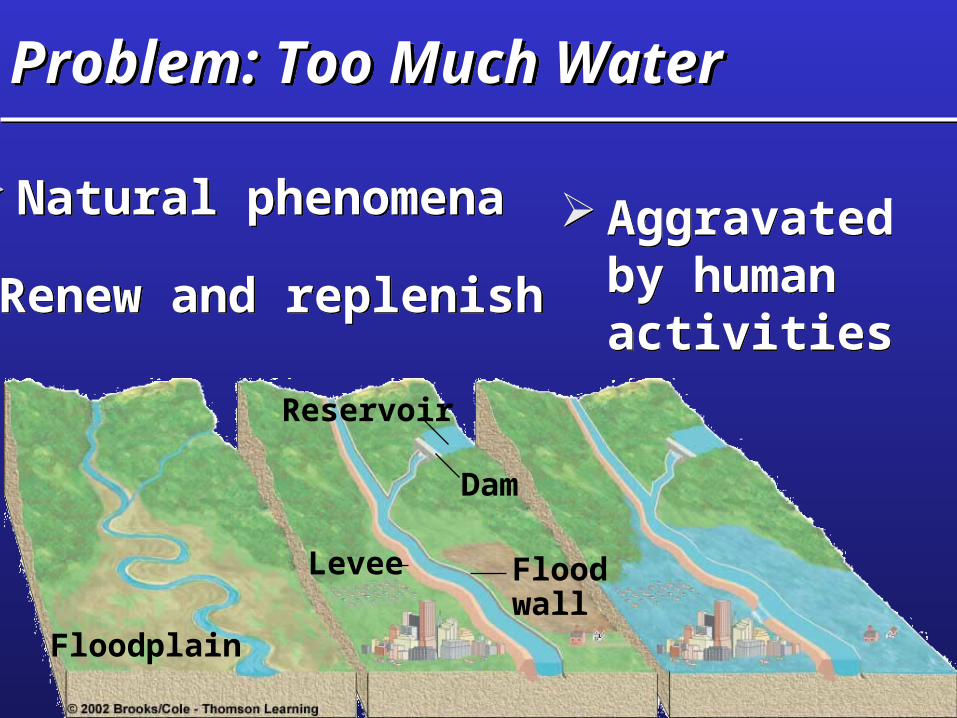
Problem: Too Much WaterProblem: Too Much Water
Natural phenomena Natural phenomena
Floodplain
Levee Floodwall
Dam
Reservoir
Renew and replenish Renew and replenish
Aggravated by human activities
Aggravated by human activities
Maintaining Adequate SuppliesMaintaining Adequate Supplies
Increase current supplyIncrease current supply
Reduce pollutionReduce pollution
Use water more efficientlyUse water more efficiently
Tapping GroundwaterTapping Groundwater
Year-round useYear-round use
No evaporation lossesNo evaporation losses
Often less expensiveOften less expensive
Potential Problems!Potential Problems!
Problems with Using GroundwaterProblems with Using Groundwater
Water table loweringWater table lowering
DepletionDepletion
Subsidence Subsidence
Saltwater intrusionSaltwater intrusion
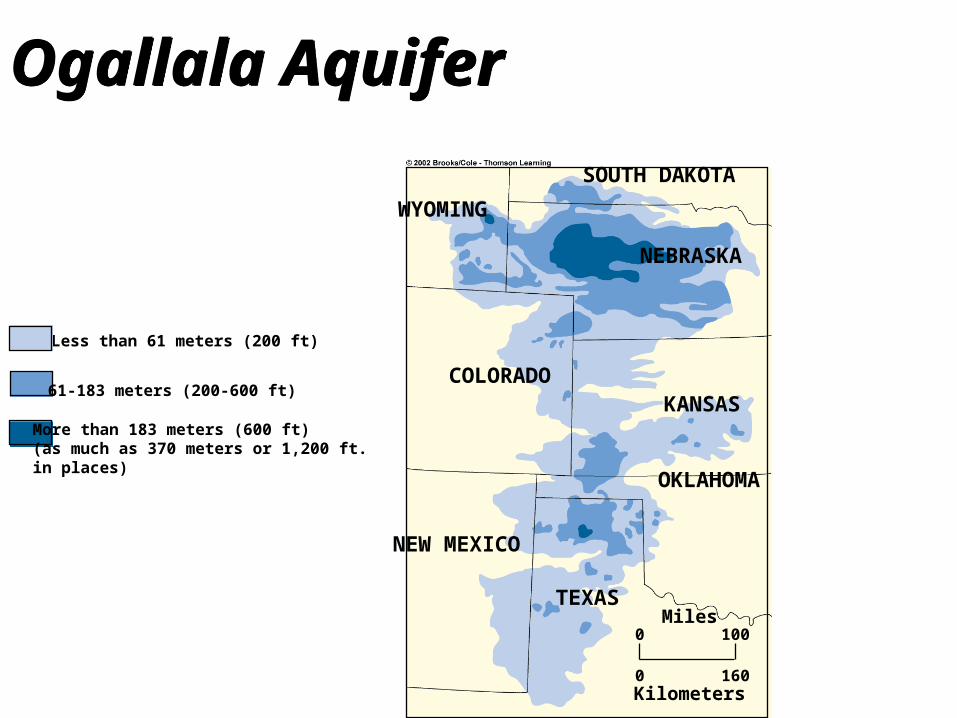
Ogallala AquiferOgallala Aquifer
WYOMING
SOUTH DAKOTA
NEBRASKA
COLORADOKANSAS
OKLAHOMA
NEW MEXICO
TEXAS
0 100Miles
Kilometers
Less than 61 meters (200 ft)
61-183 meters (200-600 ft)
More than 183 meters (600 ft)(as much as 370 meters or 1,200 ft.in places)
0 160
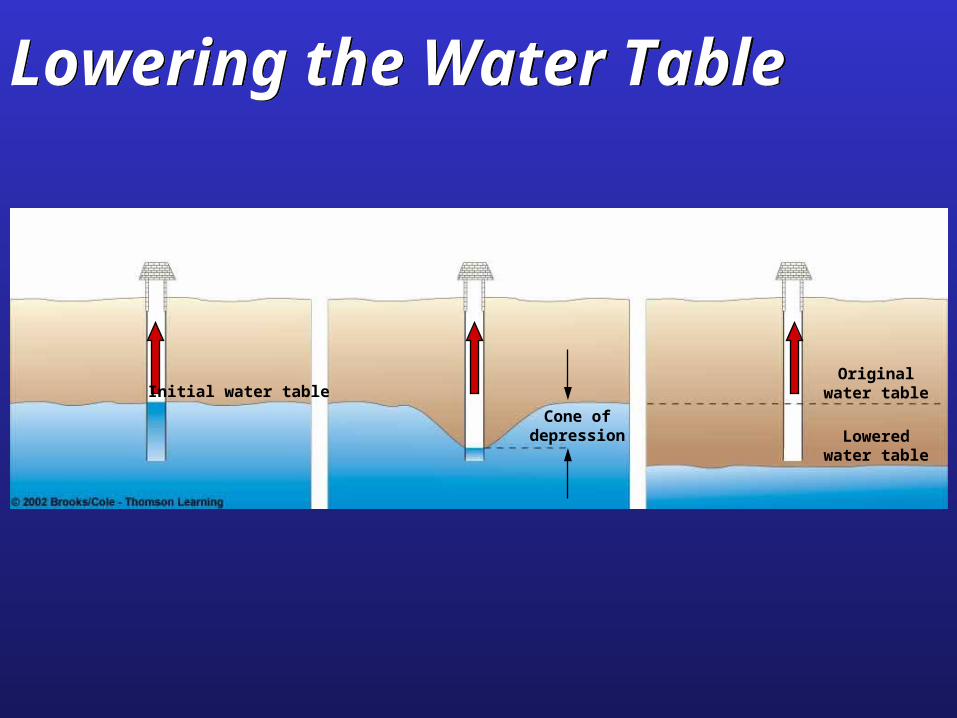
Lowering the Water TableLowering the Water Table
Initial water table
Cone ofdepression
Originalwater table
Loweredwater table
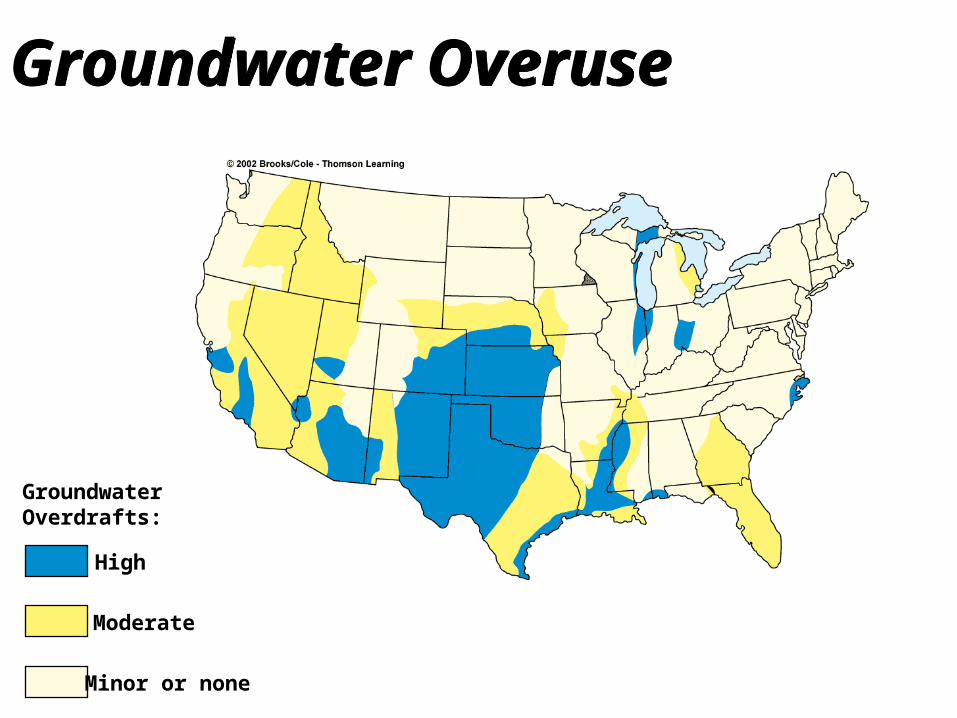
Groundwater OveruseGroundwater Overuse
GroundwaterOverdrafts:
High
Moderate
Minor or none
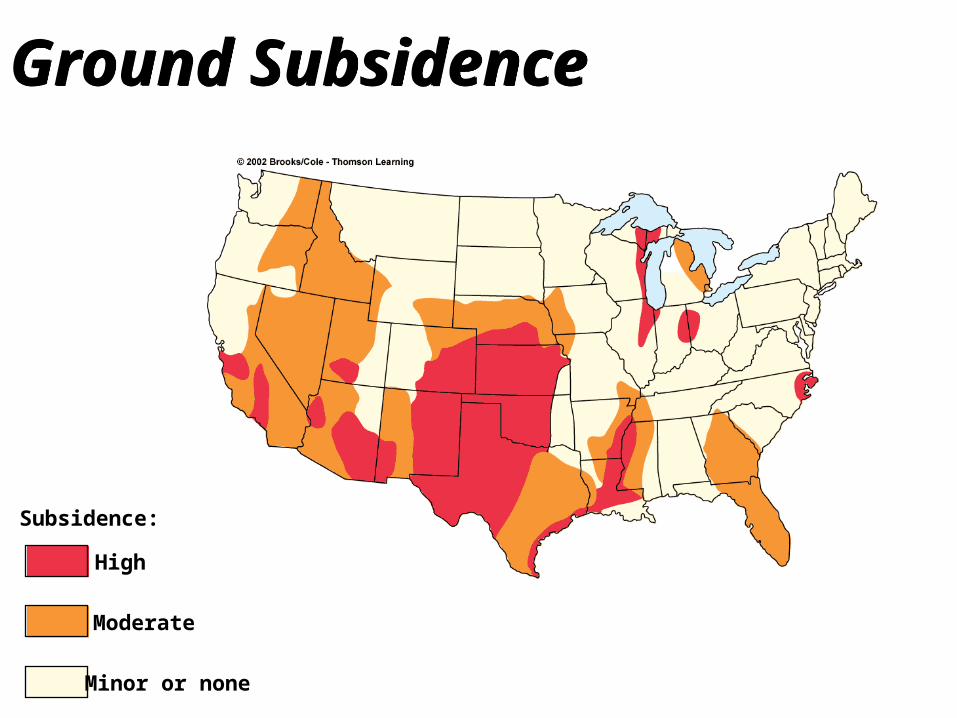
Ground SubsidenceGround Subsidence
Subsidence:
High
Moderate
Minor or none
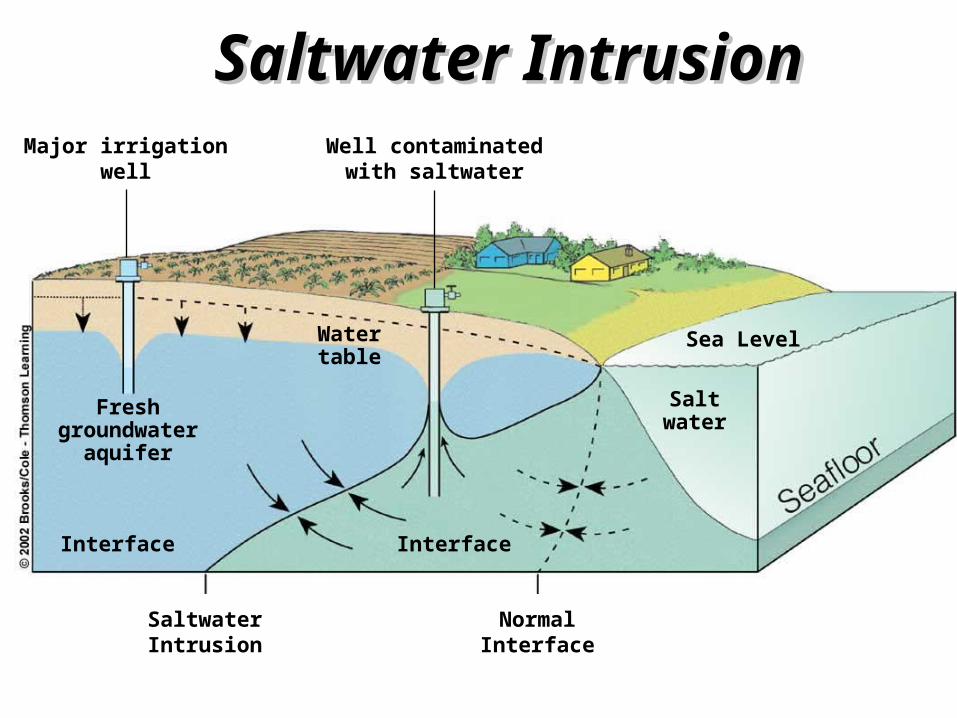
Major irrigationwell
Well contaminatedwith saltwater
SaltwaterIntrusion
NormalInterface
Freshgroundwater
aquifer
Interface Interface
Saltwater
Sea LevelWater table
Saltwater IntrusionSaltwater Intrusion
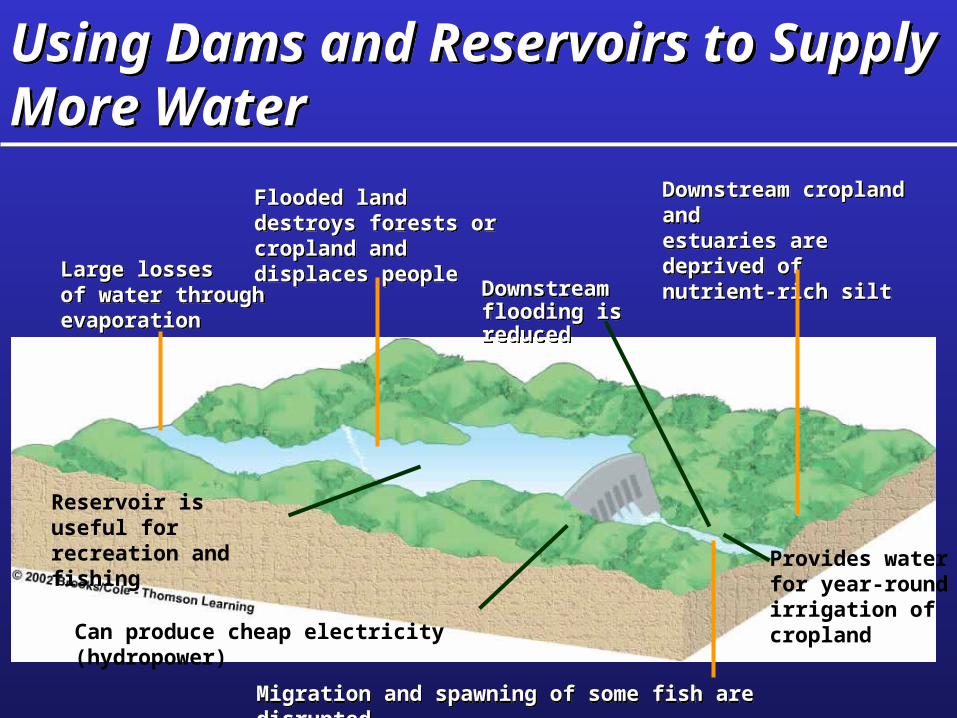
Using Dams and Reservoirs to Supply More WaterUsing Dams and Reservoirs to Supply More Water
Large lossesof water throughevaporation
Large lossesof water throughevaporation
Flooded land destroys forests or cropland anddisplaces people
Flooded land destroys forests or cropland anddisplaces people
Downstream flooding is reducedDownstream flooding is reduced
Downstream cropland andestuaries are deprived ofnutrient-rich silt
Downstream cropland andestuaries are deprived ofnutrient-rich silt
Reservoir is useful for recreation and fishing
Can produce cheap electricity (hydropower)
Migration and spawning of some fish are disruptedMigration and spawning of some fish are disrupted
Provides waterfor year-roundirrigation ofcropland
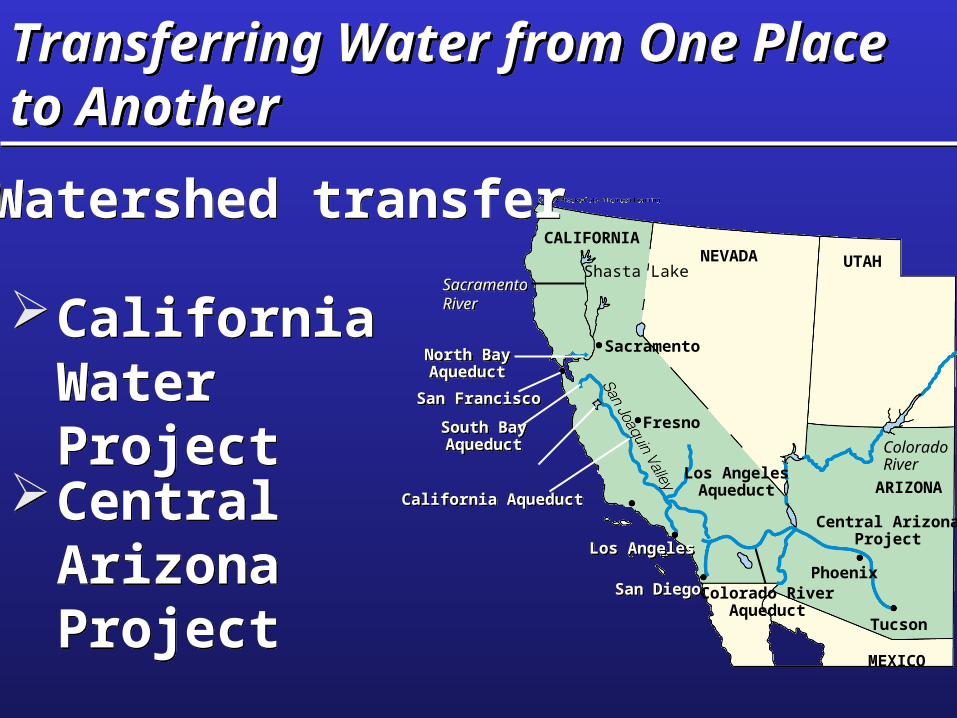
Transferring Water from One Place to AnotherTransferring Water from One Place to Another
North BayAqueductNorth BayAqueduct
South BayAqueductSouth BayAqueduct
California AqueductCalifornia Aqueduct
CALIFORNIANEVADA UTAH
MEXICO
Central ArizonaProject
Colorado RiverAqueduct
Los AngelesAqueduct
Shasta Lake
Sacramento
Fresno
Phoenix
Tucson
ARIZONA
ColoradoRiver
SacramentoRiverSacramentoRiver
San FranciscoSan Francisco
Los AngelesLos Angeles
San DiegoSan Diego
Watershed transferWatershed transfer
California Water Project
California Water Project
Central Arizona Project
Central Arizona Project

Converting Salt Water to Fresh Water and Making it RainConverting Salt Water to Fresh Water and Making it Rain
Distillation desalinationDistillation desalination
Reverse osmosis desalinationReverse osmosis desalination
Desalination is very expensiveDesalination is very expensive
Cloud seedingCloud seeding
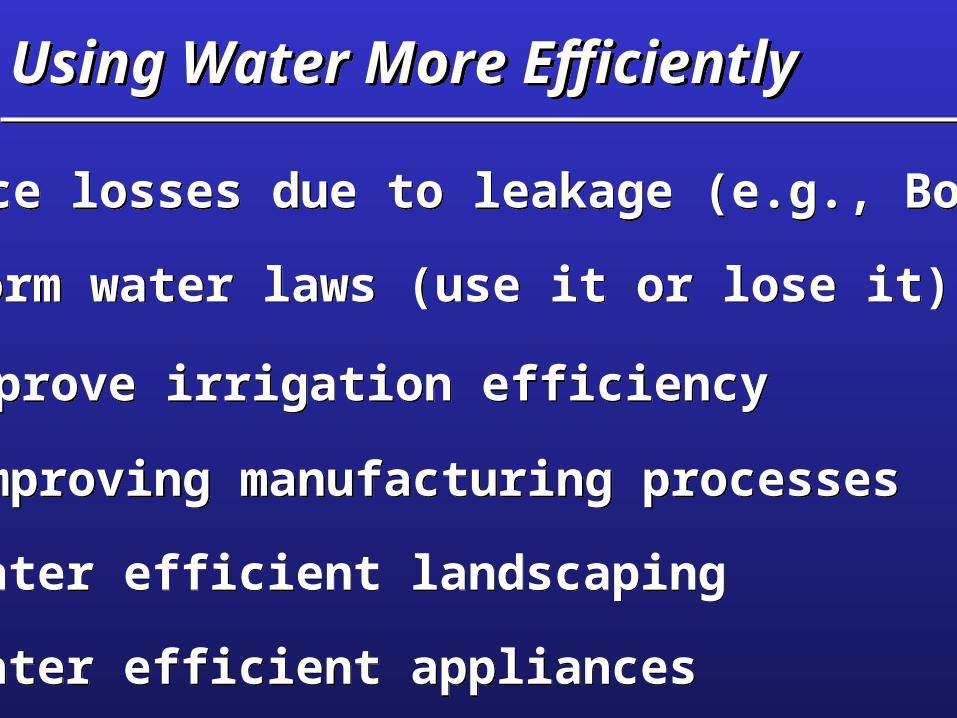
Using Water More EfficientlyUsing Water More Efficiently
Reduce losses due to leakage (e.g., Boston) Reduce losses due to leakage (e.g., Boston)
Reform water laws (use it or lose it) Reform water laws (use it or lose it)
Improve irrigation efficiency Improve irrigation efficiency
Improving manufacturing processes Improving manufacturing processes
Water efficient landscaping Water efficient landscaping
Water efficient appliances Water efficient appliances
Solutions: Achieving a More Sustainable Water FutureSolutions: Achieving a More Sustainable Water Future
Efficient irrigationEfficient irrigation
Water-saving technologiesWater-saving technologies
Improving water managementImproving water management
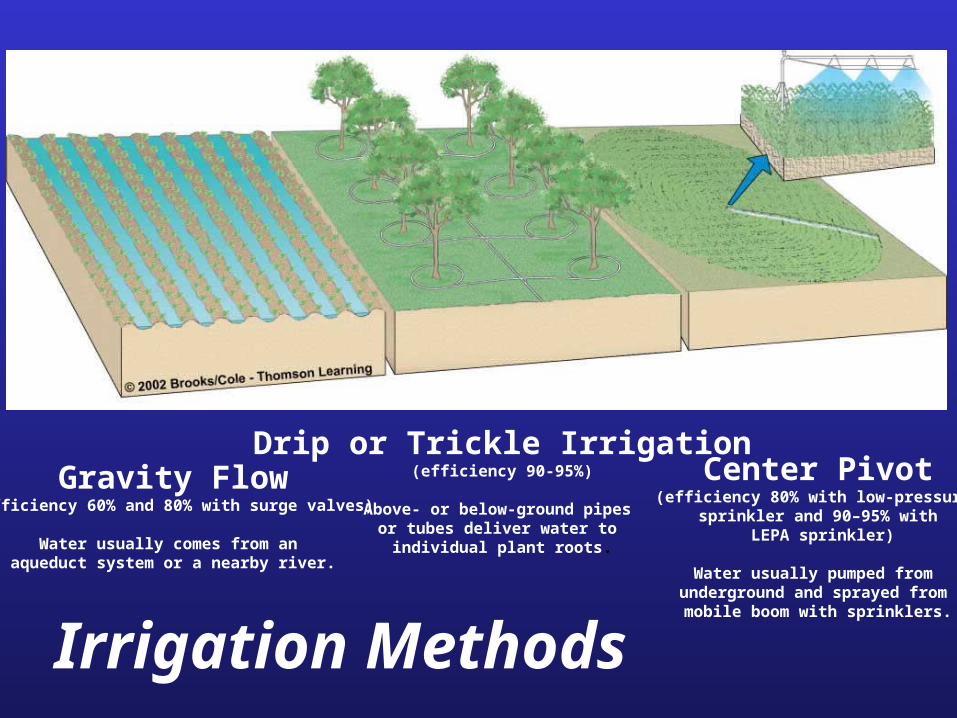
Gravity Flow(efficiency 60% and 80% with surge valves)
Water usually comes from an aqueduct system or a nearby river.
Drip or Trickle Irrigation(efficiency 90-95%)
Above- or below-ground pipes or tubes deliver water to
individual plant roots.
Center Pivot(efficiency 80% with low-pressure
sprinkler and 90–95% with LEPA sprinkler)
Water usually pumped from underground and sprayed from
mobile boom with sprinklers.
Irrigation Methods
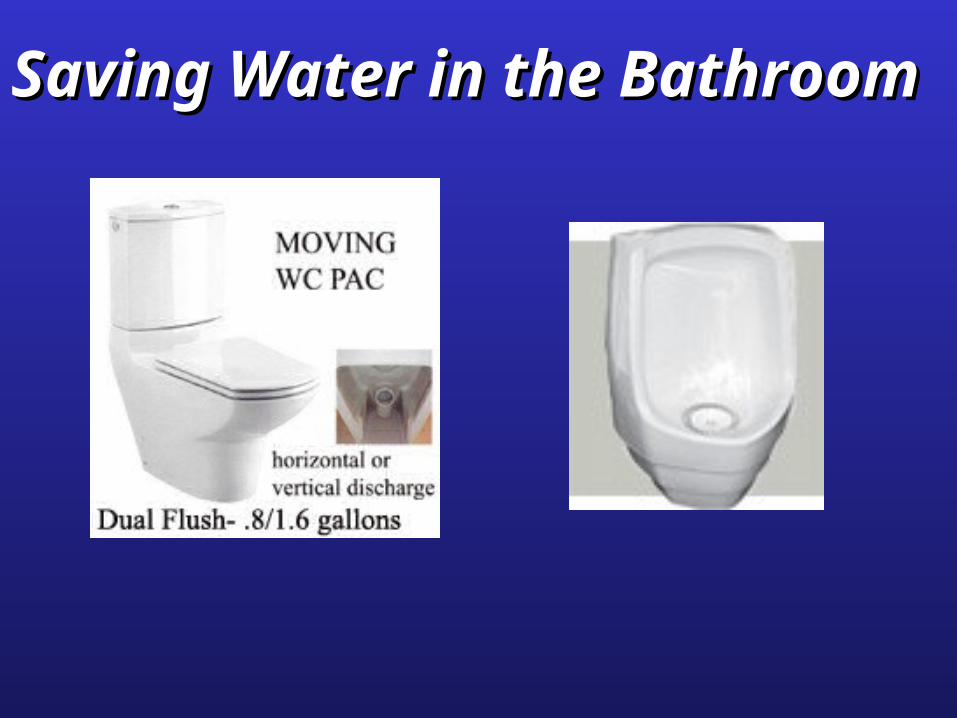
Saving Water in the BathroomSaving Water in the Bathroom
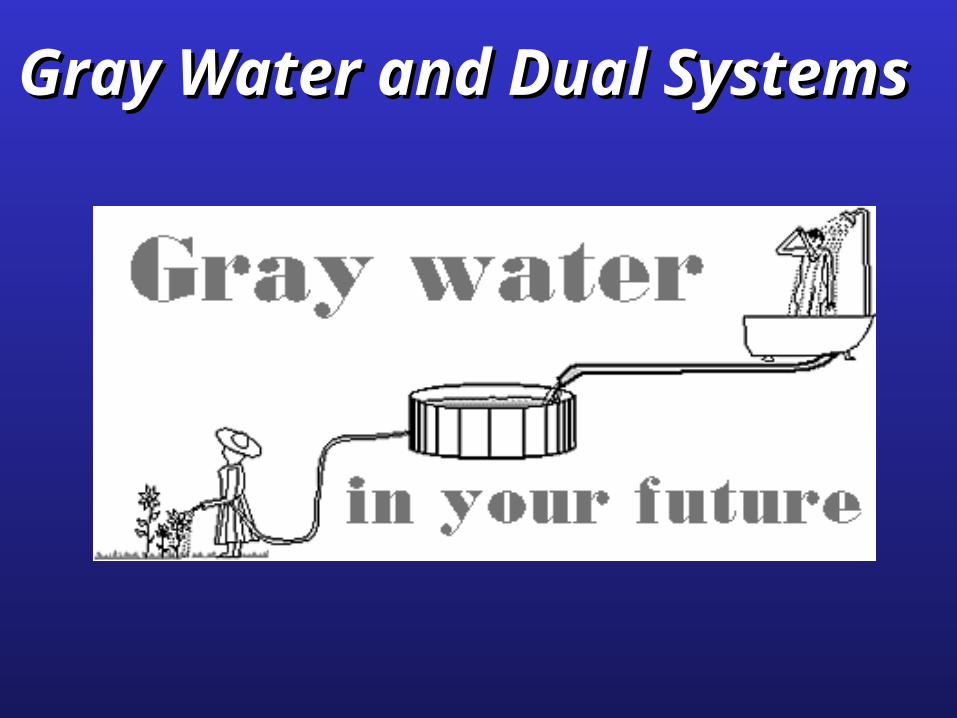
Gray Water and Dual SystemsGray Water and Dual Systems
Recommended