NBER WORKING PAPER SERIES
WATER MARKETS: AUSTRALIA'S MURRAY-DARLING BASIN AND THE USSOUTHWEST
R. Quentin GraftonClay Landry
Gary D. LibecapRobert J. O'Brien
Working Paper 15797http://www.nber.org/papers/w15797
NATIONAL BUREAU OF ECONOMIC RESEARCH1050 Massachusetts Avenue
Cambridge, MA 02138March 2010
The views expressed herein are those of the authors and do not necessarily reflect the views of theNational Bureau of Economic Research.
NBER working papers are circulated for discussion and comment purposes. They have not been peer-reviewed or been subject to the review by the NBER Board of Directors that accompanies officialNBER publications.
© 2010 by R. Quentin Grafton, Clay Landry, Gary D. Libecap, and Robert J. O'Brien. All rights reserved.Short sections of text, not to exceed two paragraphs, may be quoted without explicit permission providedthat full credit, including © notice, is given to the source.
Water Markets: Australia's Murray-Darling Basin and the US SouthwestR. Quentin Grafton, Clay Landry, Gary D. Libecap, and Robert J. O'BrienNBER Working Paper No. 15797March 2010JEL No. K11,N5,Q25,Q54,Q58
ABSTRACT
Fresh water supplies increasingly are under stress in many parts of the world due to rising populations,higher per capita incomes and corresponding consumption, greater environmental concerns, and theeffects of climate change. Water rights and markets are part of the institutional menus for respondingto these problems. We examine water markets in both Australia’s MDB and the western US and theirprospects for addressing water scarcity. The two regions share a number of important similarities including:climate variability that requires investment in reservoirs to make water available in low-rainfall periods;the need for internal and cross-border (state) water management; an historical major allocation of waterto irrigators; increasing competition among different uses (agricultural, environmental and recreationalin situ uses, urban demand); and the potential for water trading to more smoothly and quickly allocatewater across these competing uses. A comparison of the two regions provides important insights abouthow economic factors can encourage more efficient water allocation, market structure and governmentregulation. We show that rights are more clearly defined and trading more common in Australia thanappears to be the case in the western U.S. Longer periods of scarcity and hence, higher water valuesmay explain this difference.
R. Quentin GraftonCrawford School of Economics and GovernmentAustralian National UniversityCanberra, Australia ACT 0200Rupert Grafton <[email protected]>
Clay Landry205 N. 10th St. Suite 520Boise, Idaho 83702<[email protected]>
Gary D. LibecapBren School of Environmental Scienceand Management and Economics DepartmentUniversity of California, Santa BarbaraBren Hall 4412Santa Barbara, CA 93106-5131and ICERand also [email protected]
Robert J. O'Brien2 Beulah RoadNorwaod, South Australia 5067Bob O'Brien <[email protected]>
1
Water is the classic common property resource. No one really owns the problem. Therefore, no one really owns the solution. (Ban Ki-moon, Secretary-General of the United Nations, 6 February 2008) Introduction
Although fresh water is abundant at a global level, only a tiny amount, less than 0.3 %, is
easily accessible for human use (Dinar et al., 2007). An increasing amount of this water is utilized,
with global water withdrawals tripling since 1950. Presently, 70 % of the world’s population lives in
countries that withdraw more than 40 % of the available water resources. If current trends continue,
by 2025 up to a third of humanity will be living in countries in regions where water withdrawals
exceed 60 % of the amount available (Shiklomanov, 2003). At these levels of withdrawal there will be
insufficient fresh water to maintain many existing natural habitats, and inhabitants will face acute
water shortages, especially in times of drought.1
Climate change is expected to exacerbate these shortages by making precipitation more
variable, with a forecasted reduction in growing-season precipitation in key agricultural areas such as
Southern Australia and western US (Barnett et al., 2008; World Water Assessment Program, 2009).
Indeed, Australia’s Murray-Darling Basin (MDB) and the US Southwest offer a ‘window to the
future’ on the growing problem of water scarcity and the potential for water rights and markets to
provide information on current consumption patterns and alternative values, incentives for
adjustments in use, and smoother reallocation across competing demands.
After an eight-year drought, Australia’s Murray-Darling Basin (MDB) no longer carries
enough water to reach the sea without dredging at its mouth.2
1 The Economist (April 8, 2009, p. 52) speculates that no more than 20 per cent of the available water can be ‘safely’ withdrawn by humans on an on-going basis without having a negative impact on the natural environment (http://www.economist.com/world/international/displaystory.cfm?story_id=13447271).
This region accounts for 40 % of
Australia’s agriculture value, 85 % of the value of its irrigation output, and contains important
wetlands. The 2007-08 irrigation season was one the driest on record in the Basin with total inflows
2 Dredging began in 2002 and is expected to continue beyond 2009 and the foreseeable future.
2
into the Murray River of just 2,220 GL, or about a quarter of the long-term average. This was
preceded by the lowest inflows ever recorded of 970 GL in 2006-07. 3
The Colorado River in the US Southwest faces a similar plight. The river’s waters were
distributed by a 1922 Compact among seven states and a 1944 treaty with Mexico, based on an
anticipated flow that turns out to be well above the actual 1906-2004 long-term average. The result is
severe overallocation in the most arid region in the US. Some 30 million people rely upon the river for
water and recreation, as does the US’s most productive irrigated agriculture and also environmentally-
valuable wetlands. There is not enough water, on average, to fulfill all of the legal entitlements, and
with ongoing drought, the states are in conflict over the remaining water in the major storage
reservoirs while Lakes Mead and Powell are far below capacity. Recently, the US federal government
set 19-year Interim Guidelines for allocating water to the Lower Basin states, reducing allocations
when the water elevation at Lake Mead reaches certain low level thresholds.
Consequently, as of April 2009
active water storages in the Basin were at about 11 % of full capacity.
4
In this paper, we examine water markets in both Australia’s MDB and the western US and
their prospects for addressing water scarcity.
5
3 Gigaliter (GL) = 1 thousand million liters (L) and 1 gallon (US) = 3.785L
The two regions share a number of important
similarities including: climate variability that requires investment in reservoirs to make water
available in low-rainfall periods; the need for internal and cross-border (state) water management; an
historical major allocation of water to irrigators; increasing competition among different uses
(agricultural, environmental and recreational in situ uses, urban demand); and the potential for water
4 The Lower Basin states are Arizona, California, and Nevada, and the Upper Basin States are Colorado, Utah, New Mexico, and Wyoming. For a summary of Colorado River conditions, see http://wwa.colorado.edu/colorado_river/law.html. Depending on how is measured, the allocation based on the 1922 Compact and the Mexican Treaty was either 16.5 million acre feet or 17.5 million acre feet. The 2006-2004 average flow has been 15.1 million acre feet or 18,650 GL. The appropriate conversions are 1 acre-foot = 1.235 million liters, 1 million liters = 1 Megaliter (ML) or 1,000 Cu. Meters and 1 GL = 1,000 ML. 5 Although our focus is on the US Southwest where most water trades take place, we present data for water trading in the 12 western states west of the 100th meridian that separates the North American continent between low and high precipitation levels.
3
trading to more smoothly and quickly allocate water across these competing uses. A comparison of
the two regions provides important insights about how economic factors can encourage more efficient
water allocation, market structure and government regulation.
Origins of Water Markets
Water presents unique challenges to the establishment of rights and markets as it can neither
be bounded easily nor partitioned across claimants and uses.6 In particular, water’s mobility and
fluidity raise the costs of measuring and monitoring the amount of water held or used by the holder of
a water right. These problems are even more severe for groundwater, which often is an open-access
resource.7 Despite these difficulties, water markets have developed in a number of countries,
primarily for temporary trades of water between farmers, and more comprehensive water markets
have evolved in the US Southwest and Australia’s MDB.8
Markets for water initially developed as informal ‘contracting’ whereby an owner with some
form of a water right, such as a riparian whose land bounded a water source, could contract or
authorize other parties to access this water (Scott, 2008). As water has become more scarce in the
past 20 years, markets for longer-term leases and permanent sales of water rights have developed in
several parts of the world including Chile, Mexico, the US, and Australia (Productivity Commission,
2003; Thobani, 1997). In China (Xie et al., 2009), Pakistan and also other countries informal or pilot
water markets exist (Bruns and Meinzen-Dick, 2000) in some locations, for temporary water transfers,
that is, for the exchange of water in a given season or period of time.
In Australia and the US ownership of the water is vested in the national or state governments,
but historical users, primarily irrigators, mining companies, and in some cases, urban water utilities,
6 See Barzel (1982) for discussion of measurement and bounding in markets. 7 Contact with groundwater is somewhat constrained by access to surface land and the need to drill a well, but beyond that constraints are limited. See Glennon (2002) for general discussion of over pumping and Provencher and Burt (1993) for analysis of the externalities of extraction. 8 As we show, water markets have developed more extensively in Australia than in the western U.S.
4
have been recognized as having usufruct or possessory rights (riparian and appropriative) to harvest
water under certain conditions (Scott, 2008).9 These water rights are conditional on state regulation.10
Appropriative Water Rights
In the US Southwest, appropriative water rights are the most prevalent and in the Australian MDB
water ownership is based on statutory rights.
In the western US, appropriative rights are based on first-possession or seniority of beneficial
use.11
Appropriative rights separate land ownership from the right to use water and are defined in
volumes of water use per period of time. Their specification has promoted transferability — long-
standing informal exchanges among adjacent users and since the late 1980s, more formal,
comprehensive within and across-sector water trade. The ‘first-in-time, first-in-right rule’ of
appropriative rights separates diverters into senior and junior appropriators depending on the date at
which the first diversion was made. Those with the earliest water claims (such as native claimants
and members of early irrigation districts) have the highest priority and those with subsequent claims
(often urban communities) have lower-priority or junior claims.
They grant the appropriator the right to divert a set amount of water per period of time. The
extent of each diversion, however, varies due to fluctuating rainfall and snow pack that affects stream
flow and reservoir size. Supply uncertainty complicates the granting of definite water rights and the
writing of contracts for water exchanges because neither buyers nor sellers know exactly how much
water can be transacted at any specified period. Seasonal precipitation patterns, however, are
predictable and are incorporated into a water claim.
9 Appropriative water rights have been defined based on actual diversions of water for beneficial use and the first date of this use. Riparian water rights arise from land rights that provide right of access to water subject to ‘reasonable use’ that is limited by correlative liabilities with respect to downstream users. State ownership is described in Gould (1995, 94). 10 As a result, water rights are less definite or more fragile than are those for land. For discussion of the US case, see Sax (1990, 260), Getches (1997, 11, 83, 168-70), and Gray (1994, 262). 11 See Johnson, Gisser, and Werner (1981) for discussion of surface water rights. Among western states, California has both appropriative and riparian water rights but riparian use is limited to ‘reasonable and beneficial use.’ Arizona and Colorado only have appropriative water rights (Blomquist et al., 2004). See Lueck (1995) for discussion of first possession. Smith (2008) analyzes both prior appropriation and riparian rights.
5
Thus there exists a ‘ladder of rights’ to stream flow that ranges from the lowest to the highest
priority use that provides a definitive ranking of competing claimants and the rationing of water
during times of drought. Namely, the highest priority rights holder receives a full allocation before
any water is made available to those of lower priority, who receive only the residual. If trading is
possible, then those with high-valued water uses (but with low-priority rights) can lease or purchase
water from those with lower-valued uses and higher-priority rights to their mutual advantage. Such
trades also allow for a better apportioning of risk among different users even if the marginal value of
water is the same among buyers and sellers as they allow the more risk-averse water users to access
higher priority rights.
Groundwater rights vary across the western states and most are not well defined or enforced
(Thompson, 1993, 684) with few limits on extraction by land owners and no precise recognition in the
water rights structure of interconnectedness between surface and groundwater uses (Getches, 1997,
247-53). California, for example, has no statewide groundwater management plan. In Arizona, where
surface water is limited, there is more comprehensive regulation in some areas under the Groundwater
Management Act of 1980 that defines certain types of groundwater rights and sets the conditions for
their exchange.12
Statutory Water Rights
In the sourthwest prior appropriation and reasonable use are the dominant allocative
mechanisms (Getches, 1997, 251). Where appropriative rights exist, seniority entitles a groundwater
user to a practical pumping level. Where rights are not specified clearly, the mobility of groundwater
and an inability to adequately observe the size of the resource and level of extraction, together create
incentives for competitive withdrawal.
In Australia, surface statutory water rights in the MDB are defined in terms of diversions per
irrigation season. Beginning first with the State of Victoria in 1886, states have transformed riparian
12 Arizona State Legislature, Arizona Revised Statutes (ARS) 45-401.
6
water rights into statutory water rights although vestiges of riparian rights still remain in the form
water harvesting for ‘stock and domestic use’ that can neither be traded nor used for other purposes.
In the first half of the twentieth century, Australian states used their acquired water rights to
encourage farming settlements in the MDB with the free allocation of statutory water rights, typically
one acre-foot (Martin, 2005), and the construction of water storage facilities and public irrigation
works (Connell, 2007). By the 1980s an over allocation of statutory water rights had led to increasing
pressure by some irrigators for water rights to be separated from land and be tradable so as to access
increasingly scarce water. This led to the establishment of water markets for permanent water in the
States of South Australia in 1982, New South Wales and Queensland in 1989, and Victoria in 1991
(Murray Darling Basin Commission, 1995:37). Further reforms to water trading and the register of
water entitlements occurred in the 1990s following an agreement by the Council of Australian
Governments in 1994 to separate all statutory surface water rights from land rights (Bjornlund, 2003).
Each state, however, has developed its own rules over the conditions of use that severely limits inter-
state trade that represents less than 1 % of all permanent water trades.
Statutory water rights in the MDB are called water entitlements (also called permanent water).
They provide the owner with a share of a consumptive pool but the actual quantities of water that
holders of entitlements are permitted to divert depend on the seasonal allocation (also called
temporary water) that is assigned each year to the water entitlement. The seasonal allocation assigned
to a water entitlement is not fixed and depends on the water entitlement’s level of reliability (such as
‘High Security’ or ‘General Security’ entitlements that determine the preferential access to the
consumptive pool), the overall limit on diversions in the Basin that are set by catchment, expected
inflows into the system, and water storage levels.
Based on historical inflows, ‘High Security’ water entitlements were thought to have reliability
at 95-100 %, such that an entitlement holder would expect to receive a seasonal allocation equal to the
7
full water entitlement 95 years in 100. ‘General Security’ water entitlements have a much lower
reliability, and many such entitlements have received zero opening seasonal allocations in the past
few years because of extremely low water storages and inflows. Seasonal allocations represent secure
quantities of water such that there is virtually no uncertainty that this water will be delivered. This
condition promotes water exchange, such that traded season allocations in 2007 accounted for about
half of all the water diverted in 2007/08. Meanwhile in the western US, where annual appropriative
water rights diversion quantities are more uncertain, the volume of water traded in any season is much
lower.
Regulation of Water Markets
Use or Lose It
The maintenance of appropriative water rights in the US has been based on allocating claimed
water to beneficial use. As beneficial uses are difficult to measure, the basic test of meeting the
requirement has been physical diversion. Unfortunately, this doctrine creates incentives for rights
holders to use water in low-valued ways in order to keep their rights because conserved or salvaged
water has been vulnerable to reallocation to others. Conserved water that disrupts return flows may
harm downstream users if the water is reallocated to other uses or exchanged. This has led states to
develop different regulatory responses to water conservation (Brewer et. al., 2007).
Diversion reduces the quantity of flowing water in the stream that can be important for fish
stocks, recreation, and other environmental benefits. Recently, legislation in western states has
recognized in-stream flows as a beneficial use so as to promote public benefits.13
13 Private and semi-public organizations, such as the Oregon Water Trust, negotiate with irrigators under these statutes to lease water to maintain stream flows during drought periods to protect fish stocks. See King (2004).
Nevertheless, in-
stream flows are difficult to define and enforce because of the movement of the water and the
potential for existing appropriators to harvest larger stream flows (Anderson and Johnson, 1986).
8
By contrast, in Australia there is no ‘use or lose it’ requirement attached to water entitlements.
Indeed, holders of water entitlements have every incentive to conserve seasonal allocations assigned
to them as they can sell unused quantities and, in some cases, are allowed to ‘carry over’ a portion of
their unused seasonal allocation to the following irrigation season.
Return Flows
A complicating factor in the specification of water rights and water trading is that not all of the
water diverted is consumed. As much as 50 % of the original diversion may seep back to the aquifer
or stream. Typically ‘tail water’ and return flows are available for successive uses in irrigation, urban
and industrial consumption or in aquatic habitat. As different uses generate different return flows, the
specification of water rights in terms of gross diversions, as is the case in both the US appropriative
rights and Australia’s statutory entitlements, may be economically inefficient. Whether is it
preferable to specify water rights in gross diversions, or to specify them as net diversions (or
consumptive use), depends on the size of the efficiency losses associated with gross diversions
relative to the increased measurement, monitoring, and enforcement costs associated with net
diversions (Johnson, Gisser, and Werner, 1981). A confounding factor in the western US is that most
water rights are not precisely measured or defined although transfers that change the time, nature, and
location of use are regulated by state agencies to ensure that there will be ‘no injury’ to more junior
rights holders or threaten the public interest (Getches, 1997, 11, 168-70; Gould, 1995, 94).
Water Substitution
Water trading assigns a market price and an opportunity cost to users of water thereby
encouraging water conservation and improvements in water efficiency if they can be implemented at a
lower cost than the market price. Water trading can encourage holders of surface water rights to seek
alternative and cheaper sources of supply, especially if they have sold or leased their rights. One
9
alternative is groundwater that has less precise (or no) specified water rights and, therefore, is
vulnerable to overdraft as irrigators turn to it as a substitute for scarce surface water.
Groundwater is an important source of fresh water. In California, for instance, groundwater
extraction accounts for 30 % of the state’s supply during normal years and 40% during dry years
(Legislative Analyst’s Office, 2008, 21). Given the geological interconnection between surface and
groundwater sources, surface water diversion and exchange potentially can diminish groundwater
sources. Recent drought years have put more emphasis on groundwater because state water projects
have reduced deliveries of surface water and groundwater pumping has increased, although by how
much is uncertain. A lack of comprehensive monitoring and minimal local regulation of most
groundwater basins has increased calls for comprehensive, statewide management in the face of
groundwater overdraft and water quality degradation (Bachmann et al. 2005).
In response to concerns about increased over use of water, Australian governments agreed to
impose a cap based on diversions in 1993/94 and the conditions prevailing at that time. This cap
limited the overall diversions of surface water use but it did not directly restrict overall groundwater
use, although individual groundwater license limits apply. This initially encouraged activation of
‘sleepers’ (entitlements that had never been used) and ‘dozers’ (entitlements that had not been used
for a long time) that reduced slack in the system and the reliability of the fully utilized water
entitlements.
Groundwater extraction in MDB has increased in recent years, with diversions about third
higher than in 1999/2000 and currently about 1,500 ML per year. Given the interconnection between
ground and surface water, this consumption has reduced current stream flow by about 300 ML per
year (Murray-Darling basin Commission, 2008). Although total groundwater use is less than 15 % of
the total permitted diversions of surface water, it represents a much higher proportion of actual water
use in the current drought. Given that groundwater licenses currently allow for extraction of up to
10
3,200 ML per year, irrigators will almost certainly increase their groundwater use prior to the planned
imposition of an overall groundwater cap in 2011.
A similar substitution problem in the MDB has occurred with on-farm interceptions of surface
water. Although there are controls on the construction of farm dams there is evidence of substantial
increases in the number and size of farm dams in some catchments. Farm dams can reduce catchment
yields from a minimum of 4 % to as much as 50 % in some locations (Duggan et al., 2008). In MDB
as a whole, farm dams may have reduced stream flow by as much as 1,900 GL/year (van Dijk et al.,
2006).
Regulations and Transactions Costs
In the western US each state’s water regulatory agency determines whether proposals for new
diversions of surface water are in the ‘public interest,’ although most basins are now fully allocated
(Sax, et al, 2006, 220-34). State agencies also review proposed transfers of water rights from one user
to another or from one use to another. This process of application, processing, and evaluation can be
lengthy and complicated, raising the transaction costs of water markets. In 1990 in Colorado and
New Mexico, for example, transaction costs ranged from $250-$470/ML while, at that time, the mean
price of water sales in New Mexico was $2,676/ML.14 In 1993, estimates of the transaction costs per
transaction in these two states varied from a few hundred dollars to $50,000, with an average cost of
$370/ML on transfers of 25/ML or less. At an average traded price of $1,500/ML these transactions
can account for 20% of the purchase price or more.15 Another cost is the processing time to complete
the transactions ─ it can take between four to five months in New Mexico and Utah and up to 29
months in Colorado to complete a trade.16
14 All values have been converted from per acre-feet to mega liters (ML).
15 Thompson (1993, 704-5) claimed that the high costs of procedural requirements deters transfers 16 Colby (1990, 1184)
11
Transaction costs also appear to impede trade in California. Water is transferred typically in a
spot market with short-term leases and few long-term or permanent water trades. A major challenge is
moving water from the north to the south where it is most need and most of the population resides. In
response to continuing drought in 2009, for the first time in 15 years, the California Department of
Water Resources established a Drought Water Bank. The agency purchases water upstream of the
Sacramento-San Joaquin Delta and transfers it to buyers downstream. As much as 741,000 ML are
available for the Bank, but little has been transferred. One complaint is that the administrative and
facility charges are too high.17
In Australia, various restrictions on trade also have been imposed. Some address
environmental concerns, such as salinity, with limits on trade into salinity-affected areas and
restrictions based on physical flow constraints (Productivity Commission, 2006). Other restrictions
have been introduced over concerns that ‘trade out’ of water entitlements will erode the economic
base of irrigation communities. For instance, the State of Victoria imposes a 4 % limit on the annual
trade of water entitlements out of an irrigation district and a requirement that a maximum of 10 % of
the volume of water entitlements be held by parties separate to the land. Such restrictions, however,
do not apply to seasonal allocations of water that are the physical quantities of water allocated to
water entitlements in a given irrigation season.
Termination and exit fees are also charged by Australian operators of irrigation infrastructure.
Termination fees apply when an irrigator surrenders a right to have water delivered by the irrigation
utility or authority while exit fees apply when water entitlements are sold to someone outside of an
irrigation district (Australian Competition and Consumer Commission (ACCC), 2006, ii). Operators
of irrigation infrastructure also hold large water entitlements and supply water to customers, or their
17 See Carlton (2009). The argument is that $275/AF or $340/ML offered by the Bank to sellers is too low, relative to the mark up and price for buyers at $380-$450/AF ($459-$556/ML), which has been viewed as too high by prospective purchasers. See http://online.wsj.com/article/SB124044678660345897.html
12
members in the case of cooperatives. Irrigators gain access to water via pipes and channels, and are
charged for the provision of the water by the irrigation cooperative or supplier. These irrigation
groups are, naturally, concerned about their members selling their water and leaving stranded assets ─
irrigation infrastructure where revenues are insufficient to cover the fixed costs of conveying water to
irrigators.
To offset the possibility of stranded assets, irrigation groups are currently charging members
between $210/ML and $280/ML if they sell their water entitlements outside of their district. These
charges represent about 15 to 20 % of the market price of water entitlements and, in some cases, as
high as 80 % of the price of the water entitlement (ACCC, 2006:45). The transactions costs on trade
of seasonal allocations, however, are much lower and in order of 2 to 3 % of the traded price because
no exit or termination fees are imposed (Allen Consulting Group, 2006).
Public Interest and Environmental Flows
A key objective of regulators who administer water trade in both the US and Australia is the
desire to meet public interest and environmental objectives. Some water trades ─ especially across
catchments or watersheds ─ can impose environmental costs in ter ms of stream flow changes and
water quality deterioration as measured by salinity, turbidity and other indicators. Consequently,
regulators have intervened to limit trades within zones and/or to account for these environmental
effects.
In Australia, environmental objectives are implemented primarily through state regulations
where water allocations are provided for the environment in addition to the amount permitted for
diversions. Environmental allocations are used to maintain wetlands with a focus on key sites along
the rivers. In times of above normal inflows it is comparatively easy to meet both the needs of
irrigators and the environment. In times of drought, and despite stated aims to ensure environmental
sustainability, allocations for environmental flows have been reduced by much more than the seasonal
13
allocations assigned to water entitlements. For example, the state of Victoria’s water share on the
Murray River has fallen about a third over the past decade. In response, diversions have reduced 10 %
but environmental flows have fallen almost 50 % (Connell and Grafton, 2008).
The focus on promoting water for irrigation in MDB over much of the twentieth century has
resulted in water diversions that are more than double mean annual flow (National Land and Water
Resources Audit, 2001) and generated negative environmental impacts. For example, a recent and
independent audit of the environmental health of the 23 river valleys in the MDB found only three in
good heath or moderate health and 20 in poor or very poor health (Davies et al., 2008). The impact of
less-than-adequate environmental flows is most visible closest to the Murray River mouth.
Exceptionally low flows at the Lower Lakes, located immediately before the mouth of the Murray,
have resulted in widespread drying of wetlands, steadily increasing salinity18
In the US water allocations for environmental benefits ─ wetlands restoration, fish and
wildlife habitat preservation or protection, and augmenting stream flows ─ generally are initiated by
either the federal or state governments. The most active parties are the US Fish and Wildlife Service
and state departments of fish and game. The Endangered Species Act (ESA,
and the exposure of
previously submerged sulfur bearing sediments that have oxidized has generated high levels of
acidity. If current low flows continue there, and without some form of action, an ecological collapse is
forecast for the Lower Lakes and its associated wetlands (Australian Senate, 2008).
P.L. 93-205, 1973),
because it requires protection of critical habitat, has been a major source of federal court rulings
requiring reallocation of water from historical agricultural diversion to wetlands and stream flows.
The ESA also requires land developers in urban areas to provide water to mitigate potential habitat
damage (Brewer et. al., 2007).
18 Salinity measures in the lower lakes have varied from 17,000 to 40,000 EC. By contrast, sea water has a salinity of about 55,000 EC (Australian Senate, 2008).
14
Climate change likely will intensify conflict over these environmental objectives and
competing water uses. As in the MDB in Australia, in the Colorado River Basin already low flows
may further decline if snowpack levels fall from forecasted higher temperatures (Service, 2004).
Increased incidence and severity of forest fires and the difficulty of maintaining recreational values
and fish and riverine plant life in periods of low summer flows will make the trade-offs between use
and non-use values of water more challenging.
Water trading can assist in meeting environmental objectives. In the western US, following the
actions of state legislatures to expand the legal uses of surface water taken from rivers and streams to
include in-stream flows, water markets for recreational use, habitat protection, and water quality are
emerging (King, 2004). Where drought and irrigation leave streams dry in the late summer and fall,
private organizations and state agencies are leasing and purchasing water rights, most often from
irrigators, for in-stream use. These actions help protect streams listed as “water quality limited” by the
Federal Clean Water Act (P.L. 92-500, 1972) and the endangered or threatened fish stocks within
them (Neuman, 2004). Reliance upon voluntary exchanges of water to meet environmental objectives
is valuable because when parties reach mutually-beneficial agreements they avoid the divisive, time-
consuming rancor that has characterized arbitrary judicial and administrative water reallocation.19
Patterns and Benefits of Water Trading
The development of water markets in the past two decades has arisen from appreciation of the
value of ‘cap and trade’ mechanisms to allocate resources and their ability to promote economic
efficiency. Markets help mitigate water scarcity because they allow users with higher marginal values
in use to purchase or lease water rights from those who have lower marginal values and, thereby,
increase the aggregate benefits of water use. These trades also generate important information about
relative water values for consideration not only by current rights holders in their use and investment 19 An example is the 19-year conflict over Mono Basin water in California. This case, as well as broader problems of judicial reallocation, are examined in Brewer and Libecap (2009).
15
decisions, but also by regulators and judges in setting policy and resolving disputes across competing
uses and ‘in situ’ use.
The Nature of Water Trading in the US Southwest
To appreciate the gross gains from water trading, we utilize a data set of 4,168 exchanges
across 12 western states from 1987-2008 that is derived from transaction data chronicled by the
leading trade journal, Water Strategist.20
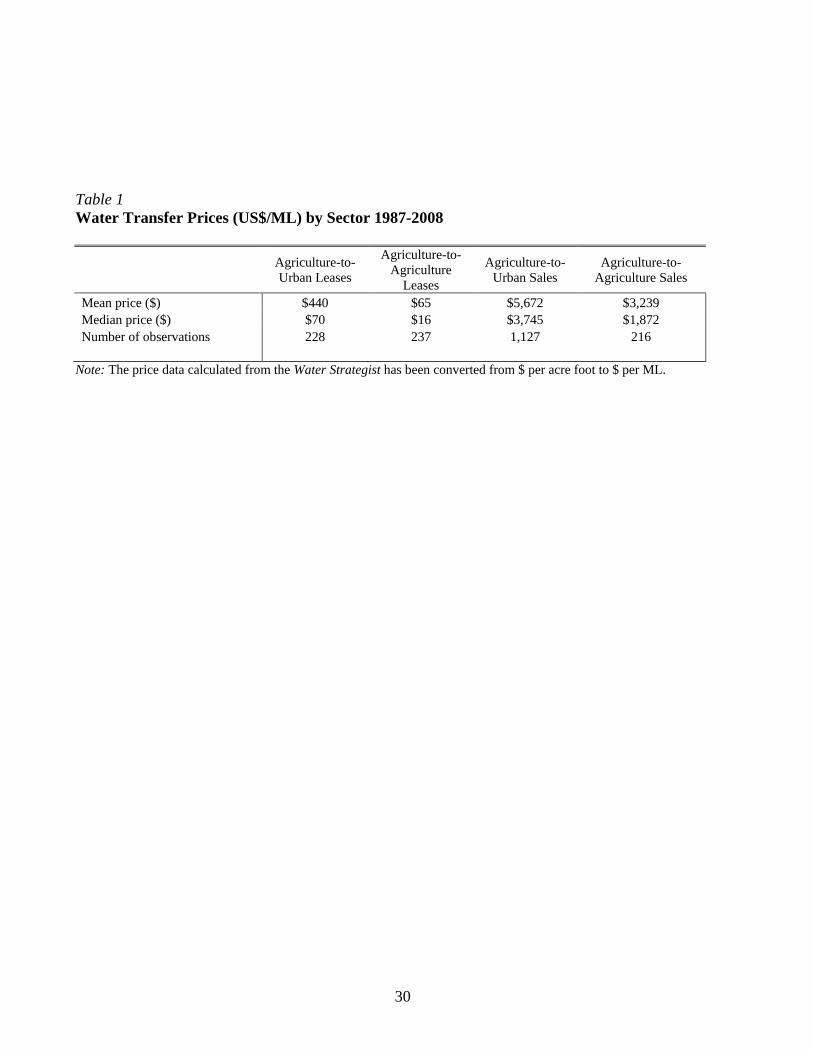
Table 1
Most trade activity is within the agricultural sector — it
represents 77 per cent of all water transactions and 62 per cent in volume of water traded. In terms of
the number of trades, the most numerous are from agricultural to urban users that accounts for over
half of all transfers, and 17 per cent of all water transferred over the 1987-2008 time period.
Table 1 shows that the median price of water leased from agricultural to urban uses is more
than four times higher than the lease price paid within the agricultural sector. The sale price for
agricultural-urban trade is about double the price paid within agriculture. These values are indicative
of the gains from cross-sector trading.
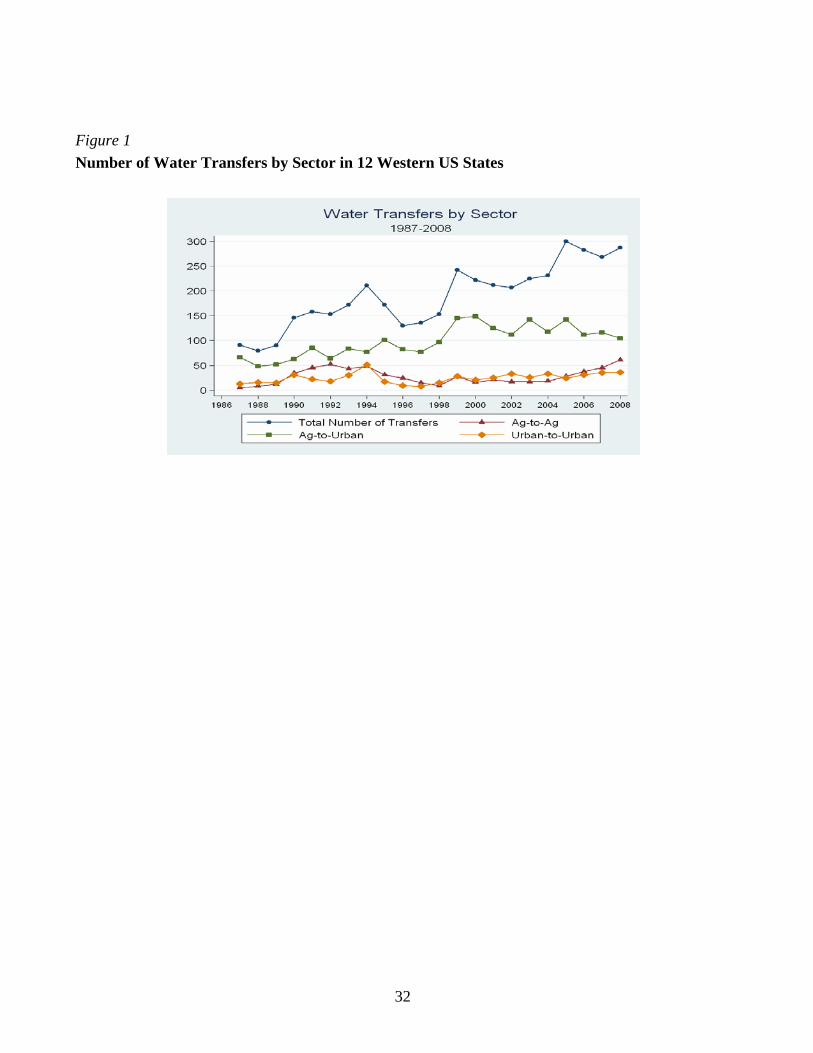
Figures 1 and 2
Figure 1 illustrates water trades across time. It shows that the total number of water transfers is
increasing and has grown from 91 in 1987 to 287 in 2008. Among these, the largest transfers are
agriculture-to-urban that have risen from 66 in 1987 to 105 in 2008. However, there is no obvious
trend for water transactions for within-sector trades: agriculture-to-agriculture and urban-to-urban
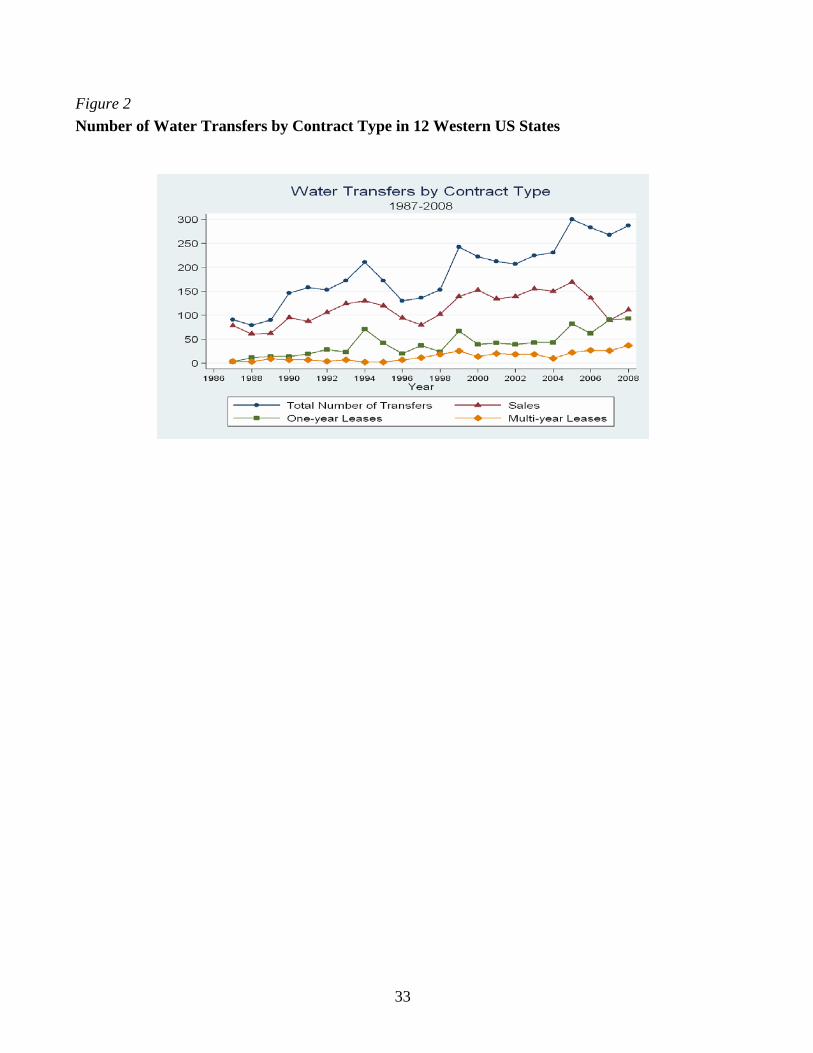
trades. Figure 2 illustrates the type of contract used: sales of water rights; one-year leases; and multi-
20 The water transaction database constructed from interpretation of entries in the Water Strategist is maintained at http://www.bren.ucsb.edu/news/water_transfers.htm.
16
year leases. Sales of water rights have been the most active type of trade, in part reflecting the many
sales that take place within Colorado, as revealed in Table 2.21
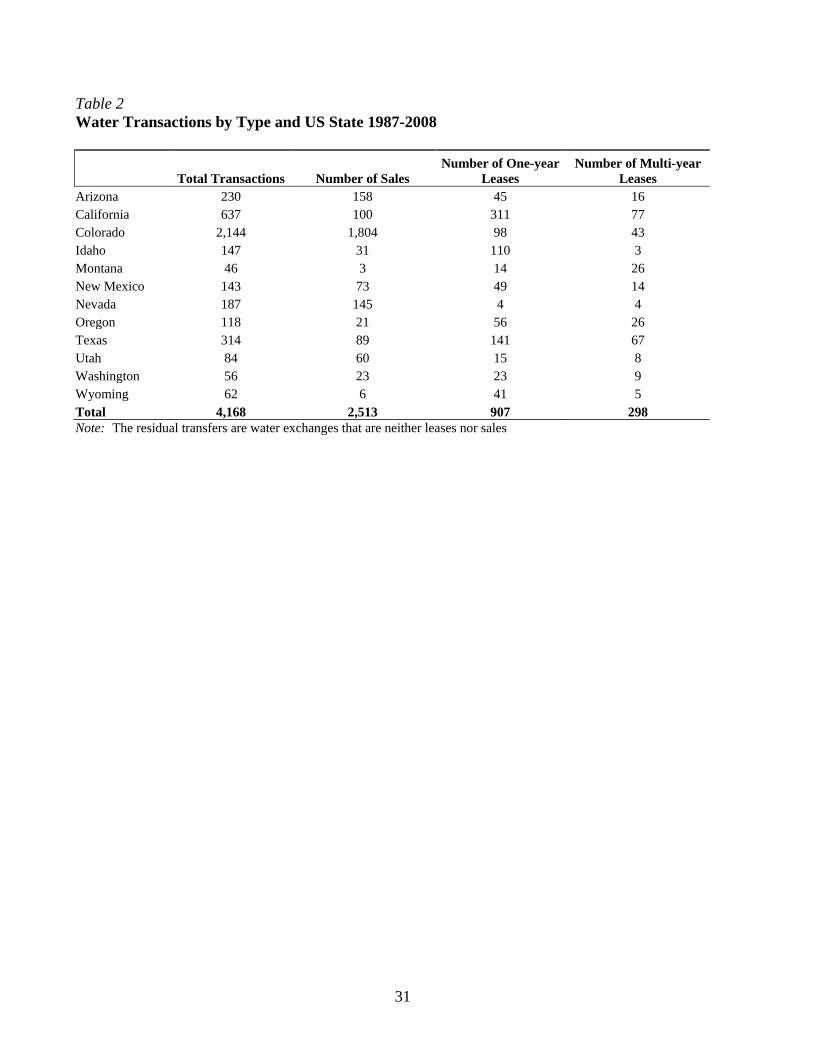
Table 2
Table 2 presents data on the nature of water market activity across western US states. Sales as
a share of transactions typically are important in the most arid states of Arizona, Colorado, Nevada,
New Mexico, and Utah. Short-term leases (1-year) are most common in California and Texas. Sales
and long-term leases are limited in California, for example, by county ordinances that prohibit exports
of water and irrigation district bylaws that limit out-of-district trades.22
It is difficult to determine the overall extent of water trading in the U.S. Our data are
interpreted from transactions listed in the Water Strategist. To the degree that this listing is not
inclusive, we will miss transactions. Further, internal, short-term exchanges within irrigation districts
are not recorded and these may be extensive.
23 Additionally, data on overall water diversions or
consumption across the states are not annually assembled. Nevertheless, it is possible to compute
some measures of water trading. In 2004 the US Geological Survey published water diversions by
state in 2000.24
21 As Brewer et. al. (2008a, 96, 106) point out, Colorado dominates in part because of the ease of trading within the Colorado-Big Thompson Project where rights are defined clearly and uniformly and trading within it jurisdiction (Northern Colorado Conservancy District) is relatively routine. The discussion in the text also reveals significant trading activity in the South Platte River Basin of Colorado.
Using those measures as indications of long-term water diversions and the annual
trading data from the Water Strategist, it is possible to present those trades as a share of the USGS
2000 data. For key states of Arizona, California, Colorado, Nevada, the resulting estimates are less
22 The composition of district governing boards also can be an issue. When elected community-wide they may be less likely to approve water transfers than when elected by property owners. For a discussion of the problems of water trading within California, see Haddad (1999), Rosen and Sexton (1993), and Brewer et al. (2008b). 23 Ellen Hanak (2002) describes internal market transactions in one of the largest irrigation districts in California, the Westlands Water District, based on research by (Sunding, 2000).These amounted to 300,000—400,000 acre-feet annually in the mid 1990s, or about one-third of the district’s total water supplies. Many intra-district transactions are very short term, within a year. 24 USGS, 2004, Circular 1268 for 2000. Total AF/Year Water Consumed was compiled by the USGS in 2000 for each US state, aggregate fresh groundwater and surface water withdrawals in AF/Year. This number includes Public Supply (11%), Irrigation (34%), aquaculture, (<1%), mining, (<1%), Domestic (<1%), livestock (<1%), industrial (<1%), thermo electric power (48%). Thermo electric power water that is saline is omitted from the above calculations. http://pubs.usgs.gov/circ/2004/circ1268/pdf/circular1268.pdf
17
than 2 percent of state water diversions.25
One of the most active water markets in the western US is Colorado’s South Platte Basin. Like
many regions of the West, water use was developed to support irrigated agriculture, where more than
3,088 GL or 80 per cent of the accessible surface water irrigates approximately 400,000 hectares of
land. Prices for water rights traded in this region vary substantially according to their legal
characteristics and location of the water shares, among other factors.
Although these are only approximates, they indicate how
limited water markets are and the potential gains from further trade.
26
The Nature of Water Trading in Murray-Darling Basin
The average price for recorded
transactions is about $10,000/ML while the median price is $8,700/ML, significantly higher than the
overall western data shown in Table 1. However, prices have ranged from a low of $3,700/ML to as
much as $86,000/ML depending upon location and transaction volume. In general, the highest prices
involve transactions of less than one ML. This is consistent with other water markets where real
estate developers require small volumes to allow the construction of single-family homes and
suburban developments. Lower prices tend to be associated with water rights that are located further
downstream on the South Platte River, or downstream of growing population centers, and for water
that has legal or physical characteristics that limits application to urban uses.
In 2007-08 the value of water traded in the states of New South Wales, South Australia, and
Victoria for water entitlements (permanent water rights) was $547 million and $585 million for
seasonal allocations (temporary water) (National Water Commission, 2008).27
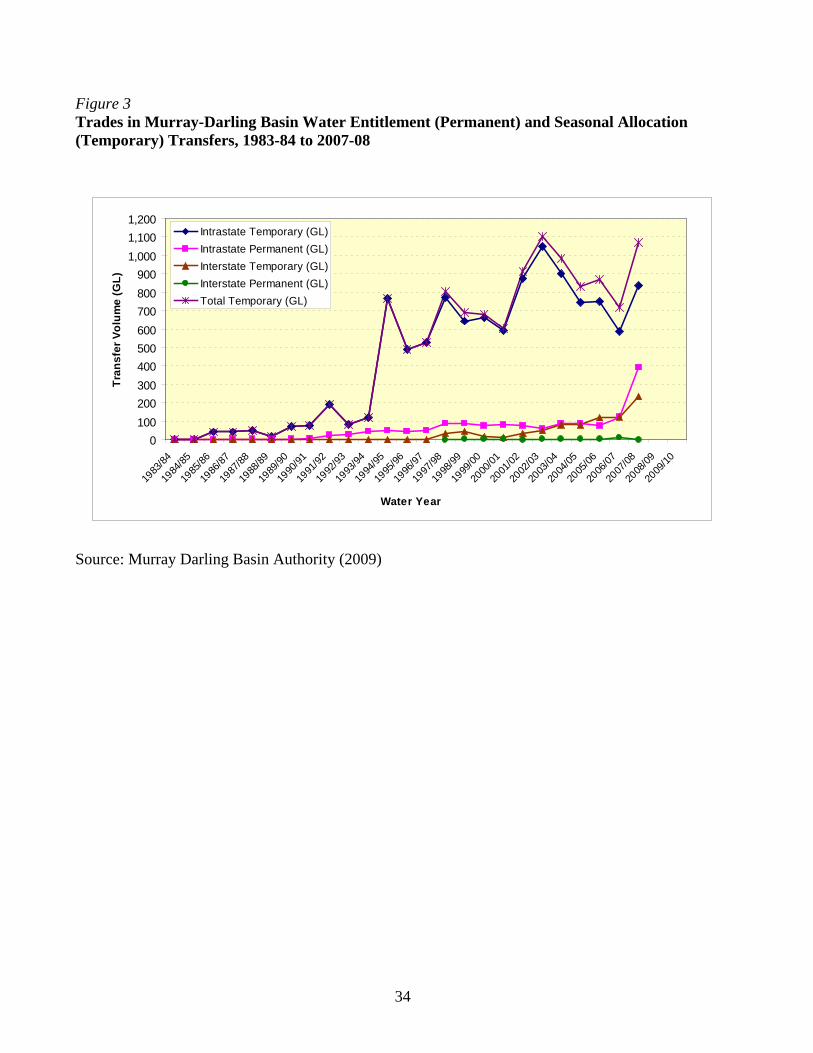
Figure 3
Since temporary water trading was permitted in the 1980s, the MDB water market has
expanded greatly. Substantial increases in trade occurred in the 1990s coincident with the freeing up
23 Arizona 42,293/7,417,900 (.6%), California 538,950/42,705,408 (1.3%), Colorado 113,703/14,045,302 (.8%), Nevada 5,197/3,098,859 (.2%), and Texas 20,534/16,792,000 (.12%). 26 The prices reported here for Colorado are from Westwater Research. 27 To assist in comparison between the US and Australia, Australian dollars are converted at the rate $1 Aus =$USD 0.70.
18
of the water entitlement trade, and again in the past five years as a consequence of the drought. Figure
3 shows the growth in the water traded by volume for water entitlements and seasonal allocations over
the past 25 years in the MDB. The trade in seasonal allocations is much greater than water
entitlements because of restrictions on trade in water entitlements, and also because some irrigators
may view high reliability water entitlements as a hedge against future uncertainties (Grafton and
Peterson, 2007).
The drought that began in 2001-2002 and is on-going in 2009 has fostered greater trading
because of the dramatically reduced seasonal allocations of water. This has resulted in zero opening
seasonal allocations to many general security water entitlements in the recent past, and historically
low allocations to high security water entitlements at the start of the irrigation season. To make up the
shortfall those irrigators with high marginal values of water have entered the water market to secure
water that, in the past, they would have received as seasonal allocations assigned to their own water
entitlements. As a result, the volume of water trade increased by close to half, in terms of volume,
from 2004-5 to 2007-08.
The benefits of trade accrue to both buyers and sellers, although not necessarily in equal
proportion. The principal beneficiaries of water trading in the MDB have been perennial farmers who
irrigate orchards and vineyards and who, despite having high reliability water entitlements, have
found that their assigned seasonal allocations were less than they expected and needed. Without the
ability to purchase seasonal allocation (temporary) water over the past four years, many of their
vineyards and orchards would have suffered major harm or died in the present drought. Sellers of
seasonal water have also benefited as the increased volume of sales, at high water prices, provide an
important source of income.
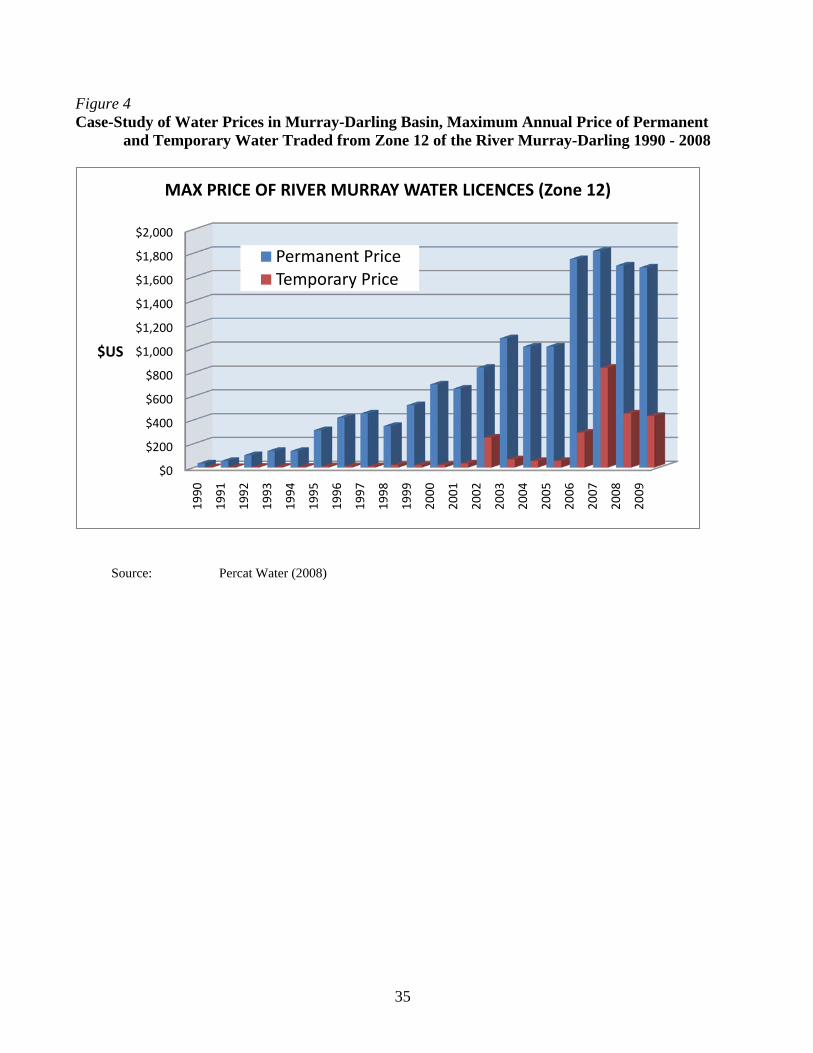
Figure 4
19
Increasing market prices are illustrated in Figure 4 and reflect the implementation of cap and
trade policies and, more recently, the drought in south eastern Australian. Higher prices have
encouraged investments in on-farm water efficiency. The ability to trade and to adjust the volume and
mix of high and low reliability water entitlements to reduce risks of insufficient water supplies has
also permitted investments in perennial agriculture that may otherwise not have been contemplated.
Benefits of Water Trading: Reallocation in the Southwestern US
Growing demands for fresh water in the presence of climate change and the likelihood of
greater supply variability underscore the importance of smooth, low-cost reallocation made possible
by water markets. In the US, a few price examples illustrate the underlying problem of misallocation
of water, reflecting the limited extent of (but potential for) water markets. Farmers typically pay only
for the pumping or conveyance costs for water and not for its scarcity value. For example, irrigators in
the Imperial Irrigation District, east of San Diego, have paid $21/ML for their water, whereas an
urban household that used the same amount in a year would pay $1,619/ML or more. Conveyance and
water quality, of course, are not the same in agriculture and urban use, but even accounting for these
differences prices differ sharply. For instance, the same, high-quality groundwater used for farming
near Marana, Pima County, Arizona costs approximately $33/ML, whereas that groundwater supplied
for nearby Tucson Water costs its customers a minimum of $5,532/ML (Brewer et al., 2008a).
The price data in Table 1 underscore the opportunity for more valuable use of water through
further reallocation across sectors and also the consequences of restrictions to trade and high
transaction costs. Prescriptive policies, such as mandated regulation of water use and rationing, as is
being implemented in drought-plagued California in 2009, and possible subsidies for high-cost
alternative sources, such as desalinization, fail to internalize the opportunity cost of water or to
mobilize private incentives for conservation and reallocation. They also generate substantial welfare
20
losses compared to the use of scarcity pricing whereby the price of water is raised as the amount water
available declines (Grafton and Ward, 2008).
Benefits of Water Trading: Reallocation in the MDB
In Australia the price differentials between urban and rural water users is much less that in the
western US. Prices for seasonal allocations of water currently vary by catchment and over an
irrigation season but range from $70 to $350/ML, although much lower prices have been recorded
($5/ML), and also much higher (up to $840/ML) during record low inflows in 2006-2007. By
contrast, urban water consumers living in or near the MDB pay, depending on the city or town and
their household consumption, between $800 and $2,700/ML for potable water. Given the substantial
costs involved in disinfecting and conveying potable water to consumers 24 hours per day, 365 days
per year there is essentially no price differential between urban water consumers and irrigators at the
bottom end of the prices charged to urban households. Nevertheless, given the high costs of new
supplies, such as desalination, state governments are beginning to use existing rural water markets for
urban water supplies and are building infrastructure to access rural water.
South Australia purchased 18 GL of water entitlements in 2005 to provide additional urban
water supplies (South Australia Water, 2006). The State of Victoria is spending over $700 million to
construct pipelines from its northern catchments to pipe over 100 GL/year of water to towns and cities
in the South. The Australian Capital Territory government, and its private-sector partner, is building a
pipeline to pump water from the Murrumbidgee River, one of the largest tributaries to the Murray
River, to a storage facility. After the pipeline is built, the plan is to access rural water by purchasing
water entitlements to provide an additional source of supply of up to 20 GL/year, or about 30 % of
annual water use.
A fundamental problem in the MDB is the over allocation of water entitlements such that
surface water entitlements exceed the amount available for diversions. This arose from a massive
21
expansion in irrigation post World War II that coincided with a period of high inflows. For instance,
average surface water availability over the period 1951-2000 was over 17,000 GL/year, despite
substantial year-to-year fluctuations. By contrast, water availability was about 50 per cent less over
the period 1900-1950 and was less than a third of this amount over the period 2001-2007 (Wentworth
Group, 2008).
Although state governments have the legal authority to appropriate water entitlements without
compensation, governments have eschewed this option because of the impact on irrigators and their
communities. Instead, beginning in 2004, Australian governments have undertaken buybacks of water
entitlements and subsidized investments in water efficiency improvements with the goal of recovering
500 GL of water for environmental purposes. This program was greatly expanded in 2007 and
updated in 2008 with funding from the Australian government that includes planned spending over
the next ten years of over $2 billion for the purchase of water entitlements and about $4 billion to
promote water efficiency improvements (Connell and Grafton, 2008).
Water Market Reform
Water markets in the US Southwest and the MDB have been able to deliver, in gross terms,
multi-billion dollar gains from trade. The markets have helped in allocating increasingly scarce water
supplies among competing agricultural, urban, and environmental uses. They have facilitated
economic development, supported agriculture, and assisted in meeting environmental objectives. By
providing an explicit price for a scarce resource, water users have made investments and developed
practices to conserve water.
Unfortunately, the potential benefits of water markets have not been fully realized due to:
incomplete definition of property rights to surface and ground water; overallocation of initial water
rights in excess of projected water availability; unjustified constraints on trading imposed by local
water supply organizations and governments; a lack of policy coordination across state and federal
22
water agencies; regulatory restrictions on trade, including the imposition of fees and charges designed
to limit permanent water trade; a lack of commitment to water markets in the US and long
administrative review delays of proposed transfers; and in the MDB, failure to include all sources of
water in a cap-and-trade water market together with an insufficient consideration and allocation by
regulators of water for the environment.
To improve the performance of water markets we propose, as a minimum requirement,
adopting the ‘three pillars’ of integrated water resource management (IWRM): economic efficiency,
equity and environmental sustainability as a guide to water reform (Food and Agricultural
Organization, 1996). Economic efficiency requires that markets ensure that water is utilized in it
highest value in use (diversions and ‘in situ’ use). Equity demands that initial allocations of water
fairly account for past use and access and also, historical and cultural ties, and do not discriminate
against or favor particular interests independent of these associations. Environmental sustainability
ensures that the overall use and trades of water do not compromise societal objectives of maintaining
or enhancing ecosystem services directly affected by water use. The requirements of equity and
environmental sustainability suggest that water markets will fall short of their potential in locations,
regions or countries that lack a well-established and accessible system of jurisprudence, compliance
and monitoring (Thobani, 1997), and also processes or procedures in place to account for the public
interest.
Reform options consistent with the ‘three pillars’ include: 1. defining, measuring and
recording surface water rights with a accessible and reliable public registry to ensure confidence in
water trading; 2. defining groundwater rights in the same manner and managing aquifers as a unit and
not as individual pumping areas while also managing surface and groundwater extractions jointly; 3.
removal of unnecessary restrictions on trade imposed arbitrarily for the benefit of particular or
favored groups at the expense of the public interest, within and across states and, in the US, a
23
commitment to use water markets to promote water transfers; 4. a regulatory review process for trades
that is transparent, streamlined, and, in the US, limits on outside protests of transfers to include clearly
defining standing for protests, restrictions on the amount of time involved and clear procedures; 5.
coordination among the many water supply/management organizations and authorities; 6. reform in
the US of water supply organization management boards so that membership is determined by rights
holders and not voters in a district; 7. commitment, where possible, to recognize water rights with
compensation for transfers to the environment; 8. explicit and adequate allocations of water for the
environment to maintain adequate ecosystem services; 9. basin or catchment-wide management to
account for hydrological and environmental realities; 10. requirement that water rights incorporate the
relevant climatic, geologic, and hydraulic information so that when water is traded these
characteristics are accounted to ensure reliability of supply; 11. support for the unbundling of water
rights, where cost effective, into storage, diversion, use and disposal rights; and 12. management of
climatic risks to allow at least two levels of reliability of delivery so users can develop a portfolio of
rights to satisfy different risks and priorities.
Concluding Remarks
Water markets of the US Southwest and Australia’s Murray-Darling Basin show that allowing
trade of water across users and uses generates large benefits. Despite substantial differences in the
origins and specification of the rights, the two markets show that where there is a separation of water
and land rights, an appropriate institutional and legal framework for trading, an acceptable allocation
of rights based on past use and non-use, and adequate monitoring and enforcement of diversions,
markets allow for the transfer of water from low to higher valued uses. The gross gains from trade in
these two markets are worth billions of dollars annually and have increased in recent years as water
scarcity has become more pronounced.
24
Despite the substantial benefits from trade, water markets in the US and Australia have still
not yet achieved their full potential. In particular, arbitrary restrictions on trade have compromised the
ability of parties to voluntarily exchange water and in the MDB, of governments to secure adequate
water for the environment and reduced efficiency gains. Both markets also suffer from an over
allocation of the initial water rights. This has made it more difficult to reduce diversions in the same
proportion as environmental flows in times of drought and compromised the long-term sustainability
of aquatic and riparian environments. Differences in the specification of rights and in the registers of
water rights across jurisdictions have also prevented full harmonization and integration of water
markets based on catchment or hydrological boundaries rather state borders.
The successes and limitations of water markets in the US Southwest and the Murray-Darling
Basin provide important insights into how to mitigate water scarcity. On-going water market reform
in these two locations and the development of water markets in other countries with accessible
systems of jurisprudence, compliance and monitoring and also processes to account for the public
interest offer the hope of managing water in an integrated way that promotes equity, environmental
sustainability and economic efficiency.
25
REFERENCES Allen Consulting Group. 2006. Transaction Costs of Water markets and Environmental Policy Instruments. Water Study Report. Melbourne: Productivity Commission. Anderson, Terry, and Ronald N. Johnson. 1986. “The Problem of Instream Flows.” Economic Inquiry, 24(4): 535-53. Arizona State Legislature. 2009. “Arizona Revised Statutes 45-401.” Available at http://www.azleg.state.az.us/ArizonaRevisedStatutes.asp?Title=45. Australian Competition and Consumer Commission (ACCC). 2006. A Regime for the Calculation and Implementation of Exit, Access and Termination Fees Charged by Irrigation Water Delivery Businesses in the Southern Murray–Darling Basin. 6 November. Dickson, ACT: ACCC.
Australian Senate: The Standing Committee on Rural and Regional Affairs and Transport. 2008. Water Management in the Coorong and Lower Lakes. Canberra: Department of the Senate, Parliament House. Bachmann, Steven, Carl Hauge, Russell McGlothlin, Kevin Neese, Timothy Parker, Anthony Saracino, and Scott Slater. 2005. California Groundwater Management, 272pp, Sacramento: Groundwater Resources Association of California.
Barnett, Tim P., David W. Pierce, Hugo G. Halliday, Celine Bonfils, Benjamin D. Santer, Tapash Das, Govindasamy Bala, Andrew W. Wood, Toru Nozawa, Arthur A. Mirin, Daniel R. Caya, and Michael D. Dettinger. 2008. “Human-induced Changes in the Hydrology of the Western United States.” Science 319: 1080-1083. Barzel, Yoram. 1982. “Measurement Costs and the Organization of Markets.” Journal of Law and Economics, 25(1): 27-48. Bjornlund, Henning. 2003. “Efficient Water Market Mechanisms to Cope with Water Scarcity.” Water Resources Development, 19(4): 553-567. Blomquist, William, Edella Schlager and Tanya Heikkila. 2004. Common Water, Diverging Streams: Linking Institutions and Water Management in Arizona, California, and Colorado, 205 pp, Washington DC: Resources for the Future. Brewer, Jedidiah and Gary D. Libecap. 2009. “Property Rights and the Public Trust Doctrine in Environmental Protection and Natural Resource Conservation,” Australian Journal of Agricultural and Resource Economics 53: 1-17.
Brewer, Jedidiah R, Robert Glennon, Alan Ker, and Gary D. Libecap. 2007. “Transferring Water in the American West, 1987-2005.” Michigan Journal of Law Reform, 40(4): 1021-53.
Brewer, Jedidiah R, Robert Glennon, Alan Ker, and Gary D. Libecap. 2008a. “Water Markets in the West: Prices, Trading, and Contractual Flows.” Economic Inquiry, 46(2): 91-112.
26
Brewer, Jedidiah R, Robert Glennon, Alan Ker, and Gary D. Libecap. 2008b. “Law and the New Institutional Economics: Water Markets and Legal Change in California, 1987-2005.” Washington University Journal of Law and Policy, 26: 183-202.
Bruns, Bryan R., and Ruth S. Meinzen-Dick (Eds). 2000. Negotiating Water Rights. London: International Food Policy Research Institute. Carton, Jim. 2009. “California’s Water Bank Tapped to Fight Drought.” The Wall Street Journal¸ April 23. Available at http://online.wsj.com/article/SB124044678660345897.html
Colby, Bonnie G. 1990. “Transaction Costs and Efficiency in Western Water Allocation.” American Journal of Agricultural Economics, 72: 1184-92.
Connell, Daniel. 2007. Water Politics in the Murray-Darling Basin. Sydney, NSW: The Federation Press. Connell, Daniel, and R. Quentin Grafton. 2008. “Planning for Water Security in the Murray-Darling Basin.” Public Policy, 3(1): 67-86.
Davies, Peter E., John H. Harris, Terry J. Hillman, and Keith F. Walker. 2008. Sustainable Rivers Audit Report 1: A Report on the Ecological Health of Rivers in the Murray-Darling basin 2004-2007. Prepared by the Independent Sustainable Rivers Audit Group for the Murray-Darling Basin Ministerial Council. Murray-Darling Basin Commission, Canberra.
Dinar, Ariel, Shlomi Dinar, Stephen McCaffrey, and Daene McKinney. 2007. Bridges over Water: Understanding Transboundary Water Conflict, Negotiation and Cooperation. Hackensack, NJ :World Scientific Publishing.
Duggan, Kate, Sara Beavis, Daniel Connell, Karen Hussey, and Ben MacDonald. 2008. Approaches to, and Challenges of Managing Interception. Waterlines Occasional Paper No. 5, National Water Commission: Canberra. Economist. 2009. Water: Sin aqua non. April 8, 2009. Food and Agriculture Organization of the United Nations (FAO). 2006. Water Monitoring: Mapping Existing Global Systems & Initiatives Background Document — August 2006. Prepared by the FAO on behalf of the UN-Water Task Force on Monitoring Stockholm, 21 August. Getches, David H. 1997. Water Law in a Nut Shell, St. Paul: West Publishing Company.
Glennon, Robert Jerome. 2002. Water Follies: Groundwater Pumping and the Fate of America’s Fresh Waters, Washington D.C.: Island Press. Gould, George A. 1995. “Recent Developments in the Transfer of Water Rights.” In: Water Law: Trends, Policies, and Practice, eds. Kathleen Marion Carr and James D. Crammond, Chicago: American Bar Association, 93-103.
27
Grafton, R. Quentin and Deborah Peterson. 2007. “Water Trading and Pricing.” In: Managing Water for Australia, eds, Karen Hussey and Stephen Dovers, Collinwood: CSIRO Publishing, 73-84.
Grafton. R. Quentin and Michael Ward. 2008. “Prices versus Rationing: Marshallian Surplus and Mandatory Water Restrictions.” The Economic Record, 84: S57-65. Gray, Brian E. 1994. “The Modern Era in California Water Law.” Hastings Law Journal, 45 January, 249-308. Griffin, Ronald C. and Fred O. Boadu. 1992. “Water Marketing in Texas: Opportunities for Reform.” Natural Resources Journal, 32: 265-88. Haddad, Brent M. 1999. Rivers of Gold: Designing Markets to Allocate Water in California. Washington D.C.: Island Press. Hanak, Ellen. 2002. California’s Water Market, by the Numbers, San Francisco: Public Policy Institute of California. Johnson, Ronald N., Micha Gisser, and Michael Werner. 1981. “The Definition of a Surface Water Right and Transferability.” Journal of Law and Economics, 24 (2): 273-88.
King, Mary A. 2004. “Getting Our Feet Wet: An Introduction to Water Trusts.” Harvard Environmental Law Review, 28 (2): 495-534. Legislative Analyst`s Office. 2008. California’s Water: An LAO Primer. Sacramento. Lueck, Dean.1995. “The Rule of First Possession and the Design of the Law.” Journal of Law and Economics 38 (2): 393-436. Martin, Warren. 2005. Water Policy History on the Murray River. Deniliquin, NSW: Southern Riverina Irrigators.
Murray-Darling Basin Authority. 2009. MDB Water Trading Data requested by Personal Communication, June 2009.
Murray-Darling Basin Commission.1995. An Audit of Water Use in Murray-Darling Basin. Available at http://www.mdbc.gov.au/_data/page.86/95_Audit_report.pdf, accessed 28 October 2007.
Murray-Darling Basin Commission. 2008. Update Summary of Estimated Impact of Groundwater Extraction on Stream Flow in the Murray-Darling Basin. Publication No. 09/09, Canberra: Murray-Darling Basin Commission. National Land and Water Resources Audit. 2001. National Land and Resources Audit. Canberra: National Heritage Trust.
National Water Commission. 2008. Australian Water Markets Report 2007-2008. Canberra: National Water Commission.
28
Neuman, Janet. 2004. "The Good, The Bad, and The Ugly: The First Ten years of the Oregon Water Trust." University of Nebraska Law Review, 83: 432-84. Percat Water (2008). Trading data. Compiled by bb R.J. O'Brien.
Productivity Commission. 2003. Water Rights Arrangements in Australia and Overseas. Commission Research Paper. Melbourne: Productivity Commission.
Productivity Commission. 2006. Rural Water Use and the Environment: The Role of Market Mechanisms. Research Report, August, Melbourne: Productivity Commission.
Sax, Joseph L. 1990. “The Constitution, Property Rights and the Future of Water Law.” University of Colorado Law Review, 61: 257-82. Sax, Joseph L., Barton H. Thompson, Jr., John D. Leshy, and Robert H. Adams. 2006. Legal Control of Water Resources, 4th ed., St. Paul, MN: Thomson/West. Scott, Anthony D. 2008. The Evolution of Resource Property Rights. Oxford: Oxford University Press.
Service, Robert F. 2004. “As the West Goes Dry.” Science, 303: 1124-1127. Shiklomanov, I.A. 2003. “World Water Use and water Availability.” In: World Water Resources at the Beginning of the 21st Century, eds, I.A. Shiklomanov and John C. Rodda, Cambridge: Cambridge University Press, UNESCO. Smith, Henry. 2008. “Governing Water: The Semicommons of Fluid Property Rights.” Arizona Law Review, 50: 445-78.
South Australia Water. 2006. Annual Report 2004-2005. Adelaide: South Australia Water. Sunding, David. 2000. “The Price of Water…Market-based Strategies are Needed to Cope with Scarcity,” California Agriculture, 54(2): 56–63. Thobani, Mateen. 1997. “Formal Water Markets: Why, When, and How to Introduce Tradable Water Rights.” The World Bank Research Observer, 12(2): 161-179.
Thompson Jr, Barton. 1993. “Institutional Perspectives on Water Policy and Markets.” California Law Review, 81(3): 671-764.
van Dijk, Albert, Ray Evans, Peter Hairsline, Shahbaz Khan, Rory Nathan, Zahra Paydar, Neil Viney and Lu Zhang. 2006. Risks to the Shared Water Resources of the Murray-Darling Basin. MDBC Publication 22/06, Canberra: Murray-Darling Commission.
Wentworth Group of Concerned Scientists. 2008. Submission to the Senate Inquiry on the Urgent Provision on Water the Coorong and the Lower Lakes. Available at http://www.wentworthgroup.org/docs/Senate_Submission_Response_to_the_Coorong_Crisis1.pdf, accessed 4 May 2009.
29
World Water Assessment Program. 2009 The United Nations World Water Development Report 3: Water in a Changing World. Paris: UNESCO. Xie, Jian, Andres Liebenthal, Jeremy J. Warford, John A. Dixon, Manchuan Wang, Shiji Gao, Shuilin Wang, Yong Jiang, and Zhong Ma. 2009. Addressing China’s Water Scarcity: Recommendations for Selected Water Resource Management Issues. Washington D.C.: International Bank for Reconstruction and Development, The World Bank.
30
Table 1 Water Transfer Prices (US$/ML) by Sector 1987-2008
Agriculture-to-Urban Leases
Agriculture-to-Agriculture
Leases
Agriculture-to-Urban Sales
Agriculture-to-Agriculture Sales
Mean price ($) $440 $65 $5,672 $3,239 Median price ($) $70 $16 $3,745 $1,872 Number of observations 228 237 1,127 216
Note: The price data calculated from the Water Strategist has been converted from $ per acre foot to $ per ML.
31
Table 2 Water Transactions by Type and US State 1987-2008
Total Transactions Number of Sales Number of One-year
Leases Number of Multi-year
Leases Arizona 230 158 45 16 California 637 100 311 77 Colorado 2,144 1,804 98 43 Idaho 147 31 110 3 Montana 46 3 14 26 New Mexico 143 73 49 14 Nevada 187 145 4 4 Oregon 118 21 56 26 Texas 314 89 141 67 Utah 84 60 15 8 Washington 56 23 23 9 Wyoming 62 6 41 5 Total 4,168 2,513 907 298 Note: The residual transfers are water exchanges that are neither leases nor sales
32
Figure 1 Number of Water Transfers by Sector in 12 Western US States
33
Figure 2 Number of Water Transfers by Contract Type in 12 Western US States
34
Figure 3 Trades in Murray-Darling Basin Water Entitlement (Permanent) and Seasonal Allocation (Temporary) Transfers, 1983-84 to 2007-08
Source: Murray Darling Basin Authority (2009)
0100200300400500600700800900
1,0001,1001,200
1983
/84
1984
/85
1985
/86
1986
/87
1987
/88
1988
/89
1989
/90
1990
/91
1991
/92
1992
/93
1993
/94
1994
/95
1995
/96
1996
/97
1997
/98
1998
/99
1999
/00
2000
/01
2001
/02
2002
/03
2003
/04
2004
/05
2005
/06
2006
/07
2007
/08
2008
/09
2009
/10
Water Year
Tran
sfer
Vol
ume
(GL)
Intrastate Temporary (GL)Intrastate Permanent (GL)Interstate Temporary (GL)Interstate Permanent (GL)Total Temporary (GL)
35
Figure 4 Case-Study of Water Prices in Murray-Darling Basin, Maximum Annual Price of Permanent
and Temporary Water Traded from Zone 12 of the River Murray-Darling 1990 - 2008
Source: Percat Water (2008)
$0
$200
$400
$600
$800
$1,000
$1,200
$1,400
$1,600
$1,800
$2,000
1990
1991
1992
1993
1994
1995
1996
1997
1998
1999
2000
2001
2002
2003
2004
2005
2006
2007
2008
2009
$US
MAX PRICE OF RIVER MURRAY WATER LICENCES (Zone 12)
Permanent PriceTemporary Price
Recommended