UNIVERSITÉ DU QUÉBEC
MEMOIREPRÉSENTÉ À
L'UNIVERSITÉ DU QUÉBEC À CHICOUTIMICOMME EXIGENCE PARTIELLE
DE LA MAÎTRISE EN INGÉNIERIE
ParFARANAK ARIANPOUR
Water and ice-repellent properties of nanocomposite coatingsbased on silicone rubber
Propriétés hydrophobes et glaciophobes de revêtementsnanocomposites à base de silicone
December 2010

11
Abstract
In cold-climate countries such as Canada, Norway, Russia, Finland, the USA,
China and Japan, ice accumulation on power network equipment may cause serious
problems resulting in power outages with socioeconomical consequences. This
situation is caused roughly by mechanical line failures or insulator flashovers,
involving several complex phenomena.
Coating the surface of structures exposed to atmospheric icing with anti-icing
materials can be an effective way to protect them against ice and snow adhesion and
accretion. Coatings with water contact angle greater than 150° have been the subject of
great interest during recent years. Such surfaces are called super-hydrophobic and are
prepared by combining appropriate surface roughness with low surface energy.
In the present work, flat and micro-/nano-rough water-repellent coatings based
on silicone rubber incorporated with nanopowders of carbon-black, titania and ceria as
dopants have been prepared and investigated. Such water-repellent coatings are
potential candidates for protecting high-voltage equipment such as conductors and
insulators.
The water-repellent properties of the coatings were evaluated showing good
incorporation of the dopant particles into silicone rubber. The anti-icing behaviour of
the different coatings was studied under atmospheric icing conditions. Rough super-
hydrophobic coatings prepared with TiO2 and CeO2 nanoparticles of different dielectric
constants ( TiO2.* ~80, CeC^: �60) resulted in reducing the ice adhesion strength of at
least ~ 7 times compared to a mirror-polished aluminum sample and ~ 9 times
compared to an as-received aluminum sample.

Ill
Freezing behaviour of small water droplets was investigated on such
nanostructured composite surfaces and compared with that on flat surfaces. At �15 °C,
small water droplets were observed to freeze on polished Al after approximately 5 s,
while their freezing was delayed to -12-13 min on super-hydrophobic nanocomposite
surfaces. This is explained by the insulating properties of the rough surfaces which
entrap a significant amount of air into their structure. Therefore, the coatings prepared
show promise for industrial applications on high-voltage equipment, including
insulators, since they can reduce ice accumulation, while also reducing the risk of
flashover on overhead high-tension insulators.
IV
Résumé
Dans les pays à climat froid comme le Canada, la Norvège, la Russie, la Finlande,
les États-Unis, la Chine et le Japon, l'accumulation de glace sur les équipements des
réseaux électriques peut causer de sérieux problèmes résultant en des pannes d'électricité
avec des conséquences socioéconomiques parfois désastreuses.
Le revêtement de la surface des structures exposées au givrage atmosphérique avec
des matériaux antigivre peut être un moyen efficace de les protéger contre l'adhésion et
l'accumulation de glace ou de neige. Les revêtements ayant un angle de contact de l'eau
supérieur à 150° ont fait l'objet de nombreuses études au cours de ces dernières années.
Ces surfaces sont appelées superhydrophobe et sont préparées en combinant une rugosité
de surface appropriée avec une faible énergie de surface.
Dans ce travail de recherche, on a élaboré et étudié des revêtements hydrophobes
plats et avec une micro-/nano-rugosité à base de caoutchouc de silicone où de la
nanopoudre de noir de carbone, de dioxyde de titane et d'oxyde de cérium (« dopants »)
avait été intégrée. Ces revêtements hydrophobes sont des candidats potentiels pour la
protection d'équipements haute tension tels que les conducteurs et les isolants, contre les
accumulations de glace ou de neige.
Les propriétés hydrophobes des revêtements ont été évaluées et montrent une
bonne incorporation des particules ajoutées au caoutchouc de silicone. Le comportement
antigivre des différents revêtements a été étudié dans des conditions de givrage
atmosphérique. Les revêtements superhydrophobes préparés avec des nanoparticules de
TiO2 et CeC>2 de constantes diélectriques différentes (TiCv ~80, CeC>2: �60) ont permis
de réduire la force d'adhérence de la glace par au moins sept fois par rapport à un

échantillon d'aluminium poli miroir et environ neuf fois par rapport à un échantillon
d'aluminium brut.
Le comportement de petites gouttelettes d'eau au cours de leur congélation a été
étudié sur des surfaces nanostructurées composites et sur des surfaces planes. À environ -
15 °C, de petites gouttelettes d'eau ont gelé sur de l'Ai poli après environ cinq secondes,
ce qui a pris -12-13 minutes sur des surfaces nanocomposite superhydrophobes. Cela
s'explique par les propriétés isolantes des surfaces rugueuses qui piègent une quantité
importante d'air dans leur structure. Par conséquent, les revêtements ainsi préparés sont
prometteurs pour des applications industrielles sur des équipements haute tension, y
compris les isolateurs, car ils peuvent en réduire l'accumulation de glace tout en
diminuant le risque de leur contournement électrique.
VI
Acknowledgments
This Masters' research was carried out within the framework of the Industrial
Chair on Atmospheric Icing of Power Network Equipment (CIGELE) and the Canada
Research Chair on Engineering of Power Network Atmospheric Icing (INGIVRE) at
University of Quebec in Chicoutimi (UQAC).
I would like to use this window of occasion to thank those who helped me to
complete this thesis. In the first place, I would like to thank wholeheartedly, my
Director, Prof. M. Farzaneh, for his support, supervision, guidance, encouragement
and patience, as well as deepest appreciation to Prof. Farzaneh's family for their warm
welcome and kind hospitality in Chicoutimi. He behaved with me like father. It is an honor
for me to earn my graduation under his supervision. Prof. Farzaneh is, without
question, an expert in his field and his duty. I would also like to express my deepest
gratitude to my co-director, Dr. Sergei Kulinich, for his excellent guidance and help
during my project. Thank you to my colleagues, technicians and professionals, Pierre
Camirand, Denis Masson and Xavier Bouchard, in CIGELE for their constant
companionship and assistance.
I would like to express my warmest and deepest appreciation to my dear
parents, sister and brothers who helped and encouraged me during in my studies,
especially my father and my brother Dr. G. Aryanpour for teaching me determination.
They have always stood by me and showed me how to reach my aims. I owe them
everything. Last but not least, I would like to express my most profound gratitude to my

vu
beloved husband, Shahram, for his true love and patience. His valuable and precious
advice was most important to complete my thesis. I wish the best you and look forward
to more great moments in the future with you.

vin
Table of Contents
Abstract.... ii
Résumé iv
Acknowledgments vi
Table of Contents viii
List of Figures xi
List of Tables xiv
List of Symbols and Abbreviations xv
CHAPTER 1 INTRODUCTION 1
1.1 The Problem of Icing 2
1.2 Current Solutions 3
1.3 Main Objectives 4
1.4 Methodology 6
1.5 Statement of Originality 8
1.6 The Outline of Thesis 9
CHAPTER 2 BACKGROUND AND LITERATURE REVIEW 12
2.1 Atmospheric Icing and Types of Ice 14
2.2 Ice Adhesion Mechanisms 19
2.3 Brief Review on Hydrophobic and Super-hydrophobic Properties 23

IX
2.3.1 Hydrophobicity and Contact Angle 23
2.3.2 Super-hydrophobicity and Roughness 26
2.4 Review of Nanoparticles incorporated in Silicone Rubber 34
CHAPTER 3 EXPERIMENTAL SETUP AND TEST PROCEDURES 39
3.1 Process of Coatings' Preparation 40
3.1.1 Substrate Cleaning 41
3.1.2 Producing Micro-/Nano-Rough Substrates 42
3.1.3 Preparation of Solution 43
3.1.4 Coating of the Samples 43
3.2 Sample Analysis and Characterization 45
3.2.1 Morphological Characterization 45
3.2.2 Wettability Tests 47
3.2.2.1 Contact Angle Measurement at Room Temperature 473.2.2.2 Contact Angle (CA) Measurement at Low Temperature 493.2.2.3 Ice Adhesion Test 50
CHAPTER 4 EXPERIMENTAL RESULTS AND DISCUSSION:HYDROPHOBIC AND SUPER-HYDROPHOBIC PROPERTIES OF FLATAND ROUGH SAMPLES WITH COATINGS ALUMINUM SUBSTRATE 53
4.1 Water Droplet Contact Angle on Hat Al Substrates 54
4.1.1 Carbon-Black Nanoparticle-Incorporated RTV SR Coatings 54
4.1.2 TiO2 Nanoparticles-Incorporated RTV SR Coatings 57
4.2 Water Droplet Contact Angle on Rough Aluminum Substrates 58
4.2.1 TiO2 Nanoparticles-Incorporated RTV SR Coatings 59
4.2.2 Carbon-Black Nanoparticles-Incorporated RTV SR Coatings 61
4.2.3 TiO2 Nanoparticles-Incorporated RTV SR Coatings 63
4.2.4 CeO2 Nanoparticles-Incorporated RTV SR Coatings 65

4.3 Surface Characterization 67
4.3.1 Scanning Electron Microscopy (SEM) 67
4.4 Summary and Conclusions » 72
CHAPTER 5 EXPERIMENTAL RESULTS AND DISCUSSION: ICEADHESION STRENGTH ON SAMPLE SURFACE 73
5.1 Ice Adhesion Strength of Rat Aluminum Substrate Coated with RTV SRIncorporated with Carbon-Black (CB) Nanoparticles 74
5.2 Ice Adhesion Strength on Rough Al Substrate Coated with RTV SR Incorporatedwith TiC>2 or CeÛ2 Nanoparticles 76
5.3 Adhesion Reduction Factor (ARF) Values of the Coated Samples 78
5.4 Contact Angle as a Function of Icing/de-icing Cycles 82
5.5 Summary and Conclusions 84
CHAPTER 6 EXPERIMENTAL RESULTS AND DISCUSSION: STABILITYOF SAMPLES IMMERSED IN DI- WATER AND FREEZING OF WATERDROPLETS ON SAMPLE SURFACES 86
6.1 Stability of Samples Immersed in DI Water 87
6.2 Freezing of Water Droplets on Sample Surfaces 90
6.3 Summary and Conclusions 95
CHAPTER 7 CONCLUSIONS AND RECOMMENDATION FOR FUTUREWORKS 97
7.1 Conclusions 98
7.2 Recommendations for Future Work 101
References 103

XI
List of Figures
Figure 2.1: (a) Soft rime, (b) hard rime ice on ridge-top vegetation, Sierra Nevada crest, (c)glaze 17
Figure 2.2: Schematic of liquid droplet in contact with a smooth solid surface (contact
angle, Bo) 24
Figure 2.3: A schematic diagram of hydrophobic surface (left), and hydrophilic surface(right) 26
Figure 2.4: Montage of some examples from nature: (a) Lotus effect [33], and (b) pond skaterwalking on water [54] 27
Figure 2.5: SEM micrographs (shown at three magnifications) of Lotus (Nelumbo nucifera) leafsurface which consists of microstructure formed by papillose epidermal cells covered with 3-Depicuticular wax tubules on surface, which create nanostructure [45] 28
Figure 2.6: Schematic and wetting of the four different surfaces. The largest contact area betweenthe droplet and the surface is given in flat and microstructured surfaces, but is reduced in JQnanostructured surfaces and is minimized in hierarchical structured surfacesFigure 2.7: (a) Contact angle for rough surface (9) (Wenzel regime) as a function of the
roughness factor (RJ) for various contact angles of the smooth surface (60), and (b) schematic ofsquare-based hemispherically-topped pyramidal asperities with complete packing 31
Figure 2.8: Schematics of configurations described by the (a) Wenzel equation for thehomogeneous interface (Eq. (6)), (b) Cassie-Baxter equation for the composite interface with airpockets (Eq. (9)), and (c) the Cassie equation for the homogeneous interface (Eq. (10)) 33
Figure 3.1: (a) The spin-coater (model WS-400B-6NPP, Laurell Technologies Corporation), (b)steps of coating preparation, (1) deposit solution, (2) spreading (low speed spin), (3) high speedspinFigure 3.2: Scheme of preparation of nano-powder incorporated RTV SR coatings onrough substrates ^5
Figure 3.3: KrussDSA 100 contact-angle goniometer 48
Figure 3.4: Measuring the advancing and receding contact angles on a sample with (a) alow hysteresis (static CA), and (b) a high hysteresis (advancing ( 9 A) and receding (8R)CAs 48
Figure 3.5: Contact-angle goniometer and cooling unit for measuring CA at lowtemperature (centre), enlarged Peltier device (left) and cooling/heating system (right) 49
Figure 3.6: (a) Centrifuge system, (b) sample with coating (1) in centrifuge set-up evaluating iceadhesion strength. (1) sample, (2) aluminum beam, (3) counter-weight 51
Figure 3.7: (a) Top view of atmospheric icing wind tunnel used and (b) a view of iceaccumulation procedure on coated samples in wind tunnel (b) 52

Xll
Figure 4.1: (a) Water drop on pure (non-doped) RTV SR coating, (b) water drop on RTV SRcoating with 6 vol. % of carbon-black nanoparticles incorporated, (c) contact angle vs. vol. % ofcarbon-black incorporated into coatings 55
Figure 4.2: AFM surface images of RTV SR coatings doped with 0 (a), 6 (b), 12 (c), and 18 vol.% (d) of carbon-black. Root-mean-square roughness (Rq> values are 128.2 (a), 178.11 (b), 261.93(c), and 295.81 nm(d) 56
Figure 4.3: Contact angle (white) and CAH (black) as a function of TiO2 concentration incoatings prepared by spin-coathngs RTV SR/hexane ratio (1:3 v/v) suspension on flataluminum 58
Figure 4.4: Contact angle of samples prepared by spin-coating RTV SR/hexane (1:1 v/v)suspension with 2 wt. % of T1O2 nanoparticles incorporated as a function of etching timeof the substrate used ^0
Figure 4.5: Contact angle hysteresis of coatings prepared (1:1 v/v) RTV SR/hexanesolution with 2 wt. % of TiÛ2 nanoparticles incorporated as a function of etching time ofthe substrate (Al alloy in diluted HC1) 60
Figure 4.6: (a) Water contact angle (CA) and (b) water contact angle hysteresis (CAH) of coatingprepared by spin-coating hexane dilution of RTV SR (1:4) with 3 wt. % carbon black nanoparticlesincorporated, (c) contact angle (white) and CAH (black) as a function of different concentration ofRTV SR with 3 wt.% of carbon black nanoparticles incorporated 61
Figure 4.7: (a) Water contact angle (CA) and (b) water contact angle hysteresis (CAH) of coatingspin-coated from hexane dilution of RTV SR (1:4) with 1.5 wt.% carbon black nanoparticlesincorporated, (c) contact angle (white) and CAH (gray) as a function of hexane dilution of RTVSR with 1.5 wt.% of carbon black nanoparticles incorporated 62
Figure 4.8: (a) Water contact angle (CA) and (b) water contact angle hysteresis (CAH) of coatingprepared by spin-coating hexane dilution of RTV SR (1:4) with 1 wt.% TiC>2 nanoparticlesincorporated, (c) contact angle (white) and CAH (gray) as a function of RTV SR/hexane ratiowith 1 wt. % of TiC>2 nanoparticles 63
Figure 4.9: Contact angle (white) and CAH (gray) as a function RTV SR/hexane volume ratiowith 2 wt. % of TiC>2 nanoparticles incorporated 64
Figure 4.10: (a) Water contact angle (CA) and (b) water contact angle hysteresis (CAH) ofcoating prepared by spin-coating hexane-diluted RTV SR mixture (1:4) with 1 wt.% CeO2nanoparticles incorporated, (c) contact angle (white) and CAH (black) as a function of RTVSR/hexane ratio with 1 wt.% of CeC>2 nanoparticles incorporated 65
Figure 4.11: Contact angle (white) and CAH (gray) as a function of RTV SR/hexane volume (-(-ratio with 2 wt. % CeC«2 nanoparticles incorporatedFigure 4.12: SEM surface image and EDS spectrum of etched Al sample 68
Figure 4.13: SEM surface image and EDS spectrum of Al sample coated with RTV (1:4v/v) /CeO2 (2 wt. %) 68
Figure 4.14: SEM surface image and EDS spectrum of aluminum sample coated withRTV (1:4 v/v) /TiO2 (2 wt.%) 6 9
Figure 4.15: SEM surface image of flat Al sample coated with RTV (1:4 v/v) 70

Xlll
Figure 4.16: SEM surface image of etched Al sample coated with RTV (1:4 v/v) 71
Figure 4.17: SEM surface image of as-received Al sample 71
Figure 5.1: Shear stress of ice detachment (kPa) vs. vol % of carbon-black nanoparticlesincorporated in RTV SR coated samples. Dashed line presents shear stress on mirror-polishedaluminum 75
Figure 5.2: Shear stress of ice detachment vs. icing/de-icing cycle number for coatings spin-coated from RTV SR/hexane solutions (1:4 v/v) with (1, 2 wt. %) TiO2 and (1, 2 wt. %) CeO2
nanoparticles incorporated, respectively 76
Figure S3: Shear stress of ice detachment vs. icing/de-icing cycle number for coatings spin-coated from RTV SR/hexane solutions (1:4 v/v) with (1, 2 wt. %) TiO2 and (1, 2 wt. %) CeO2
nanoparticles incorporated, respectively 77
Figure 5.4: Ice adhesion reduction factor (ARF) as a function of icing/de-icing cycles on mirror-polished Al and a coating prepared from RTV SR/hexane (1:4 v/v) solution with 1 wt. % of CeC>2nanoparticle incorporated 79
Figure 5.5: Ice adhesion reduction factor (ARF) as a function of icing/de-icing cycles on mirror-polished Al and a coating prepared from RTV SR/hexane solution (1:4 v/v) with 2 wt. % of CeO2
nanoparticle incorporated 80
Figure 5.6: Ice adhesion reduction factor (ARF) as a function of icing/de-icing cycles on mirror-polished Al and RTV SR coating with 1 wt. % of TiO2 nanoparticles incorporated 81
Figure 5.7: Ice adhesion reduction factor (ARF) as a function of icing/de-icing cycles on mirror-polished Al and RTV SR coating with 2 wt. % of TiO2 nanoparticles incorporated 81
Figure 5.8: Contact angle vs. icing/de-icing cycles number for RTV SR/TiO2 (1 and 2 wt. %)coated Al samples 82
Figure 5.9: Contact angle vs. icing/de-icing cycles number for RTV/CeO2 (1 and 2 wt. %) coatedAl samples 83
Figure 6.1: Contact angle vs. immersion time in de-ionized water for RTV SR/CB (3 wt. % of carbon-black) coating 88
Figure 6.2: Contact angle vs. immersion time in de-ionized water for Al sample coated with RTV(l:4)/TiO2(2wt.%) 89
Figure 6.3: Contact angle vs. immersion time in de-ionized water for Al sample coated with RTV(l:4)/CeO2(2wt.%) 90
Figure 6.4: Images of small water droplets on cold (-15 °C) surfaces: (a) flat Al, (b) rough super-hydrophobic RTV/CeO2 surface 9 1
Figure 6.5: Water droplet freezing time versus contact angle hysteresis of coated samples. Datafor uncoated flat Al are also given. The lines are simply guide to the eye 92
Figure 6.6: Water drop on a super-hydrophobic surface. Heat transfer at surface/ water dropinterface is shown by short arrows 94

XIV
List of Tables
Table 2.1. Summary of some field observations of natural icing 19
Table 6.1. CA, CAH and freezing times of different samples 93
Table 6.2. Thermal conductivity values of different material 94

XV
List of Symbols and Abbreviations
6A Advancing contact angle (°)
0, CA Contact angle on surfaces (°)
p Density of drop (g .cm"2)
s Dielectric constant
OR Receding contact angle (°)
(0 Rotation speed of the beam (angular acceleration, rad-s"1)
T Shear stress of ice (N.m"2)
y Surface tension of a liquid
Jsv Surface tension of solid-vapor interface (mN.ni"1)
JSL Surface tension of solid-liquid interface (mN.ni"1)
Jiv Surface tension of liquid-vapor interface (mN.ni"1)
A Apparent de-iced area of the sample surface (m2)
ASL Contact areas of liquid-solid interface (m2)
ALA Contact areas of liquid-air interface (m2)
Af Hat projected area (m2)
Etot Total surface free energy
F Adhesion force (N)
fu Area fraction of liquid-air interface
fsL Area fraction of solid-liquid interface
/ Fraction of solid surface area wet by the liquid
m Mass of accumulated ice on Al surfaces (g)
q Charge on ice surface (C)
q ' Induced image charge (C)
Rq Root-mean-square
Rf Roughness factor in Wenzel equation
XVI
rWA
ATH
APTS
AC
AFM
F
ARF
CB
CAH
DC
EDS
EG
FTIR
INAAT
ODTS
PMMA
PVDF
PEN
PECVD
QLL
RTVSR
SPAI
SEM
XPS
Beam radius (m)
Work of adhesion (mN.ni1)
Alumina tri-hydrate
3-amino-propyl-triethoxysilane
Alternating current
Atomic force microscope
Adhesion force (N)
Adhesion reduction factor
Carbon black
Contact angle hysteresis (°)
Direct current
Energy-Dispersive X-ray Spectroscopy
Ethylene glycol
Fourier transform infrared spectroscopy
Isopropyl tris-(N-amino-ethyl aminoethyl) titanate
Octadecyltrichlorosilane
Polymethyl methacrylate
Polyvinylidene fluoride
Polyarylene ether nitriles
Plasma-enhanced chemical vapor deposition
Quasiliquid layer
Room-temperature vulcanized silicone rubber
Siloxane-modified polyamideimide
Scanning electron microscope
X-ray photoelectron spectroscopy

CHAPTER 1
INTRODUCTION
CHAPTER 1
INTRODUCTION
1.1 The Problem of Icing
Atmospheric ice is formed on overhead transmission and distribution lines when
they are exposed to supercooled water droplets or snow particles. This may lead to
serious risk to the security of overhead networks [1-4]. Atmospheric icing occurs in
different forms, including hoar frost which is caused by condensation of vapor, in-cloud
icing involving the freezing of supercooled water droplets in clouds or fog, and finally,
precipitation icing resulting from freezing rain, drizzle, wet snow or dry snow [1-4].
Hashover on ice-covered overhead insulators is another problem closely related to ice
accretion, which causes damage to such insulators and reduces their life-time [4,5]. Ice
accretion, together with superimposed contamination, is well-known to often cause a
decrease in the flashover voltage of outdoor insulators, resulting in occasional outages
[2].
Ice or wet-snow can cause severe trouble due to their high adherence to both
metallic and insulating surfaces. Prevention of ice accretion on surfaces requires
reduction of ice adhesion strength. Thus, various anti-icing and de-icing techniques,
e.g. chemical, thermal or mechanical removal of ice build-ups, have been developed for
decades. Although the majority of the techniques currently in use are called active de-

icing techniques, all of them are employed where ice accumulations are already
considerable. Developing passive anti-icing or ice-phobic coatings is gaining in
popularity. These kinds of coatings prevent or hinder ice and wet-snow accumulation
on such surfaces and are believed to provide reduced ice adhesion [2]. Some of these
coatings have been tested by several groups, which will be discussed in the next
chapter.
1.2 Current Solutions
The need for reliable electrical transmission and distribution networks under the
most severe icing conditions in cold climate regions highlights the importance of ice
adhesion studies for reducing ice accretion. Currently, de-icing techniques such as
chemical, thermal and mechanical and thermal de-icing are applied extensively.
However, these methods are not always advantageous due to their reduced efficiency
when it concerns time and cost as well as their limited application which is not general.
All these de-icing techniques are used where ice is already accreted and a critical
thickness has been reached. Moreover, mechanical de-icing methods using scraping or
vibration can damage the target equipment, and sometimes result in gradual
degradation of the system itself. An alternative way to prevent ice accretion on the
surface of high-voltage equipment would be to apply coatings with reduced ice
adhesion properties [3,7, 8]. Recently, several coatings for ice-phobic application have
been tested and reported but the best results belonged to greases and lubricants and not
to solid coatings [9]. These ice-phobic coatings must necessarily fulfill both of the

following requirements for a true solution: first, they must efficiently reduce snow or
ice adhesion, and second, they must have a reasonably long service-life or durability. In
this regards, polymers with low critical surface tension such as organopolysiloxane and
tetrafluoroethylene (Teflon®) were examined. Those coatings exhibited satisfactory
traction on wet roads; they produced very low run off water contamination and thus
demonstrated a significant reduction in ice adhesion [10]. An additional series of
investigation revealed that fluorinated and polysiloxane coated surfaces had the poorest
wetting by water and are good candidates for ice-phobic coatings [10]. Although de-
icing fluids can be applied to ice-covered structures to eliminate such ice build-ups,
these substances can have significant negative environmental impacts and thus can only
be used as impermanent solutions [11]. In fact, the protection time of anti-icing fluids
depends on precipitation conditions and on properties of the fluids. In addition, it
should be considered that they need frequent applications in large quantities, which
makes them time-consuming and expensive methods. Heating the surface (Joule effect
or high frequency current) to melt the ice is another effective method which
unfortunately requires a large supply of energy. Electrolysis is another approach found
to be effective for removing ice from certain surfaces; however, it is not still a practical
method [12].
1.3 Main Objectives
This research work was primarily motivated by: (i) increasing use of silicone
rubber-based coatings with the aim to improve the existing high-voltage insulators, (ti)

extensive research on nanopowder-incorporated polymer (and silicone rubber) coatings
and their potential need for wide industrial applications (including those on various
high-voltage equipment), (iii) lack of knowledge in the literature on how such doped
silicone-rubber coatings interact with water and, in particular, behave at subzero
temperatures.
The main goal of this research work is to study the possibility of preventing or
reducing ice accretion on the surface of high-voltage equipment, particularly insulators,
by applying super-hydrophobic coatings for reducing ice and snow accumulation. For
this purpose, the project is focused on preparation of thin films of appropriate materials
with such properties. More specifically, the objectives of this research are the
following:
(i) Preparation of nanocomposite coatings based on silicone rubber incorporated
with carbon black and certain oxide nanopowders with different dielectric constants.
(ii) Study of hydrophobic and ice-repellent behaviour of the prepared coatings
as a function of the added nanopowder (dopant) nature and concentration; comparison
with non-doped coatings, as well as study of the effect, if any, of different dopant (with
different electrical properties) incorporated into the coatings on their wetting and/or
ice-releasing properties.
(iii) Preparation of rough super-hydrophobic coatings, study of their
hydrophobic properties and ice-releasing performance; comparison with flat surfaces.
Comparative study of water freezing behaviour on different samples.

(iv) Study of stability of the coatings in water and during icing/de-icing cycles,
as well as their surface topography, their structural, chemical properties, in order to
determine their potential for applications to high-voltage equipment (such as
conductors and insulators).
1.4 Methodology
Regarding the above objectives, the following experimental methodology has
been used on aluminum alloy surfaces. After the aluminum samples were cleaned and
then (if necessary) polished or etched, they were coated with silicone rubber with
different dopants, while applying a variety of experimental parameters or different
pre/post treatments as summarized below:
(i) As-received carbon-black nanoparticles (from Columbian Chemicals,
specification Conductex 7055 Ultra, with the average size of 42 nm and the surface
area of 55 m2.g"]) were used as dopant. A commercial-grade alumina- filled room
temperature vulcanized silicone rubber (RTV SR) purchased from Dow Corning (DOW
CORNING® HVIC 1547) was used as a hydrophobic material. According to the
manufacturer, it consists of alumina hydrate, hydrotreated light petroleum, stoddard
solvent, methyl tri (ethylmethylketoxime)silane, di
(ethylmethylketoxime)methoxymethylsilane, and xylene. Carbon-black nanoparticles
were mixed in different volume ratios with the RTV silicone rubber in a beaker under
vigorous magnetic stirring. Similarly, TiO2 and CeO2 nanopowders (from Sigma-

Aldrich, particle size below 100 and 25 nm, respectively) were also used as dopants in
RTV SR coatings. Such mixed solutions (particle suspension in liquid) were used to
prepare nanocomposite coatings on aluminum substrates for wetting and structural
characterizations. It should be noted that the RTV SR product (used as-supplied from
the manufacturer) had alumina micro- particles (average size ~ 3 um) as a filler
improving its mechanical properties. However, since the concentration of such alumina
particles was constant, their contribution to the properties of the tested samples was
same for both non-doped and doped (with CB, TiO2 or CeC>2 powders) coatings.
Therefore, adding different amounts of the above dopant nanopowders allowed us to
elucidate their effect on the hydrophobic and ice-releasing properties of doped coatings
in comparison with their non-doped counterparts. The coatings were prepared using a
spin-coater from Laurel (WS-400B-6NPP) followed by curing in a conventional oven
in air. The choice of metal substrates was mainly dictated by the necessity to use some
samples for icing/de-icing experiments in a centrifuge. Aluminum alloy (AA6061) was
used as substrate. The influence of different parameters on the formation and properties
of such layers has been analyzed in order to optimize the coating process.
(ii) The wetting behaviour of the coatings, sessile water contact angle and
wetting hysteresis was evaluated on a Kruss DSA100 goniometer. The ice adhesion
strength was evaluated in a house-made centrifuge apparatus (centrifuge adhesion
testing machine) placed in a cold room at subzero temperature. The type of ice used
was glaze, prepared by spraying supercooled micrometer-sized water droplets (�80
um) in a wind tunnel at -10 C, wind speed 11 m.s" and water feed rate of 2.5 g.m .

(iii) Both flat and rough coatings were prepared on flat as well as rough
substrates by means of spin-coating. Their wetting behaviour at room temperature, low
temperature as well as their ice-releasing properties was compared with those on flat
samples. Ice adhesion experiments were carried out on such coatings in order to find
out what parameters govern this property of the coating.
(iv) Scanning Electron Microscopy (SEM) and Atomic Force Microscopy (AFM)
were used for surface imaging.
(v) Chemical analysis of prepared coated surfaces was carried out using energy-
dispersive X-ray spectroscopy (EDS) during SEM.
1.5 Statement of Originality
As will be expressed broadly in Chapter 2, the previous efforts were mostly
concentrated on the electrical and mechanical properties of nanoparticle-incorporated
RTV SR coatings. However, information on their water-repellent and ice-releasing
properties is scarce. In this research work, thus, we considered the behaviour of RTV
SR coatings incorporated with nanoparticles at subzero temperatures (-10 to -15 °C),
and the opportunity of preparing super-hydrophobic coatings to reduce ice
accumulation. Such coatings could further decrease ice and wet-snow accumulation and
adhesion on the surface of exposed equipment. Freezing of water droplets on various
coated surfaces was also studied as compared with that of flat coated and uncoated
aluminum surfaces, behaviour at subzero temperatures. Evaluating ice adhesion strength
8

considering the effect of all possible conditions on coating properties were investigated by
means of the facilities provided at the CIGELE (the Industrial Chair on Atmospheric
Icing of Power Network Equipment) and INGIVRE (the Canada Research Chair on
Engineering of Power Network Atmospheric Icing) laboratories at UQAC.
1.6 The Outline of Thesis
The thesis is organized in the seven chapters as follows:
� Chapter 1 presents a summary of icing related issues, a short introduction to
the current solutions as well as a general introduction of this research work
including the research objectives, methodology, motivation for this work, the
thesis organization, etc.
� Chapter 2 provides a review of the available literature and background
studies on hydrophobicity, super-hydrophobicity, icephobicity and
nanoparticles. The concepts and explanations provided in this chapter make
it possible to understand the principles of the tests and the reasons for
choosing the coatings used in this research. This chapter also summarizes
previous studies and results obtained related to the topic which should be of
help to the reader.

� Chapter 3 explains the experimental procedures for preparing the nanoparticle-
silicone rubber suspensions, coating preparations and characterization
methods. It also provides a description of the facilities and techniques used for
characterizing the prepared coatings, e.g. Contact Angle Goniometer, Spin-
Coater, Atomic Force Microscope (AFM), Cold Climatic Chamber (cold
room), wind tunnel, Centrifuge Adhesion Test Machine, Scanning Electron
Microscope (SEM), Energy-Dispersive X-ray Spectroscopy (EDS), etc.
� Chapter 4 presents the results of the water-droplet behaviour study for the
nanoparticle-incorporated RTV SR coatings on flat or rough aluminum
substrate.
� Chapter 5 provides the experimental results obtained on the prepared
coatings in terms of hydrophobic and super-hydrophobic properties, ice-
phobicity and surface characterizations, e.g. morphological and chemical
analyses. The obtained ice adhesion test results as well as the contact angle
values as function of icing/de-icing number after each icing/de-icing cycle on
the coated samples are also discussed in detail in this chapter. These sets of
experiments were conducted to trace any possible effect of ice detachment on
the coating performance during icing/de-icing events.
10

� Chapter 6 describes the results obtained concerning the freezing of water
droplets on coated and non-coated sample surfaces and the stability of
prepared coated samples immersed in de-ionized (DI) water.
� Chapter 7 includes general conclusions and recommendations for future
studies based on this research work including the obtained results and their
discussion.
Finally, the references which were cited in this thesis are presented at the end
of this thesis.
An exhaustive survey of the literature related to the concept of wettability,
hydrophobicity and super-hydrophobicity, nanoparticles and ice-phobic
properties is presented in the following chapter.
11

CHAPTER 2
BACKGROUND AND LITERATURE REVIEW
12

CHAPTER 2
BACKGROUND AND LITERATURE REVIEW
Superstructure icing from atmospheric icing on the equipments may impact
their operations and can reduce their safety, operational tempo, and productivity. A
number of new technologies and modern versions of old technologies used successfully
in aviation, the electric power industry, and ground transportation systems. Making a
surface where ice would not stick to it would be an ideal and economical solution to
eliminate application of de-icing techniques. Such a surface is defined as "ice-phobic"
surface. Creating an ice-phobic surface is possible through knowledge of the physics of
ice and ice accretion processes and methods for prediction of icing events. These ice-
repellent surfaces can be created by applying an appropriate morphological surface
modification followed by the use of a coating. This coating should have chemical
components with a weak chemical interaction with ice or snow.
In this chapter, we will briefly review atmospheric icing followed by a brief
review of the mechanisms of ice adhesion and a discussion of hydrophobicity and
superhydrophobicity.
13

2.1 Atmospheric Icing and Types of Ice
Atmospheric icing occurs when water droplets in the atmosphere freeze on
objects they contact. Water drops can be cooled down much below bulk water freezing
point (0 °C) on which tiny water drops may remain in liquid state below freezing point.
For a supercooled droplet, the liquid state is thermodynamically unstable and indeed the
most stable state for supercooled droplet is the solid state. This is very dangerous on
aircrafts. For power transmission lines going through mountains, for instance, the built-
up ice changes the aerodynamics of the flight surfaces, which can increase the risk of a
subsequent stalling of the airfoil, mechanical and electrical damages of the power
transmission lines or flashover on the insulators. Atmospheric icing combined with
wind is a main factor for power line design and reliability. The freezing process of
water droplet may be accelerated by presence of any substance that can act as a freezing
nucleus, which makes possible the growth of an ice crystal on itself.
Ice accretion can be defined as any process of ice build-up and snow accretion
on the surface of an object exposed to the atmosphere. Types of accreted ice depend on
wind speed, supercooled water droplet size, compressive strength, air temperature and
properties of the objects being hit by droplets [13]. However, two sources of
atmospheric ice accretion are recognized regarding to their methods of deposition and
characteristics of deposits:
(1) In-cloud icing happens where supercooled water droplets are sufficiently
small to remain suspended and contact with surface results from air movement. This
category generally includes hard rime, soft rime, but sometimes glaze. In-cloud icing
14

usually happens in the aircraft flying through clouds or on the equipment installed in
high altitude [14]. When the flux of water droplets towards an object is less than the
freezing rate, each droplet freezes before the next droplet impinges on the same spot.
Such kind of ice growth is called dry icing. When the water flux increases, the droplets
do not have the required time to freeze before the next impinges, hence the ice growth
will tend to be wet. Dry icing usually results in different types of rime containing air
bubbles, while wet icing always forms glaze ice which is solid and clear. In fact, the
physical properties and the appearance of the accreted ice vary widely according to the
variations of the meteorological conditions during the ice growth. The maximum
amount of accreted ice on an object depends on several factors. The most important
factors are air temperature, relative humidity, and the duration of ice accretion.
However, a major precondition for significant ice accretion is the dimensions of the
object exposed and its orientation to the direction of the icing wind.
(2) Precipitation icing occurs when the droplets are massive enough to fall from
the atmosphere onto an accreting surface. In other words, precipitation icing may
happen when a warm layer of air with the temperature of > 0 °C is trapped between two
layers of cold air with the temperature of < 0 °C) during freezing rain. Precipitation
icing can occur everywhere regardless of altitude. This type includes freezing
precipitation and wet snow. Precipitational icing generally gives rise to glaze ice
accumulations.
Glaze ice forms when droplets striking a surface have sufficient time prior to
freezing to flow in a continuous film (Fig. 2.1c). Glaze is caused by freezing rain,
freezing drizzle or wet in-cloud icing and usually causes smooth evenly distributed ice
15

accretion. The accretion rate mainly varies with the rate of precipitation, wind speed
and also air temperature. This condition is most common when air temperatures are just
below freezing and rain is the dominant precipitation form. Glaze often forms a hard,
nearly homogeneous ice layer having the highest density approaching 0.917 g cm"3, that
of bubble-free ice [15]. Glaze can also result in formation of icicles with the more
asymmetric shape [16,17,18]. The surface temperature of accreted ice is near freezing
point, and thus water may flow around the object and freeze on the leeward side. As
mentioned, glaze ice is denser and applies larger static or dynamic forces to the
instruments. In addition, it conducts the electricity easier, and therefore is more risky
for the performance of the electric networks.
Rime forms tiny coatings on snow crystals or enormous accumulations up to
several meters thick on terrestrial objects and is the most common type of in-cloud
icing. When supercooled water droplets hit a dry cold surface, they freeze as soon as
the latent heat of fusion is dissipated and rime ice accumulates. Lower temperatures
usually create hard rime or soft rime that will be explained later (Fig. 2.1). Depending
on meteorological conditions, rime accretions can be dense, compact masses, feathery
surfaces, or slender, needle-like spikes. Close examination often reveals a fine grained,
granular structure without any recognizable crystalline pattern. Rime grows into the
prevailing wind and is a reliable indicator of wind direction during icing events [19].
The liquid water content of the air becomes so small at temperatures below ~ - 20 °C
that practically no in-cloud icing occurs. It results in an ice accretion more or less
cylindrical around the objects. The most severe rime icing occurs on freely exposed
mountains, coastal or inland, or where mountain valleys force moist air to pass around,
16

as a result, both lifts the air and increases wind speed over the pass. The accretion rate
for rime varies on dimensions of the exposed object, wind speed, liquid water content
in the air, water drop size and air temperature.
Soft rime forms when the supercooled droplets freeze quickly upon deposition
(Fig. 2.1a). The dissipation of latent heat is rapid; no flow occurs and large amounts of
air are entrapped. The deposit often has an opaque-white, porous, and fluffy
appearance. Soft rime has a density of less than 0.6 g cm'3 [20].
Fig. 2.1. (a) Soft rime, (b) hard rime ice on ridge-top vegetation, Sierra Nevada crest,(c), glaze ice.
"Hard" rime forms when the rate of latent heat loss is relatively low, allowing
"wet growth" whereby some flow of the droplets occurs before complete freezing (Fig.
17

2.1b). Hard rime is generally milky or translucent in appearance, depending upon the
amount of air trapped within the ice structure. Its density ranges from 0.6 to 0.9 g cm"3.
The third condition is known as "frost" [20]. Frost or "hoarfrost" forms under still air
conditions by deposition of water directly from the vapour phase to a cold surface.
Since water vapour amounts are minimal at subfreezing temperatures, and still air
conditions are infrequent at mountainous sites, at high elevations frost is much less
frequent than other types of ice accretions [21].
Although meteorological conditions associated with the formation of glaze and
rime have been investigated, due to the complexity of the phenomenon, geographic
differences and monitoring disparities, a wide range in conditions has been reported
(Table 2.1). This is particularly the case in field situations due to the complexity of
mountain weather. In general, soft rime, at one end of the spectrum, is favoured by
conditions that promote a high degree of droplet super-cooling and rapid dissipation of
the latent heat of fusion (low air temperatures and low wind speeds). At the other end
of the spectrum, glaze is formed under the opposite of these conditions. Hard rime is an
inter-mediate form of these two extremes.
Many combinations of droplet size, liquid water content, air temperature, wind
speed, etc., are capable of producing the thermo-dynamics necessary such that an
individual parameter may fall outside of its generally stated range. The most dangerous
ice accretions are glaze, hard rime, wet snow and mixtures.
18

Table 2.1. Summary of some field observations of natural icing [22,26].
Meteorological variable and/or range
Air temperature - 5 to -14 °CAir temperature 0 to - 4 °C
Air temperature blow 1°C with low windAir temperature < 5°C and wind 56 ms"1
Wind speed and event duration
Air temperature - 2 to - 3 °CAir temperature -14 to -15 °C
Air temperature 0 to - 6 °CAir temperature - 2 to - 3 °CAir temperature - 3 to - 6 °C
Wind speed
Wind speed 1 to 10 ms"1 and airtemperature -1 to 10 °C
Wind speed 3 to 15 ms"1, air temperature -2 to - 8 °C
Wind speed 2 to 20 ms"1, air temperature 0to-3°C
I=productof wind speed (ms1) and theconstant 0.011
Ice condition
Rime most frequentObserver-reported icing most frequent
Hard rime commonSoft rime common
Positively correlated with amount ofice
Optimum for hard rimeOptimum for soft rimeAccretion rates greatest
Intensity of Accretion greatestFrequency of rime events greatest
Rime growth intensity increases withwind velocity
Soft rime
Hard rime
Glaze
Rime formation rate, I (g cm" h" )
2.2 Ice Adhesion Mechanisms
As previously discussed in chapter 1, ice and snow adhesion and accumulation
bring dangerous and costly problems into our everyday lives. Ice is responsible for
significant and serious problems on different structures. Generally, atmospheric icing is
19

the deposition of frozen water on surfaces at or below freezing which may result of
rain, freezing rain, wet snow, fog, supercooled clouds or vapour, or from spray or
splashing water. Ice adhesion produces numerous troubles in many areas of human
activity such as transportation, power transmission and distribution, aircraft, wind
turbine blades, ships, and bridges [27]. Icing of power transmission lines during winter
storms is a persistent problem that causes outages and costs millions of dollars in repair
expenses [28]. Control of icing by physical removal such as applying heating or
chemicals may be possible but is costly and not generally practicable. The development
of materials with low adhesion to ice is a very important problem [29].
Its solution requires a fundamental understanding of the physical mechanisms
of bonding between ice and other solids. In particular, it needs to know the nature and
strength of molecular bonding between ice and various solids. Why does ice adhere to
any solid, even to hydrophobic materials? What changes occur over time in ice
adhesion? Fundamental and theoretical studies are needed, for the first step, to provide
answers to these questions which will be explained in details as objectives of this
chapter.
The required force to ice detachment from the surface is typically termed as ice
adhesion force. Many parameters can influence the adhesion of ice to a surface, e.g.
substrate surface properties, conditions of ice formation, air temperature, freezing rate,
water contact area, droplet momentum and etc. Though, the fundamental physics of ice
adhesion is not well-known up to now [30], three major components of ice adhesion to
surface of materials are involved: hydrogen bonds, dispersion or Lifshitz-van der Waals
forces, and electrostatic interactions contribute to ice/solid interfacial energy. Their
20

relative importance depends on the nature of the material to which ice adheres.
Adhesion of ice to a particular substrate is also affected by a quasiliquid layer (QLL) on
the interface and by the substrate surface roughness [31]. Adhesion of ice is usually a
property of the ice/solid interface that can act via strong interaction between ice
molecules and solid surface. In ideal case, all three types of interaction must be
eliminated to have zero or reduced ice adhesion. Chemical bonding involves a chemical
reaction between the molecules on opposite sides of the interface and will be specific to
the nature of the materials concerned.
The role of chemical bonding in ice adhesion has not been sufficiently studied
yet. Van Oss et. al. determined the surface energy of ice within the context of modern
surface chemistry. They separated the surface free energies of ice into Lifshitz-van der
Waals and Lewis acid-base components, using measurements of the contact angles of
various liquids on ice and experiments to observe the exclusion or incorporation of
various colloidal particles in an advancing freezing interface. They finally concluded
that at 0 °C only 26.9 mJ m"2 of the total surface energy of 69.2 mJ m"2 arises from the
Lifshitzvan der Waals interaction [32]. Van der Waals forces are of longer range than
hydrogen bonding and are always present at the interface. The Lifshitz-van der Waals
forces between ice and several metals and insulators were calculated by Wilen et al.
who concluded that these are not the dominant source of ice adhesion. They also
concluded that electrostatic interaction may play a more important role in ice adhesion
rather than Lifshitz-van der Waals forces [32].
Electrostatic interactions occur between non-compensated spatial distributions
of charge on opposite sides of the interface at greater than intermolecular distances and
21

contribute significantly to ice adhesion with interaction energy of up to 500 mJ m"2
[29]. So the electrostatic forces of attraction between charges on ice and induced image
charges are considered to play a significant role in ice adhesion, although the
fundamental physics of ice adhesion is yet to be fully explored. However, it is a well-
known fact that ice adheres to any surface. Exerting an external force on the ice-solid
interface can lead to cohesive rupture (breaks that happen within the ice) or adhesive
rupture (breaks that happen at the ice-solid interface and occur when the strength of
adhesion is lower than the strength of ice) [33]. The electrostatic interaction energy
between ice and metals has been found to be significantly higher than the hydrogen
bonding and Van der Waals forces at greater than intermolecular distances [29].
Charges on ice induce smaller charges on dielectrics, the reduction being related to the
dielectric constant by the equation (1):
s + 1
Where q' is the image charge produced by a charge q on the ice surface and s is
the dielectric constant of the insulating substrate. According to the above equation,
materials with a very low dielectric constant would significantly reduce the adhesion of
ice by reducing the electrostatic interaction (whose force Foe ̂ �, where r is ther
distance between q and q ').
It should be noted that experimental conditions to measure ice adhesion must
be carefully defined; otherwise it is difficult to correlate basic or experimental adhesion
with practical adhesion because of:
22
i) An adhesive layer will rupture in the bulk adhesive rather than at the interface
and thus it can affect on the reproducibility of the experimental results.
ii) Difficulty to measure and quantify intermolecular forces, presence or absence
weak boundary layers, the mode of applying stress, intrinsic stresses and the failure
mode on adhesion of ice [34].
2.3 Brief Review on Hydrophobic and Super-hydrophobic Properties
2.3.1 Hydrophobicity and Contact Angle
Hydrophobicity of any material is its resistance to flow of water on its
surface. A surface is termed as highly hydrophobic if it resists to flowing water dropped
on it and is least hydrophobic surface if water droplets flow in form of tracks on its
surface. The hydrophobic surface is water repellent, in contrast with a hydrophilic
surface that is easily wetted. From the point of insulators, hydrophobicity is treated as a
resistance to the formation of conducting water tracks that increase leakage current,
chances of flashover, and other deterioration effects [35]. Coating any surface with
anti-icing materials can be an effective way of reducing/preventing ice accretion. For
ice to adhere to a surface, it is necessary for water to "wef the surface which means
replacing the substrate-air interface with a substrate/water interface. This tendency to
wet the surface can be determined by measuring the angle the surface of a liquid drop
makes with the solid surface [36]. Young and Laplace found out that each surface has a
23

specific energy because the surface atoms or molecules of liquids or solids have fewer
bonds with neighbouring atoms, and therefore, they have higher energy than similar
atoms and molecules in the interior. This additional energy is characterized
quantitatively by the surface tension or free surface energy Y, which is equal to the
work that is required to create a unit area of the surface at a constant pressure and
temperature. The unit of Y is J m"2 or N m"1 and it can be interpreted either as energy
per unit surface area or as tension force per unit length of a line at the surface. When a
solid is in contact with a liquid, the molecular attraction will reduces the energy of the
system below that for the two separated surfaces. This is expressed by the Dupré
equation:
Where WSL is the work of adhesion per unit area, Y SA and Y SL are the surface
energies of the solid against air and liquid, and Y LA is the surface energy of liquid
against air [37, 39]. If a liquid droplet is placed on a solid surface, the liquid and solid
surfaces come together under equilibrium at a characteristic angle called the static
contact angle eo(Fig.2.2).
Smooth surfece
/ tJL / /
Fig. 2.2. Schematic of liquid droplet in contact with a smooth solid surface (contact angle, 60).
24

This contact angle can be determined by minimizing the net surface free energy
of the system [37,39]. The total energy EM is given by [40,41].
£ tot = / LA (ALA + Ast) - WSL ASL (2)
Where ASL and ALA are the contact areas of the liquid with the solid and air,
respectively. It is assumed that the droplet of density p is smaller than the capillary
length, (yiA/pg)112, so that the gravitational potential energy can be neglected. It is
also assumed that the volume and pressure are constant, so that the volumetric energy
does not change. At the equilibrium dEtat =0, which yields:
Y LA (dAu + dASI) - WSLd ASL = o (3)
For a droplet of constant volume, it is easy to show using geometrical considerations,
that:
dALA/dASL = cos 0o (4)
Combining Eqs. (1), (3), and (4), the well-known Young equation for the contact angle
is obtained:
cos0o = a SA-YSI)/YLA (5)
The contact angle (CA, do) is the macroscopic indicator of the surface energy
balance and the equilibrium of surface energy can determine the entire shape of a
droplet on a solid, provided that the drop is small enough. Wetting phenomenon is
onormally described as a contact angle (60) of the specific surface, i.e., 60 > 90 as
25

ohydrophobic surface; 60 <90 as hydrophilic surface (Fig. 2.3). The greater contact
oangle, preferably >150 , the better water-repellency and self-cleaning abilities can be
achieved [42]. The maximum CA that already obtained on a flat surface with regularly
aligned closest-hexagonal-packed CF3 groups equals about 120° with extreme value of
surface energy [43].
Fig. 2.3. A schematic diagram of hydrophobic surface (left), and hydrophilic surface(right).
2.3.2 Super-hydrophobicity and Roughness
A) Super-hydrophobicity in Nature
There are a large number of objects, including bacteria, plants, land and
aquatic animals, and seashells, with properties of commercial interest. Fig. 2.4 shows a
montage of some examples from nature [44]. Some leaves of water-repellent plants,
such as Nelumbo nucifera (Lotus), are known to be super-hydrophobic and self-
cleaning due to hierarchical roughness (microbumps superimposed with a
nanostmcture) and the presence of a hydrophobic wax coating (Fig. 2.5). Static contact
26

angle of a Lotus leaf are about 164° [45,46]. The water droplets on the leaves remove
any contaminant particles from their surfaces when they roll off, leading to self-
cleaning [44, 47-53]. Water droplets on these surfaces readily sit on the apex of
nanostmctures because air bubbles fill in the valleys of the structure under the droplet.
Therefore, these leaves exhibit considerable super-hydrophobicity (Fig. 2.4a).
Pond skaters (Gerris remigis) have the ability to stand and walk upon a water
surface without getting wet (Fig. 2.4b). Even the impact of rain droplets with a size
greater than the pond skater's size does not make it immerse in the water.
***%
(a) (b)
Fig. 2.4. Montage of some examples from nature: (a) Lotus effect [33], and (b) pondskater walking on water [54].
27

Gao and Jiang [54] showed that the special hierarchical structure of the pond
skater's legs, which are covered by large numbers of oriented tiny hairs (micro setae)
with fine nanogrooves and covered with cuticle wax, makes the leg surfaces super-
hydrophobic, is responsible for the water resistance, and enables them to stand and
walk quickly on the water surface. Research on super-hydrophobic surfaces has limited
attention before the mid-1990s. In fact, all studies were focused to find out the relation
between contact angles and surface geometry of super-hydrophobic phenomena
observed on the "triticum aestivum" plant leaves and insect cuticles [55-57]. It was
mentioned that previous studies approved that the combination of suitable surface
roughness and low-surface-energy materials is responsible for super-hydrophobicity.
This line of research becomes reactivated because Neinhuis and Barthlott explained the
origin and universal principle of the "lotus effect" in nature in 1997 (Fig. 2.5).
Lotus leaf (Nelumbo nucifem)
Fig. 2.5. SEM micrographs (shown at three magnifications) of Lotus (Nelumbo nucifera) leafsurface which consists of microstructure formed by papillose epidermal cells covered with 3-Depicuticular wax tubules on surface, which create nanostructure [45].
They have shown that lotus effect is due to the presence of a rough micro-
nanostructure surface covered with epicuticular wax crystalloids that result in a surface
with water contact angle greater than 150° [58]. This special surface roughness along
28

with covering by low-surface-energy materials is responsible for their self-cleaning
properties. Surfaces with a contact angle of less than 10° are called super-hydrophilic,
while surfaces with a contact angle between 150° and 180° are called super-
hydrophobic surfaces. The schematic illustration and wetting behaviour of four
different surfaces is presented in Fig. 2.6. As it is evident in this figure, the largest
contact area between the droplet and the surface is related to the flat and
microstructured surfaces; however the contact area is reduced in nanostructured
surfaces and is minimized in hierarchical structured surfaces.
Wetting of four different surfaces^ÊÊÊÊÊÊÊ^
mu
Nanostructure Microstructure Hierarchical structure
Fig. 2.6 Schematic and wetting of the four different surfaces. The largest contact areabetween the droplet and the surface is given in flat and microstructured surfaces, but isreduced in nanostructured surfaces and is minimized in hierarchical structured surfaces.
B) Roughness-Induced Super-Hydrophobicity, Self-Cleaning and Low Adhesion
One of the ways to increase the hydrophobic or hydrophilic properties of a
surface is to increase surface roughness, so roughness-induced hydrophobicity or
29

hydrophilicity has become the subject of extensive investigations. Wenzel [59]
suggested a simple model predicting that the contact angle of a liquid with a rough
surface is different from that with a smooth surface. Cassie and Baxter [60] showed that
a gaseous phase including water vapour, commonly referred to as "air" in the literature,
may be trapped in the cavities of a rough surface, resulting in a composite solid-liquid-
air interface, as opposed to the homogeneous solid-liquid interface. These two models
describe two possible wetting regimes or states on rough surfaces: the homogeneous
(Wenzel) and the composite (Cassie-Baxter) regimes. Johnson and Dettre [61] showed
that the homogeneous and composite interfaces correspond to the two equilibrium
states of a droplet.
In this section, numerical models which provide relationships between
roughness and contact angle and contact angle hysteresis, as well as the Cassie-Baxter
and Wenzel regime transition, are discussed. A water droplet on a rough surface with a
homogeneous interface, the interface area increases with respect to that for a smooth
surface. Using the surface force balance and empirical considerations, the contact angle
of a water droplet upon a rough solid surface, 6, is related to that upon a smooth
surface, do for a homogeneous interface (Fig. 2.7a), through the non-dimensional
surface roughness factor, Rf > 1, equal to the ratio of the surface area, A$u to its flat
projected area, AF [59].
cos 6 = (dALA)/(dAF) = (ASI/AF)x (dA^/Asù^ R/Cos Bo (6)
Where,
Rf=ASL/AF (7)
30

This is called the Wenzel equation. The dependence of the contact angle on the
roughness factor is presented in Fig. 2.8a for different values of 60. The Wenzel model
predicts that a hydrophobic surface (60 >90°) becomes more hydrophobic with an
increase in Rf, while a hydrophilic surface (00 <90°) becomes more hydrophilic with an
increase in Rf [40,62].
Liquid »
Wenzel Interface
Air
7A
SolidT7 n(a)
Cassie-Baxter Interface
* i � � J - \ Air* Liquid
/
Solid Air pockets
Cassie Interface
/7 7/Solid
7f
(c)
T 7f
Fig. 2.7. Schematics of configurations described by the (a) Wenzel equation for thehomogeneous interface (Eq. (6)), (b) Cassie-Baxter equation for the compositeinterface with air pockets (Eq. (9)), and (c) the Cassie equation for the homogeneousinterface (Eq. (10)) [63].
31

As an example, Fig. 2.8b shows geometry with square-based hemispherically-
topped pyramidal asperities with a rounded top, which has complete packing. The size
and shape of the asperities can be optimized for a desired roughness factor. In a similar
manner, for a surface composed of two fractions, one with the fractional area// and the
contact angle 0/ and the other with^ and 62, respectively (so that// +f2 = l).
cos 6 =fj cos &i +f2 cos 62 (8)
For the case of a composite interface (see Fig. 2.7b), consisting of a solid-liquid
fraction (/} =fSL, 0, =60) and liquid-air fraction (f2 =fu. = 1 -/SL, cos 62 =-1),
combining Eqs. (7) and (8) yields the Cassie-Baxter equation [60]:
COS 6 = RffsL COS 0o - 1+fsL
cos 6 = Rf cos Oo -fLA (Rf cos 00 + 1) (9)
The opposite limiting case of cos 62 =1 (62 =0° corresponds to the water-on-water
contact) yields the Cassie equation [41,63]:
cos 6 = 1 +fa (cos Go - 1) (10)
Eq. (10) is used sometimes for the homogeneous interface instead of Eq. (6), if the
rough surface is covered by holes filled with water [64] (Fig. 2.7c).
Two situations in wetting of a rough surface should be distinguished: the
homogeneous interface without any air pockets was shown in Fig. 2.7a (called the
Wenzel interface, since the contact angle is given by the Wenzel equation or Eq. (6)),
32

and the composite interface with air pockets trapped between through details as shown
in Fig. 2.7b (called the Cassie or Cassie-Baxter interface, since the contact angle is
given by Eq. (9)).
Effect o f roughness
6» =90*
Hemisphericalîy topped pyramidal asperities
\
Fig. 2.8. (a) Contact angle for rough surface (0) (Wenzel regime) as a function of theroughness factor (Rf) for various contact angles of the smooth surface (60), and (b)schematic of square-based hemispherically-topped pyramidal asperities with completepacking [40].
33

Numerous super-hydrophobic materials have been produced using a range of
chemical and physical methods on rough surfaces, e.g. CA of 174° using n-alkylketene
dimer [65], CA of 160° using PECVD of fluoroalkylsilanes on aluminum surface [66]
and CA of 162° and CAH less than 2° after being modified with
octadecyltrichlorosilane (ODTS) [67]. Quéré states that a water drop can slide off a
surface even if the CA is very low, say less than 20°, provided that the CAH is less than
4-5°. CAH is defined as the difference between the advancing and receding CAs of
water obtained on a surface during the motion of a water drop in one direction [42].
2.4 Review of Nanoparticles incorporated inSilicone Rubber
Silicone rubber high-voltage insulators are superior materials compared to
conventional porcelain-based insulators because of their surface hydrophobic
properties, light weight and easy handling. That is why they are good candidates to be
used under pollution conditions [68] because of their hydrophobic properties which
prevent formation of a continuous water film. In the recent years, nanoparticles
incorporated polymer nanocomposites have been widely studied for their potential
applications in improving the electrical performance of outdoor insulators [68-73].
Silicone rubber has good water repellence characteristics, so insulators made from
silicone rubber are able to suppress leakage current. Therefore they have high flashover
voltage.
34

Fillers have gained considerable importance in the polymer industry. They are
used to achieve requirements such as higher temperature, and reduced cost. In outdoor
insulation applications, fillers such as fumed silica and quartz are used to give silicone
rubber good mechanical properties (elasticity, tensile strength, tear strength). Alumina
tri-hydrate (ATH) fillers are mainly used to impart the tracking and erosion resistance
of silicone rubber [74]. The advantages of nanoparticles incorporation into polymer
coatings are obtaining controlled structural properties, increased dielectric constant and
improved mechanical properties. Several studies on the structural properties of
nanoparticles-incorporated polymers for different applications were reported in the
literature [75, 76]. Previous studies indicated that gold nanoparticles incorporated in
polymethyl methacrylate (PMMA) can improve the conductivity of the polymer [69].
Similarly, silver nanoparticles along with carbon nanotubes have been added in the
polymer to study the effective conductivities of those systems [70]. On the other hand,
several other studies are reported in the literature on the dielectric fillers-incorported
polymers [71-73].
One of the commonly used dielectric fillers is barium titanate (BaTiOs). Choi et
al. [71] mixed BaTiO3 nanoparticles (70 nm) in polyimide polymer using two coupling
agents between BaTiO3 nanoparticles and the polyimide, namely, INAAT (isopropyl
tris-(N-amino-ethyl aminoethyl) titanate, KR 44) and APTS (3-amino-propyl-
triethoxysilane). The authors have shown that the dielectric constant of the BaTiO3
nanoparticles-polyimide systems increased from 6 to 14 with the increase of BaTiO3
nanoparticles from 10 to 50 (vol. %) using APTS as a coupling agent. With similar
variation of volume proportion of the BaTiO3 nanoparticles, an increase in dielectric
35

constant from 7 to 19 has been demonstrated when INAAT was used as a coupling
agent. Scanning electron microscopy (SEM) analysis revealed that the distribution of
the nanoparticles was uniform when INAAT was used, which was considered as the
cause of the increased dielectric constant compared to APTS coupling agent. Similarly,
Kobayashi et al. [72] have prepared dielectric thin films of polymer-based materials by
incorporating nanometer-sized BaTiC>3 particles in polyvinylidene fluoride (PVDF) and
siloxane-modified polyamideimide (SPAI). They found that BaTiO3 nanoparticles were
dispersed more homogeneously in the PVDF film than in the SPAI film. An increase in
the BaTiÛ3 nanoparticle size from 10.5 to 34.6 nm in the PVDF film at a particle
volume fraction of 30 % increased the dielectric constant of the film from 20.1 to 31.8.
In their study, the authors reported that the BaTiÛ3-PVDF composite film attained high
dielectric constant that had more than twice the dielectric constant of the BaTiC>3-SPAI
composite film [72]. More work was reported in the literature on controlling the
electrical properties of the nanocomposites based on TiCh nanoparticles. As an
example, Li et al. [74] prepared TiOî nanoparticles-incorporated polyarylene ether
nitriles (PEN) nanodielectric and found that the dielectric constant (at 1 kHz) of the
composite films increased from 4 to 6. However, the electrical breakdown field (Eb)
was reduced from 2160 to 1700 kV.cm"1 with the increase of TiÛ2 content from 5 wt. %
to 20 wt. %. These authors also used FTIR, XRD, XPS, SEM, and other techniques for
the structural and chemical characterization of their coatings.
In light of heavy industrial application of nanodielectrics on high-voltage
electrical insulators, silicone rubber coatings doped with such powders as carbon black,
titania and ceria look very attractive. Silicone rubber based high-voltage insulators are
36

already in the market, often being already loaded by alumina filler (to improve their
mechanical properties and durability) [68, 77, 78]. Doping with carbon black
nanopowder is expected to increase surface conductivity of RTV SR-coated insulators,
which must lead to higher withstand voltage levels on such modified surfaces.
Meanwhile, ceria and titania dopant can improve electrical field distribution along the
insulator because these materials possess higher permittivity compared to RTV SR and
AI2O3. In parallel, mechanical properties of such nanopowder incorporated RTV SR
coatings are also expected to be further improved.
However, new-generation insulators require the improvements of the existing
insulator with higher mechanical strength and better electrical performance.
Nanoparticles are routinely used as dopants in silicone to improve its mechanical
strength. Influence of carbon nanoparticles (100 run) on both AC and DC conductivity
of the epoxy resin has been reported recently [78]. The authors showed that
conductivities (AC and DC) increased with the increase in the amount of carbon
nanoparticles in the epoxy resin. Carbon nanoparticles-incorporated silicone rubber was
used to coat high-voltage porcelain insulator for the flashover study of the ice-covered
silicone coated insulators [78]. The coatings behaved as semiconducting glaze and
increased the flashover voltage compared to the uncoated porcelain insulators [77].
However, the authors did not provide any information regarding the size of the particles
and their dispersion in the polymer.
Although the research on particle-doped RTV silicone rubber coatings is quite
extensive [68, 72, 77-79], the information on their water-repellent and ice-releasing
properties is very scarce. While RTV silicone rubber (RTV SR) coatings have been
37
reported to reduce ice accumulation compared to uncoated insulators [77], previous
work was mainly focused on electrical and mechanical properties of nanoparticle-
incorporated RTV SR coatings. Therefore, in this research work, we aim at studying
and better understanding of water and ice-repellent properties of such coatings doped
with different nanoparticles.
38

CHAPTER 3
EXPERIMENTAL SETUP AND TEST
PROCEDURES
39
CHAPTER 3
EXPERIMENTAL SETUP AND TEST PROCEDURES
In this chapter, the methods for preparation of the coatings and the successive
characterization involved in this study will be described in detail along with the
experimental procedures used. On the basis of the specialized literature on ice adhesion,
testing and in order to achieve the objectives, a set of experiments were systematically
conducted on the ice-phobic, hydro-phobic and stability of prepared coated aluminum
substrates. The coating morphology and performance were also analyzed via applying a
set of surface analysis and characterization techniques which are explained in this
chapter. This chapter consists of two sub-chapters: sample preparation procedures and
sample analysis and characterization including facilities and their principles along with
corresponding explanations.
3.1 Process of Coatings' Preparation
Hydrophobic and super-hydrophobic aluminum surfaces were prepared using
three following steps:
(i) Cleaning flat aluminum substrates and producing nano-roughness
surfaces;
40

(ii) Coating of the cleaned flat as well as nano-rough surfaces with different
chemicals; and
(iii) Characterizing the prepared coated flat and nano-rough aluminum
surfaces.
The substrates used were panels of aluminum alloy 6061 (Al 97.9 wt. %, Mg
1.0 wt. %, Si 0.60 wt. %, Cu 0.28 wt. %, Cr 0.20 wt. %) with dimensions of 1.5 *1.5
and 5.1 x 3.2 cm2 and with the thickness of �2.5 mm. Prior to coating, they were
mechanically polished using first 600-grit sand paper and then consecutively finer SiC
abrasive papers lubricated with water, and finally using aqueous 1.0 um alumina slurry
to have mirror-polished surfaces. The bigger aluminum substrates were used for icing
tests (evaluating their ice-repellent performance), while the smaller ones were used to
investigate the super-hydrophobic properties of the same coatings. The polished
aluminum plates were then cleaned and degreased consequently in different organic
solvents ultrasonically that will be discussed in the next below.
3.1.1 Substrate Cleaning
As explained before, prior to coating, the aluminum substrates were washed
and degreased in a soap solution, and then were ultrasonically rinsed with methanol
(99.8 %, MAT) for 5 minutes and then with acetone (99.5 %, EMD), 5 Minutes, to
remove dirt, oil and organic materials. Sample cleaning procedure was followed by
41

ultrasonication in de-ionized water for 5-10 minutes. Finally, they were blow-dried in a
N2 gas flow follow by drying in an oven at 70 °C for 6 hours to get rid of any water.
3.1.2 Producing Micro-/Nano-Rough Substrates
Surface roughness plays a very important role in attain super-hydrophobic
properties. It was explained that the combination of suitable surface roughness and low-
surface-energy materials is responsible for super-hydrophobic properties and therefore
can result in ice-phobicity. In general, two main approaches have been developed to
generate super-hydrophobic surfaces; one is to increase directly the surface roughness
of the low-surface-energy materials and the second is fabricating a suitable surface
roughness with certain materials or methods (e.g. etching, using nano-particles, etc.)
and then to modify the as-prepared surface with low-surface-energy materials.
Therefore, substrate chemical etching was used herein to generate micro-/nano-rough
substrates.
In this work, a number of well-cleaned and unpolished aluminum panels were
immersed in ~ 14.7 wt % aqueous acid hydrochloric (HCl) solution at room
temperature for ~ 1 , 2, 3, 4, 5 min to produce rough aluminum surfaces. A chemical
reaction between HCl and aluminum can remove some material from the aluminum
surface leading to a micro-/nano-rough structure on the surface. After etching, the
substrates were rinsed and washed ultrasonically in de-ionized water to remove any
remains or loose particles on surface resulting from etching. The etched samples were
42

dried in a N2 flow and were dried at 70 °C in an oven and then placed in corresponding
solutions.
3.1.3 Preparation of Solution
For this aim, carbon-black nanoparticles (with an average size of 42 nm and
surface area of 55 m2, g"1), T1O2 and CeC>2 nanopowders with particle size below 100-
150 nm and 25 nm, respectively, were used. The RTV SR was mixed with n-hexane
(1:1, 1:2,1:3, and 1:4 v/v), and then the carbon-black (1.5 and 3 wt. %), TiO2 (1 and 2
wt. %) or CeO2 (1 and 2 wt. %) nanoparticles were added under vigorous magnetic
agitation. Upon carefully stirring following 10 minutes stirring ultrasonically to
facilitate the preparation of homogeneous mixtures, the suspensions were used to
prepare several series of nanoparticle-incorporated coatings on either polished (flat) or
etched aluminum metal.
3.1.4 Coating of the Samples
The cleaned flat and micro-/nano-rough aluminum samples were coated by
using a spin-coater. Spin coating is a commonly used technique for preparing uniform
thin films on flat substrates which involves the controlled precipitation from solution of
a compound on a suitable substrate while spinning with specific parameters. The
spinning rate was set at 500 rpm (5 s) and 3000 rpm (20 s) for the first and second
43

stages, respectively. Upon coating, all samples were heat-treated at 70 °C in air
overnight to remove residual solvents.
(1)
(2)
(3)
(a)
Fig. 3.1. (a) The spin-coater (model WS-400B-6NPP, Laurell TechnologiesCorporation), (b) steps of coating preparation, (1) deposit solution, (2) spreading (lowspeed spin), (3) high speed spin.
Figure 3.2 is a general schematic presentation of sample preparation procedure
used in this research work. Among several methods available to coat cleaned flat and
micro-/nano-rough aluminum alloy substrates, cast films using spin coating was
selected in this work as the main coating method for bringing the coating's solutions
including nanoparticles on the substrate surfaces. All these steps can be observed in
details in this flowchart.
44

Al Alloys
RTV Silicon Rubber/He xane +TiO2 or Ce O; or Carbon Black
Na.no -particlesDegnacing in Acetone and Methanol
Magnetic Stirring, ffli+ Ultrcwonieation 10 min Etching for Different lime in 14% HC1
Annealed Over-night at70'C
Sample Analysis andCharacterization
Fig. 3.2. Scheme of preparation of nano-powder incorporated RTV SR coatings onrough substrates.
3.2 Sample Analysis and Characterization
3.2.1 Morphological Characterization
In this research, morphological characterizations and analysis were carried out
using an atomic force microscope (AFM, Escope, Veeco) and a scanning electron
microscope with energy-dispersive X-ray spectroscopy (SEM/EDX) (Hitachi S-4700
Field-Emission SEM with accelerating voltages from 500 V to 25 kV).
45

1) Atomic Force Microscope (AFM)
An atomic force microscope was used to study and characterize the surface
roughness and surface morphologies of the coated samples. The method used to
generate the three dimensional (3-D) images via atomic force microscope was tapping
mode at room temperature under normal air pressure. In this mode, a swing silicon
probe (Nanosensors�) design an image in the topography of the surface (e.g. in the
scan size of 20x20 um2 in this study). 3-D surface topography was mapped by lightly
tapping the surface with an oscillating probe and thus imaged with monitoring of the
changes in the cantilever's oscillation amplitude while scanning the surface. Atomic
force microscopy gives various information of the surfaces features. For instance, the
dimension of the nanoscale features of the surfaces including the z-height and surface
roughness. Tip radius is less than 10-15 nm and height 10-15 urn set on a cantilever of
length 220-230 um and width 35-45 um, respectively.
2) Scanning Electron Microscopy (SEM/EDX)
SEM measurements produce a two dimensional images of the morphological
features of the surface in addition to providing the atomic composition of the material
by means of energy dispersive X-ray spectroscopy (Hitachi S-4700 Field-Emission
SEM with accelerating voltages from 500 V to 25 kV). Before each measurement,
samples with low surface conductivity were covered with a very thin film of platinum
or carbon to lessen charge build-up during the scanning.
46

3.2.2 Wettability Tests
3.2.2.1 Contact Angle Measurement at RoomTemperature
The wetting behaviour of the prepared coatings was assessed on a contact-
angle goniometer following standard procedures (Fig. 3.3) by measuring the water
contact angle. The system used for contact angle measurements is a drop shape
analyzer system (DSA 100 from Kriiss GmbH Co.). Contact angles were measured
using the sessile-drop method: small water droplets (4 uL in volume) were quietly
placed on the surface by injection mechanism with several convenient syringes. Then,
their shape was evaluated with the goniometer optics and software using a light source
to light the sample surface and a camera connected to a computer where the drop shape
can be recorded and analyzed. Using the associated software also can select any of the
syringes and manage its situation and inoculation rate. Another important advantage of
the software is to calculate the contact angles by using appropriate techniques. The
static contact angle data were obtained by fitting the symmetric water drops using the
Laplace-Young equation and the advancing (0a) and receding (6r) contact angles to
calculate contact angle hysteresis (in case of super-hydrophobic samples) were
measured on the asymmetric water drops using the tangent-2 method (Fig. 3.4). After
injection a water droplet on the sample, the droplet was held in contact with the sample
surface with stationary needle in it. Then, the advancing and receding contact angles to
evaluate the value of contact angle hysteresis were measured while moving the sample
in one direction. After settling the water droplet on the sample surface, it is necessary to
47

wait for 10 s prior to each measurement to be sure that the droplet is stabilized. The
contact angle values reported here were the averages of at least five measurements on
various parts of each sample.
Fig. 3.3. Kruss DSA100 contact-angle goniometer.
Fig. 3.4. Measuring the advancing and receding contact angles on a sample with (a) alow hysteresis (static CA), and (b) a high hysteresis (advancing (0A) and receding (8R)CAs.
48

3.2.2.2 Contact Angle (CA) Measurement at LowTemperature
Hydrophobic properties of the prepared coatings were also investigated by
measuring water contact angles at sub-zero temperature (-15 °C). For this purpose,
some coated aluminum samples were placed in a cooling unit (Peltier device) with a
specially designed chamber that can be replaced on the goniometer stage. It has sealed
walls and windows, and a thermoelectric heating/cooling part at the bottom filled with
ethylene glycol (EG), it is possible to adjust the temperature of Peltier element over a
wide temperature range of- 30 °C to + 120 °C. The cooling unit is shown in Fig. 3.5.
Fig. 3.5. Contact-angle goniometer and cooling unit for measuring CA at lowtemperature (centre), enlarged Peltier device (left) and cooling/heating system (right).
The experiment was carried out as follows: a sample was located in the Peltier
device with the set point of its controller (TC40) at -15 °C. Then a water drop of ~4 uL
was placed on the cold sample and the needle was removed and the process of contact
49

angle measurement started. By cooling down of the samples the placed water droplet on
the sample was frozen completely in few minutes. However, the freezing time varied
depending on the different prepared coated samples. The reasons of these observations
will be explained in the next chapter.
3.2.2.3 Ice Adhesion Test
Different methods have been developed to measure ice adhesion; but, some of
them are not applicable for the atmospheric ice formed by the freezing of the super-
cooled water drops in contact with structures. Ice adhesion strength depends on the
techniques used to ice adhesion measurement. In these series of experiments, the ice
accumulation conditions were generated in the CIGELE laboratories. The ice-adhesion
evaluation tests were conducted on aluminum beams with samples spun in a home-
made centrifuge apparatus (see Fig. 3.6). The samples, attached to the beams, were iced
in a wind tunnel at a wind speed of 10 m s"1, temperature -10 °C, water feed rate of 2.5
g m"3, and average droplet size of- 80 jitm to prepare glaze ice of ~i cm thick over the
area of- 5.1 * 3.2 cm2 [80]. This ice geometry was found to be optimal to provide
adhesive failure of the ice and provide well reproducible results during de-icing. The
samples investigated were placed in a wind tunnel at subzero temperature to
accumulate glaze ice because the subzero tests need to be performed in a cold
environment in order to study how ice growth on prepared coated surfaces. The wind
tunnel used was adjusted thoroughly under conditions similar to those in nature leading
to accretion of glaze ice during freezing rain.
50

Ice mass and area were carefully evaluated both after icing and de-icing. To
balance the beam in the centrifuge, a counter-weight was used on the opposite side
(Fig. 3.6b). The centrifuge test machine can increase rotation speed of the beam from 0
to 10000 rpm with an acceleration of approximately 300 rpm s"1. Rotation generates a
centrifugal force and when this force is larger than adhesion force of ice, the ice
detaches from the sample. The artificially iced samples were spun in the centrifuge
placed in a climatic chamber at -10°C to determine the rotational speed at which ice
detachment from the sample surface occurs. At the moment of detachment (detected
with sensors embedded into the centrifuge wall), the adhesion strength of ice is
assumed to be equal to the centrifugal force, F = mrco2, where m is the ice mass, r is the
beam radius and ra is the rotational speed in rad s"1. The shear stress, correspondingly,
was calculated as x = F/A, where A is the de-iced area. Bare mirror-polished aluminum
was used as a standard reference sample, demonstrating the shear stress of ice
detachment on its surface of 350 ± 1 9 kPa and agreeing with values found in the
literature [81].
Fig. 3.6. (a) Centrifuge system, (b) sample with coating (1) in centrifuge set-upevaluating ice adhesion strength. (1) sample, (2) aluminum beam, (3) counter-weight.
51

The effect of controllable wind tunnel parameters such as temperature, air speed
and liquid water content were considered. The atmospheric icing wind tunnel used was
based on room temperature water injection through warm nozzles into a cold air stream
provided by three nozzles on the spray line.
Figure 3.7 shows the samples during ice accumulation in a wind tunnel. The
distance between the nozzles and the samples was chosen long enough to reach
thermodynamic equilibrium for all sprayed droplets in the wind tunnel [82-84]. After
ice accumulation was completed, the samples were removed, weighed and kept in a
climatic chamber at -10 °C. The weight of accumulated ice on the coated samples and
the sample surface area covered with the ice were measured before and after each
icing/de-icing for all samples. It should be noted that all samples were placed in the
tunnel for roughly about 8 to 15 min to be cooled down prior to each icing test. The
time period needed to have about 4-6 g (up to ~1 cm thick) of ice on each sample was
also traced.
Fig. 3.7. (a) Top view of atmospheric icing wind tunnel used, and (b) a view of iceaccumulation procedure on coated samples in wind tunnel.
52

CHAPTER 4
EXPERIMENTAL RESULTS AND DISCUSSION:
HYDROPHOBIC AND SUPER-HYDROPHOBICPROPERTIES OF FLAT AND ROUGH SAMPLES
WITH COATINGS ALUMINUM SUBSTRATE
53

CHAPTER 4
EXPERIMENTAL RESULTS AND DISCUSSION:
HYDROPHOBIC AND SUPER-HYDROPHOBIC PROPERTIESOF FLAT AND ROUGH SAMPLES WITH COATINGS
ALUMINUM SUBSTRATE
In this chapter the water droplets behaviour on RTV SR coatings incorporated
with carbon-black (CB), TiCh and CeO2 nanopowders and prepared by spin-coating
RTV SR/hexane solutions with volume ratios of 1:1, 1:2, 1:3 and 1:4 on the flat and
rough aluminum substrates is described and discussed. It should be noted that RTV SR
coatings (prepared from a RTV SR / hexane mixture with the ratio of 1:4) on flat and
rough aluminum substrates were used as reference samples demonstrating contact angle
of -110° and -143°, respectively.
4.1 Water Droplet Contact Angle on Flat Al Substrates
4.1.1 Carbon-Black Nanoparticle-Incorporated RTVSR Coatings
The contact angle of RTV SR coated samples as a function of volume percent
of carbon-black nanoparticles incorporated is shown in Fig. 4.1c. Figures 4.1a and 4.1b
compare water droplets on the non-doped and doped RTV SR surfaces. Compared to
54

the non-doped coating, an increase (by -7-8°) of contact angle is observed on the
doped samples as the carbon-black concentration is raised (see Fig. 4.1c). This increase
is believed to be associated with greater surface roughness of the coatings incorporated
with carbon-black nanoparticles, as showed in Fig. 4.2. The results presented in
Fig.4.1c therefore lead to the conclusion that, in agreement with the previous report of
Liao et al. [77], no significant effect of carbon-black incorporation on the wetting
properties of the coatings was observed.
70
6 8 10 12 14Carbon black nanoparticles (vol %)
16 18 20
Fig. 4.1. (a) Water drop on pure (non-doped) RTV SR coating, (b) water drop on RTVSR/hexane (1:1 v/v) coating with 6 vol. % of carbon-black nanoparticles incorporated,(c) contact angle vs. vol. % of carbon-black incorporated into coatings.
55

(b)
5 jim5 um
Fig. 4.2. AFM surface images of RTV SR coatings doped with 0 (a), 6 (b), 12 (c), and18 vol. % (d) of carbon-black.
Figure 4.2 shows AFM surface images of the samples. Figure 4.2a shows that
the surface topography of the non-doped RTV SR coating in mainly dictated by
alumina micro-powder (which is a common filler in commercial silicone rubbers). Such
particles (with size of ~3 um) are seen in Fig. 4.2a to form a relatively flat coating with
a hydrophobic top layer. It is clear from the images in Figure 4.2 that, as the volume
percentage of carbon-black dopant in the RTV SR rises, the surface roughness also
56

increases slightly, resulting in enhanced root-mean-square roughness (Rq) values of the
surfaces. The root-mean-square roughness values were calculated to be 128.2,178.11,
261.93, and 295.81 nm for the samples doped with 0, 6,12, and 18 vol. % of carbon-
black, respectively. This increase in surface roughness is related to the incorporation of
carbon-black nanopowder.
4.1.2 TiO2 Nanoparticles-Incorporated RTV SRCoatings
Flat Al substrates (aluminum alloy AA 6061) were coated by spin-coating
an RTV SR/hexane solution (1:3 v/v) with different concentration of TiC>2
nanoparticles-incorporated (2,4, 8 wt. %). Fig.4.3 shows the CA and CAH of coatings
prepared from the RTV SR/hexane (1:3 v/v) suspension spin-coated on flat Al as a
function of different percentage of TiÛ2 nanopowder incorporated. It can be also
concluded in Fig. 4.3 that even though the as-supplied RTV SR was loaded by micro
sized alumina powder, doping it with nano-sized TiCh powders does change the
hydrophobic properties of the prepared coatings. It is evident from Figure 4.3 that by
changing TiO2 concentration, RTV SR coatings with improved hydrophobicity could be
prepared. The contact angle values are seen to increase from -135° to -138° while the
values of CAH decreased from �35° to ~25°. Similar results were obtained with CeÛ2
powder as a dopant. It was difficult to prepare super-hydrophobic coatings on flat
substrates. Therefore, further attempts were mainly focused on rough etched aluminum
substrates.
57

150
TiO2 nanoparticles (wt. %)
Fig. 4.3. Contact angle (white) and CAH (gray) as a function of TiC>2 concentration incoatings prepared by spin-coatings RTV SR/hexane ratio (1:3 v/v) suspension on flatAl.
4.2 Water Droplet Contact Angle on RoughAluminum Substrates
The same experiments and investigations were carried out on rough etched
aluminum substrates by applying different concentration of carbon black nanoparticles
incorporated (1.5 and 3 wt. %), TiO2 (1 and 2 wt. %) and CeO2 (1 and 2 wt. %). The
contact angle and CAH values of the above mentioned coated Al samples as a function
of dilution of RTV SR with hexane were measured showing similar behaviour and
tendency in decrease/increase of the contact angle (CA) and contact angle hysteresis
(CAH) values on the prepared samples surfaces.
58

4.2.1 TiO2 Nanoparticles-Incorporated RTV SRCoatings
Fig. 4.4 and Fig. 4.5 demonstrate CA and CAH values of RTV SR coated
samples with 2 wt. % of T1O2 incorporated as a function of etching time (min) of the Al
substrate. From these figures, it is evidently clear that CA values of these coated
samples increase while the etching time rises from 1 to 5 min. On the other hand, their
CAH values decrease gradually. This can be explained by gradually increased substrate
roughness. As the etching is well known to lead to increased roughness of the
substrates, the suspension used for spin-coating covered the rough surface resulting in
high values of CA ranging from ~115° (1 min etching) to �140° (5 min etching). It is
believed that the samples with shorter etching time were wetted in the Wenzel regime
(high CAH) while only the samples etched for longer times were likely to gradually
switch to the Cassie-Baxter wetting mode.
This assumption agrees with the gradually decreasing CAH values observed
in Fig. 4.5. As the lowest value of CAH obtained in this series was still relatively high
(-15°, see Fig. 4.5), we conclude that the RTV SR/hexane solution with the volume
ratio 1:1 was too viscous and filled in the rough valleys between substrate asperities,
leading to relatively shallower rough coatings. This is also confirmed by the results
presented in Fig. 4.6-Fig. 4.11, where further dilution of RTV silicone rubber with
hexane leads to both increased contact angle and decreased contact angle hysteresis
values of coating incorporated with different nanoparticles.
59

150
140
C 130
60
135o
120
110 -
100
Etching time (min)
Fig. 4.4. Contact angle of samples prepared by spin-coating RTV SR/hexane (1:1 v/v)suspension with 2 wt. % of Ti(>2 nanoparticles incorporated as a function of etchingtime of the substrate used.
Etching time (min)
Fig. 4.5. Contact angle hysteresis of coatings prepared from (1:1 v/v) RTV SR/hexanesolution with 2 wt. % of TiC>2 nanoparticles incorporated as a function of etching timeof the substrate (Al alloy in diluted HC1).
60

4.2.2 Carbon-Black Nanoparticles-Incorporated RTVSR Coatings
The contact angle values of RTV SR coated samples as a function of dilution
of RTV SR with hexane mixed with 3 wt. % of carbon black nanoparticles incorporated
are shown in Fig .4.6. The rough Al substrates used were etched in 14% HCl for 5 min
prior to spin-coating the carbon black-RTV SR suspension.
(a) . . (b)
RTVSRto hexane ratio
1 :4
Fig. 4.6. (a) Water contact angle (CA) and (b) water contact angle hysteresis (CAH) ofcoating prepared by spin-coating hexane dilution of RTV SR (1:4) with 3 wt.% carbonblack nanoparticles incorporated, (c) contact angle (white) and CAH (gray) as a function ofdifferent concentration of RTV SR with 3 wt.% of carbon black nanoparticles incorporated.
61

It is seen in Fig. 4.6 and Fig. 4.7 that surfaces with CA �140° could be prepared
by spin-coating carbon black-RTV SR suspension (with both 1.5 and 3 wt. % of carbon
black) on etched Al substrates. While CA values are almost unchanged for all six
samples, their wetting hysteresis could be varied by changing both carbon black
concentration and RTV SR dilution. The lowest value of contact angle hysteresis
(CAH) of -20° was achieved for the sample with 3 wt. % of carbon black and RTV SR
in hexane; 1:4 (v/v).
160
140
120
r-v 100 -O
< 80-U
U 40-
20-
137.5 139�£-
T
a.
50
1
1 :2 1 :3RTV SR to hexane ratio
T (c)
401
1 :4
Fig. 4.7. (a) Water contact angle (CA) and (b) water contact angle hysteresis (CAH) ofcoating spin-coated from hexane dilution of RTV SR (1:4) with 1.5 wt.% carbon blacknanoparticles incorporated, (c) contact angle (white) and CAH (gray) as a function ofhexane dilution of RTV SR with 1.5 wt.% of carbon black nanoparticles incorporated.
62

4.2.3 TiO2Nanoparticles-Incorporated RTV SR Coatings
The same studies were carried out by applying different concentration of TiO2
(1 and 2 wt. %) and RTV SR/hexane solutions with different ratios. Fig. 4.8 and Fig.
4.9 presents the contact angle values of RTV SR coated samples as a function of
dilution of RTV SR with hexane mixed with 1 and 2 wt. % of TiC>2 nanoparticles.
160
140
120
C 100
-a
% 60 -
U40 -
20 -
138.1T
30TJ-
43.2 142.8 1 4 T ' 2
X T- 1�1 1 , -
-±-
20
1
-±-
g
m1 :1 1 :2 1 :3
RTV SR to hexane ratic>
(c)
j
5 [
1 :4
Fig. 4.8. (a) Water contact angle (CA) and (b) water contact angle hysteresis (CAH) ofcoating prepared by spin-coating hexane dilution of RTV SR (1:4) with 1 wt.% TiChnanoparticles incorporated, (c) contact angle (white) and CAH (gray) as a function ofRTV SR/hexane ratio with 1 wt.% of TiO2 nanoparticles incorporated.
63

160
140
120
100
C so H�O 60-�o§ 40 -!
20
0
136.2 138.6 141.2 144.9
2010
1:1 1 :2 1 :3
RTV SR to hexane ratio
1 :4
Fig. 4.9. Contact angle (white) and CAH (gray) as a fimction RTV SR/hexanevolume ratio with 2 wt. % of TiÛ2 nanoparticles incorporated.
Fig. 4.8 and Fig. 4.9 demonstrate that by changing RTV silicone rubber/hexane
ratio from 1:1 to 1:4, the samples prepared by spin-coating RTV silicone rubber
suspensions with both 1 and 2 wt. % of TiO2 showed contact angle values gradually
increasing with the RTV silicone rubber dilution degree. At the same time contact angle
hysteresis values of the samples decreased and could reach as low as �5-10°, which is
characteristic of super-hydrophobic state. Thus, supe-hydrophobic samples with
CA>145° and CAH -5-10° could be prepared by spin-coating TiO2-loaded RTV
silicone rubber suspensions on etched substrates. Fig. 4.8b shows that water droplets
could move on such surfaces without any significant distortion (i.e. demonstrating low
CAH values).
64

4.2.4 CeO2 Nanoparticles-Incorporated RTV SRCoatings
Fig. 4.10 and Fig. 4.11 show that similar results were obtained when CeO2
incorporated RTV SR coatings were spin-coated on rough etched Al substrates.
160 -
140 -
120 -
100 -O
X 80 -
O�o 60 -
g 40-
20 -
n
130"T
1
38TX
142-dr
>
24
145.2 146.5T i�f-i
10 5S 3
1:1 1:2 1:3 1 :4
RTV SR to hexane ratio
Fig. 4.10. (a) Water contact angle (CA) and (b) water contact angle hysteresis (CAH)of coating prepared by spin-coating hexane-diluted RTV SR mixture (1:4) with 1 wt.%CeÛ2 nanoparticles incorporated, (c) contact angle (white) and CAH (gray) as afunction of RTV SR/hexane ratio with 1 wt.% of CeO2 nanoparticles incorporated.
65

Again, as RTV silicone rubber in the spin-coated suspension is more diluted
with hexane, the coatings (both with 1 and 2 wt. % CeOi) demonstrate higher values of
CA (as high as ~ 147°) and lower values of CAH (as low as ~ 5-6°), which is
characteristic of super-hydrophobic surfaces. Thus, similar to the above discussed RTV
SR coatings with TiÛ2 nanopowder, their counterparts incorporated with CeO2 could
also be prepared with super-hydrophobic properties.
1 :1 1:2 130
RTV SR to hexane ratio
1 :4
Fig. 4.11. Contact angle (white) and CAH (gray) as a function of RTV SR/hexanevolume ratio with 2 wt. % CeCh nanoparticles incorporated.
Water droplets could move along such surfaces with only slight distortion (see
Fig. 4.10b). Though all rough RTV SR coatings doped with carbon-black, CeCh and
TiÛ2 powders were believed to have silicone rubber layers atop (covering dopant
particles), the surface topographies in case of TiÛ2 and CeÛ2 doped coatings were more
favourable for super-hydrophobicity. Further optimisation of coating parameters is
66

likely to lead to super-hydrophobic surfaces in case of carbon-black doped coatings as
well. As it is evident in all previous figures, obvious significant increase in the contact
angle values of the samples was obtained when the prepared suspensions were diluted
three or four times. Significant decrease by 10 to 20° was also observed in the obtained
contact angle hysteresis values. This can be explained by better filling of valleys
between surface asperities (on rough substrates) by thinner suspensions during spin-
coating. As a result, rough surfaces with asperities well covered with RTV silicon
rubber and deeper valleys were produced, which are wetted in the Cassie-Baxter mode
(i.e. with high contact angle and and low contact angle hysteresis values).
4.3 Surface Characterization
4.3.1 Scanning Electron Microscopy (SEM)
Figure 4.12 to Figure 4.14 show the scanning electron microscopy (SEM)
images, as well as the corresponding EDS spectra of etched substrate and rough
samples coated with RTV SR/TiO2, RTV SR/CeO2. These series of experiments were
conducted to investigate surface morphology and chemical composition of surfaces.
The peaks of O, Fe, Mn, Si and C refer to the second-phase particles on aluminum
surface and surface contaminations as well. The peaks corresponding to Ce and Ti
elements can be observed in Figs. 4.13 and 4.14 which imply existing RTV silicon
rubber coating layer with TiO2 or CeO2 particles incorporated on Al surface. The strong
Si peaks in Figs. 4.13 and 4.14 belong to the RTV silicon rubber coatings (there is no
similar peak in Fig. 4.12).
67

©Mr*F*
Mn Mn
1 2 3'%m Sent* 101 a etm O«»» r *,«W i
Fig. 4.12. SEM surface image and EDS spectrum of etched aluminum sample.
Spectrum
Fe
Mn
Ce
1 2 3 4ull Scale 272 cts Cursor: S.374 [6 cts]
akev
Fig. 4.13. SEM surface image and EDS spectrum of aluminum sample coated withRTV(l:4v/v)/CeO2(2 wt. %).
68

w Spectrum 1
SiMn
1 2 3ull Scale 898 cts Cursor: 6.372 Ç6 cts) keV
Fig. 4.14. SEM surface image and EDS spectrum of aluminum sample coated withRTV (1:4 v/v) /TiO2 (2wt. %).
Also scanning electron microscopy (SEM) images from flat aluminum sample
coated with RTV silicon rubber/hexane (1:4 v/v), etched aluminum sample coated with
RTV silicon rubber/hexane (1:4 v/v) and as-received aluminum sample are shown in
Figs. 4.14 - 4.17. Based on the SEM images obtained from different prepared coatings
in this study, dissimilar surface topographies were observed. This variation in surface
topography caused different coating properties, which will be described and discussed
in the following chapters. It is well seen in figures 4.15 and 4.16 that the alumina filler
particles (which are a part of the as-supplied silicone rubber product used in this study)
69

contributed to the topographies of the prepared coatings. Such micro-sized particles
are seen in both Figs. 4.15 and 4.16. However, on the rough substrate (Fig. 4.16), the
prepared coating is rougher, while it is relatively flat on a flat substrate (see Fig. 4.15
and Fig. 4.2a for comparison). Though both TiO2 and CeC^ nanoparticles are relatively
small, and therefore difficult to be seen in Figs. 4.14 and 4.13, they definitely
contributed to both surface roughness and water-repellent properties of rough titania-
doped RTV SR coatings. More specifically, while the non-doped rough sample in Fig.
4.16 demonstrated CAH - 1 5 ° , its titania and ceria doped counterparts (in Figs. 4.14
and 4.13) exhibited improved CA values of -145° and 145.5° and decreased CAH
values of ~ 10° and 6°, respectively (see Figs. 4.9 and 4.11).
This effect can be easily explained by the nano-roughness added by nano-sized
TiÛ2 or CeÛ2 particles, which could further improve the water repellency of the doped
RTV SR coatings compared with that of the non-doped rough sample in Fig. 4.16.
» » �-.�-, » * f te*# * « g'�<, # w,
?...
� r * . ". .��»*� f. '. * '�**# M r« � ' r ' � .4* * * � . ^ j , ' f : - i t
* Ô \ Êé$ �"'^'S : *m :%' » 1 0
Fig. 4.15. SEM surface image of flat Al sample coated with RTV (1:4 v/v).
70
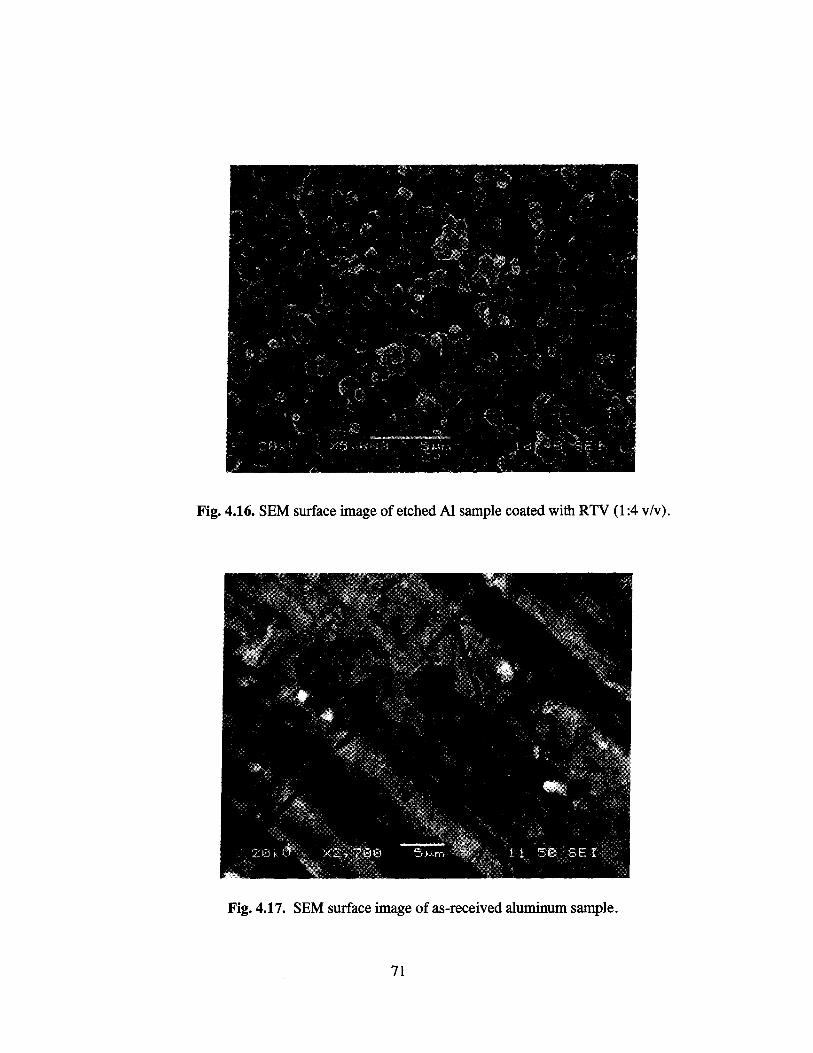
Fig. 4.16. SEM surface image of etched Al sample coated with RTV (1:4 v/v).
Fig. 4.17. SEM surface image of as-received aluminum sample.
71

4.4 Summary and Conclusions
The effect of incorporation of carbon-black nanoparticles as a dopant into the
RTV silicone rubber coatings prepared from RTV silicone rubber/hexane solution 1:1
(v/v) on the flat substrates was studied. It was shown that the nanoparticles have no
significant effect on the water contact angle on the coatings, although some slight
increase was seen in the values of these parameters for the concentration from 6 to 18
vol. % of carbon-black. This small increase in water contact angle is believed to be
related to the roughness of the coatings, which grew up slightly along with the carbon-
black concentration (Fig. 4.2). Also the same results were seen on TiCh and CeC>2
nanoparticles as dopants into the RTV silicone rubber coatings on the flat aluminum
substrate. Therefore, for preparation super-hydrophobic coatings, most efforts were
mainly concentrated on rough etched Al substrates. On rough (etched) substrates,
coatings with both high values of contact angle and low values of contact angle
hysteresis were prepared in case of all nanopowders used. The SEM investigations of
the sample surfaces revealed that the alumina filler (loaded into the as-supplied silicone
rubber product) had some influence on the surface topographies of the prepared
coatings. It was also found that the nanopowders used as dopants further increased the
surface roughness (and correspondingly - water repellency) of the coatings.
72

CHAPTER 5
EXPERIMENTAL RESULTS AND DISCUSSION:
ICE ADHESION STRENGTH ON SAMPLESURFACE
73

CHAPTER 5
EXPERIMENTAL RESULTS AND DISCUSSION:
ICE ADHESION STRENGTH ON SAMPLE SURFACE
The shear stress of ice detachment and the adhesion reduction factor (ARF)
values of RTV SR coated samples doped with carbon-black (CB), T1O2 or CeO2 as a
function of icing/de-icing cycles were tested. Ice adhesion on as-received and mirror
polished aluminum was measured under the same conditions. Therefore, in this chapter,
an attempt was in reducing the strength of adhesion of ice to the surfaces by applying
ice-phobic coatings. The contact angle values as function of icing/de-icing number
were measured after each icing/de-icing cycle on the coated samples.
5.1 Ice Adhesion Strength of Flat Aluminum SubstrateCoated with RTV SR Incorporated with Carbon-Black(CB) Nanoparticles
The shear stress (of ice detachment) values for both mirror-polished aluminum
surface and carbon-black doped RTV silicon rubber coatings are shown in Fig. 5.1. A
similar value on a mirror-polished (bare) aluminum surface is given as a horizontal line
74

at ~350 kPa. A relatively small increase in ice adhesion strength is seen when the vol.
% of carbon-black doped is raised from 0 to 18. Even the coating heavily loaded with
carbon-black (18 vol. %) demonstrates a shear stress of ice detachment value equal to ~
233 kPa (-33 % increase compared to the non-doped coating), which is �1.5 times
lower than on mirror-polished aluminum. The increase in ice adhesion strength with
dopant concentration observed in Fig. 5.1 can be also explained by somewhat increased
surface roughness of the doped coatings, which is in agreement with Fig. 4.1c in
chapter 4.
450
400
100
50
�RTVsilicone rubber with different %GB nanoparticles
�Minor polished Al samples
4 6 8 10 12 14 16Carbon black nanoparticles (vol. %)
18 20
Fig. 5.1. Ice Shear stress (kPa) vs. vol % of carbon-black nanoparticles incorporated inRTV SR/hexane (1:1 v/v) coated samples.
75

5.2 Ice Adhesion Strength on Rough Al Substrate Coatedwith RTV SR Incorporated with TiO2 or CeO2 Nanoparticles
The shear stress of ice detachment values of RTV SR coated samples with
different nanoparticles incorporated as a function of icing/de-icing cycles are shown in
Figs. 5.2 and 5.3. Only super-hydrophobic samples (i.e. doped with TiC>2 or CeC^)
were tested. Ice adhesion on as-received and mirror-polished aluminum was measured
under the same conditions, and the results are also presented in Figs.5.2 and 5.3. For
each coating studied, one sample was subjected to 10 successive icing/de-icing
operations.
600
500
§400S
1«"S300o
200
Mirror polished aluminumTiOi wt. % coated Al sampleCeO2 wt % coated Al sample
As-received aluminumTiO2 wt % coated Al sampleCeO2 wt % coated Al sample
5 6 7Icing/de-icing cycles
10 11
Fig. 5.2. Shear stress of ice detachment vs. icing/de-icing cycle number for coatingsspin-coated from RTV SR/hexane solutions (1:4 v/v) with (1, 2 wt. %) TiO2 and (1, 2wt. %) CeOî nanoparticles incorporated, respectively.
76

As-received uncoated flat aluminum was used as a standard showing shear
stress of ice detachment of 445 ± 20 kPa. The value of the mirror-polished aluminum
surface (350 ± 19 kPa) is also shown in Fig. 5.2. Shear stress of ice detachment on
different coated surfaces varied from 47 to 70, 50 to 72,44 to 67 and 40 to 63 kPa for
the coatings spin-coated from RTV SR (1:4 v/v) solution (in hexane) with 1,2 wt. % of
CeO2 and 1, 2 wt. % of TiO2 nanoparticles incorporated respectively. Reduced ice
adhesion can be related to the low surface energy coatings on the samples and air
incorporation into rough surface structures. It is observed that all samples values of ice
adhesion strength were at least ~7 times lower than those obtained on the mirror-
polished Al sample and ~9 times lower than those on the as-received aluminum
sample. The hydrophobic properties of those surfaces were examined after ice removal.
80
70
TiO2 1 wt % coated Al sampleTiO2 2 wt % coated Al sampleCeO21 wt % coated Al sampleCeO2 2 wt % coated Al sample
5 6 7Icing/de-icing cycles
10
Fig. 5.3. Shear stress of ice detachment vs. icing/de-icing cycle number for coatingsspin-coated from RTV SR/hexane solutions (1:4 v/v) with (1, 2 wt. %) TiO2 and (1, 2wt. %) CeO2 nanoparticles incorporated, respectively.
77
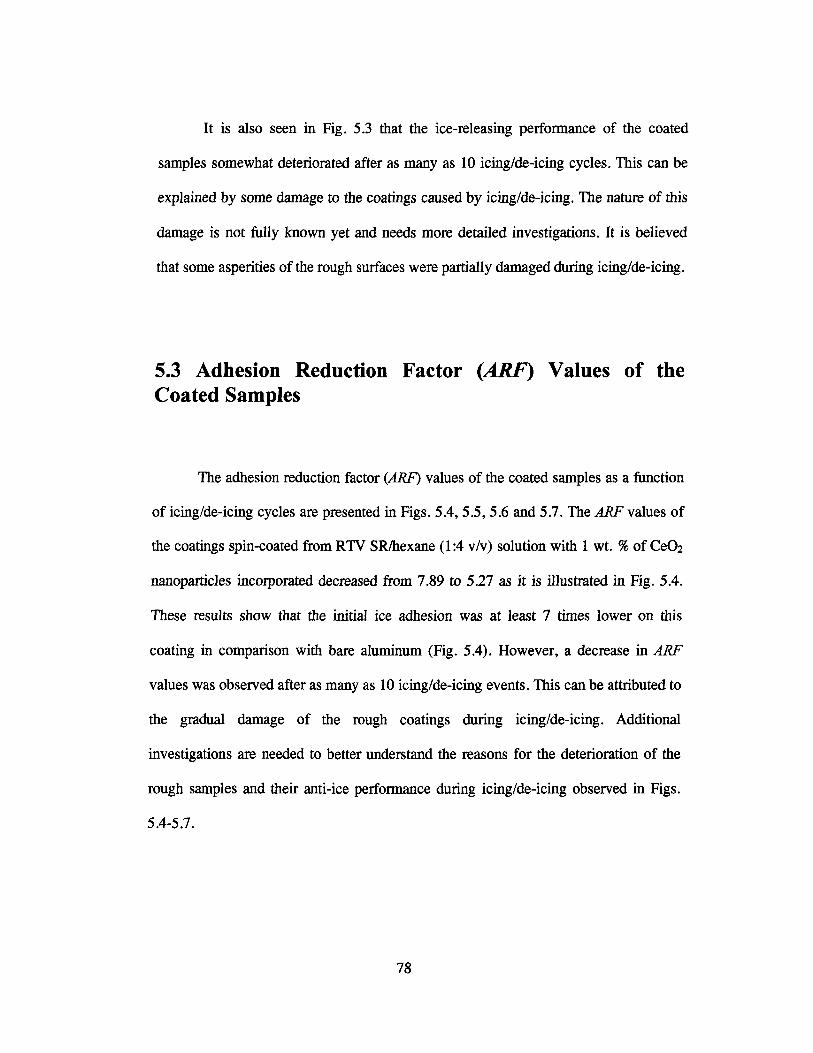
It is also seen in Fig. 5.3 that the ice-releasing performance of the coated
samples somewhat deteriorated after as many as 10 icing/de-icing cycles. This can be
explained by some damage to the coatings caused by icing/de-icing. The nature of this
damage is not fully known yet and needs more detailed investigations. It is believed
that some asperities of the rough surfaces were partially damaged during icing/de-icing.
5.3 Adhesion Reduction Factor (ARF) Values of theCoated Samples
The adhesion reduction factor (ARF) values of the coated samples as a function
of icing/de-icing cycles are presented in Figs. 5.4, 5.5, 5.6 and 5.7. The ARF values of
the coatings spin-coated from RTV SR/hexane (1:4 v/v) solution with 1 wt. % of CeCh
nanoparticles incorporated decreased from 7.89 to 5.27 as it is illustrated in Fig. 5.4.
These results show that the initial ice adhesion was at least 7 times lower on this
coating in comparison with bare aluminum (Fig. 5.4). However, a decrease in ARF
values was observed after as many as 10 icing/de-icing events. This can be attributed to
the gradual damage of the rough coatings during icing/de-icing. Additional
investigations are needed to better understand the reasons for the deterioration of the
rough samples and their anti-ice performance during icing/de-icing observed in Figs.
5.4-5.7.
78

Icing/de-icing cycles
Fig. 5.4. Ice adhesion reduction factor (ARF) as a function of icing/de-icing cycles onmirror-polished Al and a coating prepared from RTV SR/hexane (1:4 v/v) solution with1 wt. % of CeC>2 nanoparticle incorporated.
Similar behaviour in ice-repellent properties was also observed for the samples
coated with RTV SR incorporated with different percentage of CeC^ or TiO2
nanoparticles (Figs.5.4, 5.5, 5.6 and 5.7 respectively). The ARF values of the samples
with 1 and 2 wt. % of CeÛ2 nanoparticles incorporated decreased from 7.89 to 5.27 and
8.61 to 5.64, respectively, by increasing the number of icing/de-icing cycles to 10 times
(Figs. 5.4, 5.5). It is likely due to partial damage of the super-hydrophobic coatings
during icing/de-icing cycles which caused the decrease of super-hydrophobic properties
of the coated aluminum surfaces.
79

4 5 6Icing/de-icing cycles
10
Fig. 5.5. Ice adhesion reduction factor (ARF) as a function of icing/de-icing cycles onmirror-polished Al and a coating prepared from RTV SR/hexane solution (1:4 v/v) with2 wt. % of CeCh nanoparticle incorporated.
As it can be seen in Figs. 5.6, 5.7, the ARF values of the RTV SR coated
aluminum samples with 1 and 2 wt. % of TiC>2 nanoparticles incorporated decreased
from 6.96 to 4.95 and 7.29 to 5.09, respectively, by increasing the number of icing/de-
icing cycles to 10 times. This observed decrease of ARF values is probably due to
partial/fractional damage of the super-hydrophobic coatings during icing/de-icing
events which result in decreasing of super-hydrophobic properties of the coated
aluminum substrates.
80

Icing/de-icing cycles
Fig. 5.6. Ice adhesion reduction factor (ARF) as a function of icing/de-icing cycles onmirror-polished Al and RTV SR/hexane solutions (1:4 v/v) coating with 1 wt. % ofTiÛ2 nanoparticles incorporated.
4 5 6 7Icing/de-icing cycles
10
Fig. 5.7. Ice adhesion reduction factor (ARF) as a function of icing/de-icing cycles onmirror-polished Al and RTV SR/hexane solutions (1:4 v/v) coating with 2 wt. % ofTiO2 nanoparticles incorporated.
81

5.4 Contact Angle as a Function of Icing/de-icingCycles
It is important to know how such anti-ice coatings perform in time and how
their hydrophobic properties change. This was investigated by performing contact angle
measurements on the samples after icing/de-icing events. Figs. 5.8 and 5.9 illustrate
contact angle values as function of icing/de-icing events obtained after each icing/de-
icing cycle on the coated samples. All coated samples showed a gradual decrease in CA
values after each icing/de-icing event. This confirms that the rough surfaces were
gradually damaged and removed during each icing/de-icing event. This led to gradually
decreased surface roughness, which can explain why the CA values in Figs. 5.8 and 5.9
decreased from ~145 °to �125 ° after the samples were iced/de-iced 10 times.
160
RTV/TiO2 (1 wt. %) coated Al sample
RTV/TiO2 (2 wt %) coated Al sample
120 �
1 1 0 �
1004 6Icing/de-icing cycles
10 12
Fig. 5.8. Contact angle vs. icing/de-icing cycles number for the RTV SR coatingsprepared from RTV SR/hexane mixtures (1:4 v/v) and doped with TiO2 (1 and 2 wt. %)coated aluminum samples.
82

160
150
110
100
RTV/CeO2 (1 wt. %) coated Al sample
RTV/CeO2 (2 wt. %) coated Al sample
3 4 5 6 7
Icing/de-icing cycles10 12
Fig. 5.9. Contact angle vs. icing/de-icing cycles number for the RTV SR coatingsprepared from RTV SR/hexane mixtures (1:4 v/v) and doped with CeO2 (1 and 2 wt.%) coated aluminum samples.
This decrease in CA could be associated with loss of hydrophobic properties of
the RTV SR/TiO2 (1 and 2 wt. %) coated aluminum samples after 10 icing/de-icing
cycles. The shear stress of ice detachment values on such coated samples were shown
to gradually increase as the samples were iced/de-iced repeatedly (see section 5.2).
Therefore, both the increasing ice adhesion strength and decreasing contact angle
values confirm the assumption that the super-hydrophobic coatings in study gradually
deteriorated during icing/de-icing as a result of gradually decreasing surface roughness.
83

5.5 Summary and Conclusions
These results show that initially, ice adhesion was at least 7, 8 and 6, 7, (1, 2
wt. % of CeÛ2) and (1,2 wt. % of TiO2> times lower on the coatings in comparison to
mirror-polished aluminum, which can lead to easier removal of accumulated ice from
those surfaces. The highest ARF value of 8.61 was obtained in case of 2 wt. % of CeÛ2
nanoparticle treated surface in comparison to 7.89 found for the sample with 1 wt. % of
CeÛ2 incorporated. However, ARF values were somewhat lower on the TiC^-doped
RTV SR coatings, being initially 7.89 and 6.96 for the samples with 2 wt. % and 1 wt.
% TiC>2, respectively. This finding can be explained by somewhat lower hydrophobic
properties observed for the TiC^-doped RTV SR coatings. As lower water-solid contact
area are expected on super-hydrophobic surfaces with higher CA and lower CAH
values (i.e. with CeC>2 dopant), this must have led to smaller ice-solid contact areas on
such surfaces, and that is why the ice adhesion strength on such samples was found to
be smaller. The reason of these differences in previous mentioned obtained results
could be the different surface topography of the samples prepared with different
nanopowders and their concentration in RTV SR/hexane solution.
The results obtained in this work on RTV SR coatings incorporated with
different types of nanoparticles (i.e. carbon black, TiC>2, CeC>2) suggest that no obvious
effect of dopant nature (and thus dielectric properties) on ice adhesion strength was
observed. The difference in ice adhesion strength evaluated on different (flat and rough)
samples suggests that it is the surface topography (and thus, the ice-solid contact area as
a result of the latter) that plays the crucial role in governing the ice adhesion strength on
84

nanoparticle-incorporated RTV SR coatings (rather than the particle nature). This could
be explained by (i) relatively low concentrations of the particles used (~1 - 3 wt. %),
(ii) good coverage of the particles by RTV SR material (which interacted with water
and/or ice) and (iii) very small contact areas (ice-solid) on the super-hydrophobic
samples studied. Therefore, the previously proposed hypothesis on the effect of the
dielectric constant of the material coating [85] on the strength of ice adhesion on its
surface was not confirmed in this work and may need further experimental tests to be
verified.
85

CHAPTER 6
EXPERIMENTAL RESULTS AND DISCUSSION:
STABILITY OF SAMPLES IMMERSED IN DI-WATER AND FREEZING OF WATER DROPLETS
ON SAMPLE SURFACES
86

CHAPTER 6
EXPERIMENTAL RESULTS AND DISCUSSION:STABILITY OF SAMPLES IMMERSED IN DI-WATER AND
FREEZING OF WATER DROPLETS ON SAMPLE SURFACES
In this chapter, freezing of water droplet on the surfaces prepared was
investigated. The small water droplets freeze on different surfaces over time at surface
temperature ~ -15°C. The results obtained of freezing time (s) as a function of contact
angle hysteresis (CAH) are presented below. Also the stability of three super-
hydrophobic RTV SR coatings (doped with carbon-black, TiC>2 or CeO2> by immersion
in de-ionized water were studied.
6.1 Stability of Samples Immersed in DI Water
Figs. 6.1-6.3 show how contact angle evolves on surface of three super-
hydrophobic RTV SR coatings (doped with carbon-black, TiO2 or CeCh) as a function
of immersion time in de-ionized water. From time to time, the samples were removed
from water, blown with nitrogen, and their CA values were evaluated. These series of
87

experiments were carried out by dipping samples under de-ionized water with water
conductivity of -0.32 us. Cm"1. All the coatings studied are demonstrated to gradually
lose their hydrophobic properties over time. For instance, this is observed for Al
samples coated with RTV7TiO2 (2 wt. %) and RTV/CB (3 wt. %) by - 7 0 0 h of
immersion in de-ionized water and -4200 h of immersion in de-ionized water for
coated Al samples with RTV/CeC>2 (2 wt. %), which is associated with significant
decrease of water contact angles. Moreover, all coated samples immersed/tested in de-
ionized water were from time to time removed from water and annealed over-night to
get rid of any water (if any) that might penetrate into the rough structure between
asperities.
160
140
120
100
s 60
§ 40
20
- - � - - RTV/Carbon black(CB)(3 wt. %) coated Al sample
� RTV/CB (3 wt. %) coated Al sample(ler overnight)
- - * - - RTV/CB (3 wt. %) coated Al sample(2er overnight)
���RTV/CB (3 wt. %) coated Al sample(3er overnight)
�*�RTV/CB (3 wt. %) coated Al sample(4er overnight)
50 100 150 200 250 300 350 400
Time (h)
450 500 550 600 650 700 750
Fig. 6.1. Contact angle vs. immersion time in de-ionized water for RTV SR/CB (3 wt. %of carbon-black) coating.
88

"I2
The results (Figs. 6.1 - 6.3) show that after each annealing event, the samples'
contact angle values could be regained only partially, which means that the coatings
degraded during continuous contact with DI water. Any possible effect of different
nanopaiticle size and/or nature on coating stability was also investigated showing all
coatings degrade slowly within several days of immersion in de-ionized water, which is
seen as a decrease of CA values over time. The nature of this deterioration (or
chemistry of coating-water reactions, if any) is not clear yet.
160
140
120
100 -
80
60
40
20 -
-I
- � - RTV/TiO2 (2 wt. %) coated Al sample
-�� RTV/TiO2 (2 wt. %) coated Al sample (1 er overnight)
-*" RTV/TiO2 (2 wt. %) coated Al sample (2 er overnight)
� X - Rxv/TiO2 (2 wt. %) coated Al sample (3 er overnight)
0 40 50 100 150 200 250 300 350 400 450 500 550 600 650 700 750 800
Time (hour)
Fig. 6.2. Contact angle vs. immersion time in de-ionized water for Al sample coated withRTV(l:4)/TiO2(2wt. %).
89

160
140
120
100
CM 8 0 -
40 -
20
: RTV/CeO2 (2 wt. %) coated Al sample- ! RTV/CeO2 (2 wt %) coated Al sample (I er overnight)� RTV/CeO2 (2 wt %) coated Al sample (2 er overnight)- RTV/CeO2 (2 wt %) coated Al sample (3 er overnight)- RTV/CeO2 (2 wt %) coated Al sample (4 er overnight)� RTV/CeO2 (2 wt. %) coated Al sample (5 er overnight)
0 100 200 300 400 500 600 700 800 900 1000 1100 1200
Time (h)
Fig. 6.3. Contact angle vs. immersion time in de-ionized water for Al sample coatedwith RTV (1:4) / CeO2 (2 wt. %).
6.2 Freezing of Water Droplets on Sample Surfaces
A series of experiments were conducted to investigate water freezing on the
surfaces prepared. Figure 6.4 demonstrates how small water droplets freeze on two
different surfaces (uncoated Al, Fig. 6.4a, and CeC>2-doped super-hydrophobic RTV SR
coatings, Fig. 6.4b) over time at surface temperature ~ - 15°C. The results obtained of
freezing time as a function of contact angle hysteresis (CAH) are presented in Fig. 6.5.
During the experiments, water droplets (4 uL) were placed on a Peltier cooling stage
unit (at -15 °C), and their images were regularly taken by using the goniometer's optics
and software. It was observed that the maximum freezing time for water droplet on the
90

samples' surface refers to the surfaces covered with RTV SR/CeO2 and RTV SR/TiO2.
All concluded freezing steps (from 22 °C to -15 °C) can be seen in Figs. 6.4a and 6.5b
from left to right, respectively. Fig. 6.4 shows representative images for droplets
freezing on flat (uncoated) Al (a) and on CeC>2- incorporated RTV SR super-
hydrophobic coating (b). The images show droplet shapes and times (i) immediately
after the droplets were placed on the cold surfaces, (ii) immediately after water-solid
interface ice nucleation, (iii) after complete drop crystallization. The ice nucleation at
the solid-water interface was observed and determined as the time when light reflection
(inside the droplet) drastically changed (see Fig. 6.4). This occurred, e.g., after ~3s on
the flat uncoated Al and after ~720 s on the CeO2/RTV SR super-hydrophobic samples
(see Figs. 6.4a, 6.4b)
(a)
Fig. 6.4. Images of small water droplets on cold (-15 °C) surfaces: (a) flat Al, (b) roughsuper-hydrophobic RTV/CeCh surface.
91

� � /nte/face solidification**FL41 crystallization
10 20 30
Contact angle hystresis (°)
Fig. 6.5. Water droplet freezing times vs. contact angle hysteresis of coated samples.Data for uncoated flat Al are also given. The lines are simply guide to the eye.
Figure 6.5 demonstrates the water droplet freezing time for the flat uncoated Al
surface was very short, and water froze just within a few seconds (Fig. 6.4a). However,
the water droplet freezing time for rough Al surfaces coated with RTV SR/CeC>2
nanoparticles or TiC^ nanoparticles incorporated was significantly longer (on the order
of �12 - 13 min). The reason for such different behaviour was the different surface
topography of the samples. The water-solid contact area on the super-hydrophobic
samples was very small (see Fig. 6.6). When the water-solid contact area increases, heat
transfer between the surface and water droplet will be increased as well. This well
explains the trend clearly observed in Fig. 6.5. The CAH values on rough hydrophobic
92

surfaces with same chemistry (RTV SR) are directly related to water-solid contact areas
on the samples.
Table 6.1 gives a brief description of the samples. The samples prepared in this
study were: polished aluminum (sample 1), RTV SR coated polished aluminum
(sample 2), HC1 etched (rough) RTV SR coated aluminum (sample 3) and rough RTV
SR coated samples doped with carbon-black, CeO2 and TiCh nanopowders (samples 4,
5 and 6, respectively). In all the cases, the RTV SR to hexane ratio was 1:4.
Table 6.1. Contact angle, contact angle hysteresis and freezing times of differentsamples.
Sample
Topography
Dopant
CA (deg.)
CAH(deg.)
FreezingTimes (s)
1
PolishedAl
-
55 ±5
>50
3/5
2
RTVSRflat
-110 ±
2
45
85/218
3
RTVSR
rough
-
143 ±1.5
40
37/347
4
RTVSR
rough
CB
145 ±1
20
353/380
5
RTVSR
rough
CeO2
147 ±1
5
755/780
6
RTVSR
rough
TiO2
146 ±1
9
705/735
Figure 6.6 illustrates how heat is transferred through the water-solid interface
area of a water droplet residing on a super-hydrophobic surface (Cassie-Baxter regime).
It is evident from this schematic model that the more surface roughness is, the less
water-solid contact area, and thus, the more entrapped air between water-solid.
Therefore, the heat exchange process between water droplet and solid will be reduced
due to the entrapped air (as insulator) leading to postponed freezing time of water
93

droplets. Therefore, as seen in Fig. 6.5, water drops were frozen with such a big delay
on super-hydrophobic samples (�12-13 min) compared to their flat or uncoated
counterparts. Note that the rough hydrophobic surface coated with RTV SR did not
delay water freezing on its surface much. This could be related to a larger water-solid
contact area on this surface. This agrees well with the relatively large value of CAH
observed on this surface ( ~ 40°).
Fig. 6.6 Water drop on a super-hydrophobic surface. Heat transfer at surface/ waterdrop interface is shown by short arrows.
Table 6.2 presents thermal conductivities for all materials involved into the
samples in Fig. 6.5. Uncoated Al is seen to have the highest thermal conductivity, and
this is in agreement with the fast freezing observed in Fig. 6.4a.
Table 6.2. Thermal conductivity values of different material.
Material
Thermalcoadtictivity
Air
m
Ice
US
m
Ahimimim
m
RTVSR
1.1
m
Carbon black
0J-0Jmi
TiO, :
IS
w
CeO2
12pa
94
Carbon-black demonstrates a relatively low thermal conductivity, and this
could contribute to the delay in freezing observed on the super-hydrophobic carbon-
black -incorporated RTV SR coating in Fig.6.5.. Both CeC>2 and TiO2 have quite low
thermal conductivities (almost as low as that of RTV SR). This could also contribute to
the longest freezing delay on the coatings doped with TiC>2 and CeO2. However, the
major factor is believed to be the low water-solid contact area on these surfaces.
6.3 Summary and Conclusions
It was shown that all coatings slowly degrade after several days of immersion
in de-ionized water, which is seen as a reduction of CA values over time. For example,
via ~700 h of immersion in de-ionized water in case of coated Al samples with RTV
SR/TiO2 (2 wt. %) and RTV SR/CB (3 wt. %) coatings and -1200 h of immersion in
de-ionized water for coated Al samples with RTV SR/CeCh (2 wt. %). But the nature of
this deterioration is not clear yet.
The combination of both the low CAR value and delayed freezing observed on
the super-hydrophobic coatings prepared show promise for anti-ice applications. First,
as shown above, water droplets freeze with a significant delay on such surfaces.
Second, low CAH values provide high mobility of the droplets on such surfaces.
Therefore, water droplets can roll off such surfaces before getting frozen. This is
believed to lead to significantly reduced ice accumulation on such surfaces. Finally,
significantly lower values of ice adhesion strength were also found for such surfaces
95

(compared to uncoated Al), thus clearly making them attractive candidates for anti-ice
applications on various high-voltage equipment (both conductors and insulators).
96

CHAPTER 7
CONCLUSIONS AND RECOMMENDATION FOR
FUTURE WORKS
97

CHAPTER 7
CONCLUSIONS AND RECOMMENDATION FORFUTURE WORKS
7.1 Conclusions
In this study, hydrophobic and ice-repellent behaviour of silicone rubber
coatings doped with nanopowders was studied and compared with that of uncoated
metal surface. For this purpose, various flat and rough coatings were prepared, using a
number of nanopowders as dopants. Carbon-black, TiCh and CeCh nanopowders were
used, being materials which are (or can be) used to modify both mechanical and
electrical properties of silicone rubber layers for application to outdoor power network
equipment, including insulators. It was shown that the hydrophobic and ice-releasing
properties of flat composite (i.e. doped) coatings are not influenced by nanopowder
incorporation significantly, implying that all nanopowders were well dispersed in
silicone rubber material, and the latter constituted the topmost layer of the coatings. By
optimizing spin-coating parameters, coatings with super-hydrophobic properties could
be prepared. Such coatings demonstrated high values of contact angle with water and
98

low values of contact angle hysteresis for all the nanopowders used. The achieved
super-hydrophobicity is shown to be a result of the combination of a low-surface-
energy layer and both micro- and nano-roughnesses which are provided by the alumina
filler (present in the silicone rubber product) and dopant particles, respectively.
Use of rough (etched) substrates facilitated the preparation of super-
hydrophobic surfaces. More diluted nanopowder-silicone rubber (with hexane)
suspensions were found to lead to coatings with improved water repellency when
composite coatings with various dopants were prepared on rough substrates. Moreover,
when the substrate etching time was increased from 1 min to 5 min, contact angle of the
coated doped samples normally increased and contact angle hysteresis decreased. This
tendency in hydrophobic properties was observed by applying different concentrations of
carbon black nanoparticles (1.5 and 3 wt. %), TiO2 (1 and 2 wt. %) or CeO2 (1 and 2 wt.
%) incorporated. These observations are believed to be related to the coatings roughness,
which grew up slightly along with increasing weight percentage of carbon-black (1.5 to 3
wt. %), TiÛ2, or CeÛ2 (1 to 2 wt. %) concentration incorporated into the coatings.
The ice-releasing properties of super-hydrophobic coatings were shown to be
enhanced, if compared to those of flat coatings with same composition, which is
explained by the reduced ice-solid contact areas on such micro-mano-rough surfaces.
However, the icephobic performance of such super-hydrophobic surfaces somewhat
degraded during successive icing/de-icing cycles, implying the occurrence of some
mechanical damage to the rough surfaces. The ice-releasing performance of the coated
samples showed some deterioration after 10 icing/de-icing cycles. All super-hydrophobic
samples demonstrated initial ice adhesion strength values at least ~7 times lower than
99

those obtained on a mirror-polished aluminum and ~9 times lower than those on an as-
received uncoated Al sample. This decrease in ice adhesion strength can lead to easier
removal of accumulated ice from such coated surfaces.
All the coatings studied were demonstrated to gradually lose their hydrophobic
properties after -700 h of immersion in de-ionized water for the samples coated with
TiO2 or carbon-black incorporated silicone rubber and ~1200 h for samples coated with
CeÛ2 doped silicone rubber, which was seen as a significant decrease of their water
contact angle.
The freezing of water droplets on various samples was investigated by placing
droplets on surfaces at -15 °C. While on flat uncoated Al small droplets froze after -3-5
seconds, their freezing was significantly delayed on rough CeC>2 and TiO2 incorporated
silicone rubber coatings, taking place at ~ 12-13 min. The delayed freezing of water
droplets on the nanocomposite super-hydrophobic surfaces examined is explained by the
reduced water-solid contact areas on such rough surfaces. As the water-surface interface
on such samples is to a large extent air, this slows down any heat exchange between
water droplets and cold surfaces, leading to significantly delayed water freezing. Taking
into account the high water mobility observed on such surfaces (i.e. low wetting
hysteresis), this shows promise, as water can be removed from such super-hydrophobic
surfaces before getting frozen. Thus, the silicone rubber coatings (doped with
nanopowders) prepared in this study show promise as anti-ice materials that can reduce
accumulation of ice on outdoor power network equipment. Provided that such rough
doped coatings with similar topographies are prepared on other substrates (e.g., porcelain
or glass), similar behaviour is expected in all cases. That is, even though this study was
100

focused on aluminum (metal) as substrate, its results can equally be applied to any other
materials which are subjected to outdoor icing.
7.2 Recommendations for Future Work
(i) Various nanoparticle-incorporated silicone rubber coatings are to be carefully
studied on different substrates (non-metallic substrates, with properties close to those of
insulators). And both optimal parameters for enhanced super-hydrophobicity and
adhesion of the coatings to the substrates are to be sought.
(ii) Different types of as-supplied RTV silicones, ranging from heavily loaded
with fillers to filler-free silicones are recommended to be tested. Doping such different
silicone rubbers with different nanopowders will give more information on how different
fillers, modifying both mechanical and electrical properties of silicone rubber coatings,
influence their wetting and ice-repellent properties.
(iii) The electrical properties (e.g. dielectric constant) of such composite coatings
are to be studied as a function of nanopowder/dopant concentration and nature, as well as
coatings, thickness and topography (in case of rough coatings).
(iv) Preparation of rough coatings can be further optimized on different
(including flat) substrates, so that super-hydrophobic coatings can be reached on both
rough and flat substrates.
101

(v) Flashover voltage is to be measured on surfaces of such nanopowder-
modified silicone rubber coatings on insulators, which is expected to be higher than on
nanoparticle-free silicone rubber coatings.
(vi) Further studies should be conducted in order to improve anti-ice performance
of such coatings during icing/de-icing. In this context, coatings ranging from heavily-
doped with various nanopowders as fillers (i.e., harder coatings) to those based on filler-
free silicone rubber (i.e., most elastic coatings) are recommended to be tested.
102

References
[1] M. Farzaneh, Ed., "Atmospheric icing of power networks", Springer, Berlin, (2008) 381 p.
[2] M. Farzaneh and W.A. Chisholm, "Insulators for icing and polluted environments", IEEEPress series on Power Engineering, IEEE/John Wiley, New York, (2009) 680 p.
[3] M. Farzaneh and O. T. Melo,"Flashover performance of insulators in the presence ofshort icicles", Int. J. Offshore Polar Eng. 4 (1994) 112.
[4] M. Farzaneh (Chair), "IEEE standard 1783 - guide for test methods and procedures toevaluate the electrical performance of insulators in freezing conditions". IEEE Press,New York, October 2009.
[5] M. Farzaneh, "Ice accretion on H.V. conductors and insulators and related phenomena",Philos. Trans. R. Soc. London, Ser. A. 358 (2000) 1.
[6] M. Farzaneh, "Rapport sur la tempête de verglas de Janvier 1998, comité d'expertsd'Hydro- Quebec (Comité Varennes) " 1998.
[7] V. F. Petrenko and S. Peng, "Reduction of ice adhesion to metal by using self-assemblingmonolayers (SAMs)", Can. J. Phys. 81 (2003) 387.
[8] J. L. Laforte, M. A. Allaire and J. Laflamme, "State-of-the-art on power line de-icing",Atm. Res. 46 (1998) 143.
[9] C. Laforte and A. Beisswenger, "Icephobic material centrifuge adhesion test", ininternational workshop on atmospheric icing on structures (IWAIS), Montreal, Canada,2005.
[10] V. K. Croutch and R. A. Hartley, "Adhesion of ice to coatings and the performance ofice release coatings", J. Coat. Technol. 64 (1992)41.
[11] B. Y. Yang and R. Montgomery, "De-icers derived from corn steep water", Bio.Technol. 90 (2003) 265.
[12] V. F. Petrenko and S. G. Qi, "Reduction of ice adhesion to stainless steel by iceelectrolysis", J. Appl. Phys. 86 (1999) 5450.
[13] D. Kuroiwa, "Icing and snow accretion on electric wires", CRREL Res. Report123,1965.
103

[14] R. Cattin, S. Kunz, A. Heimo, R. Oechslin, M. Russi, "An improved approach for thedetermination of in-cloud icing at wind turbine sites", Federal Office of Meteorologyand Climatology Meteo-Swiss COST Action 727.
[15] W. D. Macklin, "The density and structure of ice formed by accretion", Q. J. Roy.Meteorol. Soc. 88 (375)0962)30.
[16] http://amsglossary.allenpress .com/glossary/search7icNglazel : Glaze in the glossary ofmeteorology.
[17] F. Kiessling, P. Nefzger, J. F. Nolasco and U. Kaintzyk, "Overhead power lines:planning, design, construction", Springer 2003.
[18] C. Ryerson, "Assessment of superstructure ice protection as applied to offshore oiloperations safety", ERDC/CRRELTR-08-14, September 2008.
[19] E. R. LaChapelle, "Field guide to snow crystals", Seattle, Wash.: University ofWashington Press. (1969) 101.
[20] N. D. Mulherin, "Atmospheric icing on communication masts in New England",CRREL Res. Report , 86-17 (1986) 46.
[21] L. D. Minsk, "Icing on structures", CRREL Res. Report, 80-31 (1980) 18.
[22] D. Kuroiwa, "Icing and snow accretion on electric wires", U.S. Army Cold RegionsResearch and Engineering Laboratory, Res. Report, 123 (1965) 10.
[23] H. W. Berndt and W. B. Fowler, "Rime and hoarfrost in upper-slope forests of easternWashington", J. Forest. 61 (1969) 92.
[24] S. Baranowski and J. Liebersbach, "The intensity of different kinds of rime on theupper tree line in the Sudety Mountains", J. Glaciol. 19(1977)489.
[25] L. Makkonen, "Estimating intensity of atmospheric ice accretion on stationarystructures", J. Appl. Meteorol. 20 (1981) 595.
[26] L. Makkonen and K. Ahti, "The effect of meteorological parameters on rime formationi n Finland", U.S. Army Cold Regions Re-search and Engineering Laboratory SpecialReport, 83-17 (1983) 167-174.
[27] N. N. Khusnatdinov and V. F. Petrenko, "experimental study of ice electrolysis underUV irradiation", J. Phys. Chem. 101 (1997) 6208.
[28] V.F. Petrenko and C.R. Sullivan,"Methods and systems for removing ice from surfaces,"U.S. Patent 6653598,2003.
[29] I. A. Ryzhkin and V. F. Petrenko. "Physical mechanisms responsible for ice adhesion".J. Phys. Chem. 101 (1997) 6267.
104

[30] V. F. Petrenko and R. W. Whitworth, "Physics of ice", Oxford university press, Oxford,1999.
[31] V. F. Petrenko and S. Qi, "Reduction of ice adhesion to stainless steel by iceelectrolysis", J. Appl. Phys. 86 (1999) 10.
[32] V. F. Petrenko, "Effect of electric fields on adhesion of ice to mercury", J. Appl. Phys.84(1998)261.
[33] N. Dalili, A. Edrisy and R. Caniveau, "A review of surface engineering issues criticalto wind turbine performance", Renewable and Sustainable Energy Reviews. 13 (2009)428.
[34] V. K. Croutch and R. A. Hartley, "Adhesion of ice to coatings and the performance ofice release coatings", J. Coat.Technol. 64 (1992) 41.
[35] M. Amin, M. Akbar and S. Amin, "Hydrophobicity of silicone rubber used for out doorinsulation", Rev. Adv. Mater. Sci. 16 (2007) 10.
[36] V. K. Croutch and R. A. Hartley, "Adhesion of ice to coatings and the performance ofice release coatings", J. Coat. Technol., 64 (1992) 41.
[37] A.V. Adamson, "Physical chemistry of surfaces", New York: Wiley; 1990.
[38] J. N. Israelachvili, "Intermolecular and surface forces", 2nd ed. London: AcademicPress; 1992.
[39] B. Bhushan, "Principles and applications of tribology", New York: Wiley; 1999.
[40] M. Nosonovsky and B. Bhushan, "Roughness optimization for biomimeticsuperhydrophobic surfaces", Microsyst. Technol. 11 (2005) 49.
[41] M. Nosonovsky, B. Bhushan, "Multiscale dissipative mechanisms and hierarchicalsurfaces", friction, super-hydrophobicity,and biomimetics. Heidelberg, Germany:Springer-Verlag; 2008.
[42] T. S. Lin, C. F. Wu and C. T. Hsieh, "Enhancement of water-repellent performance onfunctional coating by using the Taguchi method", Surf. Coat. Technol. 200 (2006)5253.
[43] B. S. Hong, J. H. Han, S. Kim, Y. J. Cho, M. S. Park, T. Dolukhhanyan and C. Sung,"Antireflective Silica Thin Films with Super Water Repellence via a Solgel Process",Thin Solid Films. 351 (1999) 274.
[44] B. Bhushan Biomimetics, "lessons from nature-an overview". Phil. Trans. R. Soc. A.367(2009) 86.
105

[45] B. Bhushan, Y. C. Jung and K. Koch, "Micro-, nano- and hierarchical structures forsuper-hydrophobicity, self-cleaning and low adhesion", Phil. Trans. R. Soc. A. 367(2009) 72.
[46] K. Koch, B. Bhushan, Y. C. Jung and W. Barthlott, "Fabrication of artificial lotusleaves and significance of hierarchical structure for super-hydrophobicity and lowadhesion", Soft Matter. 5 (2009) 93.
[47] C. Neinhuis and W. Barthlott, "Characterization and distribution of water-repellent,self-cleaning plant surfaces", Ann. Bot. 19 (1997) 77.
[48] W. Barthlott and C. Neinhuis, "Purity of the sacred lotus, or escape from contaminationin biological surfaces", Planta. 202 (1997) 1.
[49] P. Wagner, R. Furstner, W. Barthlott and C. Neinhuis, "Quantitative assessment to thestructural basis of water repellency innatural and technical surfaces", J. Exp. Bot. 54(2003) 303.
[50] Z. Burton and B. Bhushan, "Surface characterization and adhesion and frictionproperties of hydrophobic leaf surfaces", Ultramicroscopy. 106 (2006) 19.
[51] B. Bhushan and Y. C. Jung, "Micro and nanoscale characterization of hydrophobic andhydrophilic leaf surface", Nanotechnolgy. 17 (2006) 72.
[52] K. Koch, B. Bhushan and W. Barthlott, "Diversity of structure, morphology, andwetting of plant surfaces (invited)", Soft Matter. 4 (2008) 63.
[53] K. Koch, B. Bhushan and W. Barthlott, "Multifunctional surface structures of plants:an inspiration for biomimetics (invited)", Prog. Mater. Sci. 54 (2009) 78.
[54] X. F. Gao and L. Jiang, "Biophysics: water-repellent legs of water striders", Nature.432 (2004) 36.
[55] X. Zhang, F, Shi, J, Niu, Y, Jiang and Z, Wang, "Super-hydrophobic surfaces: fromstructural control to functional Application", J. Mater. Chem, 18 (2008) 621.
[56] R. N. Wenzel, "resistance of solid Surfaces to wetting by water", Ind. Eng. Chem. 28(1936) 988.
[57] A. Cassie and S. Baxter, "Wettability of porous surfaces", Trans. Faraday Soc, 40(1944) 546.
[58] T. S. Lin, C. F. Wu and C. T. Hsieh, "Enhancement of water-repellent performance onfunctional coating by using the Taguchi method", Surf. Coat. Technol, 200 (2006)5253.
[59] R. N. Wenzel, "Resistance of solid surfaces to wetting by water", Indust. Eng. Chem.28 (1936) 94.
106

[60] A. Cassie and S. Baxter, "Wettability of porous surfaces", Trans. Faraday. Soc. 40(1944)51.
[61] R. E. Johnson and R. H. Dettre, "Contact angle hysteresis", In: Fowkes FM, editor.Contact angle, wettability, and adhesion. Adv. Chem. Ser., Chem. Soc. 43 (1964) 35.
[62] Y. C. Jung and B. Bhushan, "Contact angle, adhesion, and friction properties of micro-and nanopatterned polymers for super-hydrophobiciry", Nanotechnology. 17 (2006) 80.
[63] M. Nosonovsky and B. Bhushan, "Patterned non-adhesive surfaces: super-hydrophobicity and wetting regime transitions", Langmuir 24 (2008) 33.
[64] P. G. de Gennes, W. F. Brochard and D. Quéré, "Capillarity and wetting phenomena",Berlin, Springer; 2003.
[65] S. Shibuichi, T. Onda, N. Satoh and K. Tsujii, "Super water-repellent surfaces resultingfrom fractal structure", J. Phys. Chem, 100 (1996) 19512.
[66] K. Tadanaga, N. Katata, and T. Minami, "Super-water-repellent AI2O3 coating filmswith high transparency", J. Am. Ceram. Soc, 80 (1997) 1040.
[67] K. Geunjae, L. Mikyung, S. Karuppanan and Y. Kijung, "Wettability control and waterdroplet dynamics on SiC-SiÛ2 core-shell nanowires", Langmuir, 26 (2010) 12273.
[68] E.A. Cherney, "Silicone rubber dielectrics modified by inorganic fillers for outdoorhigh voltage insulation applications", IEEE Trans. Diel. El. Ins. 12 (2005) 1108.
[69] S. Jana, A.S. Khojin, W.H. Zhong, H. Chen, X. Liu and Q. Huo, "Effect of goldnanoparticles and lithium hexafluorophosphate on the electrical conductivity ofPMMA", Solid State Ionics. 178 (2007) 1180.
[70] P.C. Ma, B.Z. Tang and J.K. Kim, "Effect of GNT decoration with silver nanoparticleson electrical conductivity of GNT-polymer composites", Carbon 46 (2008) 1497.
[71] S.H. Choi, ID. Kim, J.M. Hong, K.H. Park and S.G. Oh, "Effect of the dispersibility ofBaTiC>3 nanoparticles in BaTiCVpolyimide composites on the dielectric properties",Mater Lett. 61 (2007) 2478.
[72] Y. Kobayashi, T. Tanase, T. Tabata, T. Miwa and M. Konno, "Fabrication anddielectric properties of the BaTiO3-polymer nano-composite thin films", J. Europ. Cer.Soc. 28(2008)117.
[73] C. Li, Y. Gu , L. Xiaobo , Z. Yaobang and T. Anbing, "Synthesis and dielectricproperty of polyarylene ether nitriles/titania films", Thin Solid Films 515 (2006) 1872.
107

[74] F. Su, J. Zhidong, G. Haifeng and G. Zhicheng, "Influence of fillers on silicone rubberfor outdoor insulation", Annual report conference on electrical insulation and dielectricphenomena, (2007).
[75] U. Chatterjee and S.K. Jewrajka, "Synthesis of block copolymer-stabilized Au-Ag alloynanoparticles and fabrication of poly (methyl methacrylate)/Au-Ag nanocomposite film",J. Colloid Sci. Interface 313 (2007) 717.
[76] L. Luo, Z. Zhang and L. Hou, "Development of a gold nanoparticles basedchemiluminescence imaging assay and its application", Anal. Chim. Acta 584 (2007) 106.
[77] W. Y. Liao, Z. C. Guan, L. M. Wang, J. Yang, J. B. Fan, Z. Su and J. Zhou, "Reducingice accumulation on insulators by applying semiconducting RTV silicone coating", IEEETrans. Diel. El. Ins. 14 (2007) 1446.
[78] K. Siderakis and P. Agoris, "Performance of RTV silicone rubber coatings installed incoastal systems", El. Pow. Syst. Res. 78 (2008) 248.
[79] S. Rastegar and Z. Ranjbar, "DC and AC electrical conductivity of electro-depositedcarbon-black-epoxy composite films", Prog. Org. Coat. 63 (2008) 1.
[80] M. Kermani, "Ice shedding from cables and conductors - A cracking model of atmosphericice", Ph.D. thesis, UQAC, 2007.
[81] C. Laforte and A. Beisswenger, "Icephobic material centrifuge adhesion test",Proceedings of the International Workshop on Atmospheric Icing of Structures (IWAISXI), Montréal, (2005) 357.
[82] L.E. Kollar and M. Farzaneh, "Wind-tunnel Investigation of icing of an inclinedcylinder", Int. J. Heat. Mass. Tran., 53 (2010) 849.
[83] L. Kollar and M. Farzaneh, "Spray Characteristics of Artificial Aerosol Clouds in a Low-Speed Icing Wind Tunnel", Atomization Spray, 19 (2009) 389.
[84] L. Kollar, M. Farzaneh and A. Karev, "Modeling Droplet-Size Distribution near a NozzleOutlet in an Icing Wind Tunnel", Atomization Spray, 16 (2006) 673.
[85] S. Noormohammed, "Nanostructured Thin Films for Icephobic Applications", Ph.D.thesis, UQAC, 2009.
[86] http ://www .engineeringtoolbox .com/thermal-conductivity-d_429 .html
[87] http://asm.matweb .com/search/SpecificMaterial.asp?bassnum =MA606116
[88] http ://www .dowcorning .com/applications/search/products/details .aspx
108

[89] P. E. Khizhnyak, A. V. Chechetkin and A. P. Glybin, " Thermal conductivity of carbonblack" , J. Eng. Phys. Thermophys. 37 (1979) 1073.
[90] T. Maekawa, K. Kurosaki, T. Tanaka and S. Yamanaka, "Thermal conductivity oftitanium dioxide films grown by metal-organic chemical vapor deposition",Surf.Coat.Tecnnol. 202 (2008) 3067.
[91] M. Mogensena, N. M. Sammesb, G. A. Tompsettb,Y. Z. T. Cheng, Q. Hu, Z. Fang andK. Han, "Physical, chemical and electrochemical properties of pure and doped ceria",Solid State Ionics. 129 (2000) 63.
109
Recommended

![Nanocomposite [5]](https://img.pdfslide.us/doc/110x75/577c7ecf1a28abe054a26499/nanocomposite-5.jpg)