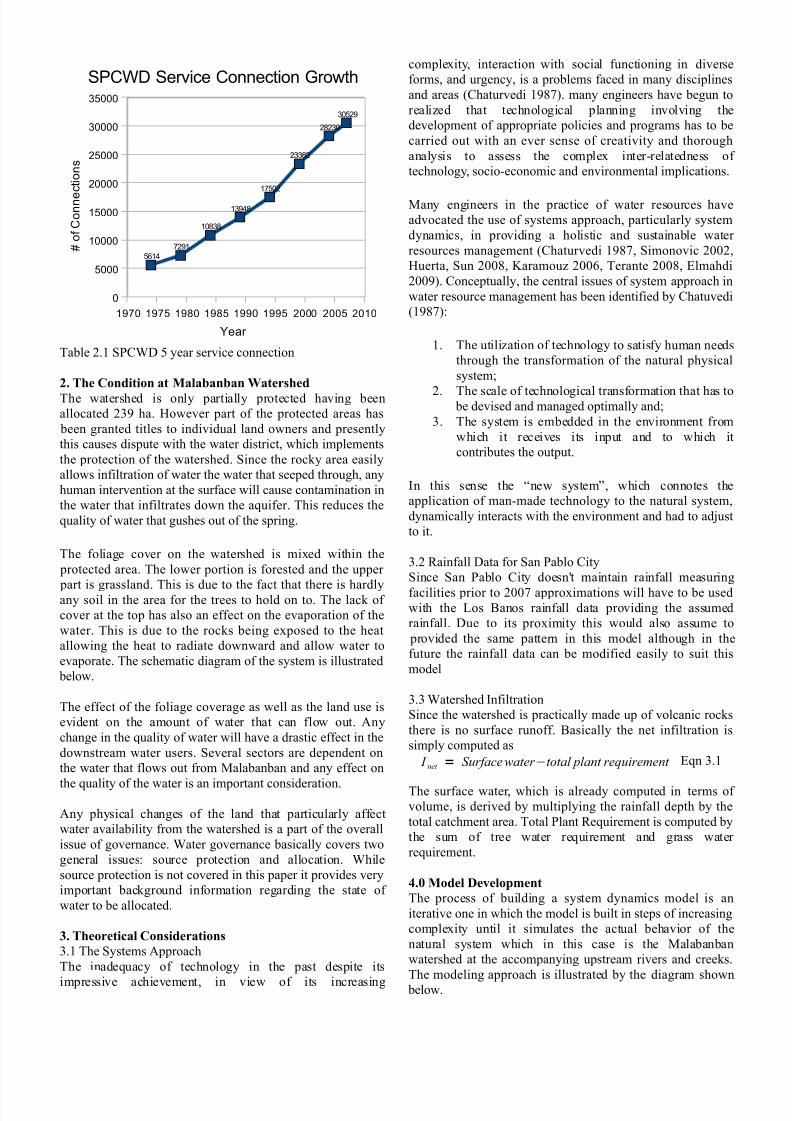
8/14/2019 Water Allocation Assessment and Optimization of Malabanban Watershed Using System Dynamic Approach
http://slidepdf.com/reader/full/water-allocation-assessment-and-optimization-of-malabanban-watershed-using 1/8
1. Background of the Study
The integrity of water sources is very vital for the survival of
cities/towns that depends on them that the protection and the
way water is allocated must be maximized in the best
possible way. It is now accepted that water is considered a
finite resource even though the natural water cycle is still in process. Let us recall that the adage “Water, water
everywhere but not a drop to drink” is so very true since the
changing whether is already causing great changes in the
water cyle such as erratic floodings and significant drought
spells. While the water cycle is now erratic and we are
powerless to reverse this we can respond by developing
effective water governance policies. This aims to optimize
water allocation and to do this we have to know how water is
presently allocated and the how the people uses water in the
first place.
San Pablo City is an old city in the province of Laguna. It is
bounded by six municipalities and one city namely Calauan,Laguna in the northwest; Nagcarlan, Laguna in the northeast;
Alaminos, Laguna in the west; Rizal, Laguna in the east;
Lipa City, Batangas in Southeast and Tiaong and Dolores,
Quezon in the south (SPC CLUP 1998). It has a population
of (insert here) and it is abundantly blessed with abundant
water resources such as the famous seven lakes and the least
known but very important Malabanban watershed.
Malabanban watershed is a reserved area at the foot of Mt.
San Cristobal along the boundary of San Pablo City and
Rizal in the province of Laguna. It is characterized by lushed
vegetation at the lower part, grassland at the middle and
relatively barren at the top.
Soil maps produced by the Bureau of Soils and Water
Management (BSWM) generally consider this area as rocky
with little or no soil, a perfect area for catching water. There
are six springs in athe area of which four are within the
territorial limits of San Pablo City. In accordance with thelaw (PD 198) San Pablo City Water District (SPCWD)
maintained and control all spring sources and the trickle
down allocation was inadvertedly set up. The trickle down
allocation of water is also allowed by law provided that in
theory each entities should be aware of each others need
during times of plenty and also the awareness of who gets the
first priority when water supply is critically low.
This study aims to analyze the dynamics of water allocation
from the Malabanban watershed. Although classified as a
city, San Pablo has a vast track of agricultural land
occupying 18208.5 hectares which is about 85.09% of the
city's area. However only about 605 hectares of land is setaside for rice or about 3.35% of the total agricultural area.
The city is currently in deficit as far as rice production is
concerned and a devasting drought in 1999 have caused
further drop in rice production. Although the irrigated area is
about 100% it is obviously insufficient to address local
requirements.
At the same time, San Pablo City is overwhelmingly
dependent on the watershed for the supply of its drinking and
domestic water. More than 80% of the city is dependent on
the watershed for the water and with its drive to supply the
entire city, water demand is on the increase.
Water Allocation Assessment and Optimisation of Malabanban Watershed Using
System Dynamics Approach
Engr. Hadji Peejay U. Aranda1 Dr. Danilo C. Terante2
1Instructor – Technological Institute of the Philippines – Quezon City2Associate Professor – De la Salle University – Manila
Abstract
Water allocation for any region is normally regulated by governing institutions and normally taken for granted during times
of water plenty. However water is considered as a finite resource and therefore a sound allocation policy must be develop in
order to effectively utilize water whether there is a shortage or not. Another factor that necessitate the efficient use of water is
the aim of the City Government to increase rice production. The use of system dynamics is very helpful because it enables the
end users to clearly determine the inter relationship of various factors that can affect water distribution from the sources
towards the end users and test proposed policy outcomes before actual implementation were made and reap the consequences.
The model started out by developing the causal loop showing the effect of land alteration, precipitation, evaporation and
infiltration on the watershed and relate it to the downstream needs particularly rice farming. The causal loop is then the basis
of the model to be written in Vensim modeling tool to develop the feedback relationship. The developed model (named
MWAM or Malabanban Water Allocation Model) is a sub component of SPCWGOM or San Pablo City Water Governance
Optimization Model. The MWAM model have confirmed that the trickle down approach in water allocation is not sustainabledue to Malabanban watershed's vulnerability to rainfall variations. Although regulated allocation policies can be of help it
also shows that water end users must make the necessary adjutment in order to maximize the available water for the people
and to utilize new farming technologies and techniques.
Keywords: Dynamic modelling; Optimisation; Economic Water Use, Agricultural management; Water management, Crop allocation.
8/14/2019 Water Allocation Assessment and Optimization of Malabanban Watershed Using System Dynamic Approach
http://slidepdf.com/reader/full/water-allocation-assessment-and-optimization-of-malabanban-watershed-using 2/8

8/14/2019 Water Allocation Assessment and Optimization of Malabanban Watershed Using System Dynamic Approach
http://slidepdf.com/reader/full/water-allocation-assessment-and-optimization-of-malabanban-watershed-using 3/8
Figure 4.1 Modeling Approach in System Dynamics
The iterative nature of modeling in system dynamics is what
makes this research a worthy endeavor. Although tedious, the
the modeler/s will ultimately develop a greater understanding
of the hydrologic process that occurs in the study area. In this
paper, an understanding of the hydrologic process was made
in the context of the desired outcome: the need to determine
improvements that can be made in water governance.
System dynamics was applied in a similar study made in
Canada by Jutla (2005). In a controlled situation in which
even the materials were astificially set up as part of mine
rehabilitation. It was proven that, is set up properly, system
dynamics model will be very useful to assess the changing
conditions and provide a tool that would easily assess the
possible consequence of disruptions in the hydrologic
systems.
Figure 4.2 Causal Loop Diagram of the Malabanban
Watershed Allocation Model
The modeling process started out by conducting field work to
assess the surface hydrologic processess that occur in the
study area. This activities involves rainfall data, spring
production data. Influence diagrams were made to illustrate
the forces at work in the system which appear to be
connected to the phenomena underlying the concerns about
the subject matter. The previous steps did not produce
enough insight to solve the problem; the group then
proceeded to the construction of a simulation model.
Equations were written, and then revised and expansion of
the model was done. STELLA software was used for the
development of the mathematical model used in this study.
Test runs of the constructed model for existing condition
were done using hypothetical data and true data. Simulation
runs were then made (Codilla et al, 2009).
Figure 4.2 The Causal Loop Diagram for the Hydrologic
Process in Malabanban Watershed
Figure 4.2 shows the part of the causal loop that reflects the
hydrology at the catchment basin. Parameters such as the
water seepage area, covered area and grasslands are
adjustable parameters in which the consequence of
environmental enforcement can be adjusted the water
seepage area is adjustable such that the minimum size of the
protected area should be 230 hectares, which is presently the
size of the protected watershed area. The maximum value is
estimated to be at around 450 hectares. This is derived bt
tracing the area of the old lava field which was found by
visual inspection to be rocky and highly porous. For a rocky
watershed the amount of infiltrating water will nearly equalthat of the initial catchment during rainy months because the
saturated rocks will not absorb water anymore the infiltration
will be based on the geologic profile of the catchment area.
8/14/2019 Water Allocation Assessment and Optimization of Malabanban Watershed Using System Dynamic Approach
http://slidepdf.com/reader/full/water-allocation-assessment-and-optimization-of-malabanban-watershed-using 4/8
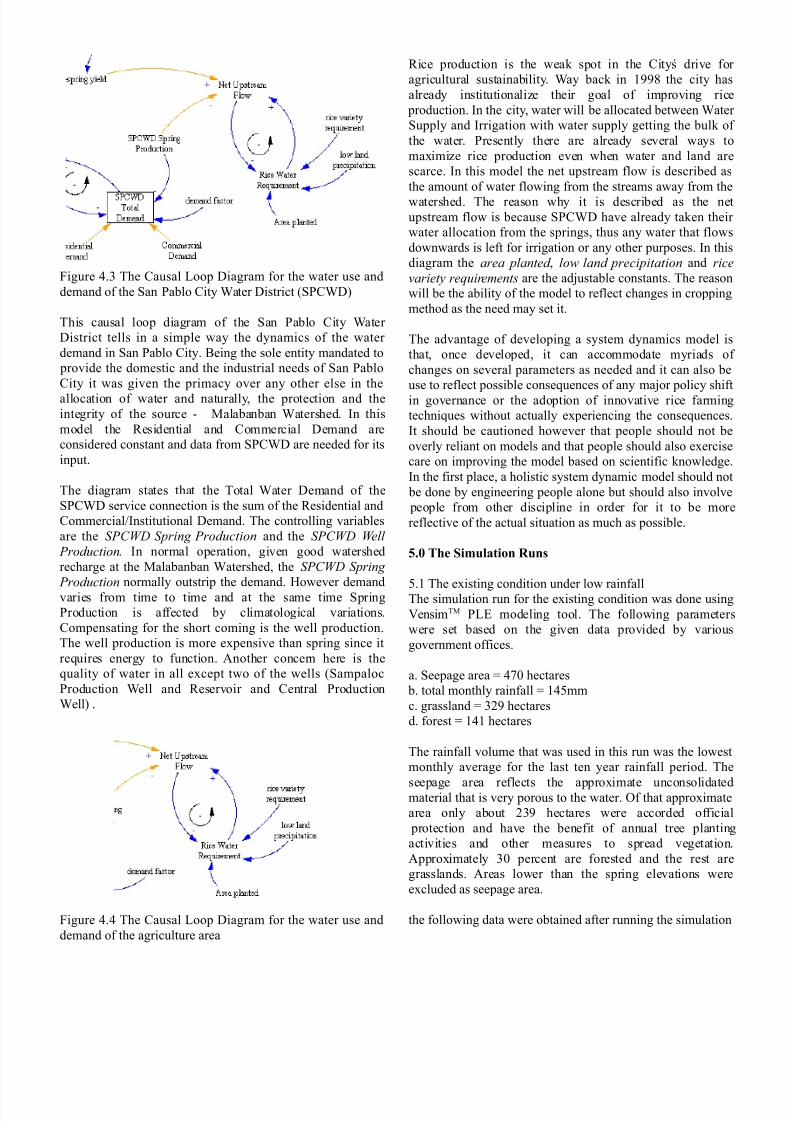
Figure 4.3 The Causal Loop Diagram for the water use and
demand of the San Pablo City Water District (SPCWD)
This causal loop diagram of the San Pablo City Water
District tells in a simple way the dynamics of the water
demand in San Pablo City. Being the sole entity mandated to
provide the domestic and the industrial needs of San Pablo
City it was given the primacy over any other else in the
allocation of water and naturally, the protection and the
integrity of the source - Malabanban Watershed. In this
model the Residential and Commercial Demand are
considered constant and data from SPCWD are needed for its
input.
The diagram states that the Total Water Demand of the
SPCWD service connection is the sum of the Residential and
Commercial/Institutional Demand. The controlling variables
are the SPCWD Spring Production and the SPCWD Well
Production. In normal operation, given good watershed
recharge at the Malabanban Watershed, the SPCWD Spring
Production normally outstrip the demand. However demand
varies from time to time and at the same time Spring
Production is affected by climatological variations.
Compensating for the short coming is the well production.
The well production is more expensive than spring since it
requires energy to function. Another concern here is the
quality of water in all except two of the wells (Sampaloc
Production Well and Reservoir and Central Production
Well) .
Figure 4.4 The Causal Loop Diagram for the water use and
demand of the agriculture area
Rice production is the weak spot in the Cityś drive for
agricultural sustainability. Way back in 1998 the city has
already institutionalize their goal of improving rice
production. In the city, water will be allocated between Water
Supply and Irrigation with water supply getting the bulk of
the water. Presently there are already several ways to
maximize rice production even when water and land are
scarce. In this model the net upstream flow is described as
the amount of water flowing from the streams away from the
watershed. The reason why it is described as the net
upstream flow is because SPCWD have already taken their
water allocation from the springs, thus any water that flows
downwards is left for irrigation or any other purposes. In this
diagram the area planted , low land precipitation and rice
variety requirements are the adjustable constants. The reason
will be the ability of the model to reflect changes in cropping
method as the need may set it.
The advantage of developing a system dynamics model is
that, once developed, it can accommodate myriads of
changes on several parameters as needed and it can also be
use to reflect possible consequences of any major policy shift
in governance or the adoption of innovative rice farming
techniques without actually experiencing the consequences.
It should be cautioned however that people should not be
overly reliant on models and that people should also exercise
care on improving the model based on scientific knowledge.
In the first place, a holistic system dynamic model should not
be done by engineering people alone but should also involve
people from other discipline in order for it to be more
reflective of the actual situation as much as possible.
5.0 The Simulation Runs
5.1 The existing condition under low rainfallThe simulation run for the existing condition was done using
VensimTM PLE modeling tool. The following parameters
were set based on the given data provided by various
government offices.
a. Seepage area = 470 hectares
b. total monthly rainfall = 145mm
c. grassland = 329 hectares
d. forest = 141 hectares
The rainfall volume that was used in this run was the lowest
monthly average for the last ten year rainfall period. The
seepage area reflects the approximate unconsolidatedmaterial that is very porous to the water. Of that approximate
area only about 239 hectares were accorded official
protection and have the benefit of annual tree planting
activities and other measures to spread vegetation.
Approximately 30 percent are forested and the rest are
grasslands. Areas lower than the spring elevations were
excluded as seepage area.
the following data were obtained after running the simulation

8/14/2019 Water Allocation Assessment and Optimization of Malabanban Watershed Using System Dynamic Approach
http://slidepdf.com/reader/full/water-allocation-assessment-and-optimization-of-malabanban-watershed-using 5/8
Figure 5.1 Net surface water infiltrating
Figure 5.2 Estimated Amount of water stored at the reservoir
aquifer
On the recharge side, the low monthly rainfall wouldnormally deliver an increase in the stored water at the
watershed. This is beneficial since it can now be said that the
watershed would be able to supply water to its stockholder.
There are several occasions in the ten year rainfall data that
there was no rainfall for a month or two. This has already
happened in 1998 (Jun and July). A run was conducted to
simulate water depletion
Figure 5.3 Estimated Water Depletion at Malabanban
watershed for June-July 1998
Even though at the end of July there was still a substantial
amount of water inside the aquifer the piezometric head was
already low such that only low amount of water will be ableto gush out of the spring. The subsequent spring yield from
the watershed was shown in the next figure below.
Figure 5.4 Spring yield for June-July 1998
This is the estimated spring yield for June-July 1998. The
flow was already critical when compared to the demand of
that period. Another thing in this situation only 4 spring
sources where being tapped at that time. While records of
spring production during that period were not around
anymore the data would still provide a good estimate as
corroborated by SPCWD staff who were already present
during that time.
Figure 5.5 SPCWD spring production June-July 1998
The decrease in production prompted Water district officials
to obtain water from the ground. Unfortunately, most of the
wells here contain iron which have to be filtered out in order
to be at par with spring water quality. Filtering water frommany of these wells added cost to overall water production
and obviously not beneficial to the water district in the long
run.
Perhaps the hidden problem that came out is the net outflow
towards the Makampongo and Calauan river have virtually
dried up. A potential issue in this water allocation setup is a
sudden need to provide trans-boundary water allocation since
at this occasion the water nearly dried up.

8/14/2019 Water Allocation Assessment and Optimization of Malabanban Watershed Using System Dynamic Approach
http://slidepdf.com/reader/full/water-allocation-assessment-and-optimization-of-malabanban-watershed-using 6/8
Figure 5.6 Net spring outflow from San Pablo City
5.2 The Existing Conditions under normal conditions
Under normal circumstances the available water underneath
the watershed will have an increase in its capacity. The
increase in piezometric head will also have an effect at the
spring yield as seen in figure 5.8
Figure 5.7 Estimated water recharge under normal rainfall
conditions
Figure 5.8 Spring Yield for one month under normal rainfall
conditions
The spring yield at normal rainfall is relatively flat. Although
the decline is basically the caused by the reduction of the Net
Available Subsurface Water basically the month to month
rainfall replenishes the aquifer thus providing adequate yield
from month to month at any given time. The effect on
SPCWD Spring Production is very significant since water
yield increases as a result of increased piezometric head and
increased spring yield.
Figure 5.9 Spring Yield for one month under normal rainfall
conditions
An increasing spring production will yield to the decline of
SPCWD Well Production, which is actually beneficial
because it reduces the expenses of the water district.
Basically the increase in profit due to reduced well operation
is beneficial because additional resources can be diverted to
other aspects of operation.
A normal rainfall condition also provides substantial
downstream flow to the Calauan and Makampongo rivers.
The net positive outflow from San Pablo will definitely
benefit downstream users even though Malabanban
watershed is only just one of their tributaries
Figure 5.10 Spring Yield for one month under normal rainfall
conditions
In the aspect of rice production, normal rainfall would
definitely reduce irrigation water demand and the effect is
shown in the graph below

8/14/2019 Water Allocation Assessment and Optimization of Malabanban Watershed Using System Dynamic Approach
http://slidepdf.com/reader/full/water-allocation-assessment-and-optimization-of-malabanban-watershed-using 7/8
Figure 5.11 Rice water requirement using common varieties
and normal rainfall conditions
This graph was made with the initial assumption of every
rice farmers use common rice varieties and water
requirement is based from data provided by San Pablo – City
Agriculture Office and the National Irrigation Administration
for estimating irrigation requirements. Consequentially, as
irrigation water decline net stream outflow from San Pabloalso increases downstream.
5.3 Changes in net streamflow when aerobic rice is adopted
Aerobic rice is now being promoted as a new variety of rice
to be adopted by farmers as a way to counter extreme
weather events brought by climate change. Basically the
water requirement is only about a third of what we farmers
use today. A run using low rainfall event was simulated with
data shown below.
Figure 5.12 Rice water requirement using common varieties
and normal rainfall conditions
Since Aerobic rice only requires soil to be moist, not
submerged, less water is diverted from the streams and
during rainy seasons no surface irrigation is required at all.
Figure 5.13 Net upstream flow without irrigation water
diversion
6.0 Conclusions and Recommendations
Conclusion
This study shows that system dynamics is very effective in
modeling hydrologic process. Although there is difficulty in
setting it up it would now be easier to improve it. In the case
of Malabanban Watershed Allocation Model it was shown
that rainfall is the major parameter that must be adequate to
get the system working in order. A drop in rainfall over time
would provide disastrous consequence particularly in the
aspect of water supply. While well production can mitigate
spring water supply it would obviously increase user cost.
The MWAM model have confirmed that the trickle down
approach in water allocation is not sustainable due to
Malabanban watershed's vulnerability to rainfall variations.
Although regulated allocation policies can be of help it also
shows that water end users must make the necessary
adjutment in order to maximize the available water for the
people and to utilize new farming technologies and
techniques.
Recommendations
In order to improve this model the following actions are
recommended:
1. Detailed Lithographic survey of the Malabanban
Watershed. Geologic survey is important in order to
fully determine the water bearing strata which
would improve accuracy in determining water
availability and further trace the recharge area for
acquisition and protection
2. Development of the San Pablo City Water District
Distribution Model. This model is required to
determine the non-revenue water that the water
district is experiencing right now. This will port
water production to water distribution in order to
integrate it in the overall water allocation picture.
3. This study also recommend the expansion of the
protected areas of Malabanban Watershed. Even
though the place is inaccessible for urban
development thus sparing it from land use
conversion even low density human occupation
would contaminate water infiltrating downward.

8/14/2019 Water Allocation Assessment and Optimization of Malabanban Watershed Using System Dynamic Approach
http://slidepdf.com/reader/full/water-allocation-assessment-and-optimization-of-malabanban-watershed-using 8/8
ACKNOWLEDGMENT
The authors would like to thank the following:
San Pablo City Water District, San Pablo City Government,
Our colleagues from TIP-QC and DLSU-Manila, Friends
from PICE-LNM and PICE Tarlac and PICE national for this
opportunity
BIBLIOGRAPHY
Codilla C., De Guzman L., Yap, R and Terante, D. (2009)
SYSTEM DYNAMIC ANALYSIS FOR SUSTAINABLE
URBAN DRAINAGE SYSTEM ; PICE Midyear
Convention Proceedings
Dagsa, J., Caraga C., Esparas J., Ramos, F., Salazar, J.
Salmorin, A., Samus, M., Tan, T. and Aranda, H (2008)
POTENTIAL OF RAINFALL HARVESTING IN SAN
PABLO CITY; Thesis: Civil and Environmental-Sanitary
Engineering Technological Institute of the Philippines -CC
Terante, D. (2006)
A SYSTEMS THINKING FOR WATER RESOURCE
PLANNING, MANAGEMENT AND OPERATIONS;
PICE 32nd National Convention Proceedings
Chih C; Chao C; Liang C; Ming S (2007)
SYSTEM DYNAMIC MODELING OF THE
CONJUCTIVE-USE OF SURFACE AND SUBSURFACE
WATER; World Environmental and Water Resources
Congress 2007
Saysel, A (2008)
SYSTEM DYNAMICS: SYSTEMIC FEEDBACK
MODELING FOR WATER RESOURCES
MANAGEMENT ; International Congress on River BasinManagement pp 37-47
Skartveit, H., Goodnow, K., Viste, M (2003)
VISUALIZED SYSTEM DYNAMICS MODELS AS
INFORMATION MANAGEMENT TOOLS
InSITE - “Where Parallels Intersect” Infrorming Science
pp 1114-1129
Aranda, H., Sales T., (2008)
RECONNAISSANCE STUDY OF THE SURFACE
HYDROLOGY IN SAN PABLO CITY; Faculty Research
Technological Institute of the Philippines - QC
Jutla A (2005)
HYDROLOGIC MODELING OF RECONSTRUCTED
WATERSHEDS USING A SYSTEM DYNAMICS
APPROACH ; Thesis: Department of Civil and
Geological Engineering University of Saskatchewan pp 1-
187
Simonovic S (2002)
ASSESSMENT OF WATER RESOURCES THROUGH
SYSTEM DYNAMICS SIMULATION: FROM GLOBAL
ISSUES TO REGIONAL SOLUTIONS; Proceedings of
the 36th Hawaii International Conference on System
Sciences
Lakshminarayanarao Bachu (2008)
A COMPARATIVE ANALYSIS OF THE
HYDROLOGICAL PERFORMANCE OF
RECONSTRUCTED AND NATURAL WATERSHED;
Thesis: Department of Civil and Geological Engineering
University of Saskatchewan
Tangirala, A., Teegavarapu, R. and Ormsbee, L. (2003)
MODELING ADAPTIVE WATER QUALITY
MANAGEMENT STRATEGIES USING SYSTEM
DYNAMICS SIMULATION; Environmental Informatics
Archives, Volume 1 (2003), 245-253
Elmahdi,A., Malano, H., Etchells T and Khan , S. (_)
SYSTEM DYNAMICS OPTIMISATION APPROACH
TO IRRIGATION DEMAND MANAGEMENT;
Recommended