WATCHING BIOLOGICAL NANOMOTORS AT WORK:
INSIGHTS FROM SINGLE-MOLECULE STUDIES
A Dissertation
Presented to
The Faculty of the Department of Physics and Astronomy
___________________________
In Partial Fulfillment
Of the Requirements for the Degree Of
Doctor of Philosophy
_____________________________________
by
Nagaraju Chada
Dr. Gavin King, Dissertation Supervisor
December 2017

© Copyright by Nagaraju Chada, 2017
All Rights Reserved

The undersigned, appointed by the Dean of the Graduate School, have examined the
dissertation entitled:
Watching Biological Nanomotors at Work: Insights from Single-
Molecule Studies
Presented by Nagaraju Chada,
A candidate for the degree of Doctor of Philosophy and hereby certify that, in their
opinion, it is worthy of acceptance.
__________________________________________
Dr. Gavin King
__________________________________________
Dr. Linda Randall
__________________________________________
Dr. Ioan Kosztin
__________________________________________
Dr. Shi-Jie Chen

To my Family
Mallavva and Laxmi Rajam Chada
Narmadha and Nagarjuna Chada
Hymavathi Mamindla

ii
ACKNOWLEDGEMENTS
Although this dissertation is in my name, I never could have completed this
without the help from tremendous number of people. I would like to express my sincere
gratitude to those whose guidance and support has allowed me to shape my graduate
school experience into everything I wanted it to be. First and Foremost, I would like to
thank my advisor Dr. Gavin M. King. This work would have been impossible without
him. He is an extraordinary instrumentalist and an amazing mentor. I had the opportunity
of being one of his early graduate students and got his utmost attention. I appreciate the
time he spent teaching me the details of Atomic Force Microscope and science in general.
He has created a laboratory atmosphere which fosters curiosity, friendship, and the
highest level of scientific enquiry. He has a great gift of knowing when to let me struggle
and when to give me a gentle ‘nudge’ in the right direction. He always encouraged me to
speak independently about my work at group meetings and conferences, which gave me a
chance to see my work from a fresh perspective and to identify areas that needed more
attention. He gave me lot of room to explore on multiple different projects and to make
mistakes, which ultimately helped me to become an independent researcher. I could not
have imagined having a better advisor and mentor for my Ph.D. study.
I would also like to thank my collaborator, Dr. Linda L. Randall, whose tireless
efforts, immense knowledge and biochemical prowess allowed us to conduct single-
molecule experiments on a system that most would have considered too complex to
pursue. She has been a tremendous inspiring scientific figure to me. Her advice on both
research as well as on my career have been invaluable and allowed me to grow as a
research scientist. Conversations and research presentations at her lab helped me deepen
iii
my understanding of my research and think about it in new ways. She immensely helped
me to build my knowledge and confidence.
Besides Dr. King and Dr. Randall, I would also like to thank the rest of my thesis
committee: Dr. Ioan Kosztin and Dr. Shi-Jie Chen for their insightful comments and
encouragement, but also for the hard questions in my comprehensive exam, which incited
me to widen my research from various perspectives. I also want to thank them for letting
my defense be an enjoyable moment, and for their brilliant comments and suggestions
with science and scientific career in general.
I would like to express my deepest gratitude to my collaborators, Dr. Carlos
Bustamante, Dr. Steve Presse and their group members for their immense support and
guidance with catalase project. They were always willing to help and give their best
suggestions. Some of the cutting-edge and somewhat risky experiments would not have
been possible without their guidance.
The members of the Precision Single Molecule Biophysics Lab have contributed
immensely to my personal and professional time at Mizzou. The group has been a source
of good advice and guidance as well as fun time. I am grateful to have had an opportunity
to grow in this supportive, encouraging environment and learn from extremely talented
individuals and wonderful friends around me: Brendan Marsh, Sonja Glaser, Nathan
Frey, Dr. Tina Rezaie Matin, Dr. Raghavendar Reddy Sanganna Gari, Dr. Krishna P.
Sigdel, Emily Armbruster, Kanokporn Chattrakun and Anna Pittman. They offered
crucial companionship and moral support during my doctoral project, which could often
feel like a solitary endeavor. When I experienced setbacks, their successes and
excitements helped keep me motivated. It has been a joy to watch them mature as able

iv
scientists along the way. I am especially grateful to Dr. Krishna P. Sigdel for introducing
me to the home built Ultra-Stable Atomic Force Microscope. I enjoyed close
collaboration with him in my early projects. I would like to thank my bestie Dr. Tina
Rezaie Matin who was by my side in all critical and stressful moments of my graduate
life. I would also like to thank her for introducing me to Single Molecule Force
Spectroscopy and for her endless immeasurable support in every day lab matters. I would
like to thank my best friend Dr. Raghavendar Reddy Sanganna Gari for his valuable
guidance, discussions and long lasting debates on various endless topics. I would also
like to thank him for introducing me to AFM imaging and Sec translocation system.
Brendan Marsh has been the ‘Programming King’ and played a key role in developing
several automated algorithms with minimal user input for analysis of AFM data. He
always knew the right mathematical and statistical approaches for every kind of data
analysis. I thank him for drastically minimizing the time I spent analyzing my data
manually. This enabled me to focus most of my time to design and conduct new
experiments.
In addition, I would also like to thank Dr. Gerald Hazelbauer for his valuable
suggestions and insightful comments on my projects. I would like to thank all the current
and former members of membrane group; Dr. Chunfeng Mao, Priya Bariya, Dr. Bahar
Tuba Findik, Yuying Suo, Mary Belle Streit and Angela Lilly for their support.
I would like to acknowledge Physics department for supporting me as a Teaching
Assistant. Discussions with my students from various backgrounds improved my ability
communicate my research to general audience, to generate testable hypotheses, to design
valid experiments and contributed substantially to the improvement of my research skills.

v
Describing my research in simplified manner to my students also helped me develop my
own communication and storytelling skills. I would also like to thank the faculty
members who taught me the graduate courses and administrative staff for their endless
support with the paper work.
I gratefully acknowledge the funding sources that contributed to my Ph.D work.
Funding from National Science Foundation (CAREER Award #:1054832, Gavin M.
King), Burroughs Wellcome Fund (Career Award at the Scientific Interface, Gavin M.
King) and an endowment from Hugo Wurdack Trust made this work possible
Lastly, I would like to express my gratitude to those who enriched my life outside
of graduate school. I am grateful to my parents Laxmi Rajam and Mallavva Chada, my
brother Nagarjuna Chada and my love Hymavathi Mamindla for their endless support and
love throughout my life. For every milestone that I have completed in my career, they are
always more excited than I am. I would like to acknowledge my best friends
Raghavendar Reddy Sanganna Gari, Madhavi Latha Neelapu and Tina Rezaie Matin for
introducing me to several new restaurants and other amazing outings. We have laughed a
lot and had lot of fun during these past seven years that helped me keep my sanity during
my graduate career. I don’t know if I would have survived graduate school without their
emotional support.
My time at Mizzou was made enjoyable in large part due to many friends
that became a part of my life. I am grateful for time spent with friends, for our
memorable float trips into the Ozark lakes, frequent visits to Stephens, Bethel lakes and
trekking, cycling into Columbia’s beautiful trails.
vi
TABLE OF CONTENTS
List of Figures……………………………………...…………… …………………….....ix
List of Tables……………………………………………………………….…………...xiii
Abstract………………………………………………………………………….………xiv
1. Introduction ............................................................................................................... 1
1.1. Hybrid approaches................................................................................................ 3
1.2. Combining AFM with Advanced Optical Techniques ......................................... 5
1.3. Biological molecules of interest ........................................................................... 6
1.3.1. Sec-translocase: protein translocation nano-machinery of Escherichia coli 6
1.3.2. Bacteriorhodopsin: light driven proton pump of Halobacterium salinarum . 8
1.3.3. Enzyme catalase ............................................................................................ 9
1.4. Challenges .......................................................................................................... 12
1.4.1. Glass as a substrate for AFM ...................................................................... 12
1.4.2. Hovering over single molecular complex in near native conditions ........... 13
1.4.3. Translocation mechanism of Sec Translocon machinery ........................... 14
1.4.4. Catalytic activity of enzymes ...................................................................... 15
1.5. Approach ............................................................................................................ 15
1.5.1. Atomic Force Microscopy .......................................................................... 15
1.5.2. Ultra-Stable Atomic Force Microscopy ...................................................... 20
2. Glass is a Viable Substrate for Precision Force Microscopy of Membrane
Proteins ............................................................................................................................ 22
2.1. Summary ............................................................................................................ 22
2.2. Introduction ........................................................................................................ 22

vii
2.3. Results and Discussion ....................................................................................... 25
2.3.1. Glass treatment and reduction in surface roughness ................................... 25
2.3.2. Bacteriorhodopsin on glass ......................................................................... 28
2.3.3. Visualization of SecYEG translocons in membrane ................................... 32
2.3.4. Direct visualization of SecYEG-SecA interactions in real time ................. 33
2.4. Conclusions ........................................................................................................ 34
3. Real time single molecule visualization of nucleotide dependent conformational
changes in SecA-ATP hydrolysis. .................................................................................. 36
3.1. Summary ............................................................................................................ 36
3.2. Introduction ........................................................................................................ 37
3.3. Results and Discussion ....................................................................................... 40
3.3.1. Single molecule studies of the wild type SecA ATPase ............................. 40
3.3.2. Single molecule studies of SecAΔPBD mutant .......................................... 43
3.3.3. Single molecule studies in various ATP conditions ................................... 45
3.3.4. Single molecule studies in the presence of different ATP analogues ......... 51
3.3.5. SecA ATPase inter-domain conformational dynamics at single molecule
level…… ................................................................................................................... 58
4. Catalase Enzyme Dynamics during Catalysis ...................................................... 63
4.1. Introduction ........................................................................................................ 63
4.2. Results and discussion ........................................................................................ 65
4.2.1. Single molecule studies of KatG-WT ......................................................... 65
4.2.2. KatG in presence of hydrogen peroxide ..................................................... 68
4.2.3. Single molecule studies of KatG mutant .................................................... 69
viii
4.2.4. Visualization of KatG mutant oligomeric state change at the single
molecule level ........................................................................................................... 73
4.2.5. Oligomeric state recovery in KatG mutants................................................ 73
4.2.6. Single molecule KatG mutant studies in various H2O2 conditions ............. 75
5. Conclusions and Future Directions ....................................................................... 78
5.1. Protein translocation ........................................................................................... 78
5.1.1. Translocation assay of membrane bound SecYEG-SecA complex on glass
supports. .................................................................................................................... 79
5.2. BR pulling .......................................................................................................... 81
5.3. SecA conformational dynamics ......................................................................... 82
5.4. Chemoacoustic effect ......................................................................................... 83
Appendix………………………………...……………………………………………....85
References……………………………………………………………………………….93
VITA…………………………………………………………………………………...108

ix
LIST OF FIGURES
Figure 1.1: Coupling different complimentary single-molecule techniques ..................... 3
Figure 1.2: Schematic illustration of Posttranslational translocation. ............................... 8
Figure 1.3: High-resolution images of purple membrane .................................................. 9
Figure 1.4: Crystal structure of Mycobacterium tuberculosis catalase-peroxidase. ........ 12
Figure 1.5: AFM images of purple membrane adsorbed to mica and cationized ferritin
bound to purple membrane on silanized glass. ................................................................. 13
Figure 1.6: Schematic illustration of possible ways to study posttranslational
translocation and the interaction of leader peptide with Sec-translocon and its vicinity
using US-AFM. ................................................................................................................. 15
Figure 1.7: Schematic of an Atomic force microscope. .................................................. 18
Figure 1.8: A schematic plot showing change in tip-sample interaction. ........................ 19
Figure 1.9: An artist’s rendition of an optically stabilized Ultra Stable Atomic Force
Microscope. ....................................................................................................................... 21
Figure 2.1: Glass preparation and reduction of roughness. ............................................. 26
Figure 2.2: Glass treatment comparison. ......................................................................... 26
Figure 2.3: Direct visualization of the reduction of surface roughness via lipid deposition
on glass.............................................................................................................................. 28
Figure 2.4: Molecular resolution imaging of bacteriorhodopsin on glass and comparison
with mica.. ......................................................................................................................... 30
Figure 2.5: Bacteriorhodopsin conformation and conformational flexibility on glass and
mica ................................................................................................................................... 31
Figure 2.6: Visualization of SecYEG translocons in membrane. .................................... 33

x
Figure 2.7: Direct observation SecA association with SecYEG.. .................................... 34
Figure 3.1: Domains of SecA. ......................................................................................... 38
Figure 3.2: Conformational states of SecA ...................................................................... 39
Figure 3.3: AFM topography images of SecA-WT on mica. .......................................... 41
Figure 3.4: ATP exposure changes the AFM-measured heights of SecA. ...................... 43
Figure 3.5: AFM topography images of SecAΔPBD mutant on mica. ........................... 44
Figure 3.6: PBD mutation affects the height distributions.. ............................................ 44
Figure 3.7: SecA-WT areal foot print increases when exposed to ATP.. ........................ 47
Figure 3.8: The majority of the peaks of the SecAΔPBD areal foot print distribution
remain the same when exposed to ATP.. .......................................................................... 47
Figure 3.9: SecA-WT maximum height distributions shift when exposed to ATP. ........ 49
Figure 3.10: SecAΔPBD mutant maximum height distributions show lower FWHM as
compared to SecA-WT when exposed to ATP.. ............................................................... 50
Figure 3.11: Comparison of ATP-induced shifts in the FWHM for WT and mutant
SecA.. ................................................................................................................................ 50
Figure 3.12: SecA-WT areal foot print when exposed to different ATP analogues. ....... 52
Figure 3.13: SecAΔPBD mutant areal foot print when exposed to different ATP
analogues........................................................................................................................... 53
Figure 3.14: SecA-WT maximum height distributions when exposed to different ATP
analogues........................................................................................................................... 56
Figure 3.15: SecAΔPBD mutant maximum height distributions when exposed to
different ATP analogues.. ................................................................................................. 56
Figure 3.16: ADP binding allosterically regulates the PBD domain ............................... 57

xi
Figure 3.17: Maximum height distributions of SecA-WT and mutant in presence of ATP
and ADP-AlF3 ................................................................................................................... 57
Figure 3.18: SecA ATPase scanned in two dimensions and one dimension ................... 59
Figure 3.19: Direct visualization of SecA-ATPase domain movements by AFM. ......... 60
Figure 3.20: Reversible conformational dynamics of an individual SecA-WT molecule.
........................................................................................................................................... 61
Figure 4.1: Representative AFM image of Wild type Catalase (KatG WT) from
Mycobacterium tuberculosis on mica support in aqueous buffer solution. ...................... 66
Figure 4.2: Representative AFM image of mutated Catalase (KatG mutant
C171A/C541A) from Mycobacterium tuberculosis on mica support in aqueous buffer
solution. ............................................................................................................................. 66
Figure 4.3: Height histograms showing maximum heights of KatG WT features and
KatG mutant ...................................................................................................................... 67
Figure 4.4: Histograms showing volumes of KatG WT features and KatG C171A/C541A
mutant ............................................................................................................................... 67
Figure 4.5: Representative AFM image of Wild type Catalase (KatG WT) from
Mycobacterium tuberculosis on mica support in aqueous buffer solution, aqueous buffer
solution containing ~10 mM H2O2 to activate the enzymes and aqueous buffer solution
containing ~10 mM KI for quenching. ............................................................................. 68
Figure 4.6: Height histograms of Wild type Catalase (KatG WT) from Mycobacterium
tuberculosis on mica support in aqueous buffer solution, aqueous buffer solution
containing ~10 mM H2O2 to activate the enzymes and aqueous buffer solution containing
~10 mM KI for quenching. ............................................................................................... 69

xii
Figure 4.7: Height histograms of KatG mutant 2 on mica before and after exposing to
H2O2. ................................................................................................................................. 70
Figure 4.8: Height histograms of KatG mutant 2 that was exposed to ~100mM H2O2 in
solution and imaged in absence and presence of ~30mM H2O2 ....................................... 71
Figure 4.9: Height histograms of KatG mutant on mica before and after exposing to
H2O2.. ................................................................................................................................ 71
Figure 4.10: Volume histograms of KatG mutant on mica from ~1 nm bands from figure
9, before and after exposing to H2O2.. .............................................................................. 72
Figure 4.11: Tracking KatG mutant dynamics for over ~510 s reveals KatG mutant 2
disassociation in presence of ~30 mM H2O2.. .................................................................. 73
Figure 4.12: Height histograms of KatG mutant 2 that was exposed to ~100mM H2O2 in
solution and imaged in absence of H2O2 after ~15 min delay and ~4hr delay. ................ 74
Figure 4.13: Height histograms of KatG mutant 2 that was exposed to ~100mM H2O2 in
solution and imaged in absence of H2O2 after ~15 min delay and ~4hr delay . ............... 75
Figure 4.14: Height vs Volume distributions of KatG mutant 2 in different H2O2
conditions .......................................................................................................................... 77
Figure 5.1: Translocation assay of radio-labeled precursor. ............................................ 80
Figure 5.2: Schematic illustrating protein translocation study. ....................................... 81
Figure 5.3: Artistic illustration of protein unfolding experiment using AFM. ................ 82
Figure 5.4: Illustration showing a hovering tip to study conformational dynamics of
SecA. ................................................................................................................................. 83
Figure 5.5: Illustration showing hovering of AFM tip to study the putative waves which
have been predicted to occur during enzyme catalysis. .................................................... 83
xiii
LIST OF TABLES
Table 1.1: Comparison of commonly used single-molecule force spectroscopy techniques
............................................................................................................................................. 5
Table 1.2: Rate enhancement of few enzymes ................................................................. 10
Table 3.1: Statistics (mean areal footprint ± standard error of the mean) of the SecA-WT
and mutant areal footprint distributions in different ATP conditions. .............................. 48
Table 3.2: FWHM of the SecA-WT and mutant maximum height distributions in
different ATP conditions................................................................................................... 51
Table 3.3: Statistics (mean height ± standard error of the mean) of the SecA-WT and
mutant maximum height distributions in different ATP conditions. ................................ 51
Table 3.4: Statistics (mean areal footprint ± standard error of the mean) of the SecA-WT
and mutant areal footprint distributions with different ATP analogues. .......................... 54
Table 3.5: FWHM of the SecA-WT and mutant maximum height distributions exposed
to different nucleotides. .................................................................................................... 58
Table 3.6: Statistics (mean of the height distribution ± standard error of the mean) of the
SecA-WT and mutant maximum height distributions exposed to different nucleotides. . 58

xiv
ABSTRACT
Part 1: High resolution (≈1 nm lateral resolution) biological AFM imaging has
been carried out almost exclusively using freshly cleaved mica as a specimen supporting
surface, but mica suffers from a fundamental limitation that has hindered AFM’s broader
integration with many modern optical methods. Mica exhibits biaxial birefringence;
indeed, this naturally occurring material is used commercially for constructing optical
wave plates. In general, propagation through birefringent material alters the polarization
state and bifurcates the propagation direction of light in a manner which varies with
thickness. This makes it challenging to incorporate freshly cleaved mica substrates with
modern optical methods, many of which employ highly focused and polarized laser
beams passing through then specimen plane. Using bacteriorhodopsin from
Halobacterium salinarum and the Sec-translocon from Escherichia coli, we demonstrate
that faithful images of 2D crystalline and non-crystalline membrane proteins in lipid
bilayers can be obtained on common microscope cover glass following a straight-forward
cleaning procedure. Direct comparison between data obtained on glass and on mica show
no significant differences in AFM image fidelity. Repeated association and dissociation
of SecA with SecYEG indicated that the proteins remain competent for biological
processes on glass substrates for long periods of time. This work opens the door for
combining high resolution biological AFM with powerful optical methods that require
optically isotropic substrates such as ultra-stable and direct 3D AFM. In turn, this
capability should enable long timescale conformational dynamics measurements of
membrane proteins in near-native conditions.
xv
Part 2: In the second part of this work we studied SecA-ATP hydrolysis and
catalase enzyme dynamics. Both of these protein macromolecules were observed to be
highly dynamic during catalytic turnover. Single molecule studies of catalase indicated
that the enzyme undergoes oligomeric state changes when exposed to H2O2.
Conformational dynamics of the SecA-ATPase was visualized at the single molecule
level and the protein macromolecule flickers between a compact and expanded state in
the presence of ATP, indicating reversible conformational changes. Future studies in the
lab will shed more light onto these biological processes.

1
Chapter 1
1. Introduction
Theoretical models describing observables arising from ensembles of molecules
were established long before the first single molecule techniques came into existence.
Hence, historically the development of laws in physical chemistry have employed the gas
constant R which equals Avogadro’s number times Boltzmann’s constant kB. This is why
RT, energy per mole, has traditionally been expressed in units of kilojoules and
kilocalories. In recent decades, this is no longer the case as revolutionary single molecule
techniques carried out both in vivo and in vitro have been developed providing ways to
observe biological processes which were once unattainable. Such measurements can
reveal hidden subpopulations, heterogeneities, intermediates and individual molecular
trajectories. In the past few decades, single-molecule techniques have become accepted
and widespread. In several disciplines of science it has become natural to express thermal
energy kBT in terms of 𝑝𝑁 ∗ 𝑛𝑚, instead of energy per mole.
Past decades have seen a great advance in single molecule methods. Such
approaches open new avenues of investigation that were not possible using traditional
techniques which measure average properties of molecular populations. This has opened
doors to study and analyze biological systems at the single molecule level yielding new
and important insights.
As an example, let us consider molecular motors. Although, traditional biological
assays that studied motor movement support constant-velocity movements, it has been
revealed by single molecule studies that many of them take discrete steps1-4
. 1986 was a

2
momentous year for the physics community. This year, nearly three decades, ago saw the
first demonstration of two significant single molecule techniques, namely optical
tweezers, which has demonstrated the discrete steps of molecular motors, and atomic
force microscopy (AFM) that produced topographic images at atomic resolution5,6
. These
two techniques developed by physicists, form a major backbone of current research in
single molecule techniques for studying biological systems.
Atomic Force Microscopes with well-established protocols to study biological
molecules are now commercially available. Standard protocols for single molecule
studies using optical tweezers have also been established but for precise measurements
they are usually still custom-built. Fluorescence techniques that are more familiar to
biologists are now capable of measuring nanometer-scale distances and localizing
individual biological molecules1,7,8
. Super resolution imaging methods paved a new way
to visualize cell function in real time at single molecule level and routinely break the
Abbe diffraction limit imposed by the wavelength of light in traditional optical
microscopy.
The past decade has seen an enhancement in both lateral and time resolution for a
variety of single molecule methods. Single-molecule fluorescence resonance energy
transfer (smFRET) can attain resolution of as small as 3 – 5 Å with as little as 100
photons. High-speed atomic force microscopy has been used to unfold single protein
molecule at an astonishing speed of millimeter per second which can directly compare to
all-atom molecular dynamics simulations leading to an impressive agreement between
molecular dynamics simulations and single molecule experiments9.

3
1.1. Hybrid approaches
‘Convergence’ is a new mantra in the single molecule biophysics community.
Single molecule methods took a big leap ahead in the past ten years, pushing the
envelope in precision and complexity to maximize the information content and allow
direct access into living systems. A number of recent studies have described hybrid single
molecule techniques (Fig 1.1)10
. Bringing two complimentary single molecule techniques
to bear on single macromolecular complex is clearly going to yield important insights in
the near future.
Figure 1.1: Coupling two different complementary single-molecule techniques enables
new capabilities that cannot be accessed using individual methods alone10
.

4
Recently the Bustamante group developed a rotor-bead assay in which the
associated length of DNA is directly visualized at the same time as the rotation of a
fluorescent bead allowing them precisely determine the rotational pitch of DNA as it
being inserted into a viral capsid by a packaging motor11
. Their experiments also revealed
fine details of stepping by viral DNA packaging machine. Del Rico et al demonstrated a
different type of hybrid instrument by combining magnetic tweezers with single-molecule
fluorescence detection12
. They demonstrated that a cryptic binding site for vinculin
protein can be exposed by applying physiologically relevant forces to talin protein, which
bridges the cell membrane to the underlying cytoskeleton.
Although single molecule techniques continue expanding their scope with new
techniques being invented, the most commonly used techniques that have received
attention are optical tweezers, magnetic tweezers and atomic force microscopy (Table
1.1)13
.
5
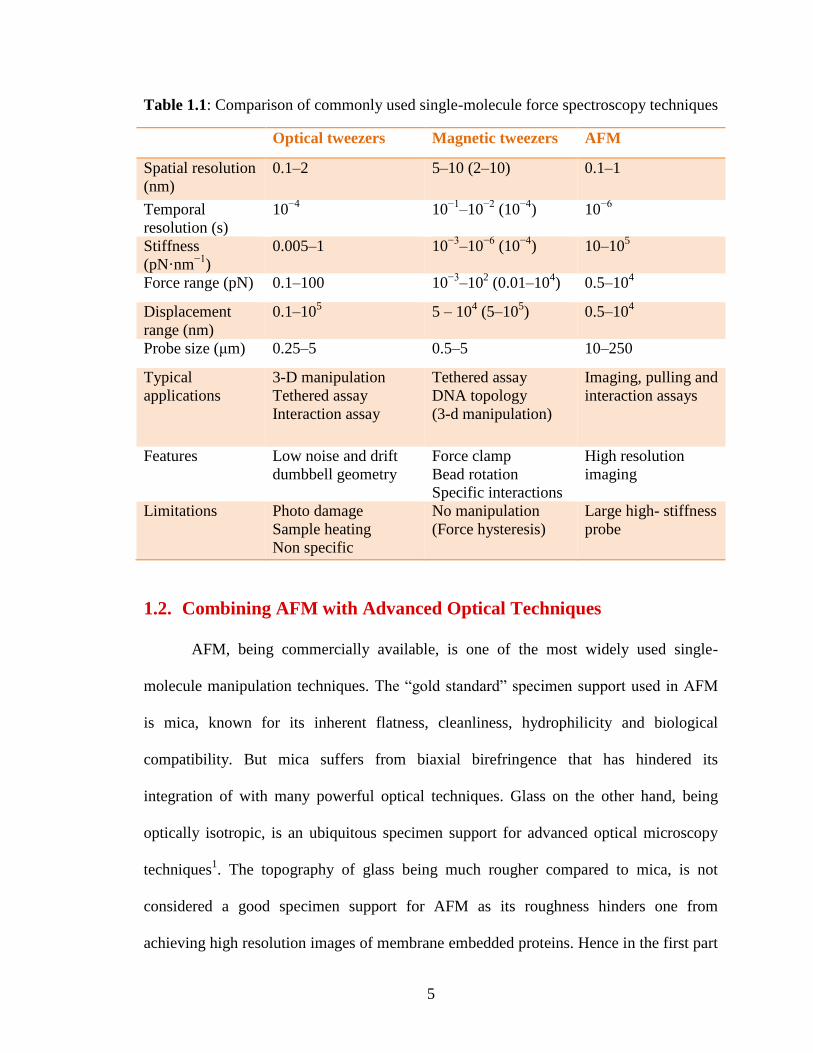
Table 1.1: Comparison of commonly used single-molecule force spectroscopy techniques
Optical tweezers Magnetic tweezers AFM
Spatial resolution
(nm)
0.1–2 5–10 (2–10) 0.1–1
Temporal
resolution (s)
10−4
10−1
–10−2
(10−4
) 10−6
Stiffness
(pN·nm−1
)
0.005–1 10−3
–10−6
(10−4
) 10–105
Force range (pN) 0.1–100 10−3
–102 (0.01–10
4) 0.5–10
4
Displacement
range (nm)
0.1–105 5 – 10
4 (5–10
5) 0.5–10
4
Probe size (μm) 0.25–5 0.5–5 10–250
Typical
applications
3-D manipulation
Tethered assay
Interaction assay
Tethered assay
DNA topology
(3-d manipulation)
Imaging, pulling and
interaction assays
Features Low noise and drift
dumbbell geometry
Force clamp
Bead rotation
Specific interactions
High resolution
imaging
Limitations Photo damage
Sample heating
Non specific
No manipulation
(Force hysteresis)
Large high- stiffness
probe
1.2. Combining AFM with Advanced Optical Techniques
AFM, being commercially available, is one of the most widely used single-
molecule manipulation techniques. The “gold standard” specimen support used in AFM
is mica, known for its inherent flatness, cleanliness, hydrophilicity and biological
compatibility. But mica suffers from biaxial birefringence that has hindered its
integration of with many powerful optical techniques. Glass on the other hand, being
optically isotropic, is an ubiquitous specimen support for advanced optical microscopy
techniques1. The topography of glass being much rougher compared to mica, is not
considered a good specimen support for AFM as its roughness hinders one from
achieving high resolution images of membrane embedded proteins. Hence in the first part

6
of the work described here we sought to develop protocols to optimize glass as specimen
supporting substrate for atomic force microscopy which would enable us to integrate
optical stabilization methods into AFM to gain new insights into processes involving
biological macromolecules at work.
1.3. Biological molecules of interest
1.3.1. Sec-translocase: protein translocation nano-machinery of Escherichia coli
In cells from all three domains of life, protein trafficking across membranes is a
ubiquitous and crucial phenomenon14
. More than one-third of all proteins synthesized
function in a membrane or outside of the cytoplasm. Hence large numbers of proteins
have to translocate into or through at least one lipid membrane to reach their final
destination. But lipid membranes are hydrophobic barriers. They are intrinsically
impermeable to ions and polar solutes. Then, the question arises: how are proteins, which
are synthesized in the cytosol, translocated to their final destinations across these
hydrophobic barriers?
Millions of years of evolution have produced a remarkable array of mechanisms
to translocate proteins across and integrate into hydrophobic cell membranes after their
synthesis in the cytosol. Sixteen such systems have been discovered in bacteria alone15,16
.
Of these sixteen discovered mechanisms, the Sec pathway is ubiquitous in all three
domains of life.
The translocon SecYEG is a dynamic macromolecule embedded in the membrane
that recognizes exported proteins at the membrane and catalyses their export. The
functional core of the Sec translocon consists of a protein conducting channel that spans
across the membrane. This complex is built of SecY, SecE and SecG polypeptides.

7
Several crystal structures of the protein conducting channel SecYEG at various
resolutions, of both eukaryotic and prokaryotic origin and bacterial SecA motor, are now
available17-31
.
Protein export through the Sec pathway is a multi-stage event that occurs mostly
post-translationally. An overview of posttranslational protein translocation through the
Sec pathway is illustrated in Figure 1.2. Nascent pre-proteins are synthesized at the
ribosome in the cytosol. These protein chains are recognized directly by piloting factors
such as the SecB chaperone32,33
. The Sec-translocon cannot translocate proteins once they
acquire tertiary structure. Signal peptides delay folding of these nascent pre-proteins and
allow chaperone SecB to bind to the mature region of the pre-protein32
. SecB stabilizes
the unfolded state of these pre-proteins34
and keeps them in a loosely folded state that is
competent for translocation35
. This process can occur while the protein polypeptide chain
is still being synthesized at the ribosome36
or after synthesis is complete. This SecB-pre-
protein complex binds to the ATPase protein SecA37
which then binds to the translocon.
Pre-proteins cross the membrane through the translocase (i.e., a complex formed between
SecYEG and SecA) in a manner that is poorly understood. What is known is that the
motor protein SecA drives translocation at the expense of the cellular energy currency
Adenosine Triphosphate (ATP) as well as proton motive force (PMF). The final step of
translocation usually involves signal peptidase cleavage of the signal peptides38
thus
allowing correct folding of mature protein in the periplasm39-41
.
8
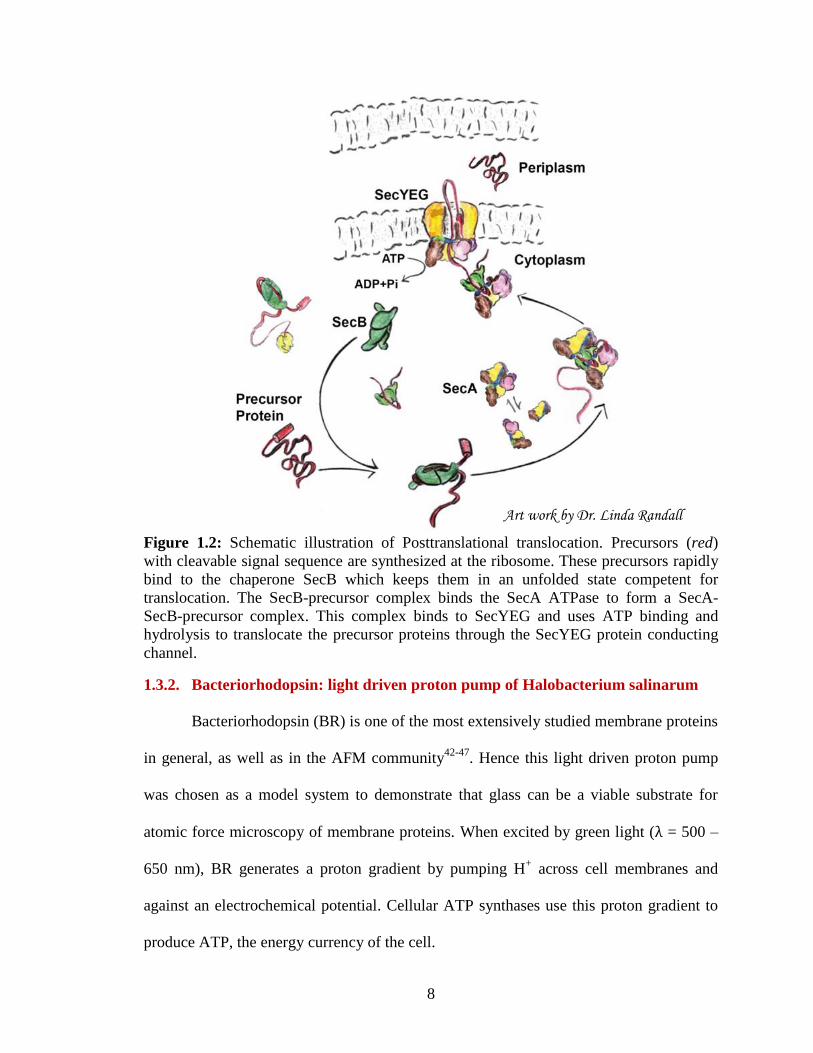
Figure 1.2: Schematic illustration of Posttranslational translocation. Precursors (red)
with cleavable signal sequence are synthesized at the ribosome. These precursors rapidly
bind to the chaperone SecB which keeps them in an unfolded state competent for
translocation. The SecB-precursor complex binds the SecA ATPase to form a SecA-
SecB-precursor complex. This complex binds to SecYEG and uses ATP binding and
hydrolysis to translocate the precursor proteins through the SecYEG protein conducting
channel.
1.3.2. Bacteriorhodopsin: light driven proton pump of Halobacterium salinarum
Bacteriorhodopsin (BR) is one of the most extensively studied membrane proteins
in general, as well as in the AFM community42-47
. Hence this light driven proton pump
was chosen as a model system to demonstrate that glass can be a viable substrate for
atomic force microscopy of membrane proteins. When excited by green light (λ = 500 –
650 nm), BR generates a proton gradient by pumping H+ across cell membranes and
against an electrochemical potential. Cellular ATP synthases use this proton gradient to
produce ATP, the energy currency of the cell.
Art work by Dr. Linda Randall

9
BR molecules assemble into trimers. These trimers pack into a two-dimensional
hexagonal lattice with 6.2 ± 0.2 nm intra-trimeric distance in the membrane, termed
“purple” membrane for its color. The purple membrane is a specialized part of the cell
membrane of Halobacterium salinarum, a salt-loving microorganism. Each BR molecule
consists of seven transmembrane α-helices that surround a photoreactive chromophore
retinal48,49
. Extracellular and cytoplasmic sides of purple membrane are distinct and can
be identified by their inter-trimeric distance (Figure 1.3)46
. BR subunits assemble into
trimers with inter-trimeric distance of ∿2.8 nm on extracellular side while it is ∿3.5 nm
for the cytoplasmic side of the purple membrane.
Figure 1.3: High-resolution images of purple membrane42
. (a) Purple membrane directly
adsorbed onto a mica supporting surface. (b) Extracellular and (c) cytoplasmic surfaces
showing the substructures and trimeric assembly of BR. Scale bars are 500 nm for panel
a, 5 nm for panels b&c and 2 nm for b&c insets respectively.
1.3.3. Enzyme catalase
Enzymes are remarkable molecular devices that catalyze chemical reactions in
biological systems50
. Enzymes are nature’s chemists that perform manyfold chemical
transformations needed for life. Enzymes are powerful, very specific, selective and able
to display a very high activity. They lower the barriers to chemical transformations by

10
presenting molecular surfaces that selectively stabilize a transition state. Most of the
known enzymes are proteins; although several catalytically active RNA molecules have
also been discovered. For example, the Nobel Prize in Chemistry was awarded jointly to
Sidney Altman and Thomas R. Cech in 1989 "for their discovery of catalytic properties
of RNA"51
.
Catalysis of chemical molecules takes place at the active site of the enzyme.
Active sites capture chemicals by utilizing intermolecular forces. These chemicals are
optimally oriented before making and breaking chemical bonds. Formation of wasteful
by-products due to side reactions is usually rare in enzyme-catalyzed reactions. Chemical
reactions are accelerated by enzymes by factors as much as a million or more. Rate
enhancement for some representative enzymes is presented in Table 1.2.
Table 1.2: Rate enhancement of few enzymes52
Enzyme Nonenzymatic
half-life
Uncatalyzed rate
const (s-1
)
Catalyzed rate
const (s-1
)
Rate
enhancement
OMP decarboxylase 78,000,000
years 2.8 × 10
-16 39 1.4 × 10
17
Staphylococcal
nuclease 130,000 years 1.7 × 10
-13 95 5.6 × 10
14
AMP nucleosidase 69,000 years 1.0 × 10⁻¹¹
60 6.0 × 10¹²
Carboxypeptidase A 7.3 years 3.0 × 10⁻⁹
578 1.9 × 10¹¹
Ketosteroid
isomerase 7 weeks 1.7 × 10
-7 66,000 3.9 × 10
11
Triose phosphate
isomerase 1.9 days 4.3 × 10
-6 4,300 1.0 × 10
9
Chorismate mutase 7.4 hours 2.6 × 10⁻⁵
50 1.9 × 10⁶
Carbonic anhydrase 5 seconds 1.3 × 10⁻¹
1 × 10⁶ 7.7 × 10
6

11
Catalases are protective enzymes that are present in virtually all aerobic
organisms that are exposed to oxygen and many anaerobic organisms53
. They are
responsible for catalyzing the breakdown of harmful hydrogen peroxide into water and
oxygen molecules in two steps before it can damage the cellular components. First the
heme of the enzyme is oxidized by hydrogen peroxide into an oxyferryl species and
generates a porphyrin cation radical. Then a second molecule of hydrogen peroxide is
used as a reductant of compound-I generating water, oxygen and the resting state of
enzyme as follows53
.
2 H2O2 → 2 H2O + O2 (1)
Enz(Por – FeIII
) + H2O2 → Cpd I (Por+.
– FeIV
= O) + H2O (2)
Cpd I(Por+.
- FeIV
= O) + H2O2 → Enz(Por – FeIII
) + H2O + O2 (3)
Catalases have been studied for more than 100 years54
. They have been isolated
and characterized from many different organisms and several crystal structures have been
published, to name a few, bovine liver catalase (BLC)55,56
, Penicillium vitale catalase
(PVC)57,58
, Micrococcus lysodeikticus catalase (MLC)59
, Proteus mirabilis catalase
(PMC)60
, Escherichia coli catalase (HPII)61,62
, Saccharomyces cerevisiae catalase
(CATA)63,64
, human erythrocytes catalase (HEC)65,66
and Mycobacterium tuberculosis
catalase-peroxidase (KatG)67
( see Fig 1.4 for crystal structure).

12
Figure 1.4: Crystal structure of Mycobacterium tuberculosis catalase-peroxidase67
.
1.4. Challenges
1.4.1. Glass as a substrate for AFM
Pioneering work from the Hansma lab has shown the first molecular resolution
AFM images of BR on mica supports in 1990 (Fig 1.5a). However, they could not
achieve molecular resolution on glass supports (Fig 1.5b)45
. Several groups have tried to
achieve molecular resolution of protein on glass supports as it enables straightforward
coupling of AFM to other single molecule techniques. Several groups have tried chemical
treatments like salinization etc45,68,69
. But there is no simple protocol for glass similar to
mica, the popular “gold standard” substrate in AFM community. If one could establish a
straight forward protocol to treat glass and achieve molecular resolution of proteins, it

13
would be possible to couple well established single molecule techniques like TIRF,
FRET, FIONA etc. to AFM.
Figure 1.5: AFM images of (a) purple membrane adsorbed to mica and (b) cationized
ferritin bound to purple membrane on silanized glass45
. Image size ~ 48x48 nm. It is
clearly evident that panel a (mica support) shows molecular resolution.
1.4.2. Hovering over single molecular complex in near native conditions
Hovering of AFM tip over a gold nanobead attached to glass substrate in air has
been well established70
. King et al. were able to hover the AFM for > 1 hr with <5pm
drift/min. But that experiment was performed in air. When liquid is added to the system,
complex noise entities involving hydrodynamics can become pronounced. Biological
membrane samples involve lipids, which can themselves fluctuate in position both
laterally and vertically. This adds another component of noise to such measurements.
Hence, it would be a challenge to hover an AFM tip over a single macromolecular
complex (such as a translocase) for long periods of time and quantitatively interpret the
signal. In this thesis we take a first step in this process and evaluate the highly dynamic
components of the system (SecA) in the absence of a membrane environment.

14
If one could successfully establish a technique to hover AFM tip over a single
macromolecular complex for long periods of time in near native conditions and interpret
the fluctuations that are observed, there are several biological questions that could be
addressed. Below are outlined a few examples.
1.4.3. Translocation mechanism of Sec Translocon machinery
During translocation, SecA advances precursors through the SecYEG protein
conducting channel but the mechanistic details of how this is achieved are unknown.
What is known is that SecA utilizes energy derived from ATP hydrolysis. Real time
investigation of this mechanical process via AFM is not possible if one could not stably
hover the AFM tip over the translocon. Protocols to attach polypeptides to AFM tips have
been well established71
. As illustrated in Figure 1.6a, it is theoretically possible to study
the translocation process by attaching a SecA-precursor complex to AFM tip and hover it
over the translocon. Using this approach one could determine the step size (if discrete
steps are indeed taken), the translocation rate, pausing, and stall force of the machinery.
As illustrated in Figure 6b, it is also possible to study the interaction of a leader peptide
with the translocon via hovering an AFM tip over the translocon.

15
Figure 1.6: Schematic illustration of possible ways to study (a) posttranslational
translocation and (b) the interaction of leader peptide with Sec-translocon and its vicinity
using US-AFM.
1.4.4. Catalytic activity of enzymes
Catalase can catalyze the breakdown of hydrogen peroxide into water and oxygen
at the turnover rate of one million times per second. At each turnover, it releases enough
heat to unfold itself. The mechanism by which it dissipates the heat so effectively is not
known. One could potentially address this by hovering and AFM tip over the catalase
molecule during turn over.
1.5. Approach
1.5.1. Atomic Force Microscopy
The atomic force microscope (AFM) was invented in 1986 by Gerd K. Binnig et
al. at IBM research, Zurich5. Since its invention, AFM has drawn a lot attention among
other scanning probe microscopes (SPM) as a general tool for imaging, measuring and

16
manipulating matter at the nanometer length scale in the physics and biological
community.
Historical perspective: scanning probe microscopy steadily evolved from the
invention of the scanning tunneling microscope (STM) in the early 1980s. The two most
prominent and versatile SPM instruments are the AFM and STM. Both are known for
their simplicity and high (atomic) resoltuion. AFM, which does not require a conducting
sample, couples the ability to apply and control forces at the sub-pN level to surfaces
with sub-nanometer lateral precision72
. Many research labs around the world are now
equipped with SPMs that are quite popular in the study of matter at the nanoscale. SPMs
work by positioning a sharp tip about a nanometer from the sample. Piezoelectric
actuators allow the position of the tip to be controlled with a few picometers accuracy.
The signal must be very sensitive to tip-sample separation in order to achieve high
precision. With a sufficiently sharp tip and relatively flat sample, one can obtain a
quantitative three dimensional surface topography with atomic resolution. However,
resolution obtained on topographically complex objects such as proteins is typically ~1
nm.
STM can be operated in two well-known modes namely, constant height mode,
i.e. the distance between tip and sample surface is held constant, and constant current
mode, i.e. the tunneling current between the tip and sample surface is maintained
constant.
Need for Atomic Force Microscope: An STM can quantitatively map the
topography of the sample surface under study with atomic resolution, but the sample
must be sufficiently conducting in order to support a sensitive tunneling current. This
17
limitation was realized in the early days of STM development. This motivated the
development of AFM that does not rely on tunneling current, but depends rather on the
inherent interaction forces between the sharp tip and the sample under study. This has led
to many topographic studies of insulating materials (such as biological molecules) with
high resolution.
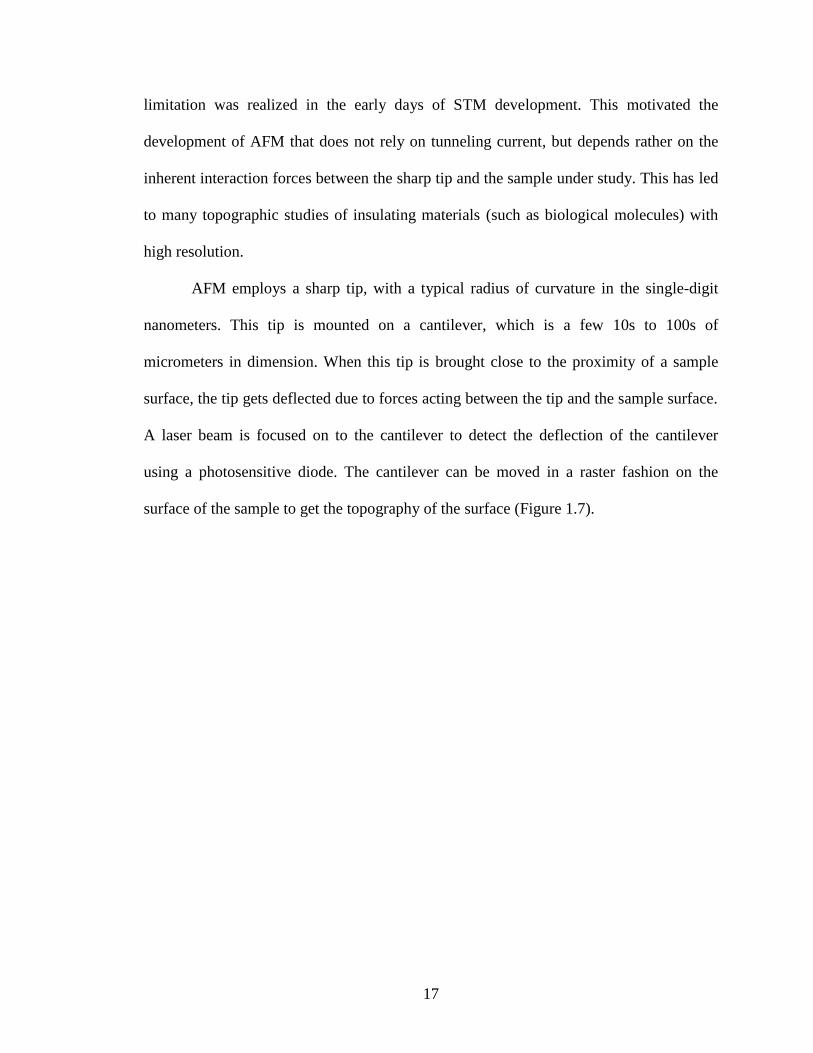
AFM employs a sharp tip, with a typical radius of curvature in the single-digit
nanometers. This tip is mounted on a cantilever, which is a few 10s to 100s of
micrometers in dimension. When this tip is brought close to the proximity of a sample
surface, the tip gets deflected due to forces acting between the tip and the sample surface.
A laser beam is focused on to the cantilever to detect the deflection of the cantilever
using a photosensitive diode. The cantilever can be moved in a raster fashion on the
surface of the sample to get the topography of the surface (Figure 1.7).

18
Figure 1.7: Schematic of an Atomic force microscope.
AFM can be operated in many modes to acquire sample topography at the
nanometer scale. Two well-known modes are contact mode and tapping mode. In contact
mode, the force between the tip of the AFM and the surface of the sample can be
calculated from the spring constant and the displacement of the cantilever on the basis of
Hooke’s law which states that
𝐹 = −𝑘𝑥 (4)
where x is the displacement of the cantilever from its equilibrium position along the
surface normal, k is the force constant and F is the restoring force exerted by the
cantilever. In tapping mode, the cantilever is driven near its resonant frequency. The
amplitude, frequency and phase of the oscillation shift because of the interaction between
the tip and the surface, and this in turn provides an indication of the forces involved.
Contact mode operates in the repulsive region, whereas tapping mode operates in both the
19
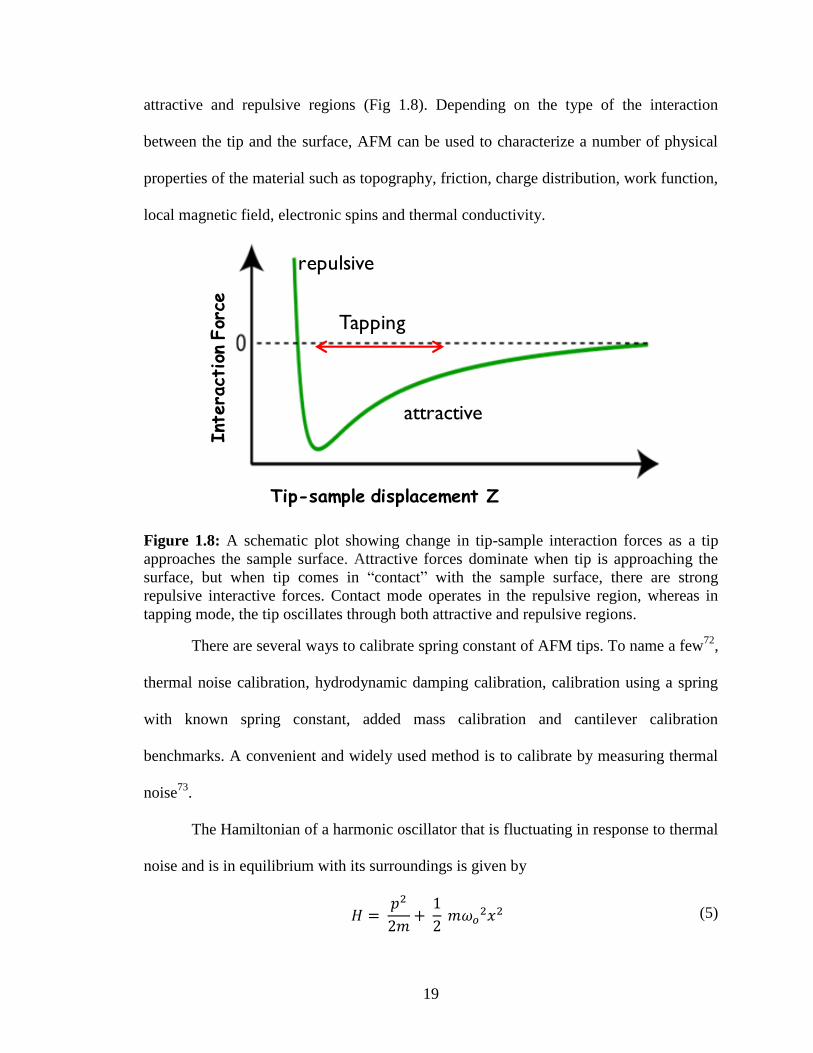
attractive and repulsive regions (Fig 1.8). Depending on the type of the interaction
between the tip and the surface, AFM can be used to characterize a number of physical
properties of the material such as topography, friction, charge distribution, work function,
local magnetic field, electronic spins and thermal conductivity.
Figure 1.8: A schematic plot showing change in tip-sample interaction forces as a tip
approaches the sample surface. Attractive forces dominate when tip is approaching the
surface, but when tip comes in “contact” with the sample surface, there are strong
repulsive interactive forces. Contact mode operates in the repulsive region, whereas in
tapping mode, the tip oscillates through both attractive and repulsive regions.
There are several ways to calibrate spring constant of AFM tips. To name a few72
,
thermal noise calibration, hydrodynamic damping calibration, calibration using a spring
with known spring constant, added mass calibration and cantilever calibration
benchmarks. A convenient and widely used method is to calibrate by measuring thermal
noise73
.
The Hamiltonian of a harmonic oscillator that is fluctuating in response to thermal
noise and is in equilibrium with its surroundings is given by
𝐻 =
𝑝2
2𝑚+
1
2 𝑚𝜔𝑜
2𝑥2 (5)
Tip-sample displacement Z
Int
era
ction For
ce
attractive
repulsive
Tapping

20
Where x is the displacement of the oscillator, p is its momentum, m is the oscillating
mass, and 𝜔𝑜 is the resonant angular frequency of the system.
From the equipartition theorem,
⟨1
2 𝑚𝜔𝑜
2𝑥2⟩ = 1
2 𝑘𝐵𝑇2 (6)
Where kB is the Boltzmann’s constant and T is the temperature.
and 𝜔𝑜2 = 𝑘/𝑚 (7)
If one can measure the mean-square spring displacement, the spring constant can then be
obtained as
𝑘 = 𝑘𝐵𝑇/⟨𝑥2⟩ (8)
1.5.2. Ultra-Stable Atomic Force Microscopy
AFM has the capability to resolve individual atoms at room temperature in both
air 74
and liquid75
. Being a mechanical device, it inevitably drifts in space over time. This
instrumental drift in atomic force microscopy has limited imaging resolution, and has
been a critical problem for decades. One method to overcome instrumental drift is to
increase the scan speed76-79
. But, during the course of imaging, often, it is impossible to
precisely return to the same starting position, if one deliberately shifts the tip to a
different location on the sample surface as it is not registered to the tip. To overcome
come this limitation, King et al., proposed using a laser based feedback scheme for tip
stabilization70
. Apart from the traditional laser that is reflected from the top of the
cantilever surface, two additional lasers were employed as illustrated in Figure 1.9. One
can know the position of the tip and sample by detecting the back scattered light from the
tip and silicon fiducial mark deposited on to the glass substrate80
in three dimensions. The
position of the tip is then adjusted to remain in a fixed position relative to the sample

21
frame of reference. Using this local sample frame of reference, the position of tip has
been controlled in 3D with high precision in air (<40 pm, Δf = 0.01 – 10 Hz). With this
atomic-scale registration of tip to the sample reference frame, one can envision
experiments like monitoring of protein dynamics, protein translocation, enzyme catalysis
etc. by hovering the tip over a protein for extended periods of time.
Figure 1.9: An artist’s rendition of an optically stabilized Ultra Stable Atomic Force
Microscope70
. Figure credit: Brad Baxley and Greg Kuebler, JILA, Colorado, USA.
22
Chapter 2
2. Glass is a Viable Substrate for Precision Force
Microscopy of Membrane Proteins
2.1. Summary
Though ubiquitous in optical microscopy, glass has long been overlooked as a
specimen supporting surface for high resolution atomic force microscopy (AFM)
investigations due to its roughness. Using bacteriorhodopsin from Halobacterium
salinarum and the translocon SecYEG from Escherichia coli, we demonstrate that
faithful images of 2D crystalline and non-crystalline membrane proteins in lipid bilayers
can be obtained on microscope cover glass following a straight-forward cleaning
procedure. Direct comparison between AFM data obtained on glass and on mica
substrates show no major differences in image fidelity. Repeated association of the
ATPase SecA with the cytoplasmic protrusion of SecYEG demonstrates that the
translocon remains competent for binding after tens of minutes of continuous AFM
imaging. This opens the door for precision long-timescale investigations of the active
translocase in near-native conditions and, more generally, for integration of high
resolution biological AFM with many powerful optical techniques that require non-
birefringent substrates.
2.2. Introduction
Atomic force microscopy has emerged as an important tool for macromolecular
characterization in biological settings and is well suited for studying membrane proteins,

23
which are challenging to address using traditional techniques.81-83
Employing a
vanishingly sharp force probe affixed to a precise translation stage, an AFM is capable of
imaging membrane proteins without resorting to freezing or crystallization. Operating in
physiological salt solution without the addition of any labeling, AFM resolves protein
protrusions above the lipid bilayer, revealing macromolecular structure and
conformational dynamics in near-native conditions. Despite unique capabilities, AFM has
yet to reach its full potential within the nanoscience research community due to its lack of
seamless integration with advanced light microscopy methods.84
Optical microscopy and spectroscopy tools are among the most broadly applied
methods in biology. Common applications range from high throughput drug discovery
assays based on fluorescence polarization85
to fundamental biophysical studies utilizing
super-resolution methods that routinely break the diffraction limit.8,86
Increasingly,
optical microscopy techniques are being incorporated into AFM instruments to enhance
functionality as well as precision.87-95
Local probe techniques are not able to resolve
small molecules in solution. A combined AFM-single molecule florescence microscope93
holds the potential to correlate ligand arrival with structural changes of a macromolecular
target. Furthermore, AFM tips drift in space over time and experience forces in three
dimensions. Inspired by techniques from the optical trapping microscopy
community80,96,97
we have recently demonstrated an ultra-stable AFM89
that minimizes
positional drift as well as a means to directly observe three-dimensional tip-sample
interactions.94
High resolution (⪝1 nm) biological AFM imaging82,98,99
has been carried out
nearly exclusively using freshly cleaved mica as a specimen supporting surface, with a

24
handful of exceptions.69,100-102
This is due to freshly cleaved mica’s inherent flatness,
cleanliness, and biological compatibility. However, mica suffers from a fundamental
limitation that has hindered its integration with numerous optical techniques. Mica
exhibits biaxial birefringence; indeed, this naturally occurring material is used for optical
wave plates. In general, propagation through birefringent material alters the polarization
state and bifurcates the propagation direction of light in a manner which varies with
material thickness. This makes it challenging to utilize freshly cleaved mica surfaces in
modern optical systems, many of which employ highly focused and polarized laser beams
passing through the specimen plane. Glass, on the other hand, is optically isotropic. It is a
ubiquitous specimen supporting material for advanced optical microscopy methods.1
In this work we sought to couple the benefits of glass substrates with high resolution
biological AFM. To obtain an AFM image, membrane proteins are held to the supporting
surface through a lipid bilayer, thus allowing studies in near-native environments. Ideally,
the underlying surface should be chemically inert and timely to prepare. Thus we
explored alternative approaches to silanization which have been reported in pioneering
work.45,68,69
Using KOH-treated borosilicate glass cover slips as specimen supports, we
demonstrate resolution of two integral membrane proteins at the level of monomer:
bacteriorhodopsin, a bench mark sample in the field,42
as well as SecYEG, the bacterial
translocon from E. coli. Additionally, we observe the association of the ATPase SecA
with SecYEG, forming a translocase at the membrane interface. We suggest more
generally that glass-supported lipid bilayers may be an effective mimic of the situation in
vivo wherein numerous punctate contacts are made with membrane, for example, by
cytoskeletal elements.103

25
2.3. Results and Discussion
2.3.1. Glass treatment and reduction in surface roughness
As supplied by the manufacturer, borosilicate glass cover slips are rough on the
molecular scale (Fig. 2.1a), exhibiting an average rms roughness of 19 9.6 Å (mean
S.D., evaluated over N = 100 non-overlapping 100 100 nm2
areas). This limits their
direct application in high resolution AFM. Treatment in saturated KOH ethanol solution
reduces the roughness by approximately an order of magnitude (Figure 2.1b, roughness =
1.7 0.3 Å, N = 440). We chose this approach because the etch rate of SiO2 is known to
plateau and then to decrease at high KOH concentrations;104
acting as a moderator,
alcohol simultaneously reduces the etch rate and increases the uniformity105
of the etched
surface (see Fig. 2.2 for alternative treatment methods). Though smoother, KOH-treated
glass is still approximately 6-fold rougher than freshly cleaved mica (Fig 2.1e, roughness
= 0.30 0.03 Å, N = 127). The extremely flat nature of mica has advantages when
carrying out imaging directly upon the solid-state surface, but our ultimate goal is to
image membrane protein protrusions emanating from the upper leaflet of supported lipid
bilayers.

26
Figure 2.1: Glass preparation and reduction of roughness. Comparison of untreated glass
(a) with KOH treated glass (b) reveals over an order of magnitude reduction in rms
roughness. A further roughness reduction was observed when KOH treated glass (c) was
coated with lipid (d). In contrast, images of mica before (e) and after (f) lipid deposition
show increasing surface roughness upon lipid coating. Average rms roughnesses are
indicated in the bottom right of each panel. Panels a & b share the same 30 nm vertical
color scale. Vertical scales for data (c-f) are identical (2 nm) and indicated. Line scan
profiles (white traces) are shown through the center of the images. Scale bars for (a & b)
are 200 nm; for panels (c-f) bars are 20 nm.
Figure 2.2: Glass treatment comparison. Panel a shows an image of a glass coverslip
after immersion in hydrofluoric acid (HF; 48 wt. %, Sigma Aldrich) for ~ 3 seconds.
Panel b is an image of glass after treatment in buffered oxide etchant (BD solution;
Transene, Inc.) for ~ 3 min. Samples were rinsed in ethanol and distilled deionized water
thoroughly prior to AFM investigation. Average rms roughness (evaluated in non-
overlapping 100 X 100 nm2 areas, N ≥ 100) are indicated at the bottom right corner for
each image. Data acquired in recording buffer (10mM HEPES pH 8.0, 200 mM KAc,
5mM MgAc2) using MSNL tips (Bruker). Lateral scale bars are 200 nm, the vertical color
scale for both images is identical and indicated. For comparison, both of these treatment
methods yielded considerably rougher surfaces than saturated KOH ethanol solution,
which produced an average rms roughness of 1.7 Å rms (see Fig. 2.1b & c and discussion
in main manuscript). We also tested glass treatment in saturated KOH followed by HF, as
well as saturated KOH followed by BD solution. In both of these cases the resulting glass
surfaces were rougher than KOH alone.

27
Hence we explored the use of KOH-treated glass as a supporting surface for lipid
bilayer imaging and compared results to those achieved with mica. Surprisingly, the
difference in surface roughness between the upper bilayer leaflet imaged on KOH-treated
glass and on mica is small (< 2-fold; Fig. 2.1, compare panels d & f). This is noteworthy
considering that untreated glass is approximately 60-fold rougher than mica itself. The
effect comes about from two sources. First, the roughness of glass-supported samples is
reduced, as can be seen when the same region is analyzed before and after deposition of
E. coli polar lipid (Fig. 2.3). Sampling of 340 non-overlapping areas reveals the average
rms roughness is diminished from 1.7 0.3 Å to 1.4 0.4 Å (Fig. 2.1c & d,
respectively). We attribute the observed smoothing to the bilayer’s ability to span local
valleys in the complex topography of the glass surface. Second, in contrast to glass, the
roughness of mica-supported samples increases upon lipid bilayer deposition to 1.0 0.2
Å, N = 365 (Fig. 2.1, compare panels e & f). We attribute this roughening to lipid
conformational fluctuations, which occur both laterally and vertically,106
which also
occur on glass, but which can only add disorder to the atomically-flat crystal plane of
mica. Thus, for studying membrane protein protrusions, KOH-treated glass appears to be
a suitable candidate for use as a supporting surface.

28
Figure 2.3: Direct visualization of the reduction of surface roughness via lipid deposition
on glass. AFM images of the same area of KOH treated glass before (a) and after (b)
lipid deposition. Line scan profiles are shown above the images. The change in rms
roughness determined in approximately the same area (white dashed boxes) is shown. A
fiducial mark (visible on the right side of both images, deposited on the cover slip via
physical vapor deposition of amorphous silicon through a shadow mask80
) allows for
image registration before and after lipid deposition. Data acquired in recording buffer
(10mM HEPES pH 8.0, 200 mM KAc, 5mM MgAc2) using biolever mini tips (BL-
AC40TS, Olympus). Lateral scale bars are 200 nm, vertical color scales are identical and
indicated.
2.3.2. Bacteriorhodopsin on glass
To substantiate this notion we imaged bacteriorhodopsin from Halobacterium
salinarum deposited on KOH-treated glass cover slips and compared the data to that
acquired on mica (Fig. 2.4). Bacteriorhodopsin forms a well characterized two-
dimensional lattice which has become an effective resolution standard for the field.42
First, large scale AFM imaging was carried out to locate individual membrane patches,
identified by their characteristic height (~ 5 nm) above the supporting glass surface (Fig.
2.4a). Smaller-scale imaging (Fig. 2.4b) revealed molecular resolution and periodicity

29
inherent in the lattice. Correlation averaged data (Fig. 2.4c, N = 100 iterations) was used
to determine the ~ 3.5 nm inter-trimeric distance, which is characteristic of the
cytoplasmic side of bacteriorhodopsin.107
Resolution achieved depends on a number of
factors and can vary with individual tips within the same lot (SNL-A, Veeco).42,107
Therefore, the same identical tip that had been used with glass was used to image the
same side of bacteriorhodopsin supported by mica (Fig. 2.4e-h). Two dimensional
Fourier transforms of both data sets exhibit peaks out to and slightly beyond a 1 nm-1
radius (Fig. 2.4d & h) indicating that similar resolution was achieved on glass as on mica.
Therefore, using this benchmark membrane protein sample, we demonstrated that there is
no major difference in image fidelity over the areas required to visualize individual
bacteriorhodopsin monomers.
30
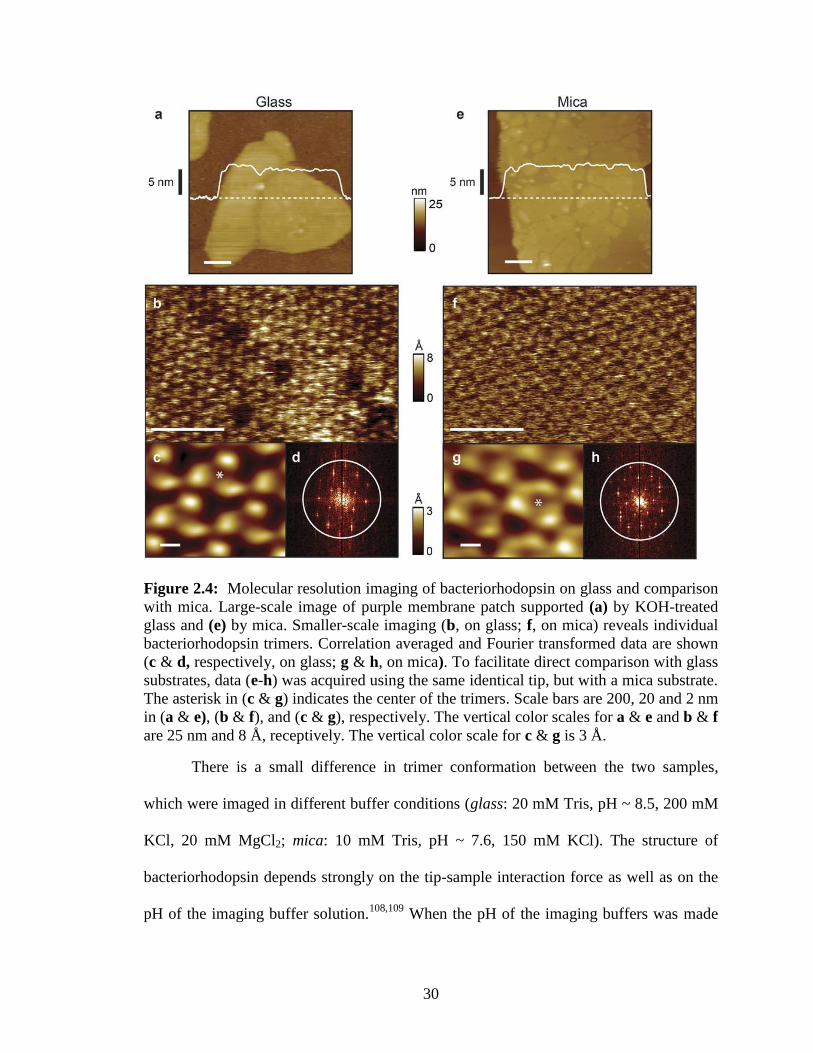
Figure 2.4: Molecular resolution imaging of bacteriorhodopsin on glass and comparison
with mica. Large-scale image of purple membrane patch supported (a) by KOH-treated
glass and (e) by mica. Smaller-scale imaging (b, on glass; f, on mica) reveals individual
bacteriorhodopsin trimers. Correlation averaged and Fourier transformed data are shown
(c & d, respectively, on glass; g & h, on mica). To facilitate direct comparison with glass
substrates, data (e-h) was acquired using the same identical tip, but with a mica substrate.
The asterisk in (c & g) indicates the center of the trimers. Scale bars are 200, 20 and 2 nm
in (a & e), (b & f), and (c & g), respectively. The vertical color scales for a & e and b & f
are 25 nm and 8 Å, receptively. The vertical color scale for c & g is 3 Å.
There is a small difference in trimer conformation between the two samples,
which were imaged in different buffer conditions (glass: 20 mM Tris, pH ~ 8.5, 200 mM
KCl, 20 mM MgCl2; mica: 10 mM Tris, pH ~ 7.6, 150 mM KCl). The structure of
bacteriorhodopsin depends strongly on the tip-sample interaction force as well as on the
pH of the imaging buffer solution.108,109
When the pH of the imaging buffers was made

31
equal (pH ~ 8.5) the trimer conformations became more alike, although not identical (Fig.
2.5a and b, data acquired using a different tip from the same batch [SNL-A, Veeco] and
different salt conditions). It is possible that differing interactions between the two solid
supporting surfaces and the proteins account for residual differences in the observed
bacteriorhodopsin conformations. However, standard deviation maps generated from the
correlation averaging revealed a similar magnitude of conformational dynamics (Fig. 2.5c
and d). This suggests that the underlying surface-protein interactions are not the primary
cause of the conformational differences.
Figure 2.5: Bacteriorhodopsin conformation and conformational flexibility on glass and
mica at pH 8.5. Bacteriorhodopsin trimers imaged at pH 8.5 on glass (a) and on mica (b).
It is known that bacteriorhodopsin assumes different conformations at different pH
values42,109,110
. Standard deviation maps (generated from correlation averages) on glass
(c) and on mica (d) reveal a similar magnitude of vertical conformational flexibility (~1.5
Å), suggesting that the underlying surface-protein interactions are similar. The asterisk in
(a & b) indicates the center of a trimer. Imaging buffer conditions were as follows, glass:
20 mM Tris, pH ~ 8.5, 200 mM KCl, 20 mM MgCl2; mica: 20 mM Tris, pH ~ 8.5, 150
mM KCl. Data acquired using different tips from the same batch [SNL-A, Veeco]. Data
in (a) and (b) was background subtracted and filtered (median, single pass). Lateral scale
bars are 2 nm.
32
2.3.3. Visualization of SecYEG translocons in membrane
To explore the potential of glass beyond two-dimensional arrays of membrane
proteins, we studied individual components of the general secretory system of E. coli. We
have previously characterized this system on mica surfaces, relating structural
observations in near-native conditions to biological function.111,112
Purified SecYEG
translocons were reconstituted into liposomes and tested for translocation of precursor
protein using established protocols.111,112
Active proteoliposomes were then deposited
onto KOH-treated glass surfaces for imaging. Individual translocons, identified as
punctate protrusions (Fig. 2.6a, c), were classified by their heights above the lipid bilayer.
Following previous work,112
cytoplasmic and periplasmic protrusions were identified by
exploiting the asymmetry inherent in the SecYEG structure.113
The clear minimum in the
height histogram at ~1.3 nm (Fig. 2.6b) separates the two orientations. The periplasmic
orientation is indicated (Fig. 2.6b, grey hatched); cytoplasmic protrusions exhibit heights
> 1.3 nm. In agreement with our previous study using mica substrates (Fig. 2.6b, black
dashed, data from ref 112
), there is a large distribution of heights for cytoplasmic SecYEG
protrusions ranging from 1.3 to over 3 nm. This conformational diversity is likely to be
due to dynamics of unstructured loops. There are two large (>30 amino acid) flexible
loops connecting the ends of helices 6-7 and 8-9 of SecY.112
Overall, these data indicate
that the measured SecYEG protrusion topography is similar when imaged on glass and on
mica.
33
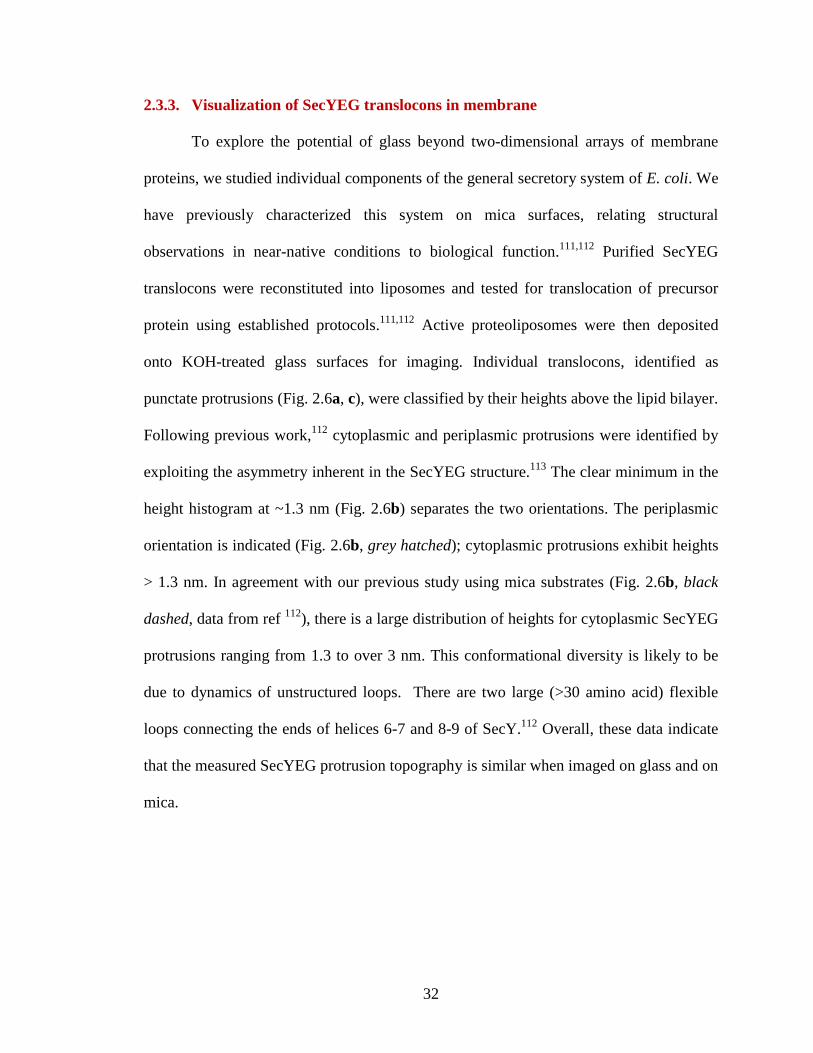
Figure 2.6: Visualization of SecYEG translocons in membrane. (a) AFM image of a
glass-supported lipid bilayer containing SecYEG. A cross section profile (white trace) is
also shown. Panel (b) shows height histograms of SecYEG on glass (red, N = 1203) and
on mica (dashed black, N = 2766). Data was normalized to the total features, the fraction
of occurrences in each bin of width 1.7 Å was plotted, the narrowest distribution was
taken as the reference and the most highly populated bin was set to 1. An individual
SecYEG monomer imaged on glass is shown (c). Scale bars are 100 nm, and 5 nm for
panels (a) & (c), respectively.
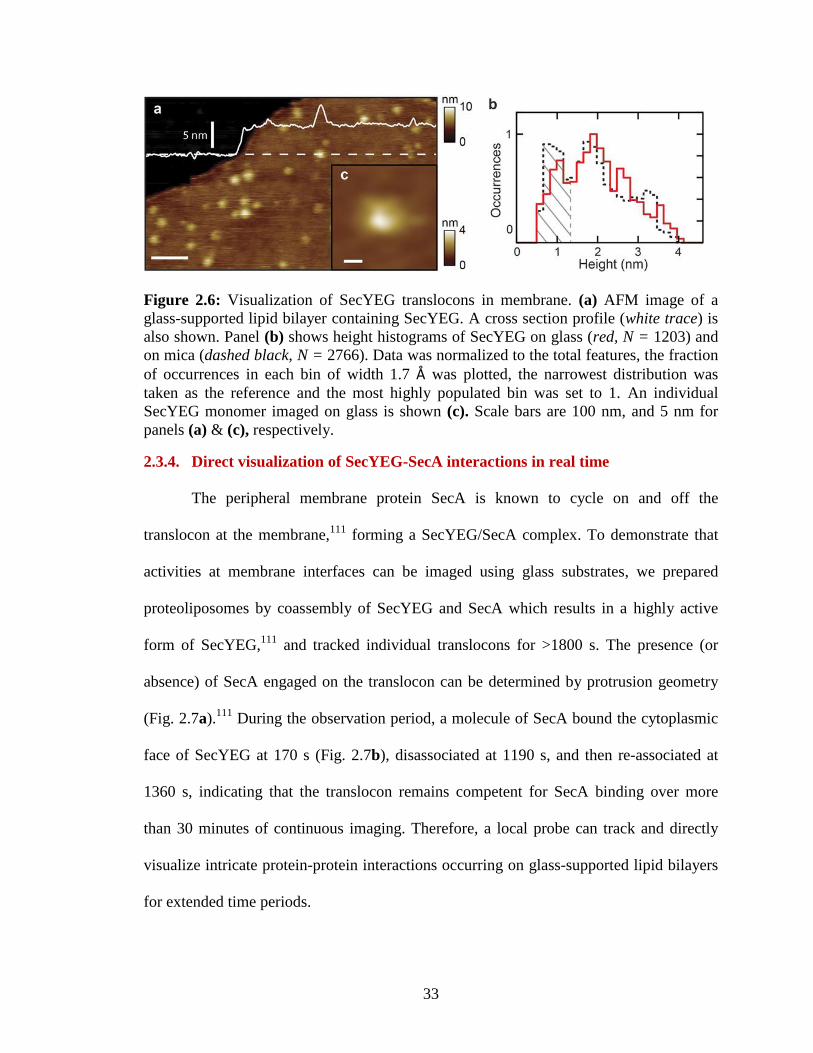
2.3.4. Direct visualization of SecYEG-SecA interactions in real time
The peripheral membrane protein SecA is known to cycle on and off the
translocon at the membrane,111
forming a SecYEG/SecA complex. To demonstrate that
activities at membrane interfaces can be imaged using glass substrates, we prepared
proteoliposomes by coassembly of SecYEG and SecA which results in a highly active
form of SecYEG,111
and tracked individual translocons for >1800 s. The presence (or
absence) of SecA engaged on the translocon can be determined by protrusion geometry
(Fig. 2.7a).111
During the observation period, a molecule of SecA bound the cytoplasmic
face of SecYEG at 170 s (Fig. 2.7b), disassociated at 1190 s, and then re-associated at
1360 s, indicating that the translocon remains competent for SecA binding over more
than 30 minutes of continuous imaging. Therefore, a local probe can track and directly
visualize intricate protein-protein interactions occurring on glass-supported lipid bilayers
for extended time periods.

34
Figure 2.7: Direct observation SecA association with SecYEG. (a) Histograms of the
maximum height of individual SecA/SecYEG complexes on mica (black dashed; N =
1088; bin size 4 Å) and on glass (red; N = 502; bin size 4 Å) surfaces. The fraction of
occurrences in each bin was plotted, the narrowest distribution was taken as the reference
and the most highly populated bin was set to 1. The prominent peak at ~ 4 nm is
attributed to the height of the active SecYEG/SecA translocase and agrees well for data
acquired on both surfaces. The peak between 1.5 and 3.0 nm corresponds to the height of
the cytoplasmic protrusion of SecYEG in the absence of SecA. Periplasmic SecYEG
protrusions which are ⪝ 1 nm and do not bind SecA were excluded from analysis. (b)
Tracking membrane activities for over 30 minutes reveals SecA association,
disassociation, and re-association on glass-supported lipid bilayers. At t=0 s the
cytoplasmic SecYEG protrusion is visualized in the membrane. 170 s later SecA binds, as
indicated by the significant change in protrusion geometry. SecA dissociates at 1190 s. At
1360 s, SecA has re-associated with SecYEG. The scale bar is 10 nm.
2.4. Conclusions
Glass cover slips are among the most widely used specimen supporting surfaces
and are an appealing non-birefringent specimen supporting surface for use in biological
AFM. Their adoption would expand the promise of force microscope applications
throughout nanoscale bioscience and biotechnology. However, glass is significantly
rougher than mica. We show that after a straight-forward cleaning process followed by
lipid deposition, the difference in roughness between the upper bilayer leaflet supported
by glass and by mica is minor (< 2-fold). Further, using two different integral membrane
proteins, bacteriorhodopsin from Halobacterium salinarum and the translocon SecYEG
from Escherichia coli, we demonstrate that glass cover slips can be used as effective
substrates for AFM of membrane protein protrusions without introducing undue
distortions or compromising resolution. Finally, direct visualization of SecA associating

35
with the translocon during >1800 s of observation demonstrates that glass-supported
SecYEG remains in an active configuration as evidenced by its competency for binding
this critical peripheral subunit.
Single molecule measurement techniques have produced powerful biophysical
insights. A promising future direction in this field lies in the ability to bring
complementary techniques to bear on a single biologically active macromolecular
complex. Our work provides a path for incorporating advanced optical techniques into
local probe studies in a timely manner, enabling, for example, precision measurements of
membrane activities in near-native conditions.
See appendix for methods and data analysis.

36
Chapter 3
3. Real time single molecule visualization of
nucleotide dependent conformational changes
in SecA-ATP hydrolysis
3.1. Summary
SecA is a critical protein in E. coli that mechanically couples ATP hydrolysis to
protein translocation through the SecYEG translocon. As in most ATPases, this process is
thought to be regulated by conformational dynamics of specific domains but it is difficult
to obtain information that directly visualizes these conformational changes. It is unclear
how ATP hydrolysis controls the large-scale intra-domain dynamics that drive protein
transport of both periplasmic and outer membrane proteins through the cytoplasmic
membrane. Here we use atomic force microscopy to explore the nucleotide dependent
conformational space of SecA in real time in near native conditions in the presence of
ATP and non-hydrolyzable analogues thereof. Our data suggest that the internal plasticity
of the ATPase is coupled to ligand binding that controls the allosteric regulation of the
protein binding domain and the carboxyl domain. We demonstrate reversible switching
between at least two different conformations. The data also imply that ADP binding
allosterically regulates the protein binding domain dynamics while SecA explores a much
more diverse dynamic conformational space in the presence of its energy currency ATP.

37
3.2. Introduction
More than 30% of newly synthesized bacterial preproteins are exported across the
cytoplasmic membrane to their final destinations where they acquire their native folded
functional states114
. Several sophisticated export mechanisms have evolved to serve this
biogenesis, but only the general secretory system (Sec) pathway is ubiquitous in all
domains of life115
. Around 96% of the pre-proteins that are exported (i.e., the exportome)
are translocated through the Sec pathway in Escherichia coli116
. SecA, an ATPase
enzyme, binds to SecYEG to form a translocase that mediates chemo-mechanical
conversion to translocate pre-proteins across the cytoplasmic membrane.
Peripheral membrane protein SecA is a large multi-domain protein (901
aminoacyl residues, Figure 3.1)111,117
. It is known to exhibit remarkable dynamics and
flexibility114,118,119
. For example, its domains are known to show remarkable
conformational plasticity, i.e. move relative to one another (Figure 3.2). Several models
have been proposed to explain protein translocation with different roles for SecA. Inter-
domain allosteric regulation in SecA plays a vital role in all of them114
. SecA acts as a
monomeric processive motor in a ‘piston’ model where extended mature domains move
along its clamp120,121
. The tip of two helix finger has been proposed to latch onto the
preprotein chain and push it through the SecYEG pore122
. The preprotein is then
translocated through the channel via ATP hydrolysis-driven power strokes in a step wise
fashion123
. In another model, SecA is proposed to control SecYEG pore opening and
closing through ATP hydrolysis, hence acting as an ‘allosteric channel regulator’. This
facilitates a Brownian ratchet mechanism where the preprotein undergoes proton motive

38
force driven diffusion through the SecYEG channel122,124,125
and SecA acts as a ‘brake’ to
prevent backsliding of the preprotein123,126
.
Figure 3.1: Domains of SecA. Structure of protomer of SecA (PDB code: 2FSF) in
ribbon representation (panel a) and surface representation (panel b) with PBD modelled
in based on Bacillus subtilis (PDB code: 1TF5). Color codes (panel c): nucleotide
binding domain 1, NBD1 (red); PBD (pink); nucleotide binding domain 2, NBD2 (blue);
variable domain, VAR(cyan); linker helix (yellow); helical scaffold domain, HSD
(purple); helical wing domain, HWD (green); two helix finger, IRA1 (orange); and
carboxyl-terminal domain, CTD (cyan)111
.
Major insight into the biomolecular structure and conformational states of SecA
has come from X-ray crystallographic studies. Several different conformational snapshots
have been recorded for SecA21,127-130
. The N-terminal of SecA (residues 1 – 619) consist
of three domains, namely, two nucleotide-binding folds (NBD1, red and NBD2, blue;
Figure 3.1) and a Precursor Binding Domain (PBD, Pink; Figure 3.1). ATP binds at the
interface of NBD1 and NBD2. The energy released during hydrolysis has been proposed
to allosterically mobilize the PBD and the C domain (residues 620 – 901, start of Helical
Scaffold Domain (HSD) to the C terminus). Five forms of SecA have been crystalized in
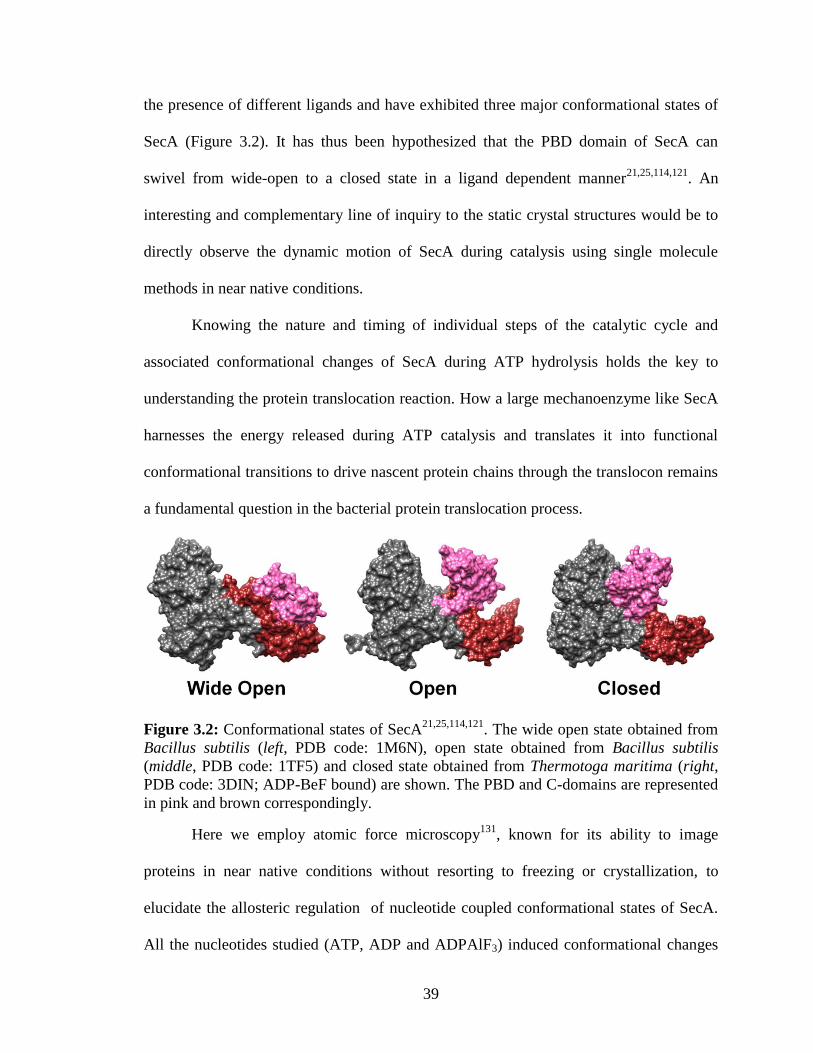
39
the presence of different ligands and have exhibited three major conformational states of
SecA (Figure 3.2). It has thus been hypothesized that the PBD domain of SecA can
swivel from wide-open to a closed state in a ligand dependent manner21,25,114,121
. An
interesting and complementary line of inquiry to the static crystal structures would be to
directly observe the dynamic motion of SecA during catalysis using single molecule
methods in near native conditions.
Knowing the nature and timing of individual steps of the catalytic cycle and
associated conformational changes of SecA during ATP hydrolysis holds the key to
understanding the protein translocation reaction. How a large mechanoenzyme like SecA
harnesses the energy released during ATP catalysis and translates it into functional
conformational transitions to drive nascent protein chains through the translocon remains
a fundamental question in the bacterial protein translocation process.
Figure 3.2: Conformational states of SecA21,25,114,121
. The wide open state obtained from
Bacillus subtilis (left, PDB code: 1M6N), open state obtained from Bacillus subtilis
(middle, PDB code: 1TF5) and closed state obtained from Thermotoga maritima (right,
PDB code: 3DIN; ADP-BeF bound) are shown. The PBD and C-domains are represented
in pink and brown correspondingly.
Here we employ atomic force microscopy131
, known for its ability to image
proteins in near native conditions without resorting to freezing or crystallization, to
elucidate the allosteric regulation of nucleotide coupled conformational states of SecA.
All the nucleotides studied (ATP, ADP and ADPAlF3) induced conformational changes

40
to the unbound (apo) state of SecA. ADP binding at the nucleotide binding domains
allosterically induces movement in the PBD. Additionally, ATP hydrolysis at the
catalytic site regulates the PBD and C domain conformational state. Our data combined
with previous studies suggest that ATP catalysis allosterically drives major
conformational changes through exquisitely balanced large interdomain motions which,
in turn, drive preprotein translocation.
3.3. Results and Discussion
Previously, our group studied the topography of SecA/SecYEG complexes in
lipid bilayers111,119
. In order to gain further traction on this complex membrane-bound
system, in this work we study the conformational dynamics of SecA alone. We
demonstrate single Ångstrom-scale changes in protein topography that depend on
particular domains (and deletions) as well as nucleotides. Accurately mapping these
changes should enable us (and others) to quantitatively interpret the AFM measured
topography of fully active translocases in future work.
Here, we studied the role of the PBD and carboxyl domains in SecA ATP
hydrolysis in near native conditions by using atomic force microscopy. Proteins were
adsorbed onto mica and topographies were characterized in various conditions. Height,
volume and areas of each individual macromolecule accessible to the AFM tip were
measured and collected into histograms for statistical analysis.
3.3.1. Single molecule studies of the wild type SecA ATPase
SecA ATPase (WT) was adsorbed onto mica in near native conditions and studied
using atomic force microscopy. Figure 3.3 shows a representative image. A higher
magnification image of the same is shown in the inset of Figure 3.3. A histogram
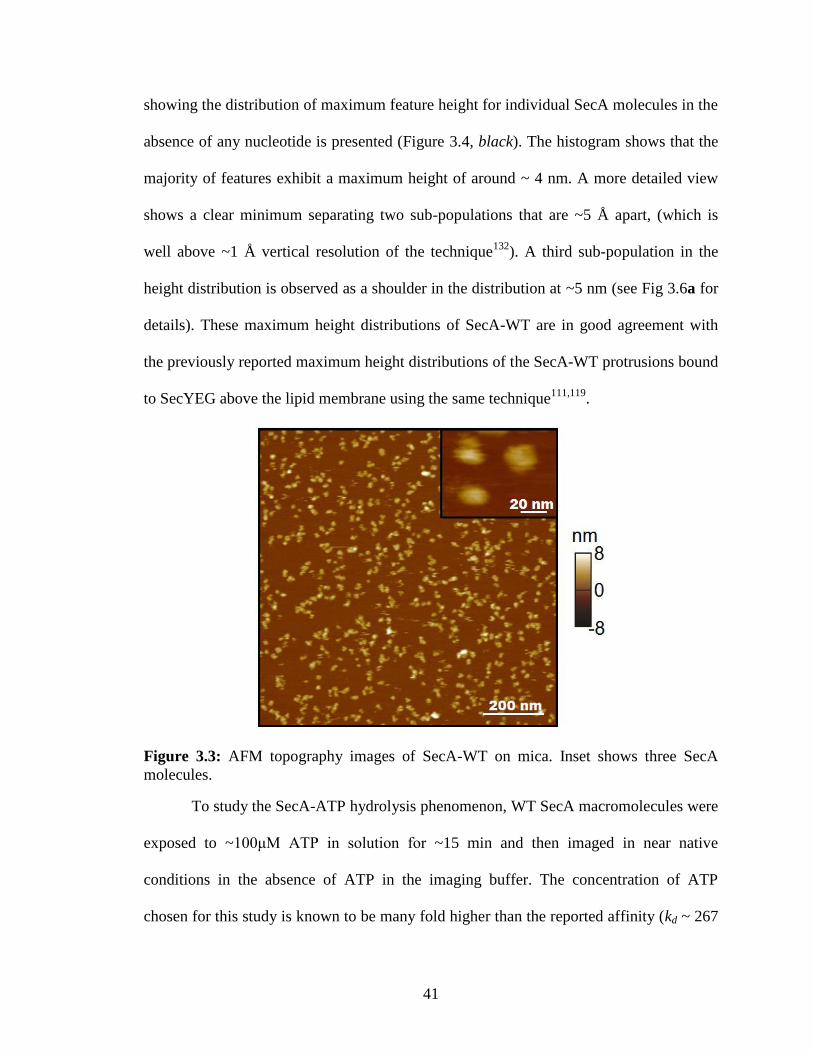
41
showing the distribution of maximum feature height for individual SecA molecules in the
absence of any nucleotide is presented (Figure 3.4, black). The histogram shows that the
majority of features exhibit a maximum height of around ~ 4 nm. A more detailed view
shows a clear minimum separating two sub-populations that are ~5 Å apart, (which is
well above ~1 Å vertical resolution of the technique132
). A third sub-population in the
height distribution is observed as a shoulder in the distribution at ~5 nm (see Fig 3.6a for
details). These maximum height distributions of SecA-WT are in good agreement with
the previously reported maximum height distributions of the SecA-WT protrusions bound
to SecYEG above the lipid membrane using the same technique111,119
.
Figure 3.3: AFM topography images of SecA-WT on mica. Inset shows three SecA
molecules.
To study the SecA-ATP hydrolysis phenomenon, WT SecA macromolecules were
exposed to ~100μM ATP in solution for ~15 min and then imaged in near native
conditions in the absence of ATP in the imaging buffer. The concentration of ATP
chosen for this study is known to be many fold higher than the reported affinity (kd ~ 267

42
nm )133
. The height distribution profile of these molecules is presented as a histogram in
Figure 3.4, red. ATP exposure has clearly shifted the maximal height distribution of the
SecA ATPase to lower heights by ~4 Å. Pelz et al reported similar subnanometer enzyme
mechanics in adenylate kinase when exposed to ATP134
. They observed a partially closed
conformational state with dominant energetic minimum that would allow rapid product-
substrate exchange.
Key insights into the conformational states of protein macromolecules have come
from X-ray crystallography. Structures of SecA bound to SecYEG, bound to ADP and in
the apo state indicate the PBD domain undergoing large scale swivel motion as shown in
Figure 3.2. It is important to note that in the X-ray structures of SecA from E. coli (PDB
code: 2FSF), the PBD region is not fully resolved. This is likely an indication that the
PBD populates many diverse conformations without having one state more stable than
the others. Between the wide open and the SecYEG bound state (closed state, Figure 3.2),
PBD undergoes a large rotation of around 80˚135
. The PBD makes contact with the C-
terminal helices in a closed conformation in all available structures of SecA. It has been
proposed that the wide open state to closed state transition occurs in two distinct phases.
Initially the PBD and the C-domain move as a single unit and then the PBD moves alone
in the second phase, towards NBD2 to the fully closed state136
. Hence, we provisionally
attribute the shift observed in the maximum height distributions after ATP exposure
(Figure 3.4) to a change in conformations of the PBD domain and/or C-domain (Figure
3.2).
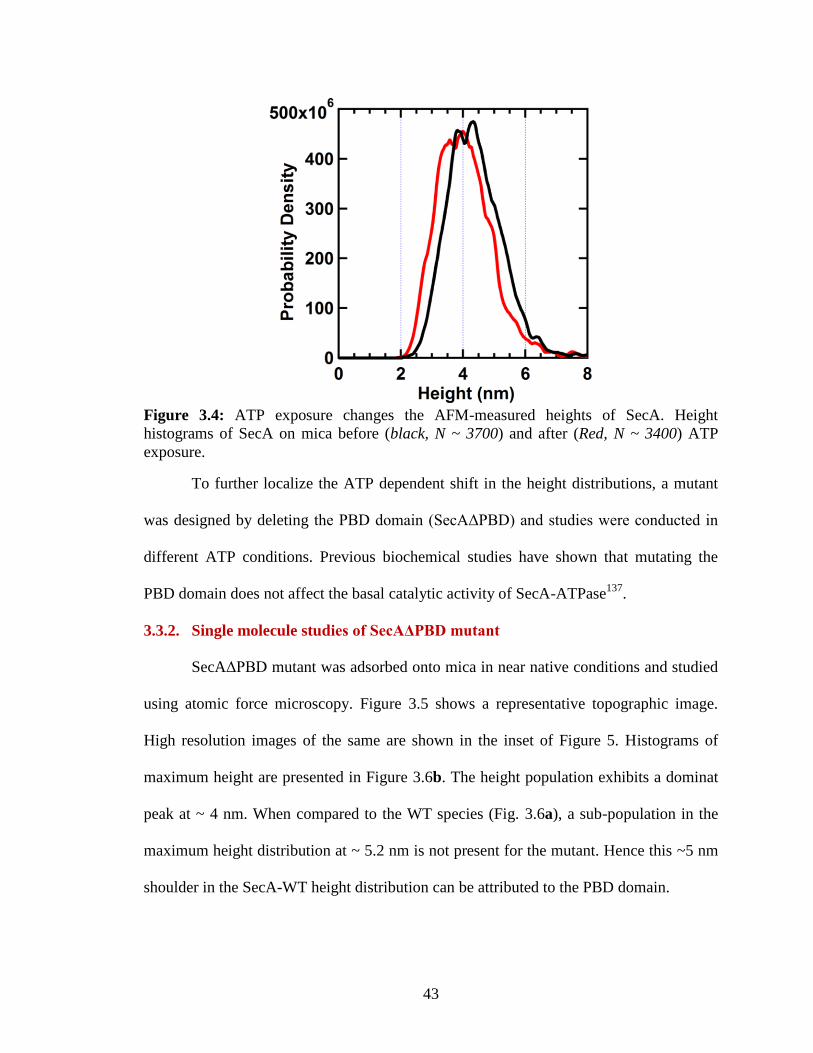
43
Figure 3.4: ATP exposure changes the AFM-measured heights of SecA. Height
histograms of SecA on mica before (black, N ~ 3700) and after (Red, N ~ 3400) ATP
exposure.
To further localize the ATP dependent shift in the height distributions, a mutant
was designed by deleting the PBD domain (SecAΔPBD) and studies were conducted in
different ATP conditions. Previous biochemical studies have shown that mutating the
PBD domain does not affect the basal catalytic activity of SecA-ATPase137
.
3.3.2. Single molecule studies of SecAΔPBD mutant
SecAΔPBD mutant was adsorbed onto mica in near native conditions and studied
using atomic force microscopy. Figure 3.5 shows a representative topographic image.
High resolution images of the same are shown in the inset of Figure 5. Histograms of
maximum height are presented in Figure 3.6b. The height population exhibits a dominat
peak at ~ 4 nm. When compared to the WT species (Fig. 3.6a), a sub-population in the
maximum height distribution at ~ 5.2 nm is not present for the mutant. Hence this ~5 nm
shoulder in the SecA-WT height distribution can be attributed to the PBD domain.

44
Figure 3.5: AFM topography images of SecAΔPBD mutant on mica. Inset shows high
resolution AFM topographies two individual SecA mutants.
Figure 3.6: PBD mutation affects the height distributions. Height histograms of SecA on
mica, before (panel a, black, N ~ 3700) and after (panel b, black, N ~ 4000) PBD
deletion. Note that the pronounced shoulder at ~ 5.2 nm in the WT species (orange fit)
disappears after the PBD deletion.
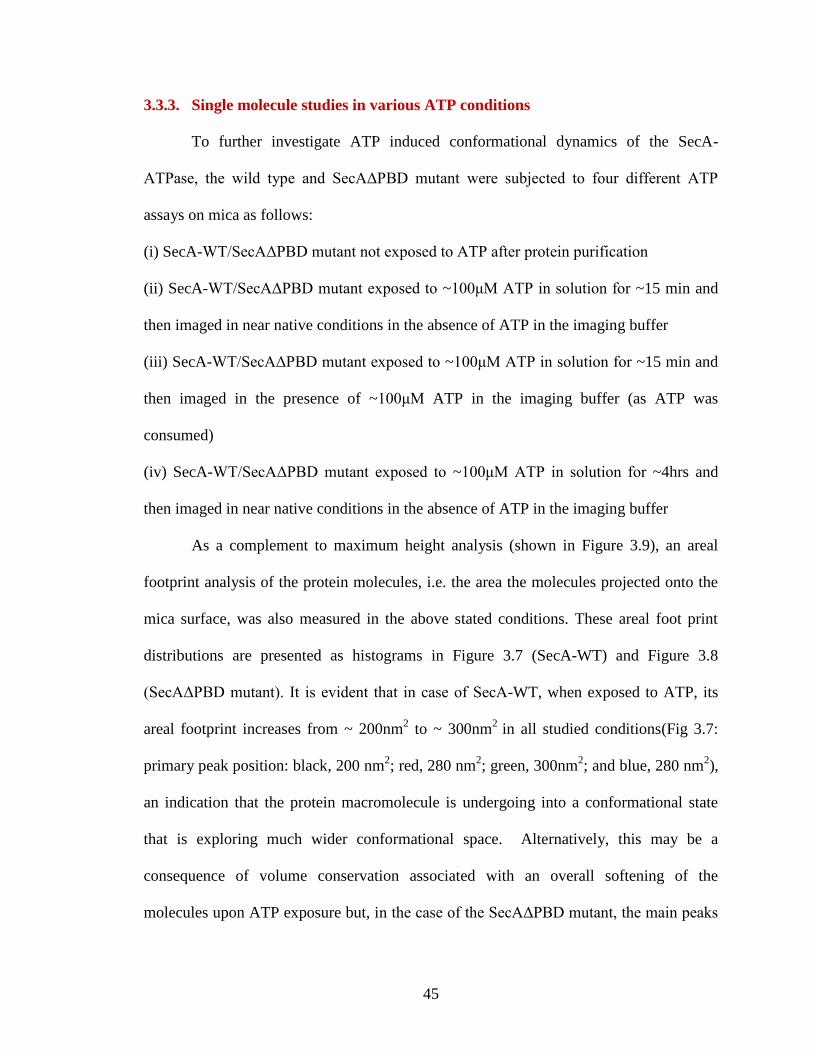
45
3.3.3. Single molecule studies in various ATP conditions
To further investigate ATP induced conformational dynamics of the SecA-
ATPase, the wild type and SecAΔPBD mutant were subjected to four different ATP
assays on mica as follows:
(i) SecA-WT/SecAΔPBD mutant not exposed to ATP after protein purification
(ii) SecA-WT/SecAΔPBD mutant exposed to ~100μM ATP in solution for ~15 min and
then imaged in near native conditions in the absence of ATP in the imaging buffer
(iii) SecA-WT/SecAΔPBD mutant exposed to ~100μM ATP in solution for ~15 min and
then imaged in the presence of ~100μM ATP in the imaging buffer (as ATP was
consumed)
(iv) SecA-WT/SecAΔPBD mutant exposed to ~100μM ATP in solution for ~4hrs and
then imaged in near native conditions in the absence of ATP in the imaging buffer
As a complement to maximum height analysis (shown in Figure 3.9), an areal
footprint analysis of the protein molecules, i.e. the area the molecules projected onto the
mica surface, was also measured in the above stated conditions. These areal foot print
distributions are presented as histograms in Figure 3.7 (SecA-WT) and Figure 3.8
(SecAΔPBD mutant). It is evident that in case of SecA-WT, when exposed to ATP, its
areal footprint increases from ~ 200nm2 to ~ 300nm
2 in all studied conditions(Fig 3.7:
primary peak position: black, 200 nm2; red, 280 nm
2; green, 300nm
2; and blue, 280 nm
2),
an indication that the protein macromolecule is undergoing into a conformational state
that is exploring much wider conformational space. Alternatively, this may be a
consequence of volume conservation associated with an overall softening of the
molecules upon ATP exposure but, in the case of the SecAΔPBD mutant, the main peaks

46
of the areal footprint populations remain the same, even after ATP exposure (Fig. 3.8,
first peak postion: black, 230 nm2; red, 230 nm
2; green, 230nm
2; and blue, 235 nm
2). This
is an indication that the increase in areal footprint of SecA-WT after ATP exposure is, in
fact, due to the PBD motion, and not the consequence of volume conservations associated
with overall softening of the molecule upon ATP hydrolysis. Our observations are
consistent with the PBD domain exploring a much wider conformational space when
exposed to ATP. These results are consistent with previous NMR studies and
biochemical studies118,138
, which indicated that ATP binding to SecA changes its
conformational state. It has been proposed that ATP binding and hydrolysis leads to a
shift in equilibrium between disorder and order of the nucleotide binding cleft and this
shift is allosterically propagated to the PBD domain through the HSD139
domain.
Statistics of areal foot print distributions for WT-SecA and SecAΔPBD mutant in
different ATP conditions are presented in table 3.1.
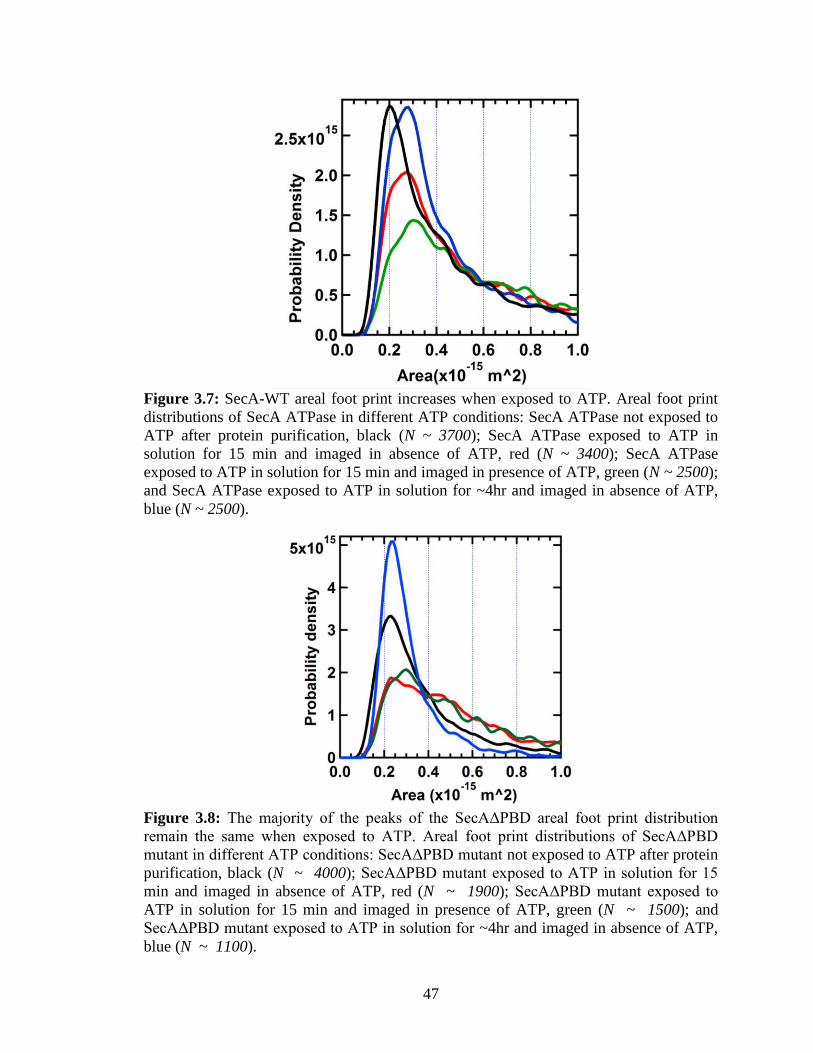
47
Figure 3.7: SecA-WT areal foot print increases when exposed to ATP. Areal foot print
distributions of SecA ATPase in different ATP conditions: SecA ATPase not exposed to
ATP after protein purification, black (N ~ 3700); SecA ATPase exposed to ATP in
solution for 15 min and imaged in absence of ATP, red (N ~ 3400); SecA ATPase
exposed to ATP in solution for 15 min and imaged in presence of ATP, green (N ~ 2500);
and SecA ATPase exposed to ATP in solution for ~4hr and imaged in absence of ATP,
blue (N ~ 2500).
Figure 3.8: The majority of the peaks of the SecAΔPBD areal foot print distribution
remain the same when exposed to ATP. Areal foot print distributions of SecAΔPBD
mutant in different ATP conditions: SecAΔPBD mutant not exposed to ATP after protein
purification, black (N ~ 4000); SecAΔPBD mutant exposed to ATP in solution for 15
min and imaged in absence of ATP, red (N ~ 1900); SecAΔPBD mutant exposed to
ATP in solution for 15 min and imaged in presence of ATP, green (N ~ 1500); and
SecAΔPBD mutant exposed to ATP in solution for ~4hr and imaged in absence of ATP,
blue (N ~ 1100).

48
Table 3.1: Statistics (mean areal footprint ± standard error of the mean) of the SecA-WT
and mutant areal footprint distributions in different ATP conditions.
Assay N - WT SecA-WT N - ΔPBD ΔPBD
(i) apo ~3700 480 nm2 ± 6 nm
2 ~4000 380 nm
2 ± 4 nm
2
(ii) ATP – no ATP ~3400 650 nm2 ± 9 nm
2 ~1900 580 nm
2 ± 9 nm
2
(iii) ATP + ATP ~2500 940 nm2 ± 17 nm
2 ~1500 570 nm
2 ± 9 nm
2
(iv) 4hr ~2500 450 nm2 ± 6 nm
2 ~1100 330 nm
2 ± 8 nm
2
Figure 3.9 and 3.10 show maximum height distributions of SecA-WT and
SecAΔPBD mutant in different ATP conditions. The full width at half maximum
(FWHM) and statistics are presented in Tables 3.2 and 3.3. The results indicate that
SecA-WT is conformationally more dynamic as compared to the mutant. In particular,
the FWHM of SecA-WT is larger than that of the mutant in all the four conditions studied
(see Table 3.2). This difference can be directly attributed to the PBD domain and motions
thereof. Conformational dynamics (as evidenced by an increase in the FWHM) are even
more pronounced when the protein macro molecules are imaged in presence and absence
of ATP (see Fig 3.11 for direct comparison; SecA-WT: red ~ 21 Å and green ~ 23 Å vs
SecAΔPBD: red ~ 15 Å and green ~ 15 Å). In the case of the mutant, these traces exhibit
a similar maximum height distribution, whereas in case of SecA-WT, these distributions
shift to slightly higher heights when imaged in the presence of ATP. Apart from the PBD
domain, the C domain is thought to be an additional regulator of SecA and ATP catalysis.
Hence, the changes in maximal height distributions observed in the mutant can be
attributed to the C domain 118
. In both cases, when the protein is exposed to ATP for 15
min and imaged after ~4 hrs delay, the protein appears to adopt a more uniform and

49
compact state (FWHM of WT ~ 16 Å, and mutant ~ 14 Å) with lower heights as
compared to the other three conditions (Fig 3.9 & 3.10, compare blue traces to other
traces).
Figure 3.9: SecA-WT maximum height distributions shift when exposed to ATP.
Maximum height distributions of SecA-WT in different ATP conditions: SecA-WT not
exposed to ATP after protein purification, dotted black (N ~ 3700); SecA-WT exposed
to ATP in solution for ~15 min and then imaged in the absence of ATP, red (N ~ 3400);
SecA-WT exposed to ATP in solution for ~15 min and then imaged in the presence of
ATP, green (N ~ 2500); and SecA-WT exposed to ATP in solution for ~4 hr and imaged
in the absence of ATP, blue (N ~ 2500).

50
Figure 3.10: SecAΔPBD mutant maximum height distributions show lower FWHM as
compared to SecA-WT when exposed to ATP. Maximum height distributions of
SecAΔPBD mutant in different ATP conditions: SecAΔPBD mutant not exposed to ATP
after protein purification, dotted black (N ~ 4000); SecAΔPBD mutant exposed to ATP
in solution for ~15 min and imaged in the absence of ATP, red (N ~ 1900); SecAΔPBD
mutant exposed to ATP in solution for ~15 min and imaged in the presence of ATP,
green (N ~ 1500); and SecAΔPBD mutant exposed to ATP in solution for ~4 hr and
imaged in the absence of ATP, blue (N ~ 1100).
Figure 3.11: Comparison of ATP-induced shifts in the FWHM for WT and mutant SecA.
(a) Maximum height distributions of SecA-WT exposed to ATP in solution for ~15 min
and then imaged in the absence of ATP (red, N ~ 3400), and presence of ATP (green, N
~2500); (b) SecAΔPBD mutant exposed to ATP in solution for ~15 min and then imaged
in the absence of ATP (red, N ~1900), and presence of ATP (green, N ~1500).

51
Table 3.2: FWHM of the SecA-WT and mutant maximum height distributions in
different ATP conditions
ATP Assay N - WT SecA-WT N - ΔPBD ΔPBD
(i) apo ~ 3700 ~ 20 Å ~ 4000 ~ 17 Å
(ii) ATP – no ATP ~ 3400 ~ 21 Å ~ 1900 ~ 15 Å
(iii) ATP + ATP ~ 2500 ~ 23 Å ~ 1500 ~ 15 Å
(iv) ~4 hr recovery ~ 2500 ~ 16 Å ~ 1100 ~ 14 Å
Table 3.3: Statistics (mean height ± standard error of the mean) of the SecA-WT and
mutant maximum height distributions in different ATP conditions.
ATP Assay N - WT SecA-WT N - ΔPBD ΔPBD
(i) apo ~ 3700 44 Å ± 0.2 Å ~ 4000 42 Å ± 0.2 Å
(ii) ATP – no ATP ~ 3400 41 Å ± 0.2 Å ~ 1900 36 Å ± 0.2 Å
(iii) ATP + ATP ~ 2500 44 Å ± 0.3 Å ~ 1500 39 Å ± 0.3 Å
(iv) ~4hr ~ 2500 38 Å ± 0.2 Å ~ 1100 34 Å ± 0.3 Å
3.3.4. Single molecule studies in the presence of different ATP analogues
To further investigate the conformational changes we observed in the presence of
ATP, both SecA-WT and the PBD mutant were investigated in the presence of ADP as
well as a nonhydrolyzable ATP analogue. ADP-AlF3 is known to trap the ATPase in its
transition state140
and ADP bound SecA can be an effective representation of the initial
state of the hydrolysis cycle as ADP needs to dissociate from SecA to allow another ATP
to bind to begin the next cycle. Hence, investigating SecA in the presence of these
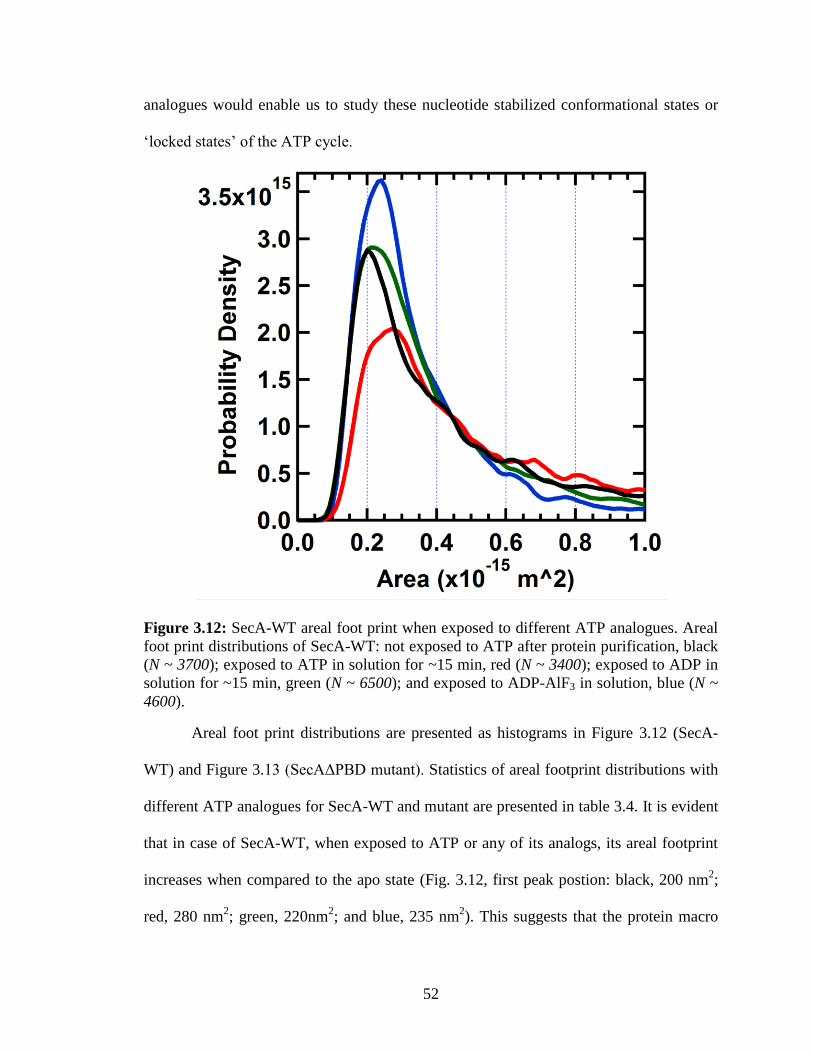
52
analogues would enable us to study these nucleotide stabilized conformational states or
‘locked states’ of the ATP cycle.
Figure 3.12: SecA-WT areal foot print when exposed to different ATP analogues. Areal
foot print distributions of SecA-WT: not exposed to ATP after protein purification, black
(N ~ 3700); exposed to ATP in solution for ~15 min, red (N ~ 3400); exposed to ADP in
solution for ~15 min, green (N ~ 6500); and exposed to ADP-AlF3 in solution, blue (N ~
4600).
Areal foot print distributions are presented as histograms in Figure 3.12 (SecA-
WT) and Figure 3.13 (SecAΔPBD mutant). Statistics of areal footprint distributions with
different ATP analogues for SecA-WT and mutant are presented in table 3.4. It is evident
that in case of SecA-WT, when exposed to ATP or any of its analogs, its areal footprint
increases when compared to the apo state (Fig. 3.12, first peak postion: black, 200 nm2;
red, 280 nm2; green, 220nm
2; and blue, 235 nm
2). This suggests that the protein macro

53
molecule explores a much wider conformational space once it has been exposed to either
ATP itself or the analogs tested here. In the case of other nucleotides (i.e. ADP and ADP-
AlF3), the change is minimal compared to ATP, but clearly above the signal-to-noise
ratio of the analysis (see table 3.4). In case the of the SecAΔPBD mutant, the population
distribution remains essentially the same, even after exposure to ATP and its
nonhydrolyzable analogues (Fig. 3.13, first peak postion: black, 230 nm2; red, 230 nm
2;
green, 220nm2; and blue, 220 nm
2). This is an indication that the increase in areal
footprint of SecA-WT after exposing to ATP is due to the motion of PBD domain.
Figure 3.13: SecAΔPBD mutant areal foot print when exposed to different ATP
analogues. Areal foot print distributions of SecAΔPBD mutant: not exposed to ATP after
protein purification, black (N ~ 4000); exposed to ATP in solution for ~15 min, red (N ~
1900); exposed to ADP in solution for ~15 min, green (N ~ 3100); and exposed to ADP-
AlF3 in solution, blue (N ~ 2200).

54
Table 3.4: Statistics (mean areal footprint ± standard error of the mean) of the SecA-WT
and mutant areal footprint distributions with different ATP analogues.
Nucleotide N-WT SecA-WT N-ΔPBD ΔPBD
(i) apo ~3700 480 nm2 ± 6 nm
2 ~4000 380 nm
2 ± 4 nm
2
(ii) ATP ~3400 650 nm2 ± 9 nm
2 ~1900 580 nm
2 ± 9 nm
2
(iii) ADP ~6500 420 nm2 ± 4 nm
2 ~3100 390 nm
2 ± 5 nm
2
(iv) ADP-AlF3 ~4600 360 nm2 ± 4 nm
2 ~2200 320 nm
2 ± 6 nm
2
Figure 3.14 and 3.15 represent maximum height distributions of SecA-WT
ATPase and the SecAΔPBD mutant in the presence of ATP and its non-hydrolyzable
analogues. The FWHM of these data and associated statistics are presented in Tables 3.5
& 3.6, respectively. In the case of SecA-WT, the maximum height distribution clearly
shifts towards lower heights when exposed to ATP and its analogues (Figure 3.14). We
note that similar observations of height reductions in the presence of nucleotides has been
reported previously for Eukaryotic cyclic nucleotide-modulated channels141
. While in the
presence of ATP, the maximal height distributions show two main peaks and a shoulder
at ~ 5 nm, similar to SecA-WT that is not exposed to ATP (red & black traces; figure
3.14), the distributions in presence of the two non-hydrolyzable nucleotides are uniform
(green & blue traces; Figure 3.14) and peak at slightly lower heights as compared to the
apo-state (black trace; Figure 3.14). We propose that the majority populations observed in
the cases of ADP and ADP-AlF3 represent the nucleotide stabilized conformational states
i.e. “locked states” of the corresponding nucleotides. Similar nucleotide stabilized
conformational states have been reported in earlier studies for secA133
and other protein
macromolecules142-146
in biochemical and insilico studies.

55
In the case of the mutant, the maximum height distributions of the apo state & the
ADP exposed state are similar (Fig. 3.15 black & green); additionally, the ATP & ADP-
ALF3 exposed states are similar (Fig 3.15, red & blue). Taken together with the wild-type
data, these results clearly indicate that ADP binding induces a conformational state
changes in the PBD domain (compare black & green traces in Figures 3.14 & 3.15, or see
Figure 3.16 for a direct comparison). The maximum height distribution changes seen in
the mutant in the presence of ATP and ADP-AlF3 can be attributed to the motion of the C
domain, which is another known additional regulator of SecA and ATP catalysis 118
.
Conformational dynamics (as evidenced by increases in the FWHM of height histograms)
are more pronounced if the protein macro molecules are imaged in presence of ATP and
ADP-AlF3 (see Fig. 3.17 and Table 3.5 for direct comparison; SecA-WT: red ~ 21 Å and
blue ~ 15 Å vs SecAΔPBD: red ~ 15 Å and blue ~ 16 Å). In the case of the mutant, these
traces have similar maximum height distributions and similar FWHM, while in case of
SecA-WT, they are more distributed (i.e. FWHM is higher by ~ 6 Å) when imaged in
presence of ATP. These differences can be attributed to the conformational dynamics of
the PBD domain.

56
Figure 3.14: SecA-WT maximum height distributions when exposed to different ATP
analogues. Maximum height distributions of SecA-WT: not exposed to ATP after protein
purification, black (N ~ 3700); exposed to ATP in solution for ~15 min, red (N ~ 3400);
exposed to ADP in solution for ~15 min, green (N ~ 6500); and exposed to ADP-AlF3 in
solution, blue (N ~ 4600).
Figure 3.15: SecAΔPBD mutant maximum height distributions when exposed to
different ATP analogues. Maximum height distributions of SecAΔPBD mutant: not
exposed to ATP after protein purification, black (N ~ 4000); exposed to ATP in solution
for ~15 min, red (N ~ 1900); exposed to ADP in solution for ~15 min, green (N ~ 3100);
and exposed to ADP-AlF3 in solution, blue (N ~ 2200).
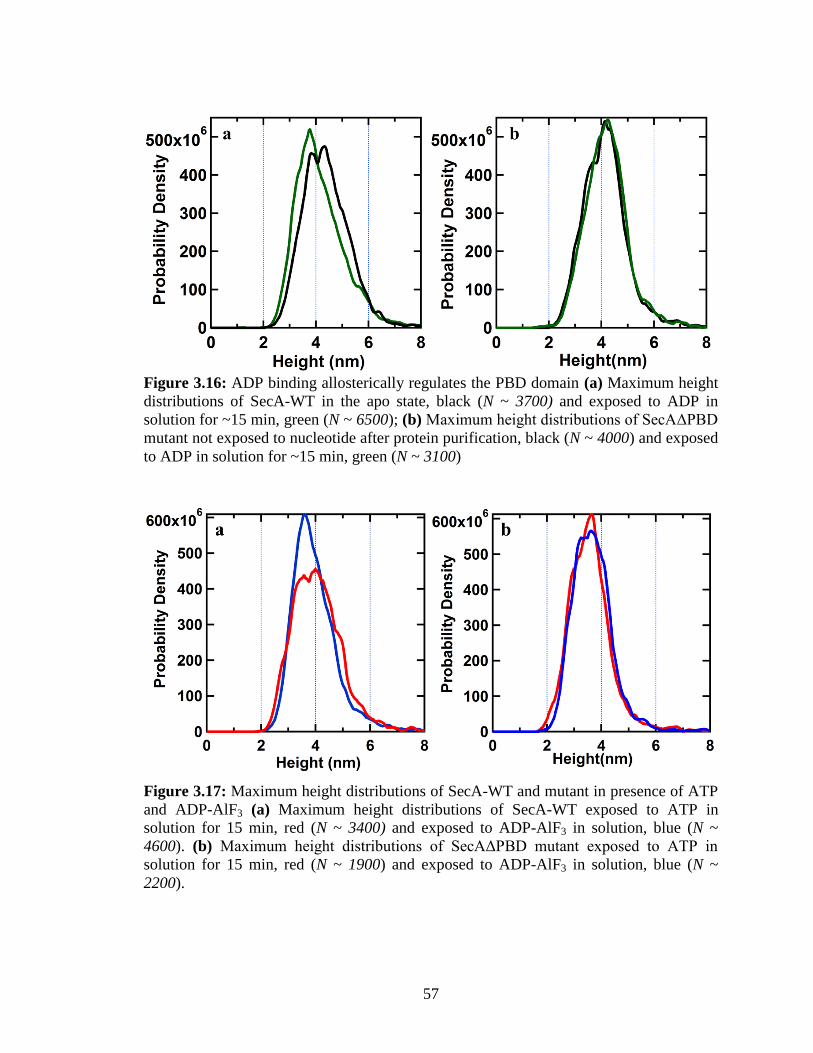
57
Figure 3.16: ADP binding allosterically regulates the PBD domain (a) Maximum height
distributions of SecA-WT in the apo state, black (N ~ 3700) and exposed to ADP in
solution for ~15 min, green (N ~ 6500); (b) Maximum height distributions of SecAΔPBD
mutant not exposed to nucleotide after protein purification, black (N ~ 4000) and exposed
to ADP in solution for ~15 min, green (N ~ 3100)
Figure 3.17: Maximum height distributions of SecA-WT and mutant in presence of ATP
and ADP-AlF3 (a) Maximum height distributions of SecA-WT exposed to ATP in
solution for 15 min, red (N ~ 3400) and exposed to ADP-AlF3 in solution, blue (N ~
4600). (b) Maximum height distributions of SecAΔPBD mutant exposed to ATP in
solution for 15 min, red (N ~ 1900) and exposed to ADP-AlF3 in solution, blue (N ~
2200).

58
Table 3.5: FWHM of the SecA-WT and mutant maximum height distributions exposed
to different nucleotides.
Nucleotide N - WT SecA-WT N - ΔPBD ΔPBD
(i) apo ~ 3700 ~ 20 Å ~ 4000 ~ 17 Å
(ii) ATP ~ 3400 ~ 21 Å ~ 1900 ~ 15 Å
(iii) ADP ~ 6500 ~ 18 Å ~ 3100 ~ 17 Å
(iv) ADP-AlF3 ~ 4600 ~ 15 Å ~ 2200 ~ 16 Å
Table 3.6: Statistics (mean of the height distribution ± standard error of the mean) of the
SecA-WT and mutant maximum height distributions exposed to different nucleotides.
Nucleotide N - WT SecA-WT N - ΔPBD ΔPBD
(i) apo ~ 3700 44 Å ± 0.2 Å ~ 4000 42 Å ± 0.2 Å
(ii) ATP ~ 3400 41 Å ± 0.2 Å ~ 1900 36 Å ± 0.2 Å
(iii) ADP ~ 6500 42 Å ± 0.2 Å ~ 3100 42 Å ± 0.2 Å
(iv) ADP-AlF3 ~ 4600 40 Å ± 0.2 Å ~ 2200 37 Å ± 0.3 Å
3.3.5. SecA ATPase inter-domain conformational dynamics at single molecule level
Imaging the SecA ATPase in the presence of non-hydrolysable ATP analogues
indicated that the majority of the molecules are stalled in “locked” states but switching
between ATP-bound and ADP-bound states is of fundamental importance for ATP
hydrolysis. Hence, we wanted to further investigate if these stalled molecules can be
driven out of stalled states to undergo reversible conformational changes. In fact, single
molecule dynamic studies of enzymes undergoing catalysis are difficult and have been
sparse and indirect, as molecules can remain inactive during AFM studies132
. Here we

59
followed individual SecA ATPase molecules in real space and real time to directly
visualize conformational dynamics associated with ATP hydrolysis.
Figure 3.18: SecA ATPase scanned in two dimensions and one dimension: High
resolution two dimensional topographies of SecA-WT is shown in panel (a). Panel (b)
shows a kymograph147
of the protein of interest (dotted circle, panel (a)). Here the slow
scan axis is disabled and the AFM tip scans in one dimension over the same area
(neglecting drift). By generating protein ‘tubes’, kymographs enable us to observe
conformational dynamics with much better temporal resolution (~100 ms in panel (b) vs
~ 52 s in panel (a)).
With traditional AFM techniques, temporal resolution is often limited by the band
width of the feedback electronics. Hence, in order to achieve the temporal resolution
required to observe conformational dynamics of SecA-WT in the presence ATP, we
scanned these protein macromolecules in one dimension rather than the traditional two
dimensions (Fig 3.18). First a traditional two dimensional image was taken to identify the
proteins of interest. Then the slow scan axis was disabled to repeatedly scan the protein
of interest to monitor the ATP induced conformational dynamics in real time with high
lateral and temporal resolution (~ 1nm and ~ 100 ms) under physiological conditions.
The resulting kymographs were achieved without the need for large fluorescent labels
which can prevent free protein motion. We exploited the large difference in protein width

60
profiles in the presence and absence of ATP that was evident from the areal footprint
distributions (e.g., Figure 3.7) to monitor the real time dynamics of the ATPase catalysis
as the substrate was consumed.
Figure 3.19: Direct visualization of SecA-ATPase domain movements by AFM. (a)
Kymograph showing conformational dynamics of SecA-ATPase in presence of ATP. (b)
3D representation of the same. (c) Height profiles of compact (red) and expanded states
(black) for the line scans of the same color from panel a (dashed lines).
Figure 3.19 illustrates a kymograph, i.e. a one dimensional scan of SecA-WT as a
function of time. Here, the protein exhibits at least two conformational states of different
width profiles that switch back and forth (see line scans in Fig. 3.19c) and this apparent
‘flickering’ can be captured over extended periods illustrating the reversible nature of
these ATP induced conformational changes in SecA. We hypothesize that this flickering
process may represent a conformational change directly reflecting ATP binding and
unbinding from the SecA-WT, but further work will be required to confirm this.
Figure 3.20a illustrates a kymograph of SecA-WT in the presence of ATP for
more than ~75 s. Here the protein molecule flickers back and forth between a compact
and a more open or splayed state. Figure 3.20b shows the maximum width distribution
profile of this molecule for the same period of time. The reversible switching of the
molecule between compact and splayed state is reflected in the histogram as two
populations. A clear minimum at ~ 29 nm separates these two populations. The protein

61
appears to have favored the splayed state over compact state in this case. Specifically, it
remains in the splayed state for ~84% of the time and 14% in compact state (Fig 3.20b,
red and green curve fittings correspondingly).
Figure 3.20: Reversible conformational dynamics of an individual SecA-WT molecule.
(a) Kymograph showing flickering behavior of SecA-WT in the presence of ATP for
over 75s and (b) histogram of AFM-measured width (n ~400 scan lines) showing two
majority populations (compact and expanded states). Note, width measurements are
overestimates of the true molecular dimensions because the dimensions of the AFM tip
(nominal radius ~8 nm) were not deconvolved from the analysis.
In conclusion, we studied enzyme dynamics during ATP hydrolysis of SecA. Our
measurements, which were carried out in real time and real space via AFM, provided
information into structural and dynamic information in near-native biological conditions.
Moreover, the method required neither additional molecular labelling nor complex data
interpretation. Our measurements provided direct evidence of nucleotide-dependent
motion of the PBD domain. This domain is known to be in direct contact with precursor
protein and hence plays a critical role in translocation. We further showed that SecA-
ATPase molecules can undergo reversible conformational changes in the presence of
ATP and that the protein molecules can be stalled in ‘locked states’ in the presence of
non-hydrolyzable ATP analogues. We demonstrate here, a unique capability of AFM to
study reversible conformational dynamics at single molecule level for the

62
characterization of ligand induced reversible conformational dynamics that would be
difficult to investigate using any other technique, in near native biological conditions and
in real time.
See appendix for methods and data analysis.

63
Chapter 4
4. Catalase Enzyme Dynamics during Catalysis
4.1. Introduction
In 1894, Emil Fisher proposed the “lock and key” mechanism, i.e. substrates fit perfectly
into active sites of the enzymes like a lock and key148
. Ever since, the catalytic activity of
the enzymes has fascinated biochemists149
. For the past century, the focus has been
mainly on interconversion of reactants to product molecules and the rate of catalysis, but
explaining highly exothermic enzymatic reactions has been largely overlooked149
.
Recently, Riedel et al. have investigated the origin of anomalous diffusion of several
enzymes with high H (change in enthalpy)150
. They attribute this anomalous diffusion to
an acoustic wave generated by the heat released during enzyme catalysis.
Previous studies of the urease151
and catalase152
enzymes also showed enhanced
molecular diffusion. These observations were interpreted as self-phoretic effects, i.e.,
diffusion generated by release of changed products from the surface of the enzyme153
.
Riedel et al. alternatively propose that the heat released during the catalysis reaction by
the enzyme could be responsible for this enhanced diffusion.
Using fluorescence correlation spectroscopy, Riedel et al. demonstrated that the
diffusion of enzymes correlates with the rates of the reactions catalysed by the enzymes
and the heat produced during the catalysis. They also reported that the anomalous
increase in the diffusivity of the enzyme is proportional to the velocity of the reaction and
the heat generated during the reaction. They also heated the catalytic center of the
enzyme with a short laser pulse to simulate the proposed effect and observed qualitatively

64
the same anomalous diffusion observed during catalytic reactions. Hence, it seems that
the heat generated during catalysis gives rise to the observed peculiar diffusion of the
enzymes.
In order to explain the observed anomalous diffusion of enzymes, Riedel et al.
proposed a model where the heat generated during each catalytic cycle is transmitted as a
pressure wave through the enzyme creating a differential stress at the enzyme-solvent
interface, which in turn propels the enzyme. The authors called it a ‘chemoacoustic’
effect. The mechanism by which the pressure wave propagates through the proteins
remains uncertain.
Several alternative theories for ‘chemoacoustic’ effect have been proposed154-159
.
Golestanian proposed an alternative theory157
for the enhance diffusion that contradicts
the theoretical model proposed by Riedel et al. In his model, the enhanced diffusion
coefficient of the enzymes could be explained simply by a combination of global
temperature increase in the sample container and enhanced conformational change of the
enzymes during catalysis cycle.
We proposed experiments to directly observe enzyme catalase during catalysis.
The ideal way to do this would be to image the enzyme during catalysis to look for any
structural changes. An alternative approach would be to hover an AFM tip over the
enzyme during catalysis. In this mode the AFM tip would not be in mechanical contact
with the enzyme, but rather, within close enough range (~1 nm) to detect more nuanced
effects. Specifically, the AFM tip could potentially be used as a “nanophone” to detect
acoustic waves, if they are present as proposed in the ‘chemoacoustic’ model of enzyme
propulsion.

65
The work described in this chapter is a necessary step towards performing a
hovering experiment, with the tip of the ultrastable AFM held in a position clamp over an
active enzyme. In particular, we established the conditions to achieve stable imaging of
catalase adhered to a mica substrate. In so doing, we imaged several conformational
changes of this highly active enzyme. Interestingly, we also observed that the number of
catalase enzymes on the mica surface increased during the course of exposure to its
substrate, suggestive of oligomeric state changes. These results provide guidance for an
improved experimental design incorporating an enzyme with the potential to create a
dimeric (or higher order) species with covalent crosslinking to prevent dissociation.
These improved experimental conditions are met by the inorganic pyrophosphatase
enzyme, which is the subject of current work in the laboratory.
4.2. Results and discussion
4.2.1. Single molecule studies of KatG-WT
Wild type Catalase (KatG WT) from Mycobacterium tuberculosis and mutated
Catalase (KatG mutant C171A/C541A) have been studied on mica supports in aqueous
buffer solution using atomic force microscopy and corresponding AFM images are
shown in Figure 4.1 and 4.2. As evidenced in Figure 4.2 and corresponding analysis,
mutating the two cysteines of the wild type enzyme at position 171 and 541 with alanines
clearly affected the structural stability of the enzyme. It is evident from the height and
volume histograms presented in Figure 4.3 and 4.4 that the mutation biases towards
structures with smaller heights and volumes.

66
Figure 4.1: Representative AFM image of Wild type Catalase (KatG WT) from
Mycobacterium tuberculosis on mica support in aqueous buffer solution. High resolution
surface topographies of the same are shown in inset.
Figure 4.2: Representative AFM image of mutated Catalase (KatG mutant
C171A/C541A) from Mycobacterium tuberculosis on mica support in aqueous buffer
solution. High resolution topographies of the same are shown in inset.

67
Figure 4.3: Height histograms showing maximum heights of KatG WT features (red, N ~
1700) and KatG mutant C171A/C541A (blue, N ~ 3000). Clearly, the mutant population
is biased towards lower features compared to WT, but there is still a non-zero minority
population in the mutant sample with heights around ~7 nm.
Figure 4.4: Histograms showing volumes of KatG WT features (red) and KatG
C171A/C541A (blue).

68
4.2.2. KatG in presence of hydrogen peroxide
We designed experiments to study the effect of H2O2 activation on KatG-WT.
Representative images are illustrated in Figure 4.5. A general result is that significant
variations in heights were observed and these dynamics correlated with the presence of
H2O2. Further, H2O2 changed the overall topography of the proteins. Features > 4.5 nm
seem to largely disappear in the presence of H2O2, and the height of the smaller features
also seemed to increase by ~4 Å as shown in Figure 4.6. Potassium iodide (KI) is known
to quench H2O2. Hence, KI was added to the protein assay and the ~4 Å increase in
heights observed in presence of H2O2 disappeared and the height changes are reversed,
indicating reversible conformational changes (see Figure 4.6). Similar conformational
fluctuations have been reported earlier for other enzymes132,134,141,159-162
. Another general
feature that we observed was that the presence of the substrate H2O2 increased the
number density of enzymes found on the supporting surface (from ~ 200 per m2 to ~310
per m2, see figure 4.5).
Figure 4.5: Representative AFM image of Wild type Catalase (KatG WT) from
Mycobacterium tuberculosis on mica support in (a) aqueous buffer solution (b) aqueous
buffer solution containing ~10 mM H2O2 to activate the enzymes and (c) aqueous buffer
solution containing ~10 mM KI for quenching.

69
Figure 4.6: Height histograms of Wild type Catalase (KatG WT) from Mycobacterium
tuberculosis on mica support in aqueous buffer solution (black), aqueous buffer solution
containing ~10 mM H2O2 to activate the enzymes (red) and aqueous buffer solution
containing ~10 mM KI (blue) for quenching.
4.2.3. Single molecule studies of KatG mutant
To further investigate the changes observed in the presence of H2O2, KatG
(C173A, C551A, C21S, S303C) mutant macromolecules (KatG mutant 2 from now on)
were exposed to ~100mM H2O2 in solution for ~15 min and then imaged in near native
conditions in the presence of ~30mM H2O2 in the imaging buffer. The height distribution
profile of these molecules is presented as a histogram in Figure 4.7, red. The main peak
in the height distribution at ~8nm that was present without H2O2 (Fig 4.7, black) largely
disappeared after H2O2 exposure. We provisionally attribute this shift observed in the
maximum height distribution after H2O2 exposure to a change in oligomeric state of the
KatG molecules.

70
Figure 4.7: Height histograms of KatG mutant 2 on mica before (black, N ~ 2200) and
after (Red, N ~ 2300) exposing to H2O2.
Further assays were designed to investigate if it was the pre-imaging incubation in
~100mM H2O2 in solution or the presence of ~30 mM H2O2 in imaging buffer that lead to
the vanishing of ~8nm peaks in the height distribution. To study this phenomenon, KatG
mutant 2 macromolecules were exposed to ~100mM H2O2 in solution for ~15 min and
then imaged in near native conditions in absence and presence of ~30mM H2O2 in the
imaging buffer. The height distribution profile of these molecules is presented as a
histogram in Figure 4.8. Clearly, exposing KatG mutant to H2O2 in solution reduces most
of the ~8nm population (Fig 4.8, red) and remaining small fraction of populations with
heights > 6 nm gets reduced when imaged in presence of ~30 mM H2O2. The FWHM of
the distributions increases from ~12 Å (Fig 4.8, red) to ~22 Å (Fig 4.8, green) when
imaged in presence of ~30 mM H2O2. Similar observations were made for the SecA
protein in presence of ATP (see chapter 3, Fig 3.9).
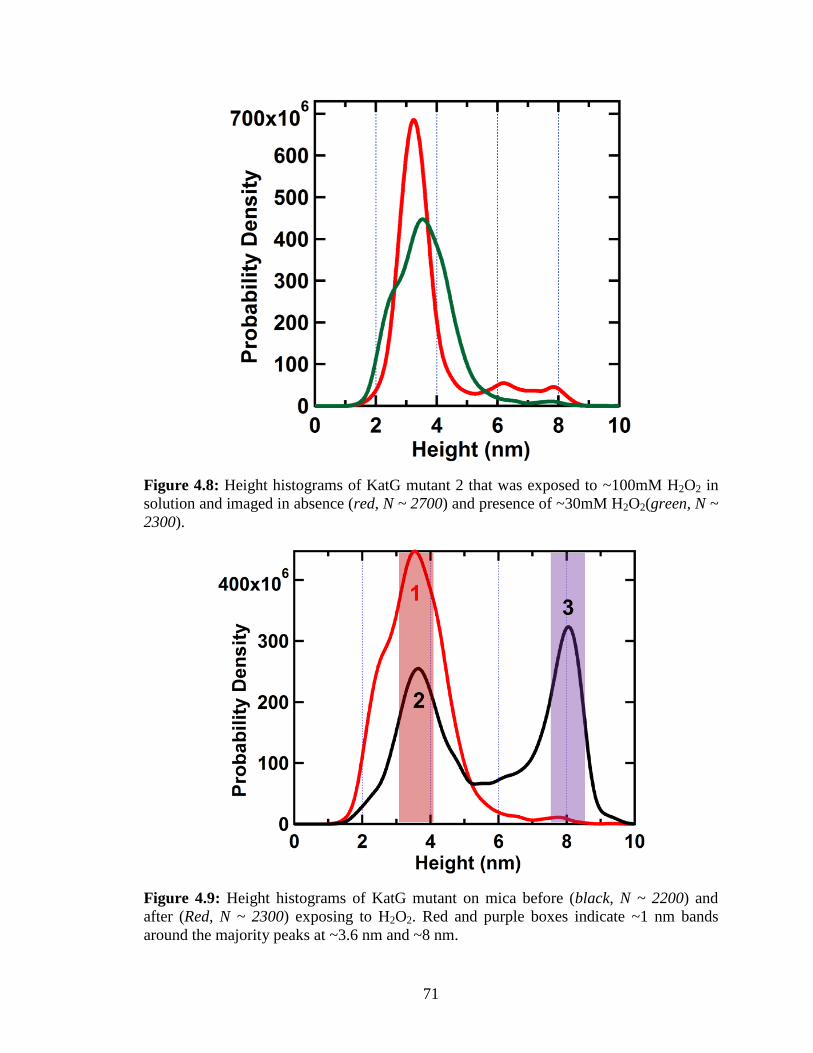
71
Figure 4.8: Height histograms of KatG mutant 2 that was exposed to ~100mM H2O2 in
solution and imaged in absence (red, N ~ 2700) and presence of ~30mM H2O2(green, N ~
2300).
Figure 4.9: Height histograms of KatG mutant on mica before (black, N ~ 2200) and
after (Red, N ~ 2300) exposing to H2O2. Red and purple boxes indicate ~1 nm bands
around the majority peaks at ~3.6 nm and ~8 nm.

72
Figure 4.10: Volume histograms of KatG mutant on mica from ~1 nm bands from figure
9, before (black) and after (Red) exposing to H2O2. Red and purple boxes indicate ~1 nm
bands around the prime peaks at ~3.6 nm and ~8 nm in the height histogram.
To further validate our assumption that the two majority peaks observed at ~3.6
nm and ~8 nm corresponds to different oligomeric states (see Fig. 4.7), we further
deconvolved the peaks by taking volume histograms of the features present within a 1 nm
bin width around the principle peaks (see Fig. 4.9 & 4.10). These bands correspond to
~42% (Fig. 4.9 & 4.10, peak 1), ~24% (Fig. 4.9 & 4.10, peak 2) and ~30% (Fig. 4.9 &
4.10, peak 3) of the corresponding height distributions. The volume of the features
corresponding to heights from peak 3 (i.e., Fig. 4.9 & 4.10, purple box) are > 3X higher
than that of the features corresponding to peaks 1 & 2 (i.e., Fig. 4.9 & 4.10, red box).
This clearly indicates an oligomeric state change of KatG mutant 2 when exposed to
H2O2. Similar observations of substrate induced oligomeric state changes have been
reported earlier for other enzymes163-165
.

73
4.2.4. Visualization of KatG mutant oligomeric state change at the single molecule
level
We followed individual KatG mutant molecules in the presence of ~30mM H2O2
in real space and real time to directly visualize conformations dynamics and oligomeric
state changes during catalysis. Figure 4.11 illustrates individual KatG mutants tracked
for ~510 s. During this observation period, at ~170 s, the volume and height of the
feature (dotted circle) reduces to approximately half, consistent with an oligomeric state
change. We take the small changes in height and volume observed from ~170 s to ~510 s
to be indications of conformational dynamics. Similar observations of real time
conformational dynamics and protein-protein interactions have been reported earlier
using AFM. 112,132,141,147
Figure 4.11: Tracking KatG mutant dynamics for over ~510 s reveals KatG mutant 2
disassociation in presence of ~30 mM H2O2. At t = 0 s the KatG mutants protrusion is
visualized on mica. ~170s later katG mutant dissociates as indicated by the significant
change in protrusion geometry (dotted circle).
4.2.5. Oligomeric state recovery in KatG mutants
To further investigate if the oligomeric state changes in KatG mutant are
reversible, KatG mutant 2 macromolecules were exposed to ~100mM H2O2 in solution
and imaged after ~15 min delay in solution or ~4hr delay in solution. Maximum height

74
and volume distributions of these assays are presented in Figure 4.12 and 4.13,
respectively. In both cases, height distributions are similar and there are two major
volume populations observed. Volumes of the two majority populations imaged after
~4hr delay in solution (Fig. 4.13, black) is ~2X that of the two major populations
observed after ~15 min delay. This is suggestive of an oligomeric state change. The KatG
mutant 2 appears to acquire a higher oligomeric state after all of the H2O2 is consumed
and the oligomeric state changes are reversible.
Figure 4.12: Height histograms of KatG mutant 2 that was exposed to ~100mM H2O2 in
solution and imaged in absence of H2O2 after ~15 min delay (red, N~2700) and ~4hr
delay (black, N~1800).

75
Figure 4.13: Height histograms of KatG mutant 2 that was exposed to ~100mM H2O2 in
solution and imaged in absence of H2O2 after ~15 min delay (red, N~2700) and ~4hr
delay (black, N~1800).
4.2.6. Single molecule KatG mutant studies in various H2O2 conditions
To further investigate H2O2 induced conformational dynamics and oligomeric state
changes, KatG mutant 2 macromolecules were subjected to four different H2O2 assays on
mica as follows:
(i) KatG mutant 2 not exposed to H2O2 after protein purification
(ii) KatG mutant 2 exposed to ~100mM H2O2 in solution for ~15 min and then imaged in
near native conditions in presence of 30mM H2O2 in the imaging buffer
(iii) KatG mutant 2 exposed to ~100mM H2O2 in solution for ~15 min and then imaged in
absence of H2O2 in the imaging buffer

76
(iv) KatG mutant 2 exposed to ~100mM H2O2 in solution for ~4hrs and then imaged in
near native conditions in absence of H2O2 in the imaging buffer
Figure 4.14 illustrates the height vs volume plots of the above cases. Clearly, the
KatG mutant 2 that is not exposed to H2O2 (panel a) exhibits a wide spread distribution
lacking a preferential oligomeric state. KatG mutant 2 that was exposed to H2O2 in
solution for ~15 min or ~4 hrs and imaged in absence of H2O2 (panel c & d) show two
well separated populations that indicate different oligomeric states. KatG mutant 2 that
was exposed to H2O2 in solution for ~15 min and imaged in presence of ~30mM H2O2
(panel b) exhibits a wide spread distribution indicating that the KatG mutants are highly
dynamic and undergoing conformational changes when imaged in presence of H2O2.
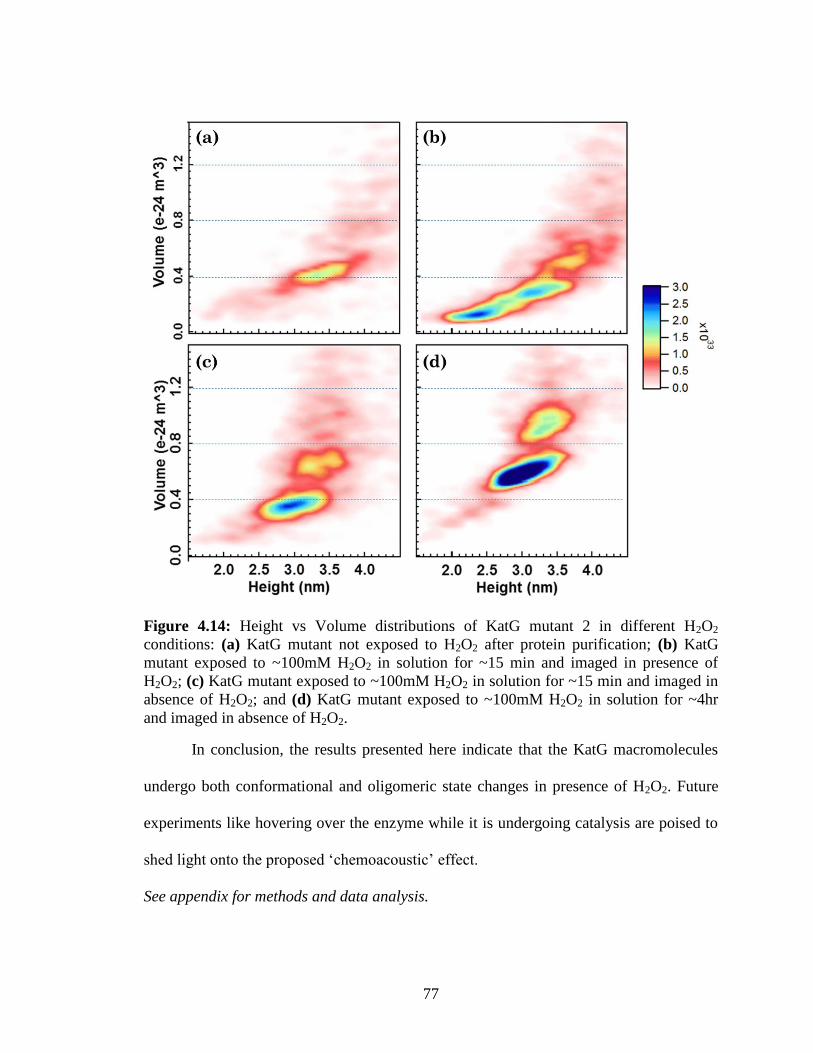
77
Figure 4.14: Height vs Volume distributions of KatG mutant 2 in different H2O2
conditions: (a) KatG mutant not exposed to H2O2 after protein purification; (b) KatG
mutant exposed to ~100mM H2O2 in solution for ~15 min and imaged in presence of
H2O2; (c) KatG mutant exposed to ~100mM H2O2 in solution for ~15 min and imaged in
absence of H2O2; and (d) KatG mutant exposed to ~100mM H2O2 in solution for ~4hr
and imaged in absence of H2O2.
In conclusion, the results presented here indicate that the KatG macromolecules
undergo both conformational and oligomeric state changes in presence of H2O2. Future
experiments like hovering over the enzyme while it is undergoing catalysis are poised to
shed light onto the proposed ‘chemoacoustic’ effect.
See appendix for methods and data analysis.

78
Chapter 5
5. Conclusions and Future Directions
I have successfully established glass as a substrate to study both crystalline and
non-crystalline membrane bound proteins using AFM. The results presented here broaden
the available substrates for precision measurements using biological AFM beyond mica
and open the door for combining powerful optical methods with scanning probe
techniques. One can envision novel experiments using US-AFM70
to capitalize on this
advance. The proposed hovering experiments will help to shed light on questions
involving mechanistic details of protein translocation, protein unfolding and enzyme
catalysis that are of fundamental and longstanding interest to the biophysics community.
5.1. Protein translocation
From studies of the Sec-translocase, it is evident that high resolution images can
be achieved and protein-protein interactions (e.g., association and dissociation events of
SecYEG/SecA) can be visualized on both glass and mica supports using atomic force
microscopy. Now with well-established protocols to image the SecYEG translocon alone
and in complex with ATPase SecA, new questions related to these highly dynamic
proteins of the general secretory pathway can be addressed. Using US-AFM, one can
hover an AFM tip over the Sec-translocase to garner a novel real-time, real-space vista
into this complex.
In the past decades, protocols have been well established by Dr. Randall’s group
to study the translocation of pre-protein chains into proteoliposomes and it is evident that
SecYEG-SecA complex remains competent for translocation in a reconstituted

79
proteoliposome system.111,166
Hovering an AFM tip over a Sec-translocase would be
futile if the membrane bound SecYEG-SecA complex deposited on glass substrate is not
active. But if the membrane-bound complexes are competent for translocation, that would
open doors for several single molecule experiments using US-AFM and other optical
techniques coupled to the AFM. Hence, experiments were performed to test the
translocation activity of SecYEG-SecA complex deposited on two substrates: glass and
mica.
5.1.1. Translocation assay of membrane bound SecYEG-SecA complex on glass
supports
Proteoliposomes are deposited onto glass and mica substrates and allowed to
rupture to form continuous bilayers. Radiolabeled precursor proOmpA, SecB, and ATP
generating system consisting of phosphocreatine and creatine phosphokinase are added to
the system and incubated at 30o C for 8 min for the translocation to occur (Fig 5.1a).
Proteinase K was added to digest the precursor that has not been translocated. Degraded
and untranslocated precursor was removed by a cycle of rinsing. Figure 5.1b shows the
radioactivity measurements. Glass exhibited enhanced activity of translocation (solid
line, red) as compared to mica (dotted line, black) in the presence of ATP (Fig 5.1c).
Activity in the absence of ATP is shown in violet as a control for the translocation
activity. The average roughness of the underlying glass topography (~170pm, 100x100
nm2) is greater compared to that of mica (~30 pm, 100x100 nm
2). Because lipid bilayers
can span local valleys on glass topography (Fig. 5.1a) we posit that the higher
translocation activity of precursor on glass is due to the fact that there is more space for it
to move into as compared to mica.

80
Figure 5.1: Translocation assay of radio-labeled precursor. (a) Schematic illustration of
translocation, (b) radioactivity measurements on glass with and without ATP, (c) plot
showing intensity vs position across mica/glass support in violet/red box in panel b.
activity of translocation in the presence of ATP on glass (red) and mica (dotted black).
Violet line shows the activity in the absence of ATP as a control.
Now, one can envision attaching a precursor protein to an US-AFM tip using well
established protocols167
and follow its translocation across membrane as illustrated in
Figure 5.2 and this type of experiment may be able to elucidate the mechanistic details
associated with protein translocation at single molecule level such as the real-time
translocation rate, pausing (if present), backsliding, etc.

81
Figure 5.2: Schematic illustrating protein translocation study.
5.2. BR pulling
From BR studies, it is evident that high resolution images can be achieved on
glass supports using atomic force microscopy. Now with well-established protocols to
image the BR, new questions related to protein unfolding pathways and energy
landscapes can be addressed. Using US-AFM, one can unfold and refold the protein in a
novel real-time, real-space manner (Fig. 5.3) and garner valuable knowledge into
intermediate states of unfolding and refolding pathways with unprecedented positional
precision168
.

82
Figure 5.3: Artistic illustration of protein unfolding experiment using AFM.
5.3. SecA conformational dynamics
From SecA ATP hydrolysis studies, it is evident that SecA is highly dynamic in
the presence of ATP. Kymograph studies clearly indicate SecA flickering between
compact and splayed conformational states with transitions on the ~ms time scale. These
studies were done by scanning in one dimension. Scanning in one dimension rather than
traditional two dimensions drastically improved temporal resolution of visualizing these
conformational dynamics. One can use US-AFM to achieve even better temporal
resolution (stop scanning altogether) by directly hovering an AFM tip over a fluctuating
domain, as illustrated in Figure 5.4.

83
Figure 5.4: Illustration showing a hovering tip to study conformational dynamics of
SecA.
5.4. Chemoacoustic effect
Figure 5.5: Illustration showing hovering of AFM tip to study the putative waves which
have been predicted to occur during enzyme catalysis.
Single molecule studies of catalase enzymes have indicated that the enzyme is
highly dynamic in presence of its substrate, H2O2. Reversible conformational changes

84
and an increase in the FWHM of the height distributions have been observed in single
molecule statistical studies. Using US-AFM one can envision an assay to directly observe
enzyme catalase during catalysis as shown in Figure 5.5. An AFM tip can be potentially
used as a “nanophone” to detect acoustic waves, to study the proposed ‘chemoacoustic’
model of enhanced enzyme diffusion.

85
APPENDIX
A. Glass is a viable substrate for Atomic Force Microscopy
Glass surface preparation: Glass coverslips purchased from Corning (18 × 18 mm, No.
1.5, catalog #: 2850-18) were used for the study. They were cleaned using KOH pellets
(Sigma Aldrich, catalog #: P5958) dissolved in absolute ethanol (Fisher Scientific,
catalog #: BP2818) as follows. Saturated KOH solution was prepared by mixing 90 g of
KOH in 350 ml of absolute ethanol. This mixture was stirred using a magnetic stirrer in a
1L beaker until the solution turned dark orange in color (~4 hrs). Home built Teflon
baskets were used to hold the glass cover slips along their periphery for treatment in the
saturated KOH solution for 3 min while immersed in a sonicator (Branson 5510).
Coverslips were then rinsed with deionized water (18.2 M*cm) using a squirt bottle and
transferred into a beaker to be sonicated in distilled deionized water for an additional 3
min twice, with rinsing in-between. Coverslips were then rinsed with 95% ethanol, dried
using ultra high purity nitrogen gas, and stored in a desiccator. Over several days surfaces
can lose their hydrophilicity.169
Thus, immediately before use, surfaces were plasma
cleaned to render them hydrophilic as described below.
AFM support design: Custom cut square coverslips (~ 13 X 13 mm) were attached to 12
mm diameter AFM specimen discs (TED PELLA, Product No. 16208) using epoxy
(Devcon, part #: 20845). Care was taken to uniformly distribute the epoxy between the
glass and specimen disc and to ensure it was devoid of air bubbles. Discs were left
overnight for the glue to harden. Immediately prior to use, the support assemblies were
plasma cleaned (Harrick Plasma PDC-001) in oxygen for 10 min at 250 mTorr using ~ 30

86
W forward RF power. The dimensions of glass coverslip were chosen to be slightly larger
than that of the specimen disc, which minimizes exposure of the epoxy to the plasma as
well as the imaging buffer solution.
SecYEG and SecA purification: The translocon, SecYEG, was purified from a strain
C43(DE3) suitable for over expression of membrane protein170
harboring a plasmid
encoding secY C329S, C385S, secE with an N terminal His-tag, and secG.171
Cells were
broken by passage through a French pressure cell (8,000psi), and the membranes were
isolated by centrifugation and solubilized in dodecyl-β-maltoside (DBM). SecYEG was
purified by chromatography, using a HisTrap column (GE Healthcare),and stored at −80
°C in 20 mM Tris-Cl at pH 8, 0.3 M NaCl, 10% (wt/vol) glycerol, 0.6 mM DBM, and 2
mM DTT. SecA was purified as described,172
with the following modifications: intact
washed cells were incubated on ice for 30 min with 8 mM EDTA to chelate Mg2+ in the
cell envelope. The cells were pelleted and washed twice to remove the EDTA before
being lysed by three cycles of freezing and thawing in the presence of lysozyme. The
removal of EDTA before lysis is crucial to prevent the extraction of zinc from SecA.
After centrifugation, SecA was purified from the supernatant by chromatography, using a
QAE (TosoHaas) column. The purified protein was dialyzed into 10 mM Hepes at pH
7.6, 0.3 M potassium acetate (KAc), 2 mM DTT, and stored at −80 °C. Concentrations of
the proteins were determined spectrophotometrically at 280 nm, using coefficients of
extinction as follows: SecA 78,900 M−1
·cm−1
; and SecYEG, 45,590 M−1
·cm−1
.
Proteoliposome preparation: Proteoliposomes were prepared as described
elsewhere.111,112
Lipids (E. coli polar lipid extract, Avanti) in chloroform were blown dry

87
with N2 and placed in a vacuum chamber overnight. A dry mechanical vacuum pump
(XDS5, Edwards) was used to prevent backstreaming of oil, a potential contaminant.
Dried lipids were suspended in 10 mM Hepes, pH 7.6, 30 mM KAc, 1 mM Mg(Ac)2.
Unilamellar liposomes were prepared by extrusion through membranes (~100 nm pore
diameter, Liposofast, Avestin). To form proteoliposomes the liposomes were swelled, but
not disrupted, using a ratio of detergent to lipids of 4.65 mM DBM to 5 mM lipids.173
After swelling for 3 h at room temperature, the proteins to be incorporated were added:
SecYEG at 5 µM, and for coassembly of SecA, SecA at 5 µM dimer. Incubation was
continued for 1 h at room temperature followed by addition of BioBeads SM-2 (BioRad)
to remove the detergent. The proteoliposomes were isolated by centrifugation at 436,000
x g, 20 min. at 4°C in a TL100.1 rotor (Beckman). The pellet was suspended in the same
buffer and centrifuged again as above. The final pellet was suspended to give a
concentration of approximately 8 mM lipid and 8 µM SecY. The suspension was stored
at -80°C.
Bacteriorhodopsin preparation: Halobacterium salinarum strain S9 was grown and the
purple membrane prepared as described.174
The isolated purple membrane was suspended
in distilled deionized water at 4.5 mg/ml bacteriorhodopsin. The concentration was
determined using the extinction coefficient of the retinal chromophore at 568 nm (
46.3 10 M−1
·cm−1
) and molecular weight 26,000 for the protein. This stock solution was
stored at -20 °C.
AFM imaging: All AFM images were acquired in recording buffer at ~30°C in tapping
mode using a commercial instrument (Asylum Research, Cypher). Care was taken to

88
control the magnitude of the tip sample force to ⪝ 100 pN (estimated by comparing the
free amplitude to the set point amplitude). Under such conditions, minimal protein
distortion is expected.108,175
Spring constants were determined using the thermal noise
method. Details for each sample preparation follow. Glass alone: The recording buffer
was 10mM HEPES pH 8.0, 200 mM KAc, 5mM MgAc2; the tip used for the data shown
in Fig. 10a & b was MSNL (Bruker) with spring constant ~0.4 N/m, a biolever mini (BL-
AC40TS, Olympus) was used for Fig. 10c-f with spring constant ~0.06 N/m.
Bacteriorhodopsin on glass: A solution was prepared by diluting bacteriorhodopsin to 45
µg/ml in 10 mM Tris, pH ~ 7.8, 300 mM KCl buffer. Equal volumes of this solution and
adsorption buffer (10 mM Tris, pH ~ 9.2, 700 mM KCl) were mixed before depositing
onto a freshly plasma cleaned glass support. After 1 hour incubation, the sample was
rinsed with 10 volumes of recording buffer (20 mM Tris pH ~ 8.5, 200 mM KCl, 20 mM
MgCl2). SNL (Veeco) tips with measured spring constant ~ 0.4 N/m were used. SecYEG
and SecYEG/SecA complexes on glass: Proteoliposome stock solutions were diluted to
80 nM SecYEG, 80 μM lipid in recording buffer (10mM HEPES pH 8.0, 200 mM KAc,
5mM MgAc2), immediately deposited on a freshly plasma cleaned glass support and
incubated for ~20 minutes, followed by rinsing with recording buffer. Biolever mini tips
(BL-AC40TS, Olympus) with measured spring constants ~ 0.06 N/m were used.
Bacteriorhodopsin on mica: Following established protocols,42
equal volumes of stock
solution and recording buffer (10 mM Tris pH ~ 7.6, 150 mM KCl) were mixed before
depositing onto a freshly cleaved mica support. After a 1 hr incubation, the sample was
rinsed with 10 volumes of recording buffer. SNL (Veeco) tips of measured spring
constant ~ 0.4 N/m were used.

89
Variability in glass surfaces: Some glass cover slips exhibit defects and a sparse
distribution of pits is a common defect mode. The presence of small holes in the
underlying supporting surface does not deleteriously effect the majority of topographic
determinations of membrane protein protrusions176
(Fig. 17).
Figure A 1: Glass substrates can accommodate membrane protein imaging in the
presence of defects. Glass cover slips can exhibit defects and a sparse distribution of pits
is a common defect mode. Panels a and b show different glass coverlips treated with
KOH solution as described in Methods. Though panel b exhibits a sparse distribution of
pits it can still be used to extract useful data. White boxes in panels a and b indicate 100
X 100 nm2 areas with rms roughness of 1.9 and 2.0 Å, respectively. Average rms
roughnesses are listed at the bottom right of panel a and b and were calculated over
100 × 100 nm2 non-overlapping areas, N ≥ 100; their standard deviations are 0.2 and 0.5
Å, respectively. Panel c shows a surface similar to panel b after deposition of liposomes
containing SecYEG. The inset shows an expanded view indicating that the presence of
holes in the underlying supporting surface does not interfere with topographic
determinations of many protein protrusions. The scale bar for panels a, b and c is 200 nm
and for the inset of panel c is 50 nm. Data was acquired in recording buffer (10mM
HEPES pH 8.0, 200 mM KAc, 5mM MgAc2). MSNL (Bruker) tips were used for panels
a & b, a biolever mini tip (BL-AC40TS, Olympus) was used for c.
AFM image analysis: As is typical, images were flattened (≤ 2nd
order) to minimize
background. To allow direct comparison of average root mean square (rms) roughness,
all roughness calculations were carried out on 100 × 100 nm2 non-overlapping areas
with the same pixel density (1.9 nm/pixel). Individual protein protrusions were cropped
using custom software (Igor Pro, WaveMetrics) and a flood mask of ~ 2 Å above the
lipid bilayer was applied to isolate protein protrusions. Software then extracted

90
topographical data of individual protein protrusions above the bilayer. For the data shown
in Fig. 15c and Fig. 16 we implemented tip deconvolution.177,178
The program used blind
tip estimation to determine the bluntest tip that could resolve the image. The generated tip
geometry was then removed from the image, outputting a deconvolved image that more
closely approximated the sample topography. Correlation averages (N = 100 iterations,
Fig. 13c; N = 200 iterations, Fig. 13g) and standard deviation maps (Fig. 14c & d) from
the correlation averages were generated using SPIP software (Image Metrology).
B. SecA ATP Hydrolysis
Atomic force microscopy: All AFM images were acquired in recording buffer at ~30°C
in tapping mode using a commercial instrument (Asylum Research, Cypher). Care was
taken to control the magnitude of the tip sample force to ⪝ 100 pN (estimated by
comparing the free amplitude to the set point amplitude). Under such conditions, minimal
protein distortion is expected179,180
. Spring constants were determined using the thermal
noise method. Biolever mini tips (BL-AC40TS, Olympus) with measured spring
constants ~ 0.06 N/m were used. In the presented experimental studies, protein was
diluted to 20 nM concentration in incubation buffer. Two different incubation buffer
conditions were used. No substrate (apo) conditions: 10mM HEPES pH 7.6, 100 mM
KAc, 5mM MgAc2 ; saturating nucleotide condtions: 10mM HEPES pH 7.6, 100 mM
KAc, 5mM MgAc2, 100μM nucleotide. Protein was incubated in solution for ~15 min in
solution to expose it to the corresponding nucleotide. A total of ~150μL of this solution
was deposited onto a freshly cleaved mica surface. After ~ 10 min incubation on mica,
sample was gently rinsed ~10 times with the imaging buffer. Proteins were imaged either

91
in 10mM HEPES pH 7.6, 100 mM KAc or in 10mM HEPES pH 7.6, 100 mM KAc,
100μM ATP as specified.
Data Analysis
Images were 1st order flattened to minimize mica background. Individual protein
protrusions were cropped using laboratory made routines in Igor pro (wave metrics) and
heights and areas of each molecule were calculated. For kymograph width distribution
histograms (figure 17), molecule width traces were analyzed by hand to avoid
misinterpretation of values due to noise. Magic plot software was used to do curve fitting.
C. Catalase enzyme dynamics
Atomic force microscopy: All AFM images were acquired in recording buffer at ~30°C
in tapping mode using a commercial instrument (Asylum Research, Cypher). Care was
taken to control the magnitude of the tip sample force to ⪝ 100 pN (estimated by
comparing the free amplitude to the set point amplitude). Under such conditions, minimal
protein distortion is expected179,180
. Spring constants were determined using the thermal
noise method. Biolever mini tips (BL-AC40TS, Olympus) with measured spring
constants ~ 0.06 N/m were used. In the presented experimental studies, protein was
diluted to 290 nM concentration in incubation buffer. Two different incubation buffer
conditions were used. No substrate (apo) conditions: 40mM HEPES pH 7.6, 1mM NiCl2 ;
substrate condtions: 40mM HEPES pH 7.6, 1mM NiCl2, 10 mM/30mM/100mM H2O2
nucleotide. Protein was incubated in solution for ~15 min in solution to expose it to the
H2O2. A total of ~150μL of this solution was deposited onto a freshly cleaved mica
92
surface. After ~ 10 min incubation on mica, sample was gently rinsed ~10 times with the
specified imaging buffer.
Data Analysis
Images were 1st order flattened to minimize mica background. Individual protein
protrusions were cropped using laboratory made routines in Igor pro (wave metrics) and
heights, volumes and areas of each molecule were calculated.

93
References
1 Selvin, P. R. & Ha, T. Single-Molecule Techniques. (Cold Spring Harbor Press,
2008).
2 Yildiz, A. et al. Myosin V walks hand-over-hand: single fluorophore imaging with
1.5-nm localization. Science 300, 2061-2065, doi:10.1126/science.1084398 (2003).
3 Yildiz, A. & Selvin, P. R. Fluorescence Imaging with One Nanometer Accuracy:
Application to Molecular Motors. Acc. Chem. Res. 38, 574 (2005).
4 Yildiz, A., Tomishige, M., Vale, R. D. & Selvin, P. R. Kinesin Walks Hand-Over-
Hand. Science 303, 676-678, doi:10.1126/science.1093753 (2004).
5 Bennig, G. K. (Google Patents, 1988).
6 Custance, O., Perez, R. & Morita, S. Atomic force microscope as a tool for atom
manipulation. Nature nanotechnology 4, 803-810 (2009).
7 Ha, T. Single-molecule fluorescence resonance energy transfer. Methods 25, 78-86
(2001).
8 Huang, B., Bates, M. & Zhuang, X. Super-resolution fluorescence microscopy. Annu
Rev Biochem 78, 993-1016, doi:10.1146/annurev.biochem.77.061906.092014 (2009).
9 Rico, F., Gonzalez, L., Casuso, I., Puig-Vidal, M. & Scheuring, S. High-Speed Force
Spectroscopy Unfolds Titin at the Velocity of Molecular Dynamics Simulations.
Science 342, 741-743 (2013).
10 Ha, T. Single-molecule methods leap ahead. Nat Meth 11, 1015-1018,
doi:10.1038/nmeth.3107 (2014).
11 Liu, S. et al. A Viral Packaging Motor Varies Its DNA Rotation and Step Size to
Preserve Subunit Coordination as the Capsid Fills. Cell 157, 702-713,
doi:http://dx.doi.org/10.1016/j.cell.2014.02.034 (2014).
12 del Rio, A. et al. Stretching Single Talin Rod Molecules Activates Vinculin Binding.
Science 323, 638-641 (2009).
13 Neuman, K. C. & Nagy, A. Single-molecule force spectroscopy: optical tweezers,
magnetic tweezers and atomic force microscopy. Nature Methods 5, 491-505,
doi:10.1038/nmeth.1218 (2008).
14 Papanikou, E., Karamanou, S. & Economou, A. Bacterial protein secretion through the
translocase nanomachine. Nat Rev Micro 5, 839-851 (2007).

94
15 Economou, A. Secretion by numbers: protein traffic in prokaryotes. Mol. Microbiol.
62, 308-319 (2006).
16 Holland, I. B. Translocation of bacterial proteins [mdash] an overview. Biochim.
Biophys. Acta 1694, 5-16 (2004).
17 Beckmann, R. Alignment of conduits for the nascent polypeptide chain in the
ribosome-Sec61 complex. Science 278, 2123-2126 (1997).
18 Beckmann, R. Architecture of the protein-conducting channel associated with the
translating 80S ribosome. Cell 107, 361-372 (2001).
19 Breyton, C., Haase, W., Rapoport, T. A., Kuhlbrandt, W. & Collinson, I. Three-
dimensional structure of the bacterial protein-translocation complex SecYEG. Nature
418, 662-665 (2002).
20 Hanein, D. Oligomeric rings of the Sec61p complex induced by ligands required for
protein translocation. Cell 87, 721-732 (1996).
21 Hunt, J. F. Nucleotide control of interdomain interactions in the conformational
reaction cycle of SecA. Science 297, 2018-2026 (2002).
22 Li, W. The plug domain of the SecY protein stabilizes the closed state of the
translocation channel and maintains a membrane seal. Mol. Cell 26, 511-521 (2007).
23 Manting, E. H., van Der Does, C., Remigy, H., Engel, A. & Driessen, A. J. SecYEG
assembles into a tetramer to form the active protein translocation channel. The EMBO
journal 19, 852-861, doi:10.1093/emboj/19.5.852 (2000).
24 Mitra, K. Structure of the E. coli protein-conducting channel bound to a translating
ribosome. Nature 438, 318-324 (2005).
25 Osborne, A. R., Clemons, W. M. & Rapoport, T. A. A large conformational change of
the translocation ATPase SecA. Proc. Natl Acad. Sci. USA 101, 10937-10942 (2004).
26 Papanikolau, Y. Structure of dimeric SecA, the Escherichia coli preprotein translocase
motor. J. Mol. Biol. 366, 1545-1557 (2007).
27 Scheuring, J. The oligomeric distribution of SecYEG is altered by SecA and
translocation ligands. J. Mol. Biol. 354, 258-271 (2005).
28 Sharma, V. Crystal structure of Mycobacterium tuberculosis SecA, a preprotein
translocating ATPase. Proc. Natl Acad. Sci. USA 100, 2243-2248 (2003).
29 Van den Berg, B. X-ray structure of a protein-conducting channel. Nature 427, 36-44
(2004).

95
30 Vassylyev, D. G. Crystal structure of the translocation ATPase SecA from Thermus
thermophilus reveals a parallel, head-to-head dimer. J. Mol. Biol. 364, 248-258 (2006).
31 Zimmer, J., Li, W. & Rapoport, T. A. A novel dimer interface and conformational
changes revealed by an X-ray structure of B. subtilis SecA. J. Mol. Biol. 364, 259-265
(2006).
32 Randall, L. L. & Hardy, S. J. SecB, one small chaperone in the complex milieu of the
cell. Cell. Mol. Life Sci. 59, 1617-1623 (2002).
33 Ullers, R. S. SecB is a bona fide generalized chaperone in Escherichia coli. Proc. Natl
Acad. Sci. USA 101, 7583-7588 (2004).
34 Randall, L. L. & Hardy, S. J. S. Correlation of competence for export with lack of
tertiary structure of the mature species: A study in vivo of maltose-binding protein in
E. coli. Cell 46, 921-928, doi:http://dx.doi.org/10.1016/0092-8674(86)90074-7 (1986).
35 Liu, G., Topping, T. B. & Randall, L. L. Physiological role during export for the
retardation of folding by the leader peptide of maltose-binding protein. Proceedings of
the National Academy of Sciences of the United States of America 86, 9213-9217
(1989).
36 Randall, L. L. Translocation of domains of nascent periplasmic proteins across the
cytoplasmic membrane is independent of elongation. Cell 33, 231-240 (1983).
37 Hartl, F. U., Lecker, S., Schiebel, E., Hendrick, J. P. & Wickner, W. The binding
cascade of SecB to SecA to SecY/E mediates preprotein targeting to the E. coli plasma
membrane. Cell 63, 269-279 (1990).
38 Paetzel, M., Karla, A., Strynadka, N. C. & Dalbey, R. E. Signal peptidases. Chem.
Rev. 102, 4549-4580 (2002).
39 Gruber, C. W., Cemazar, M., Heras, B., Martin, J. L. & Craik, D. J. Protein disulfide
isomerase: the structure of oxidative folding. Trends Biochem. Sci. 31, 455-464
(2006).
40 Mogensen, J. E. & Otzen, D. E. Interactions between folding factors and bacterial
outer membrane proteins. Mol. Microbiol. 57, 326-346 (2005).
41 Nakamoto, H. & Bardwell, J. C. Catalysis of disulfide bond formation and
isomerization in the Escherichia coli periplasm. Biochim. Biophys. Acta 1694, 111-119
(2004).
42 Muller, D. J. & Engel, A. Atomic force microscopy and spectroscopy of native
membrane proteins. Nat. Protocols 2, 2191-2197 (2007).

96
43 Bippes, C. A. & Muller, D. J. High-resolution atomic force microscopy and
spectroscopy of native membrane proteins. Reports on Progress in Physics 74,
086601, doi:10.1088/0034-4885/74/8/086601 (2011).
44 Braga, P. C. & Ricci, D. Atomic Force Microscopy: Biomedical Methods and
Applications. (Humana Press, 2004).
45 Butt, H. J., Downing, K. H. & Hansma, P. K. Imaging the membrane protein
bacteriorhodopsin with the atomic force microscope. Biophysical journal 58, 1473-
1480, doi:10.1016/S0006-3495(90)82492-9 (1990).
46 Möller, C., Allen, M., Elings, V., Engel, A. & Müller, D. J. Tapping-Mode Atomic
Force Microscopy Produces Faithful High-Resolution Images of Protein Surfaces.
Biophysical journal 77, 1150-1158, doi:http://dx.doi.org/10.1016/S0006-
3495(99)76966-3 (1999).
47 Shibata, M., Yamashita, H., Uchihashi, T., Kandori, H. & Ando, T. High-speed atomic
force microscopy shows dynamic molecular processes in photoactivated
bacteriorhodopsin. Nature nanotechnology 5, 208-212, doi:10.1038/nnano.2010.7
(2010).
48 Kimura, Y. et al. Surface of bacteriorhodopsin revealed by high-resolution electron
crystallography. Nature 389, 206-211 (1997).
49 Luecke, H., Schobert, B., Richter, H.-T., Cartailler, J.-P. & Lanyi, J. K. Structure of
bacteriorhodopsin at 1.55 Å resolution 1. Journal of Molecular Biology 291, 899-911,
doi:http://dx.doi.org/10.1006/jmbi.1999.3027 (1999).
50 Berg JM, T. J., Stryer L. Biochemistry. 6 edn, (W.H. Freeman and Company, New
York, 2007).
51 AB, N. M. The Nobel Prize in Chemistry 1989,
<http://www.nobelprize.org/nobel_prizes/chemistry/laureates/1989/> (
52 Radzicka, A. & Wolfenden, R. A proficient enzyme. Science 267, 90-93 (1995).
53 Switala, J. & Loewen, P. C. Diversity of properties among catalases. Archives of
Biochemistry and Biophysics 401, 145-154, doi:http://dx.doi.org/10.1016/S0003-
9861(02)00049-8 (2002).
54 Nicholls, P., Fita, I. & Loewen, P. C. in Advances in Inorganic Chemistry Vol.
Volume 51 51-106 (Academic Press, 2000).
55 Fita, I., Silva, A. M., Murthy, M. R. N. & Rossmann, M. G. The refined structure of
beef liver catalase at 2.5 A resolution. Acta Crystallographica Section B 42, 497-515,
doi:doi:10.1107/S0108768186097835 (1986).

97
56 Murthy, M. R. N., Reid Iii, T. J., Sicignano, A., Tanaka, N. & Rossmann, M. G.
Structure of beef liver catalase. Journal of Molecular Biology 152, 465-499,
doi:http://dx.doi.org/10.1016/0022-2836(81)90254-0 (1981).
57 Vainshtein, B. K. et al. Three-dimensional structure of catalase from Penicillium vitale
at 2.0 Å resolution. Journal of Molecular Biology 188, 49-61,
doi:http://dx.doi.org/10.1016/0022-2836(86)90479-1 (1986).
58 Vainshtein, B. K., Melik-Adamyan, W. R., Barynin, V. V., Vagin, A. A. & Grebenko,
A. I. Three-dimensional structure of the enzyme catalase. Nature 293, 411-412 (1981).
59 Murshudov, G. N. et al. Three-dimensional structure of catalase from Micrococcus
lysodeikticus at 1.5 Å resolution. FEBS letters 312, 127-131,
doi:http://dx.doi.org/10.1016/0014-5793(92)80919-8 (1992).
60 Gouet, P., Jouve, H.-M. & Dideberg, O. Crystal Structure ofProteus mirabilisPR
Catalase With and Without Bound NADPH. Journal of Molecular Biology 249, 933-
954, doi:http://dx.doi.org/10.1006/jmbi.1995.0350 (1995).
61 Bravo, J. et al. Crystal structure of catalase HPII from Escherichia coli. Structure 3,
491-502, doi:http://dx.doi.org/10.1016/S0969-2126(01)00182-4 (1995).
62 Bravo, J. et al. Structure of catalase HPII from Escherichia coli at 1.9 Å Resolution.
Proteins: Structure, Function and Genetics 34, 155-166, doi:10.1002/(SICI)1097-
0134(19990201)34:2<155::AID-PROT1>3.0.CO;2-P (1999).
63 Berthet, S. et al. Crystallization and preliminary structural analysis of catalase A from
Saccharomyces cerevisiae. Protein Science 6, 481-483 (1997).
64 Maté, M. J. et al. Structure of catalase-A from Saccharomyces cerevisiae1. Journal of
Molecular Biology 286, 135-149, doi:http://dx.doi.org/10.1006/jmbi.1998.2453
(1999).
65 Ko, T.-P. et al. Structure of human erythrocyte catalase. Acta Crystallographica
Section D 56, 241-245, doi:doi:10.1107/S0907444999015930 (2000).
66 Putnam, C. D., Arvai, A. S., Bourne, Y. & Tainer, J. A. Active and inhibited human
catalase structures: ligand and NADPH binding and catalytic mechanism1. Journal of
Molecular Biology 296, 295-309, doi:http://dx.doi.org/10.1006/jmbi.1999.3458
(2000).
67 Bertrand, T. et al. Crystal Structure of Mycobacterium tuberculosis Catalase-
Peroxidase. Journal of Biological Chemistry 279, 38991-38999 (2004).

98
68 Karrasch, S., Dolder, M., Schabert, F., Ramsden, J. & Engel, A. Covalent binding of
biological samples to solid supports for scanning probe microscopy in buffer solution.
Biophysical journal 65, 2437-2446, doi:10.1016/S0006-3495(93)81327-4 (1993).
69 Karrasch, S., Hegerl, R., Hoh, J. H., Baumeister, W. & Engel, A. Atomic force
microscopy produces faithful high-resolution images of protein surfaces in an aqueous
environment. Proceedings of the National Academy of Sciences of the United States of
America 91, 836-838 (1994).
70 King, G. M., Carter, A. R., Churnside, A. B., Eberle, L. S. & Perkins, T. T. Ultrastable
atomic force microscopy: atomic-scale stability and registration in ambient conditions.
Nano letters 9, 1451-1456, doi:10.1021/nl803298q (2009).
71 Zimmermann, J. L., Nicolaus, T., Neuert, G. & Blank, K. Thiol-based, site-specific
and covalent immobilization of biomolecules for single-molecule experiments. Nat.
Protocols 5, 975-985 (2010).
72 Reifenberger, R. Fundamentals of Atomic Force Microscopy, Part 1: Foundations.
Vol. 4 (World Scientific, 2016).
73 Hutter, J. L. & Bechhoefer, J. Calibration of atomic‐force microscope tips. Review of
Scientific Instruments 64, 1868-1873, doi:doi:http://dx.doi.org/10.1063/1.1143970
(1993).
74 Schimmel, T., Koch, T., Küppers, J. & Lux-Steiner, M. True atomic resolution under
ambient conditions obtained by atomic force microscopy in the contact mode. Appl
Phys A 68, 399-402, doi:10.1007/s003390050912 (1999).
75 Ohnesorge, F. & Binnig, G. True atomic resolution by atomic force microscopy
through repulsive and attractive forces. Science 260, 1451-1456,
doi:10.1126/science.260.5113.1451 (1993).
76 Ando, T. et al. A High-speed Atomic Force Microscope for Studying Biological
Macromolecules in Action. Chemphyschem : a European journal of chemical physics
and physical chemistry 4, 1196-1202, doi:10.1002/cphc.200300795 (2003).
77 Ando, T., Uchihashi, T. & Fukuma, T. High-speed atomic force microscopy for nano-
visualization of dynamic biomolecular processes. Progress in Surface Science 83, 337-
437, doi:http://dx.doi.org/10.1016/j.progsurf.2008.09.001 (2008).
78 Fantner, G. E. et al. Components for high speed atomic force microscopy.
Ultramicroscopy 106, 881-887, doi:http://dx.doi.org/10.1016/j.ultramic.2006.01.015
(2006).
79 Hansma, P. K., Schitter, G., Fantner, G. E. & Prater, C. High-Speed Atomic Force
Microscopy. Science 314, 601-602, doi:10.1126/science.1133497 (2006).

99
80 Carter, A. R., King, G. M. & Perkins, T. T. Back-scattered detection provides atomic-
scale localization precision, stability, and registration in 3D. Optics express 15, 13434-
13445, doi:10.1364/OE.15.013434 (2007).
81 Engel, A. & Gaub, H. E. Structure and mechanics of membrane proteins. Annu Rev
Biochem 77, 127-148, doi:10.1146/annurev.biochem.77.062706.154450 (2008).
82 Bippes, C. & Müller, D. High-resolution atomic force microscopy and spectroscopy of
native membrane proteins Rep. Prog. Phys. 74, 086601 (2011).
83 Luckey, M. Membrane Structural Biology. (Cambridge University Press, 2008).
84 Müller, D. J. & Dufrêne, Y. F. Atomic force microscopy as a multifunctional
molecular toolbox in nanobiotechnology. Nature nanotechnology 3, 261-269,
doi:10.1038/nnano.2008.100 (2008).
85 Hertzberg, R. P. & Pope, A. J. High-throughput screening: new technology for the
21st century. Curr Opin Chem Biol 4, 445-451 (2000).
86 Gould, T. J., Hess, S. T. & Bewersdorf, J. Optical nanoscopy: from acquisition to
analysis. Annual review of biomedical engineering 14, 231-254, doi:10.1146/annurev-
bioeng-071811-150025 (2012).
87 Putman, C. A. J., Hansma, H., Gaub, H. E. & Hansma, P. K. Polymerized LB Films
Imaged with a Combined Atomic Force Microscope-Fluorescence Microscope.
Langmuir 8, 3014, doi:10.1021/la00048a027 (1992).
88 Peng, L., Stephens, B. J., Bonin, K., Cubicciotti, R. & Guthold, M. A combined
atomic force/fluorescence microscopy technique to select aptamers in a single cycle
from a small pool of random oligonucleotides. Microscopy research and technique 70,
372-381, doi:10.1002/jemt.20421 (2007).
89 King, G. M., Carter, A. R., Churnside, A. B., Eberle, L. S. & Perkins, T. T. Ultrastable
atomic force microscopy: atomic-scale stability and registration in ambient conditions.
Nano letters 9, 1451, doi:10.1021/nl803298q (2009).
90 Gumpp, H., Stahl, S. W., Strackharn, M., Puchner, E. M. & Gaub, H. E. Ultrastable
combined atomic force and total internal reflection fluorescence microscope. Rev Sci
Instrum 80, 063704, doi:10.1063/1.3148224 (2009).
91 Churnside, A. B., King, G. M. & Perkins, T. T. Label-free optical imaging of
membrane patches for atomic force microscopy. Optics express 18, 23924 (2010).
92 Li, H., Yen, C. F. & Sivasankar, S. Fluorescence axial localization with nanometer
accuracy and precision. Nano letters 12, 3731-3735, doi:10.1021/nl301542c (2012).

100
93 Fukuda, S. et al. High-speed atomic force microscope combined with single-molecule
fluorescence microscope. Rev Sci Instrum 84, 073706, doi:10.1063/1.4813280 (2013).
94 Sigdel, K. P., Grayer, J. S. & King, G. M. Three-dimensional atomic force
microscopy: interaction force vector by direct observation of tip trajectory. Nano
letters 13, 5106-5111, doi:10.1021/nl403423p (2013).
95 Baumann, F., Heucke, S. F., Pippig, D. A. & Gaub, H. E. Tip localization of an atomic
force microscope in transmission microscopy with nanoscale precision. Rev Sci
Instrum 86, 035109, doi:10.1063/1.4915145 (2015).
96 Nugent-Glandorf, L. & Perkins, T. T. Measuring 0.1-nm motion in 1 ms in an optical
microscope with differential back-focal-plane detection. Opt. Lett. 29, 2611-2613
(2004).
97 Carter, A. R. et al. Stabilization of an optical microscope to 0.1 nm in three
dimensions. Appl. Opt. 46, 421-427 (2007).
98 Ando, T., Uchihashi, T. & Kodera, N. High-speed AFM and applications to
biomolecular systems. Annual review of biophysics 42, 393-414, doi:10.1146/annurev-
biophys-083012-130324 (2013).
99 Pyne, A., Thompson, R., Leung, C., Roy, D. & Hoogenboom, B. W. Single-molecule
reconstruction of oligonucleotide secondary structure by atomic force microscopy.
Small 10, 3257-3261, doi:10.1002/smll.201400265 (2014).
100 Müller, D. J. & Engel, A. Voltage and pH-induced channel closure of porin OmpF
visualized by atomic force microscopy. J Mol Biol 285, 1347-1351,
doi:10.1006/jmbi.1998.2359 (1999).
101 Goncalves, R. P. et al. Two-chamber AFM: probing membrane proteins
separating two aqueous compartments. Nat Methods 3, 1007-1012,
doi:10.1038/nmeth965 (2006).
102 Cisneros, D. A., Müller, D. J., Daud, S. M. & Lakey, J. H. An approach to prepare
membrane proteins for single-molecule imaging. Angew Chem Int Ed Engl 45, 3252-
3256, doi:10.1002/anie.200504506 (2006).
103 Alessandrini, A. & Facci, P. Phase transitions in supported lipid bilayers studied
by AFM. Soft Matter 10, 7145-7164, doi:Doi 10.1039/C4sm01104j (2014).
104 Seidel, H., Csepregi, L., Heuberger, A. & Baumgartel, H. Anisotropic Etching of
Crystalline Silicon in Alkaline Solutions. J. Electrochem. Soc. 137, 3612-3626 (1990).
105 Williams, K. R. & Muller, R. S. Etch rates for micromachining processing. J
Microelectromech S 5, 256-269, doi:Doi 10.1109/84.546406 (1996).

101
106 Helfrich, W. Out-of-plane fluctuations of lipid bilayers. Zeitschrift fur
Naturforschung. Section C: Biosciences 30, 841-842 (1975).
107 Möller, C., Allen, M., Elings, V., Engel, A. & Müller, D. J. Tapping-mode atomic
force microscopy produces faithful high-resolution images of protein surfaces.
Biophysical journal 77, 1150-1158, doi:10.1016/S0006-3495(99)76966-3 (1999).
108 Müller, D. J., Buldt, G. & Engel, A. Force-Induced Conformational Change of
Bacteriorhodopsin. Journal of Molecular Biology 249, 239-243, doi:DOI
10.1006/jmbi.1995.0292 (1995).
109 Muller, D. J., Fotiadis, D. & Engel, A. Mapping flexible protein domains at
subnanometer resolution with the atomic force microscope. FEBS letters 430, 105-111
(1998).
110 Müller, D. J., Büldt, G. & Engel, A. Force-induced conformational change of
bacteriorhodopsin. Journal of Molecular Biology 249, 239-243,
doi:http://dx.doi.org/10.1006/jmbi.1995.0292 (1995).
111 Mao, C. et al. Stoichiometry of SecYEG in the active translocase of Escherichia
coli varies with precursor species. Proceedings of the National Academy of Sciences of
the United States of America 110, 11815-11820, doi:10.1073/pnas.1303289110
(2013).
112 Sanganna Gari, R. R., Frey, N. C., Mao, C., Randall, L. L. & King, G. M.
Dynamic structure of the translocon SecYEG in membrane: direct single molecule
observations. The Journal of biological chemistry 288, 16848-16854,
doi:10.1074/jbc.M113.471870 (2013).
113 Van den Berg, B. et al. X-ray structure of a protein-conducting channel. Nature
427, 36-44, doi:10.1038/nature02218 (2004).
114 Tsirigotaki, A., De Geyter, J., Sostaric, N., Economou, A. & Karamanou, S.
Protein export through the bacterial Sec pathway. Nat Rev Micro 15, 21-36,
doi:10.1038/nrmicro.2016.161
http://www.nature.com/nrmicro/journal/v15/n1/abs/nrmicro.2016.161.html#supplementar
y-information (2017).
115 Prabudiansyah, I. & Driessen, A. J. M. in Protein and Sugar Export and Assembly
in Gram-positive Bacteria (eds Fabio Bagnoli & Rino Rappuoli) 45-67 (Springer
International Publishing, 2017).
116 Orfanoudaki, G. & Economou, A. Proteome-wide Subcellular Topologies of E.
coli Polypeptides Database (STEPdb). Molecular & Cellular Proteomics 13, 3674-
3687, doi:10.1074/mcp.O114.041137 (2014).

102
117 Cunningham, K. et al. SecA protein, a peripheral protein of the Escherichia coli
plasma membrane, is essential for the functional binding and translocation of
proOmpA. The EMBO Journal 8, 955-959 (1989).
118 Keramisanou, D. et al. Disorder-order folding transitions underlie catalysis in the
helicase motor of SecA. 13, 594, doi:10.1038/nsmb1108
https://www.nature.com/articles/nsmb1108#supplementary-information (2006).
119 Chada, N. et al. Glass is a Viable Substrate for Precision Force Microscopy of
Membrane Proteins. 5, 12550, doi:10.1038/srep12550
https://www.nature.com/articles/srep12550#supplementary-information (2015).
120 Gouridis, G. et al. Quaternary Dynamics of the SecA Motor Drive Translocase
Catalysis. Molecular Cell 52, 655-666,
doi:https://doi.org/10.1016/j.molcel.2013.10.036 (2013).
121 Zimmer, J., Nam, Y. & Rapoport, T. A. Structure of a complex of the ATPase
SecA and the protein-translocation channel. Nature 455, 936-943,
doi:http://www.nature.com/nature/journal/v455/n7215/suppinfo/nature07335_S1.html
(2008).
122 Bauer, Benedikt W., Shemesh, T., Chen, Y. & Rapoport, Tom A. A “Push and
Slide” Mechanism Allows Sequence-Insensitive Translocation of Secretory Proteins
by the SecA ATPase. Cell 157, 1416-1429,
doi:https://doi.org/10.1016/j.cell.2014.03.063 (2014).
123 Schiebel, E., Driessen, A. J. M., Hartl, F.-U. & Wickner, W. ΔμH+ and ATP
function at different steps of the catalytic cycle of preprotein translocase. Cell 64, 927-
939, doi:https://doi.org/10.1016/0092-8674(91)90317-R (1991).
124 Allen, W. J. et al. Two-way communication between SecY and SecA suggests a
Brownian ratchet mechanism for protein translocation. Elife 5, doi:ARTN e15598
10.7554/eLife.15598 (2016).
125 Liang, F.-C., Bageshwar, U. K. & Musser, S. M. Bacterial Sec Protein Transport
Is Rate-limited by Precursor Length: A Single Turnover Study. Molecular Biology of
the Cell 20, 4256-4266, doi:10.1091/mbc.E09-01-0075 (2009).
126 Li, L. et al. Crystal structure of a substrate-engaged SecY protein-translocation
channel. Nature 531, 395-399, doi:10.1038/nature17163
http://www.nature.com/nature/journal/v531/n7594/abs/nature17163.html#supplementary-
information (2016).

103
127 Sharma, V. et al. Crystal structure of Mycobacterium tuberculosis SecA, a
preprotein translocating ATPase. Proceedings of the National Academy of Sciences of
the United States of America 100, 2243-2248, doi:10.1073/pnas.0538077100 (2003).
128 Vassylyev, D. G. et al. Crystal Structure of the Translocation ATPase SecA from
Thermus thermophilus Reveals a Parallel, Head-to-Head Dimer. J Mol Biol 364, 248-
258, doi:https://doi.org/10.1016/j.jmb.2006.09.061 (2006).
129 Zimmer, J., Li, W. & Rapoport, T. A. A novel dimer interface and conformational
changes revealed by an X-ray structure of B. subtilis SecA. J Mol Biol 364, 259-265,
doi:10.1016/j.jmb.2006.08.044 (2006).
130 Papanikolau, Y. et al. Structure of Dimeric SecA, the Escherichia coli Preprotein
Translocase Motor. J Mol Biol 366, 1545-1557,
doi:https://doi.org/10.1016/j.jmb.2006.12.049 (2007).
131 Binnig, G., Quate, C. F. & Gerber, C. Atomic force microscope. Physical review
letters 56, 930-933 (1986).
132 Ruan, Y. et al. Direct visualization of glutamate transporter elevator mechanism
by high-speed AFM. Proceedings of the National Academy of Sciences of the United
States of America 114, 1584-1588, doi:10.1073/pnas.1616413114 (2017).
133 Fak, J. J. Nucleotide exchange from the high-affinity ATP-binding site in SecA is
the rate-limiting step in the ATPase cycle of the soluble enzyme and occurs through a
specialized conformational state. Biochemistry 43, 7307-7327 (2004).
134 Pelz, B., Žoldák, G., Zeller, F., Zacharias, M. & Rief, M. Subnanometre enzyme
mechanics probed by single-molecule force spectroscopy. 7, 10848,
doi:10.1038/ncomms10848
https://www.nature.com/articles/ncomms10848#supplementary-information (2016).
135 Zimmer, J. & Rapoport, T. A. Conformational flexibility of the ATPase SecA
enables peptide interaction and translocation. J Mol Biol 394, 606-612,
doi:10.1016/j.jmb.2009.10.024 (2009).
136 Chen, Y., Bauer, B. W., Rapoport, T. A. & Gumbart, J. C. Conformational
changes of the clamp of the protein translocation ATPase SecA. J Mol Biol 427, 2348-
2359, doi:10.1016/j.jmb.2015.05.003 (2015).
137 Papanikou, E. et al. Identification of the Preprotein Binding Domain of SecA. J
Biol Chem 280, 43209-43217, doi:10.1074/jbc.M509990200 (2005).
138 Cooper, D. B. et al. SecA, the motor of the secretion machine, binds diverse
partners on one interactive surface. J Mol Biol 382, 74-87 (2008).

104
139 Mori, H. & Ito, K. The Long α-Helix of SecA Is Important for the ATPase
Coupling of Translocation. J Biol Chem 281, 36249-36256,
doi:10.1074/jbc.M606906200 (2006).
140 Chen, B. et al. ATP ground- and transition-states of bacterial enhancer binding
AAA+ ATPases support complex formation with their target protein, σ54. Structure
(London, England : 1993) 15, 429-440, doi:10.1016/j.str.2007.02.007 (2007).
141 Rangl, M. et al. Real-time visualization of conformational changes within single
MloK1 cyclic nucleotide-modulated channels. 7, 12789, doi:10.1038/ncomms12789
https://www.nature.com/articles/ncomms12789#supplementary-information (2016).
142 Hingorani, K. S. et al. Ligand-promoted protein folding by biased kinetic
partitioning. Nature Chemical Biology 13, 369, doi:10.1038/nchembio.2303
https://www.nature.com/articles/nchembio.2303#supplementary-information (2017).
143 Delalande, O., Sacquin-Mora, S. & Baaden, M. Enzyme Closure and Nucleotide
Binding Structurally Lock Guanylate Kinase. Biophysical Journal 101, 1440-1449,
doi:10.1016/j.bpj.2011.07.048 (2011).
144 Xing, J. et al. Kinesin Has Three Nucleotide-dependent Conformations:
IMPLICATIONS FOR STRAIN-DEPENDENT RELEASE. J Biol Chem 275, 35413-
35423, doi:10.1074/jbc.M004232200 (2000).
145 Arnal, I. & Wade, R. H. Nucleotide-dependent conformations of the kinesin dimer
interacting with microtubules. Structure 6, 33-38, doi:https://doi.org/10.1016/S0969-
2126(98)00005-7 (1998).
146 Schuller, J. M., Beck, F., Lössl, P., Heck, A. J. R. & Förster, F. Nucleotide-
dependent conformational changes of the AAA+ ATPase p97 revisited. FEBS Letters
590, 595-604, doi:10.1002/1873-3468.12091 (2016).
147 Viani, M. B. et al. Probing protein-protein interactions in real time. Nat Struct
Biol 7, 644-647 (2000).
148 Fischer, E. Einfluss der Configuration auf die Wirkung der Enzyme. Berichte der
deutschen chemischen Gesellschaft 27, 2985-2993, doi:10.1002/cber.18940270364
(1894).
149 Wand, A. J. Biophysics: Enzymes surf the heat wave. Nature 517, 149-150,
doi:10.1038/nature14079 (2015).
150 Riedel, C. et al. The heat released during catalytic turnover enhances the diffusion
of an enzyme. Nature 517, 227-230, doi:10.1038/nature14043
105
http://www.nature.com/nature/journal/v517/n7533/abs/nature14043.html#supplementary-
information (2015).
151 Muddana, H. S., Sengupta, S., Mallouk, T. E., Sen, A. & Butler, P. J. Substrate
Catalysis Enhances Single-Enzyme Diffusion. Journal of the American Chemical
Society 132, 2110-2111, doi:10.1021/ja908773a (2010).
152 Sengupta, S. et al. Enzyme Molecules as Nanomotors. Journal of the American
Chemical Society 135, 1406-1414, doi:10.1021/ja3091615 (2013).
153 Paxton, W. F., Sundararajan, S., Mallouk, T. E. & Sen, A. Chemical Locomotion.
Angewandte Chemie International Edition 45, 5420-5429,
doi:10.1002/anie.200600060 (2006).
154 Bai, X. & Wolynes, P. G. On the hydrodynamics of swimming enzymes. The
Journal of Chemical Physics 143, 165101, doi:10.1063/1.4933424 (2015).
155 Brinkmann, L. U. L. & Hub, J. S. Ultrafast anisotropic protein quake propagation
after CO photodissociation in myoglobin. Proceedings of the National Academy of
Sciences 113, 10565-10570, doi:10.1073/pnas.1603539113 (2016).
156 Bruinsma, R., Grosberg, Alexander Y., Rabin, Y. & Zidovska, A. Chromatin
Hydrodynamics. Biophysical Journal 106, 1871-1881, doi:10.1016/j.bpj.2014.03.038
(2014).
157 Golestanian, R. Enhanced Diffusion of Enzymes that Catalyze Exothermic
Reactions. Physical review letters 115, 108102 (2015).
158 Hwang, W. & Hyeon, C. Quantifying the Heat Dissipation from a Molecular
Motor’s Transport Properties in Nonequilibrium Steady States. The Journal of
Physical Chemistry Letters 8, 250-256, doi:10.1021/acs.jpclett.6b02657 (2017).
159 Weber, S. C., Spakowitz, A. J. & Theriot, J. A. Nonthermal ATP-dependent
fluctuations contribute to the in vivo motion of chromosomal loci. Proceedings of the
National Academy of Sciences 109, 7338-7343, doi:10.1073/pnas.1119505109 (2012).
160 Eisenmesser, E. Z., Bosco, D. A., Akke, M. & Kern, D. Enzyme Dynamics
During Catalysis. Science 295, 1520 (2002).
161 Radmacher, M., Fritz, M., Hansma, H. G. & Hansma, P. K. Direct observation of
enzyme activity with the atomic force microscope. Science 265, 1577 (1994).
162 Yang, H. et al. Protein Conformational Dynamics Probed by Single-Molecule
Electron Transfer. Science 302, 262 (2003).

106
163 Dotson, P. P., Karakashian, A. A. & Nikolova-Karakashian, M. N. Neutral
sphingomyelinase-2 is a redox sensitive enzyme: role of catalytic cysteine residues in
regulation of enzymatic activity through changes in oligomeric state. The Biochemical
journal 465, 371-382, doi:10.1042/BJ20140665 (2015).
164 Marcos, E., Crehuet, R. & Bahar, I. Changes in Dynamics upon Oligomerization
Regulate Substrate Binding and Allostery in Amino Acid Kinase Family Members.
PLOS Computational Biology 7, e1002201, doi:10.1371/journal.pcbi.1002201 (2011).
165 Mesnildrey, S., Agou, F., Karlsson, A., Bonne, D. D. & Véron, M. Coupling
between Catalysis and Oligomeric Structure in Nucleoside Diphosphate Kinase.
Journal of Biological Chemistry 273, 4436-4442, doi:10.1074/jbc.273.8.4436 (1998).
166 Mao, C., Hardy, S. J. & Randall, L. L. Maximal efficiency of coupling between
ATP hydrolysis and translocation of polypeptides mediated by SecB requires two
protomers of SecA. J Bacteriol 191, 978-984 (2009).
167 Zimmermann, J. L., Nicolaus, T., Neuert, G. & Blank, K. Thiol-based, site-
specific and covalent immobilization of biomolecules for single-molecule
experiments. Nat Protoc 5, 975-985 (2010).
168 Yu, H., Siewny, M. G. W., Edwards, D. T., Sanders, A. W. & Perkins, T. T.
Hidden dynamics in the unfolding of individual bacteriorhodopsin proteins. Science
355, 945 (2017).
169 Takeda, S., Yamamoto, K., Hayasaka, Y. & Masumoto, K. Surface OH group
governing wettability of commercial glasses (vol 249, pg 41, 1999). J Non-Cryst
Solids 258, 244-244, doi:Doi 10.1016/S0022-3093(99)00541-4 (1999).
170 Miroux, B. & Walker, J. E. Over-production of proteins in Escherichia coli:
mutant hosts that allow synthesis of some membrane proteins and globular proteins at
high levels. J Mol Biol 260, 289-298, doi:10.1006/jmbi.1996.0399 (1996).
171 Cannon, K. S., Or, E., Clemons, W. M., Jr., Shibata, Y. & Rapoport, T. A.
Disulfide bridge formation between SecY and a translocating polypeptide localizes the
translocation pore to the center of SecY. The Journal of cell biology 169, 219-225,
doi:10.1083/jcb.200412019 (2005).
172 Randall, L. L. et al. Asymmetric binding between SecA and SecB two symmetric
proteins: implications for function in export. J Mol Biol 348, 479-489 (2005).
173 Rigaud, J. L. & Levy, D. Reconstitution of membrane proteins into liposomes.
Methods in enzymology 372, 65-86 (2003).
107
174 Oesterhelt, D. & Stoeckenius, W. Isolation of the cell membrane of
Halobacterium halobium and its fractionation into red and purple membrane. Methods
in enzymology 31, 667-678 (1974).
175 Müller, D. J., Sass, H. J., Muller, S. A., Buldt, G. & Engel, A. Surface structures
of native bacteriorhodopsin depend on the molecular packing arrangement in the
membrane. Journal of Molecular Biology 285, 1903-1909, doi:DOI
10.1006/jmbi.1998.2441 (1999).
176 Goncalves, R. P. et al. Two-chamber AFM: probing membrane proteins
separating two aqueous compartments. Nat Meth 3, 1007-1012,
doi:http://www.nature.com/nmeth/journal/v3/n12/suppinfo/nmeth965_S1.html (2006).
177 Villarubia, J. S. Algorithms for scanned probe microscope image simulation,
surface reconstruction and tip estimation. J. Res. Natl. Inst. Stand. Technol. 102, 425-
454 (1997).
178 Todd, B. A. & Eppell, S. J. A method to improve the quantitative analysis of SFM
images at the nanoscale. Surface Science 491, 473-483 (2001).
179 Schaap, I. A., Carrasco, C., de Pablo, P. J., MacKintosh, F. C. & Schmidt, C. F.
Elastic response, buckling, and instability of microtubules under radial indentation.
Biophys J 91, 1521-1531 (2006).
180 Muller, D. J., Fotiadis, D., Scheuring, S., Müller, S. A. & Engel, A.
Electrostatically Balanced Subnanometer Imaging of Biological Specimens by Atomic
Force Microscope. Biophysical Journal 76, 1101-1111 (1999).

108
VITA
Nagaraju Chada was born in India. He graduated from Kakatiya University in
India in May, 2005 with a Bachelor of Science in Mathematics, Physics, and Computer
Science. He received Master of Science in Physics with Materials Science emphasis in
May, 2007. He worked as a lecturer in Hyderabad until end of 2008 and moved to USA
in Jan, 2009 to pursue MS in Materials Science at Missouri State University, Springfield,
Missouri. He obtained his MS degree in Materials science in Dec, 2010 under Dr. Saibal
Mitra’s supervision. He later pursued his Ph.D in Physics at university of Missouri,
Columbia, Missouri where his research focus shifted to biophysics. He received his
doctorate under supervision of Dr. Gavin M. King in Dec, 2017. Starting Jan, 2018, he
will be working as a Postdoctoral Fellow in the Department of Biology at the Johns
Hopkins University.
Recommended