Waste Reduction and Recycling in Manitoba -Program Performance• • • • • • • • • • • • • • • • • • • • • • • • • • • • • • •
SWANA – Northern Lights ChapterWinnipeg, MB – May 14, 2015

Overview
Overview of Manitoba’s waste reduction and recycling support programs
Waste and recycling program performance comparison – indicators and issues
Question and Answers
Special Operating Agency (SOA) - Program Areas
Established in 2005Waste Diversion
Waste Reduction and Recycling Support (WRARS) ProgramHousehold Hazardous WasteCompostingConstruction, Renovation and Demolition Waste Producer Responsibility Organizations (PROs)Northern and Remote Community Recycling
Water ConservationEducation for SustainabilityGreening Government
www.greenmanitoba.ca

MB Stewardship Programs (2013) 5 EPR Regulations under The WRAP Act (1995 – 2010) 13 Producer Responsibility Organizations (PROs) $42 million in dedicated resources 120,000,000 kilograms (100 kgs/capita) of materials managed Program plan renewals 2016 – 2017 www.greenmanitoba.ca /pros

Program Performance (2013)
MMSM: 83,700 tonnes of blue box materials recycled 54% recovery / 75 kgs per capita
Tires: 1 million tires (14,700 T) collected annually from 1,460 (landfill and retail)
Used Oil: 13.6 million litres recovered (75%)
HHW: 283,000 L of paint (21 year round sites and 60 return to retail sites)
E-waste: 3 million kgs from 57 collection depots

Waste Reduction and Recycling Support (WRARS) Levy - 2013 WRARS Fund established 2009 $10 per tonne levy on all waste
landfilled $9.6 million in revenue (840 kgs /
capita)
80% of Fund ($7.6 million) rebated for municipal recycling reported 184 municipalities / Recycling 69,100
tonnes (60 kgs/capita)
20% of Fund ($1.9 million) to support Provincial waste priorities CR&D Organics Ag Plastics Non-Program HHW
Waste and Recycling Report EPR programs and WRARS information
summary (2011, 2012)

Population Served by Landfill Class
85%
10%5%
Class 1 Landfills [15]
Class 2 Landfills [46]
Class 3 Landfills [123]
Provincial Landfills Parks: 9 ANA (Community
Councils): 36
+90% of waste is weighedTipping Fees: $10 to $60 per tonne
184 Landfills

Manitoba Composts Announced June 2014 Organics Diversion Goal (2020):
100,000 T 85 kgs per capita
$1 million dedicated annual funding pool Environmental Approvals & CCME
Compost Quality Criteria Per tonne incentive payment
$10 / T for facilities 2,500 T / year or more
$25 / T for facilities < 2,500 T (to a maximum of $25,000 annually)
Capital Funding Support
2013 survey identified 80 public and private compost sites 53 managed sites (35,000 T)


Green Jobs and the Economy
Capitalize on local economic growth through EPRprograms, local processing and manufacturing
Develop green procurement policies for use of waste materials in products (e.g. rubberized asphalt, materials with recycled content)
Increase green jobs through waste diversiono 10 times as many jobs created through waste
diversion/recycling than landfillingo For every 1,000 T of material diverted two (2) jobs are
created Conference Board of Canada (2014)

Goal: cut waste in half by 2020 840 to 420 kgs/capita
Landfill Material Bans (organics, CR&D, EPR program materials)
Organics, CR&D, ICI diversion priorities
Prohibit burning of compostable and recyclable paper/cardboard waste
Support regional recycling and waste transfer stations
Expand scope of EPR programs Northern & Remote Community
Support
Set recovery targets for EPRprograms (75% or higher)
Excessive / non-recyclable and fast food packaging (e.g. coffee cups)
Promotion and Education Options for hard-to-recycle
items – e.g mattresses, shingles
WRARS Fund – Landfill Levy options
For every tonne of cardboard recycled instead of being burned or landfilled, 3.5 tonnes of CO2e are eliminated
Up to100 kilograms of methane is produced from each tonne of waste disposed of at a landfill

WRARS Waste Trend – Tonnes per Capita Landfilled
0.950
0.923
0.878
0.841 0.836
0.760
0.780
0.800
0.820
0.840
0.860
0.880
0.900
0.920
0.940
0.960
2010 2011 2012 2013 2014
2013 Baseline

Waste Program Performance Comparisons Statistics Canada - 2010 Waste Management Industry
Survey: Business and Government Sectors (August 2013) Report every 2 years (1994 – 2010) Only comparative data at provincial level 2012 Report not released
CCME Waste Management Task Group (2015) Nationally consistent reporting methodology for waste disposal
Municipal program performance not readily available International waste data comparison – OECD / Conference
Board of Canada Environment Canada – EPR Performance Guide (October 2007)
Recommend program performance indicators
No national compilation report
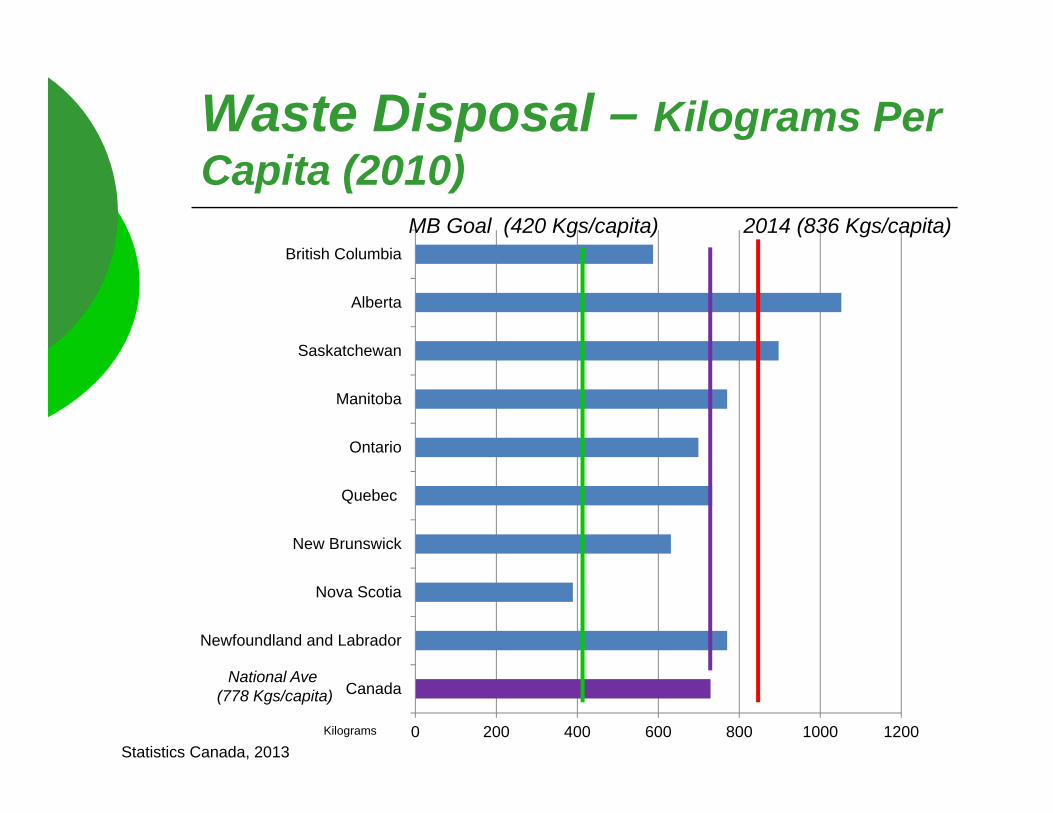
Waste Disposal – Kilograms Per Capita (2010)
0 200 400 600 800 1000 1200
Canada
Newfoundland and Labrador
Nova Scotia
New Brunswick
Quebec
Ontario
Manitoba
Saskatchewan
Alberta
British Columbia
Kilograms
2014 (836 Kgs/capita)MB Goal (420 Kgs/capita)
Statistics Canada, 2013
National Ave (778 Kgs/capita)

Organic Waste Collection –Kilograms Per Capita (2010)
0 20 40 60 80 100 120 140 160 180
Canada
Nova Scotia
New Brunswick
Quebec
Ontario
Manitoba
Alberta
British ColumbiaMB 2014 (33 kgs/capita)
National Average (65 kgs/capita)
Kilograms
Statistics Canada, 2013
MB Goal (85 kgs/capita)

BC has the highest diversion per capita of 322 kgs at a cost of less than $100 per capitaoperating cost. SK and MB have the two lowest per capita current expenditures as well as thetwo lowest diversion rates.
Per Capita Waste Management Operating Costs
Financial system to fund waste services needed – tipping fees, waste service fees, generator specific ( residential, commercial)
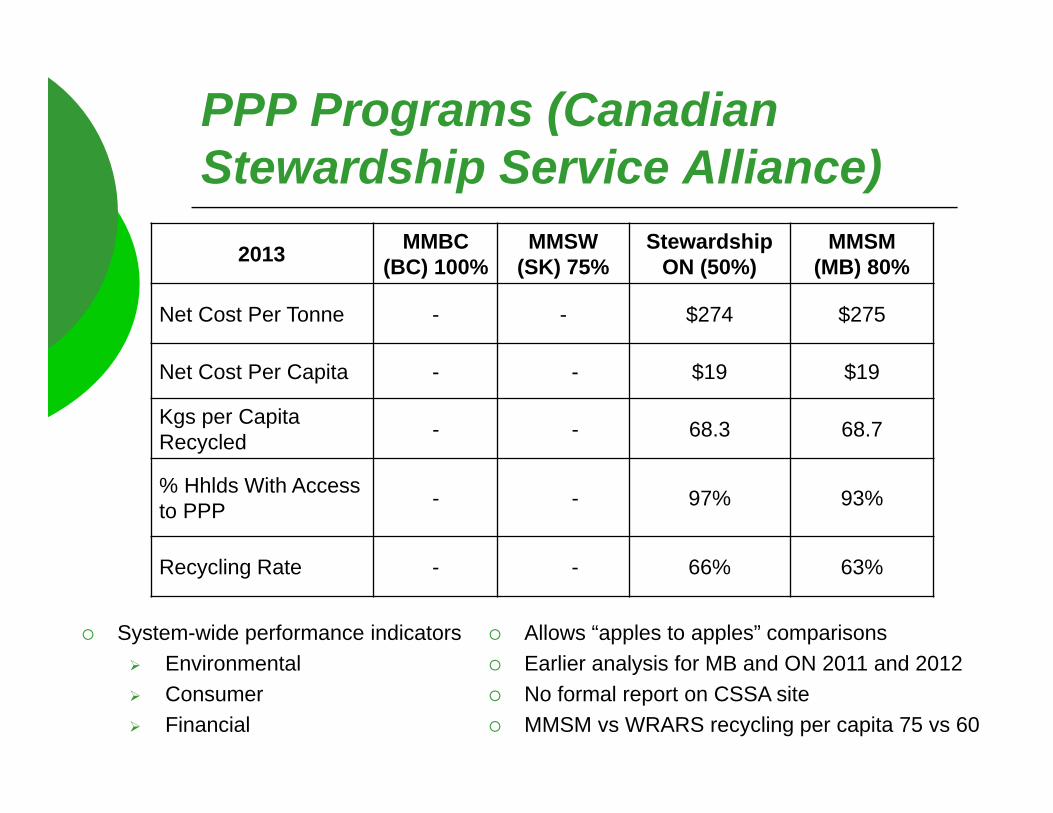
PPP Programs (Canadian Stewardship Service Alliance)
2013 MMBC(BC) 100%
MMSW(SK) 75%
Stewardship ON (50%)
MMSM (MB) 80%
Net Cost Per Tonne - - $274 $275
Net Cost Per Capita - - $19 $19
Kgs per Capita Recycled - - 68.3 68.7
% Hhlds With Access to PPP - - 97% 93%
Recycling Rate - - 66% 63%
System-wide performance indicators Environmental Consumer Financial
Allows “apples to apples” comparisons Earlier analysis for MB and ON 2011 and 2012 No formal report on CSSA site MMSM vs WRARS recycling per capita 75 vs 60

Used Oil Management Association (UOMA)
2013 BC AB SK MB PQ
Used Oil 75% 81% 73% 74% 92%
Filters 83% 92% 82% 73% 79%
Oil Containers 75% 88% 69% 57% 99%
Antifreeze 41% ‐ ‐ 15% 26%Antifreeze Containers ‐ ‐ ‐ 3% 24%
Aerosol Lubricants and Brake Cleaner ‐ ‐ ‐ ‐ 42%
No cost data provided No quantitative collection data Links to provincial program annual
reports for more information
Percent recovery reported

Electronic Products Recycling Association (EPRA)
2013 NS PEI Quebec MB SK BC
Collection (Tonnes) 4,736 645 10,627 3,026 3,288 23,234
Kgs/Capita 5.04 4.44 1.30 2.38 2.95 5.04
Cost per tonne $1,207 $1,112 $1,354 $1,134 $1,731 $1,055
Other Categories Reported Access Awareness # Collection Sites Program Scope and Reuse in Quebec
Note: Alberta and Ontario Programs not reported through EPRA

Canadian Association of Tire Recycling Agencies (CATRA)
Categories Levy Processing Stockpiles Goal Contacts
Information and links to Programs in BC, AB, SK, MB, ON, PQ, NB, NS, PEI, NL and Yukon
No consistent performance indicators or reporting measures Individual annual reports – good information
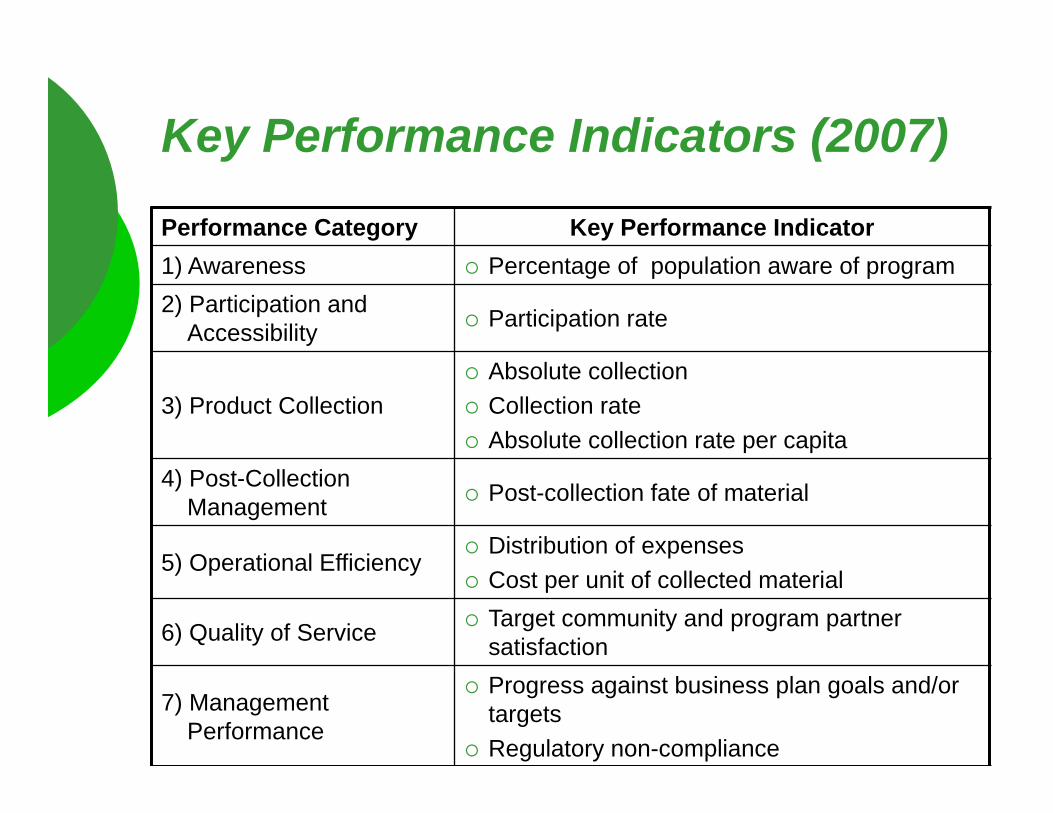
Key Performance Indicators (2007)
Performance Category Key Performance Indicator1) Awareness Percentage of population aware of program2) Participation and
Accessibility Participation rate
3) Product Collection Absolute collection Collection rate Absolute collection rate per capita
4) Post-Collection Management Post-collection fate of material
5) Operational Efficiency Distribution of expenses Cost per unit of collected material
6) Quality of Service Target community and program partner satisfaction
7) Management Performance
Progress against business plan goals and/or targets
Regulatory non-compliance
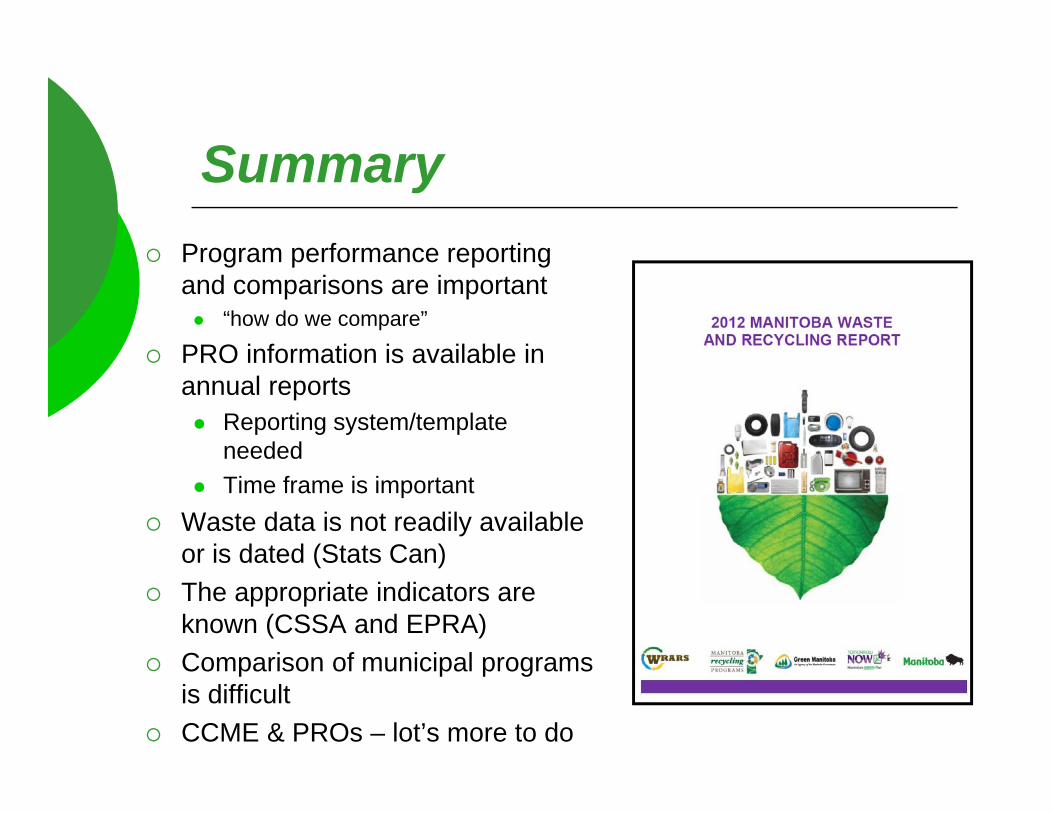
Summary Program performance reporting
and comparisons are important “how do we compare”
PRO information is available in annual reports Reporting system/template
needed Time frame is important
Waste data is not readily available or is dated (Stats Can)
The appropriate indicators are known (CSSA and EPRA)
Comparison of municipal programs is difficult
CCME & PROs – lot’s more to do

Questions / Discussion
www.greenmanitoba.ca
Recommended