9/20/2011
1
TransformationSimpler
Transformation Versus
Execution
h e a t e r s | s e n s o r s | c o n t r o l l e r s
Tom LaMantia
Agenda
WatlowWatlow Lean HistoryEpiphany 1 - PeopleEpiphany 2 - ProcessEpiphany 3 - PurposeResults
h e a t e r s | s e n s o r s | c o n t r o l l e r s

9/20/2011
2
Watlow OverviewFounded in 1922 by Louis Desloge Sr.Family-owned, third generation120 family shareholdersFounded to serve the shoe industryDesign and mfg. thermal solutions –industrial heaters, sensors, and controllersOver 2,000 team members
h e a t e r s | s e n s o r s | c o n t r o l l e r s
Watlow ProductsHeaters ControllersSensors
h e a t e r s | s e n s o r s | c o n t r o l l e r s

9/20/2011
3
The “Thermal Experts”Quick turn around, custom engineered thermal solutions
“Over 400 thermal engineers and specialists”
Semiconductor Processing EnergyDiesel
Life Sciences
Processing Industries
Diesel Emissions
Packaging
Foodservice Equipment
h e a t e r s | s e n s o r s | c o n t r o l l e r s
Aerospace
Global Organization
11 manufacturing facilities in 6 countries22 sales offices in 14 countries3 Technology Centers
h e a t e r s | s e n s o r s | c o n t r o l l e r s
A global network of sales engineers, account managers and technical support specialists
9/20/2011
4
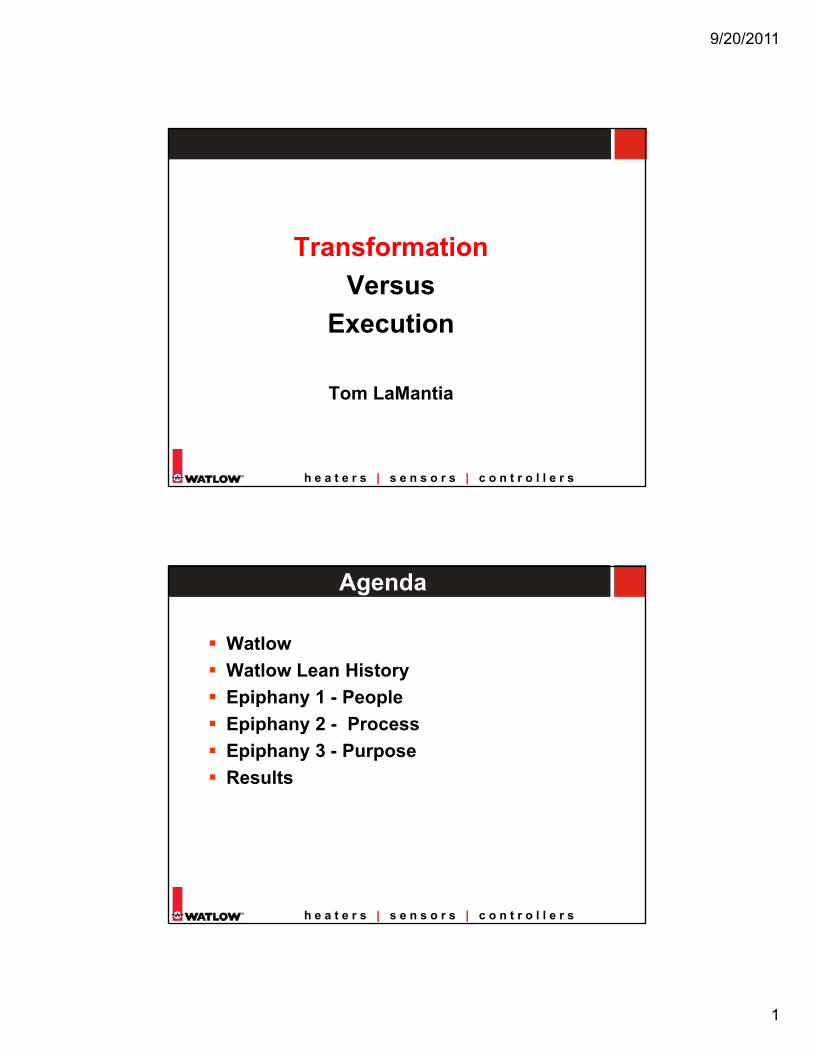
Brief Lean Journey HistoryWe went big bang!
Enterprise VSALine Of Business VSA’s
Implemented Basics7 week cycle (Kaizen)Employment PolicyEvent Pace (N/10)
Results•Pockets Of Improvement•Difficulty Sustaining Gains•Very Basic Tools Based Used•Manufacturing Based•Improvement Top Down Driven•Insufficient Pre event planning
2005
ply tools
Borrowing th
en
Developing TechniqueDeveloping
New BeliefsForeve
r Improve
Culture Change
prov
emen
ts in
HD
, Q, C
, D
Changing
ChangingValues
Understanding &
EmbeddingPrinciples
( )Dedicated Resources (3%)Strategy Deployment (Level 1 & 2)
Value Streams Begin To Form (Factory)Value Stream Mgmt
Lean AccountingS&OPBox Score/Visual Mgmt
Defined Cultural Future State - Watlow WayLean Work Begins in Demand CreationWatlow Business System (version 1)Global Improvement Activity
•Insufficient Pre event planning•Very Mechanical In Our Approach
•Improved Discipline•Improved Results But Inconsistent•Some Sustainment Being Recognized•Admin Processes Included•Tools Added to Tool Belt (eg 3P)•Recognized the Value of Culture•Tools and Kaizen Based Improvement Only
2007
•Began to understand the WBS as a System
ChangingActions
Apply
Imp
Introduction Year 1-2
IntenseYear 3-5
Development Year 5 - 10
ChangingHabits
ChangingActions
Apply tools
Borrowing th
en
Developing TechniqueDeveloping
New BeliefsForev
er Im
prove
Culture
Change
Impr
ovem
ents
in H
D, Q
, C, D
Introduction Year 1-2
IntenseYear 3-5
Development Year 5 - 10
ChangingHabits
ChangingValues
Understanding &
EmbeddingPrinciples
provege
h e a t e r s | s e n s o r s | c o n t r o l l e r s
Global Improvement ActivityStrategy Deployment 2 – Level 1,2 and 3“Mission Control”AME Conference TorontoLean NPD BeginsStrategy DevelopmentWatlow Business System (Current)Managing For Daily ImprovementLean Leadership Today
2008 •Began to understand the WBS as a System•Began Linking Processes Together•Improvement Driven From Top Down & From The Bottom Up – People Development•Began to Understand The Role ofStrategy - Purpose
•Tools & Technique Based Improvement•Transformation vs execution•Better understood WBS failure modes
ChangingActions
Apply tools
Borrowing th
en
Developing TechniqueDeveloping
New BeliefsForev
er Im
pro
Culture
Change
Impr
ovem
ents
in H
D, Q
, C, D
Introduction Year 1-2
IntenseYear 3-5
Development Year 5 - 10
ChangingHabits
ChangingValues
Understanding &
EmbeddingPrinciples
Epiphany 1
People
h e a t e r s | s e n s o r s | c o n t r o l l e r s

9/20/2011
5
Epiphany 1 - People
h e a t e r s | s e n s o r s | c o n t r o l l e r s
Box 1 – Reasons For Actions
h e a t e r s | s e n s o r s | c o n t r o l l e r s

9/20/2011
6
Box 2 – Current State
h e a t e r s | s e n s o r s | c o n t r o l l e r s
Box 3 – Future State
h e a t e r s | s e n s o r s | c o n t r o l l e r s

9/20/2011
7
h e a t e r s | s e n s o r s | c o n t r o l l e r s
Our Culture
Box 9 Insights - People = Our Culture
Our Culture
h e a t e r s | s e n s o r s | c o n t r o l l e r s

9/20/2011
8
Epiphany 1 - Results
A framework for all that we do!Better description of desired cultureCreated Wide scale awarenessCreated Wide-scale awarenessHelped develop broad ownershipGenerated huge pull by the organization to learn moreA platform for all people related initiatives or processes
h e a t e r s | s e n s o r s | c o n t r o l l e r s
ChallengesDid not know “what good looked like” in a lean worldDid not know how to make it real everydayDid not have anything to hang it off of
Epiphany 2
Process
h e a t e r s | s e n s o r s | c o n t r o l l e r s

9/20/2011
9
AME USA Survey•3% are achieving transformation•17% underachieving•80% little improvement•Only achieve low road results•Why? High Road to the new world of Mfg
Beyond Lean “Great”
Delivering The Value - The Awakening
The 1st Step Starts With The Transformation Of The Individual It f d t di th t f f d k l d
No leadership within the enterpriseTo take the high road
•New challenges require DifferentAnswers – a change of thinkingIs required
•Create a race to the “high road”
Beyond Lean
y
Low Road to “Old World” Mfg
Full Lean Focus on leadership, HumanDevelopment & Innovation
Good Start – Short term gains – ContinuingLong term returns – profound change occurs
Gap
• It comes from understanding the system of profound knowledge• The individual, transformed, will receive new meaning to life, toevents, to numbers, to interaction between people
Edward Deming
h e a t e r s | s e n s o r s | c o n t r o l l e r s
Beyond Lean gFake Lean Focus On Tools
Good Start – Short term gains – diminishingLong term returns – often fades away – or justholds the line
Copyright – Gary Stewart
In very Simple Terms, Its About Developing The Individual FirstWe need everyones hands, hearts and minds!
Epiphany 2 Epiphany 2 –– Process: Making the WBS ActionableProcess: Making the WBS Actionable
Innovation/planning Top Management
Middle Management
Traditional Perception of Job Functions
Continuous Improvement TransformationPlanAct
Continuous Improvement TransformationPlanAct
Innovation/ Planning
Strategy
Running the Business
(Firefighting!)
Supervisors
Workers
Top Management
Lean Enterprise Perception of Job Functions
GOAL STEADILY INCREASE
0% 100%% of Time Spent
Time
Kno
wle
dge
Daily Kaizen Break-Through SD
Plan
DoCheck
Act
Plan
DoCheck
Act
Plan
DoCheck
Act
Plan
DoCheck
Act
Time
Kno
wle
dge
Daily Kaizen Break-Through SD
Plan
DoCheck
Act
Plan
DoCheck
Act
Plan
DoCheck
Act
Plan
DoCheck
Act
h e a t e r s | s e n s o r s | c o n t r o l l e r s
Daily Management(Run the Business Processes)
Middle Management
Supervisors
Workers
GOAL= STEADILY INCREASE THE PORTION OF THE ORGANIZATION THAT WORKS FULL TIME ON IMPROVEMENT WHILE DOING IT THE RIGHT WAY (WBS)
0% 100%% of Time Spent

9/20/2011
10
“The MDI Model”
Opera
t in gS ys
tem
Continual Improvement
of
the quality management
system
Understanding
Believing
Doing
Team Member
Opera
t in gS ys
tem
Continual Improvement
of
the quality management
system
Understanding
Believing
Doing
Team Member
Opera
t in gS ys
tem
Continual Improvement
of
the quality management
system
Understanding
Believing
Doing
Team Member
Daily Improvement Model
Team Structure & Organization
Team Responsibilities & Training
Visual Management to Target
Highlight Waste & Variation
Team Based Problem Solving
Cell Team , Value Stream Team & Value Stream Leadership
Other Functional Support
Enterprise LOB & Functional Leadership,
Ope
ratin
gS
yste
m
wW
a yB
ehav
iors
Team Structure & Organization
Team Responsibilities & Training
Visual Management to Target
Highlight Waste & Variation
Team Based Problem Solving
Cell Team , Value Stream Team & Value Stream Leadership
Other Functional Support
Enterprise LOB & Functional Leadership,
Ope
ratin
gS
yste
m
wW
a yB
ehav
ior
Team Structure & Organization
Team Responsibilities & Training
Visual Management to Target
Highlight Waste & Variation
Team Based Problem Solving
Cell Team , Value Stream Team & Value Stream Leadership
Other Functional Support
Enterprise LOB & Functional Leadership,
Ope
ratin
gS
yste
m
wW
a yB
ehav
iors
Strategy & Purpose For Change Not Widely UnderstoodStandard Inconsistently Followed: Lacked Clear Standard On “What Good Looks Like”Organization Structure Does Not Enable Transformation and Daily ImprovementDeep Learning & Understanding Not Being Achieved By Cells or Support Teams“Abnormalities Are Not Visible; Visual S t W N t Ad t
h e a t e r s | s e n s o r s | c o n t r o l l e r sSource: IMAI & Koenigsaecker
Customer
Link to Strategy
Create Model Flow Cell
O
Wat
low
Customer
Link to Strategy
Create Model Flow Cell
O
Wat
low
Customer
Link to Strategy
Create Model Flow Cell
O
Wat
lowSystems Were Not Adequate
Problems Were Not Being Solved Effectively; Corrective Actions Were Not Permanent
Sustainable Daily Improvement Requires Engaging the Hands, Minds & Hearts of our Team Members
Solution Approach
Implement Daily Improvement Fundamentals To Enable Sustainable Continuous Improvement
A Series of 3 Events Focused On Defining Flow Cell Standards, Roles & Responsibilities, and A
Visual Management to Target
Highlight Waste & Variation
Team Based Problem Solving
Cell Team , Value Stream Team & Value Stream Leadership
Other Functional Support
Enterprise LOB & Functional Leadership,
Opera
tingSys
tem
Continual Improvement
of
the quality management
system
Understanding
Believing
Doing
Team Member
Sys
tem
havi
ors
Visual Management to Target
Highlight Waste & Variation
Team Based Problem Solving
Cell Team , Value Stream Team & Value Stream Leadership
Other Functional Support
Enterprise LOB & Functional Leadership,
Opera
tingSys
tem
Continual Improvement
of
the quality management
system
Understanding
Believing
Doing
Team Member
Sys
tem
havi
orVisual Management to Target
Highlight Waste & Variation
Team Based Problem Solving
Cell Team , Value Stream Team & Value Stream Leadership
Other Functional Support
Enterprise LOB & Functional Leadership,
Opera
tingSys
tem
Continual Improvement
of
the quality management
system
Understanding
Believing
Doing
Team Member
Sys
tem
havi
ors
3 Company-Wide Events Scheduled for Early 2009
1. Create and Deploy Cell Structure, Processes and Attributes
Physical characteristicsVisual management and controlAssessment process
2. Develop and Align Roles and ResponsibilitiesRoles and Responsibilities (Std. Work for Roles)Knowledge, skills and behaviors
What does the ideal cell look like and why?
How does it apply to my role? What do I do differently?
People Development Methodology In a Model Cell
h e a t e r s | s e n s o r s | c o n t r o l l e r s
Customer
Link to Strategy
Create Model Flow Cell
Team Structure & Organization
Team Responsibilities & Training
Ope
ratin
gS
Wat
low
Way
Beh
Customer
Link to Strategy
Create Model Flow Cell
Team Structure & Organization
Team Responsibilities & Training
Ope
ratin
gS
Wat
low
Way
Beh
Customer
Link to Strategy
Create Model Flow Cell
Team Structure & Organization
Team Responsibilities & Training
Ope
ratin
gS
Wat
low
Way
Beh
3. Development Tools and ProcessesSkill assessmentTraining/Development ProgramsSkills Matrixes Training delivery processes
How do we develop team members to get there?
3 Events With Enterprise-Wide Participation Defined The MDI System

9/20/2011
11
MDI Event 1 Deliverables – Ideal Cell
Strider Std Work
Red Tag Team: ________________________
Sell
Hold
to
Depr
eciat
e
Give
Aw
ay
Thro
w Aw
ay
Retu
rn to
Ve
ndor
Mov
e El
sewh
ere
Recy
cle
Tag # Area Item D escript io n R eason fo r Tagg ing $
Red Tag Log Sheet
Disposition
AreaDate
Auditor sAr ea Represent ative
Score Comments
0 Perf ormed every auditSOR T
Tea m mem bers ar e regular ly allowed time to make 6 S impr ovements
Section Score ( out of 5)
A ll chem ica ls a re store d in labeled containe rs
Tea m mem bers can d emonstra te knowledge of sa fety shelter locations, evacuation r outes, an d safety contacts
Work too ls & equipm ent are being used pr operly with appr opriate guar ding
6S Production Assessment
SAFETY & 6S COMMI TMEN TPersonal pr otective equipmen t is being used pr operly (accor ding to posted requirem ents)
Andon Process
STANDARD WORK CENTERK EY QUE STIO NS:► A re we following s tandard work?► A re we bui lding to the design?► A re we pass ing along good parts?► A re we demonstrating the Watlow W ay Behaviors , Values , and P rinc iples?► D o w e know w hen we need help? H ave we asked for help? Are w e getting the help we need?
FOLLO W-UP ACTIO NS: Today's Date:
STANDARD OPERATING PROC ESS -- - Operator ROLES & R ESPON SIB ILITIES:
D AILY:► Pa rti ci p ate i n Ce l l sta rt-of-sh i ft me eting► Do s tart-o f-s hi ft c he ck li st► Fol l ow a ll Safe ty Sta nd a rd s► Un de rsta nd an d fol l ow Stan d ard Wo rk► Bu il d p rod uc t to de sign us in g wo rk i n struc tio ns /sta nd ard s► Fol l ow q ua li ty ch e ck s for ev ery o p era tio n (u se C TQ b oa rds )► Up da te Prod u ctio n Co n tro l s he e t (h ou r b y h ou r)► Ma inta in 6S sta nd ard s thro u gh ou t th e s hi ft► Ide n ti fy a bn orm al i ti e s as th e y oc cu r► Ide n ti fy a nd do cu me nt impro ve me n t o p po rtun ti e s wi th in cu rren t sys tem s - us e p ro blem so lv in g c en ter, sta nd ard work c en ters , e tc.► Fol l ow the an d on p ro ce ss a s d efi ne d► Us e pro b le m so l ving to o ls to u n de rsta nd & re so lv e p rob le ms► Fle x/Ro tate p er s ta n da rd wo rk an d e rg on om ic req ui rem en ts► Proa cti ve l y id e nti fy was te (Ju st Do It Im pro ve me nt) an d u se Prob le m So lv in g C en te r to imp ro ve pro ce ss es
PER IO DIC (w eekly, monthly, as needed):► Schedule time off per guidel ines► Know your respons ibi l ities in achieving value stream goals► Participate in Kaizen► Participate/ schedule training sess ions to acquire new sk il ls (per c ross tr aining plan)► Identi fy 6S Improvements / week ly► Share learnings across the team
KNO WLEDG E LIB RARY:►Rec ipe Cards -C el l Physical Attributes -C el l Improvement Center -Standard Work C enter -Point of Use -Problem Solv ing Center►Dimens ion Library: -Job Family D imension Wheel►Watlow Way Tr aining Plan►Watlow Way Tr aining Modules►Work Ins truc tion/Produc tion Standards►MSDS Library
Eliminate one abnormal ity each day
Standard Work Center1 MDI Std Operating Procedure for Operator,
Lead Op, PTL, & Support - Size: 8.5 x 11 or A4- Location: in Cell- preshift, during shift, end shift actions- daily, weekly, monthly actions2 Production Control Sheet- Size: 8.5 x 11 or A4- Location: in Cell- visible to all operators- must show plan quantity vs. actual- must show pitch- reasons for not meeting plan3 Standard Work Layout- Size: 8.5 x 11 or A4- Location: in Cell- done by hand on Watlow format4 Standard Work Bar Chart- Size: 8.5 x 11 or A4
1 2 3
4 5 6
Cell Physical Attributes1 Cell Improvement Center, Standard Work, & Problem
Solving Boards- Kiosk (Watlow Standard) or Flat board (White)- Accessible and visible- Content to be determined by individual recipe card- Mobile (optional)2 Cell U-shaped- Must follow Watlow Standard color code system- People on the inside; counter clockwise; 1-piece flow- Operators to not cross paths- Must meet 6S audit criteria requirements- Cell must be right-sized to product dimensions- Physical locations marked per Watlow color code system3 Right Sized Equipment- Must be mobile with quick disconnects- Poka Yoke / Mistake-proofed- Optimal store front for the largest part- Maintenance access from rear/outside cell optimal- Must be safe guarded and tamper proof- No reaching above shoulders or below waist- Tools meet ergonomic requirements- Preference for Load-Load capability4 Raw Material Delivery- Material fed from outside of U cell- Material pulled from upstream process- Point of use of materials with optimal orientation
4
13 1
10
5
2
3
8
7
6
PSC Standard
W k
ACTIO N PLAN ACTION PLAN
Impl
emen
tatio
n Tr
acke
r
WHY:
Direct Cause. Direct Cause.
Inv
estig
atio
n :
5-W
hy
Ana
lysi
s.
WHY :
WHY :
1 2
WHY :
WHY:
WHY:
WHY :
WHY :
WHY:
WHY:
Solut
ion
RESP. RESP.
DATE:
R
oot
C
ause
DATE:
20
20
5 WHY ANALYSIS
DIRECT CAUSE INVESTIGATION FISHBONE
Blank PPS A3 Active PPS A3 Closed PPS A3
PSC Standard Work Illustration
Model Cell A3
PROBLEM SOLVING CENTER
Action Item List
Problem Solving Center1 Improvement A3- Size: 11 x 17 or A3- Standard 9 Block (See Example)
2 Action Item List- Size: 8.5 x 11 or A4- Box 7 from Improvement A3 (Model Cell Rail)
3 Direct Cause Investigation Fishbone- Size: 34 x 30 Outside Dimension- Outline on erasible board- Writing is easily visible for standing team meeting4 Work Area- Size: 12 x 30 Outside Dimension- Date, Team Members Names
-Location for drawing ideas, cause chains and suggestions
5 5 Wh Fl h t
1 3
4
25
7 86
9
6
Standardized Cell Structure & Processes
Revision Date: 6-15-09 Content Owner: Tom Lyons
Work0 M ust score 5 o f 5 befor e moving on to next " S"
0 M ust score 5 o f 5 befor e moving on to next " S"Sco re
01
Descr ipt ionOne or mor e vio lat io ns within a rea boun daries, re quires suppor ting comm entsNo violations wit hin area b oundaries
Items a re put a way imm ediately after use
Section Score ( out of 5)
A isle ways, bound aries, workstations, a nd equipm ent locations are clearly indicated
Specifie d locations for ite ms mater ials, WIP are approp riate for amount of use
Mater ial and WIP st orage location s clea rly lab eled and used proper ly
Section Score ( out of 5)SET IN OR DER
Necessary items saf ely stor ed and organized in ob viou s loca tio ns (tools, docum entation, per sonal items, et c. )
No unnecessar y document ation is present to prefo rm contr oled pro ce sse s in the area
Personal item sto rage ar ea(s) are app ropriate ly sized and used prop erly
A ll unn ecessary and excess item s are r ed-tagg ed (or equivalent) fo r relocation and red -tag pr ocess is being followed
All m achines/equipmen t is wor king, prop erly shut-down, o r a RMT/M aintenance ta g affixed to item
All m aterials, tools, and equipment in the area are r equired to perfor m planned processes
Standard Work Center Philosophy/Key Points:Centralized, standardized tools for managing daily operations within the cell either on a flat board or Kiosk (Simpler standard).Visual to allow for ease of use for all cell members.Hand written to allow for real time cell member interaction and drive self directed daily improvement as a culture. (elements 2,3,4,5,9,10)Tool to help drive management to SQDC.Without a standard there can be no improvementDrives actions to eliminate waste
- Location: in Cell- done by hand on Watlow format5 Andon Process- Location: in cell - defines hierarchy for response- visible and audible(telephone, radio etc…)6 Red Tag Process- every item is tagged- location within cell boundaries- criteria 37 Water Strider MDI Std Operating Process- Size: 8.5 x 11 or A4- Location: in Cell- done by hand on Watlow format8 6S Daily Checklist- detailed list- responsibilities- sign off9 Daily Improvement Suggestions- opportunities documented- comes from the team- improvement owned by the team
10 Interruptions Sheet (optional)- Size: 8.5 x 11 or A4- time process was down is recorded- cause identified
7 8 9
Responsible for Execution: Lead OperatorUsers: Cell Team Members
Revision Date: 6-16-09 Content Owner: John Huber
Physical Cell Philosophy/Key Points:Using best practices to eliminate wasteAllows for flexibility – demand, laborWithout standards there can be no improvementQuality begins with standardizationCells are the foundation of the improvementProperly designed and managed cell is the lifeblood of any organization and is the source of the greatest revenues
Responsible for Execution: Lead OperatorUsers: Cell Team Members
- Supplied by water strider- Replenishment with lean tools (i.e.KanBan,2-bin,water marks)5 No Chairs- Exception - operators assigned to light duty 6 Right Sized Table- Ergonomically designed and adjustable - White- No closed cabinets or drawers- No shelves except for point of use needs7 Trash Locations- One per standard work operator as needed 8 Non-Conforming Material Location- maximum one per standard work operator9 Personal Property Storage- Must be stored outside of the cell area- Exception = marked drink area as allowed by process
10 Finished Goods - Right-sized for quantity and load- Set up for packaging as needed.- identified within the cell
11 Cell Production Records- Within cell boundaries per record retention procedure- electronic (optional)
12 Supplies Location (6s,PPE, TPM)- Within cell boundaries- Stored per OSHA requirements
13 Cell Identification- visible identification posted within cell boundaries
14 Planning and Scheduling Board- shows sequence of work to be completed visually
9 11 12
ANDON Recipe Card 1 Pre-requisites- Problem solving center is in place- Team members know they are responsible for quality &
will call attention to abnormalities- Support team members are ready to respond (SOP)
1.5 Next Steps (should be within 90 days)- Each team member is disciplined and understands the
importance of following Standard Work- Team understands SQDC priority order - Standard Work is in place (baseline)- Quality Key Points are in place- Equipment TPM's are in place- Kanban replenishment systems are in place- Andon Cord, Trigger, or Button is readily accessible to
each team member- triggers visual levels and audible tones3 Visual signal- is visible from aisleway / entrance to the cell
13
2
4
Andon Key Points / Philosophy:Andon is an information tool that provides instant,
Cell Improvement Center1 Key Performance Indicators Sheet (KPI)- Size: ANSI D (approximately 24 x 36) or equivalent- S,Q,D,C metrics in vertical columns - Action Item list- Day to Day metric plot- 6S Audit with Score- calendar with visual indicators (green/red)- pareto charts for each metric - metrics link with VS linkage chart2 Watlow General Communications- 3 sections; size: 8.5 x 11 or A4- Watlow Way- Safety Communication- Various communications (OT, Watlow news etc..)3 Cross Training / Skills Matrix- list of cell members- skills list needed for functional area within the VS- updated real time by team member and trainer- proficiency levels of training
Blank = has not been trained
CALENDARKEY PERFORMANCE INDICATORS
Model Cell A3
CELL IMPROVEMENT CENTER
First Aid Info
VALUE ST REAM NAME
Fi rst Name L ast Nam eTo tal Sk il ls
Tra in ed Tra
ining
Po
ints
Set
Up C
ut an
d Stra
ight
en
Mac
hine
Cre
ate B
in La
bels
at C
ut an
d
Stra
ight
en
Ope
rate
Flat
San
der
Ope
rate
Col
d En
d St
rippe
r
Ope
rate
Pow
der O
ut J
unct
ion
Wel
der
Rep
ack
Ung
roun
ded
Junc
tion
Ope
rate
Las
er D
isc W
elde
r
Set
Up L
aser
Disc
Wel
der
Ope
rate
Ind
uctio
n P
rehea
t
Ope
rate
TIG
Ref
low
Set
Up T
IG R
eflow
Set
Up .1
88"
and
.156
" Tip
Swag
e
Swa
ge C
553
Tips
Betty Bo op 46 9 4Sue Sno wba ll 44 1 08 T T T T T T T T T T T
Mic ha el J ord an 32 7 4
Jo e Sc hmo 27 7 5
Sa m Hag ar 29 7 6 T T T T T T T T T T T T T
Oz zy O sbo rne 35 6 5
T ig er W o od s 18 4 9
Ad am La mbe rt 27 7 5 T
Ni cho la s Cl au s 18 4 2
T otal S ki ll s Trai ne d 27 6
T otal Ski l ls i n De pt 60
# Ope rators 9To ta l Dept Sk il ls 54 0
% Tra ine d 51 .1 1%
Cell Name
1
2
3
4 5
7
2
26
POINT OF USE 1 Standard Work Combination Sheet- Standard format defined- Size: 8 1/2 x 11 (A4)- Handwritten
2 Critical to Safety (CTS)- Identifies specific hazards- Follow OSHA Requirement - consult with safety specialist- Safety cross indicated on standard work layout3 Quality Key Points- Located arms length and eye level in front of the operator- Reference Quality Key Points Example4 Work Instructions-Key Point and/or Detailed- Detailed WI Accessible via Electronic or Hard Copy - Step by step instructions- Key Point Hard copy posted in cell
Controlled Document- Located arms length and eye level in front of the operator- Reference Key Points & Detailed Examples
5 Daily Equipment Check Sheet (See Tool on MDI Menu)
Revision Date: 11-10-09 Content Owner: Lynn Loynes
Work
Recipe Card Philosophy/Key Points:This area is the center of team-based problem solvingNO REPEAT CONCERNS – solve at the root causeTeam should “GO & SEE” problem to ensure clear understanding“Focus on the vital few” - Quality rather than Quantity of problem solving activityINVOLVES people closest to the problemUses structured problem solving techniqueAll forms follow established Watlow Standard
5 5 Why Flowchart- Two 5 Why Flocharts, Vertically oriented
-Includes Blocks for Cause, Five Whys, Root Cause, Solution, Action Items
6 Problem Solving Center Standard Work- Size: 11 x 17 or A3 and 8.5x11 or A4 - Sequence of events for Problem Solving Process7 Blank Practical Problem Solving A3
Size: 11 x 17 or A3- Blank copy of Practical Problem Solving A38 Active Practical Problem Solving A3- Size: 11 x 17 or A3
-Hard copy of Practical Problem Solving A3 from erasible board
- Active copy storage until actions completed9 Closed Practical Problem Solving A3- Size: 11 x 17 or A3
-Hard copy of Practical Problem Solving A3 from erasible board
7 8 9
Responsible for Execution: Area LeadershipUsers: Everyone
h e a t e r s | s e n s o r s | c o n t r o l l e r s
Revision Date: 10-29-09 Content Owner: Tom Lyons
y- Yellow = abnormality detected- Red = cell will not make goal4 Audible signal- audible signal is distinctive for each cell- easily heard by support team members5 Escalation process- Support for red and yellow lights based on Takt- EXAMPLE: Takt time = 2 min
> LO responds in 2 min (1x takt) > PTL responds in 4 miin (2x takt) > Support responds in 10 min (5x takt)
- Faster response for red than yellow signal6 Cell Andon Process defines;- When to trigger the andon- How to repond to & resolve the abnormality- Recognition for effective use & response
p ,visible, & audible warning to the operations team that there is an abnormality in the work areaAndon allows timely corrective action by alerting personnel when abnormalities occur (“stop & fix it now” thinking)Andon allows TL to spend less time monitoring process and more time solving problems at root cause and supports zero-defect conceptsAn Andon system creates a safe environment of healthy tension for the operations team
Responsible for Execution: PTLUsers: Operators
Revision Date: 3-16-10 Content Owner: Tony Page
Responsible for Execution: PTLUsers: Lead Operator & Cell Team Members
Cell Improvement Center Philosophy/Key Points:Centralized, standardized tools for visually managing daily operations within 6 feet of the cell. No improvement can happen without a standard.Visual to enable cell members to easily use it and understand daily cell status for SQDC. Enables cell members to identify the vital few.Hand written to allow real time cell member interaction and drive self directed daily improvement as a culture. (elements 1,4,6)Tool to help drive improvement to SQDC thru daily team communication.Requires honesty and candour – this is not a grading system, it is a way to make abnormalities visible allowing us to correct them.
Yellow = can perform taks with supervisionGreen = can perform task with no supervisionGreen T = can train others
4 6S Audit - use Watlow standard 6S audit- 7th element allowed for special reqmts (e.g. ESD)- minimum monthly audits5 Watlow Way Cell Assessment- Size: 8.5x11 or A4- updated quarterly at minimum- uses standard Watlow audit and spider chart6 Daily Production Control record- Size: 8.5x11 or A4- Defines pitch interval or cell output- Identifies "gold nuggets" for daily improvement7 Monthly Calendar - Cell scheduled activities- Vacations- type and size not mandated
Point of Use Philosophy/Key Points:All information critical to effective daily operation of cellAvailable within sight of operator and within reachDocuments are color coded whenever possible for ease of useTools available for operator to quickly identify abnormalitiesUtilize Watlow Standard for documents
Responsible for Execution: Lead OperatorUsers: Lead Operator and Cell Team Members
y q p ( )- Visual/pictorial
-Defines Equipment start up/shut down steps if start up is longer than 3 steps
- Required when start up is longer than 3-4 steps- Defines Total Productive Maintenance (TPM) steps- Located near machine
-Defines Standard Operating Conditions (SOC) specific to equipment or cell
- SOC defines Machine settings or ranges
6 Product/Process Deviations (Optional)- Detailed Description- Approval signoff- Size: 8 1/2 x 11 (A4)
7 Stop Work (Optional)- Detailed Description & actions taken to release- Approval signoff- Size: 8 1/2 x 11 (A4)
Revision Date: 1-15-10 Content Owner: Kim Kleinow
Define the Standard…Provide a Picture of What “Good” Looks Like
MDI Event 1 ExamplesStandardized Cell Structure & Processes
Cell Physical Attributes Recipe Card1 Cell Improvement Center, Standard Work, & Problem
Solving Boards
- Kiosk (Watlow Standard) or Flat board (White)
- Accessible and visible
- Content to be determined by individual recipe card
- Mobile (optional)
2 Cell U-shaped
- Must follow Watlow Standard color code system
- People on the inside; counter clockwise; 1-piece flow
- Operators to not cross paths
- Must meet 6S audit criteria requirements
- Cell must be right-sized to product dimensions
- Physical locations marked per Watlow color code system
3 Right Sized Equipment
- Must be mobile with quick disconnects
4
13 1
10
37
6
Physical Cell Philosophy/Key Points:
Using best practices to eliminate waste
q
- Poka Yoke / Mistake-proofed
- Optimal store front for the largest part
- Maintenance access from rear/outside cell optimal
- Must be safe guarded and tamper proof
- No reaching above shoulders or below waist
- Tools meet ergonomic requirements
- Preference for Load-Load capability
4 Raw Material Delivery
- Material fed from outside of U cell
- Material pulled from upstream process
- Point of use of materials with optimal orientation
- Supplied by water strider
- Replenishment with lean tools (i.e.KanBan,2-bin,water marks)
5 No Chairs
- Exception - operators assigned to light duty
6 Right Sized Table
- Ergonomically designed and adjustable
- White
- No closed cabinets or drawers
- No shelves except for point of use needs
5
2
9
8
11 12
h e a t e r s | s e n s o r s | c o n t r o l l e r s
Allows for flexibility – demand, labor
Without standards there can be no improvement
Quality begins with standardization
Cells are the foundation of the improvement
Properly designed and managed cell is the lifeblood of
any organization and is the source of the greatest
revenues
Responsible for Execution: Lead OperatorUsers : Cell Team Members
- No shelves except for point of use needs
7 Trash Locations
- One per standard work operator as needed
8 Non-Conforming Material Location
- maximum one per standard work operator
9 Personal Property Storage
- Must be stored outside of the cell area
- Exception = marked drink area as allowed by process
10 Finished Goods
- Right-sized for quantity and load
- Set up for packaging as needed.
- identified within the cell
11 Cell Production Records
- Within cell boundaries per record retention procedure
- electronic (optional)
12 Supplies Location (6s,PPE, TPM)
- Within cell boundaries
- Stored per OSHA requirements
13 Cell Identification
- visible identification posted within cell boundaries

9/20/2011
12
MDI Event 2 Deliverables – How does it apply to my role?
IDEAL ORGANIZATIONAL STRUCTURE 1 Operator- Adding value thru mfg or support for 90% of time- Team based problem solving consume 10% of time
- Eliminate one abnormality each day2 Lead Operator
-
Working Leader responsible for daily coaching 3 to 6 team members
- Adding value thru mfg for 80% of time- Team based problem solving consumes 20% of time
- Focus on consistent, repeatable, least-waste way-
p gembrace it.
3 Production Team Leader- Responsible for a group of no more than 3 - 6 cells- Teaching and mentoring teams 80% of time- Administrative tasks consume no more than 20% of - Be teachers of proper behavior - explain desired
l
PTL
Wa ter S trid er
COI Faci li tator
Mai nt . M ech ani c
En gi neer
Pr oduc t Eng
Bu yerPlan n er
Quali ty E ng.
Designer
Produc t Spec .
VSL
Finance Analyst
HR S i li
Ideal State Value Stream OrganizationMay 2009
VSL S pan = 6 to 8 reports
O per ato r
L ead Op erat or
=
O per ato rOp erat or
O per ato rOp erat or
Lead O pera to r
O per at or
Op erat orO per at or
Ope rat orO per at or
L ead O perat or
O per at or Op erat or
O per at orO per ator
Op erat or
Lead O pera to r
O per ato r
Op erat orO per at or
Op erat orO per at or
L ead Op erat or
O per ato r O per at or
O per ato rOp erat or
Lead O perat or
O pera tor
O per at orOper at or
L ead O perat or
Op erat or
O per atorO per ato r
Lea d O p erat or
O per at or
O per atorO per ato r
Oper at or
O per atorO per at or
O per at or
L ead O perat or
Ope rat or
O per at orO pera tor
O per at orO per ator
L ead Op erat or
O per at or
O per atorOper at or
O per atorOpe rat or
Lead O pera tor
O pera tor
Ope rat orO per at or
Ope rat orO per at or
Op erat or
Lead O pera tor
O per ator
Oper at orO per at or
Oper at orO per at or
L ead O perat or
Oper at or O per ator
Oper at orO per ato r
PTL
PTL
PTL
PTL
PTL
W at er St rid er
Eng ineer
M ain t. M echa ni c
Lead O perat or
Op erat or
Oper at orO per ato r
O per at orO per ato r
L ead O perat or
Oper at or
O per at orO per ato r
O per at orO per ato r
Lea d O p erat or
O per ato r
O per atorOper at or
O per atorOper at or
L ead Op erat or
O per at or
O per ato rOp erat or
O per ato rOp erat or
L ead O perat or
O per at or
O per at orO per ator
O per at orO per ator
L ead O perat or
O per at or Oper at or
O per ato rOp erat or
Lead O pera to r
Op erat or O per ato r
Ope rat orO per at or
Lea d O p erato r
O per ator O per at or
Op erat orO per at or
Op erat or
Lead O pera tor
O per ato r
Ope rat orO per at or
Ope rat orO per at or
O per ator
Lea d O p erat or
O per at or
O per atorOper at or
O per atorOper at or
Oper at or
Lead O perat or
O per ator
Oper at orO per ato r
O per at orO per ato r
L ead O perat or
Op erat or
O per atorO per ato r
Lead O perat or
O per ator
O per at orO per at or
Lead O pera tor
O per ato r
O per at orO per at or
L ead O perat or
Ope rat or
O per atorO per ator
VSL
VSL
MF G Leade r
Product Eng
BuyerP lanner
Quality Eng.
Designer
Product Spec.
Custome r Se rvic e
COI Te ch
P roduct Spec.
De signer
P TL
Ma in t. Mech an ic
W ater S tri der
Wat er St rid er
Bu yerPl ann er
En gin eer
Value Stream #1 Value Stream #2
Value Stream #3
Low mfg support needs = Mfg Leader not
appropriate
Low mfg support needs = Mfg Leader not
appropriate High cell / PTL content so Mfg Leader is
needed
PT L Span = 3 to 6 Ops
ML Span = 3 to 6 Leads
CO I
Quali ty E ng
F inance Analyst
HR Spec ia li
st
KEY QUESTIONS:►What is the ideal state for this cell? What is the path to get there?►How do you know how this cell is performing?►What are the key issues that are impacting this cell? How do you know? Can you show me what the plan is to resolve?►Do you have everything you need in this cell? How do you know?►What steps do you take when something goes wrong?►What steps do you follow to make an
STANDARD OPERATING PROCESS --- Senior LeadershipROLES & RESPONSIBILITIES:DAILY:►Go and See one place in Gemba and see if Root Cause Problem Solving in the Problem Solving Center is occurring.
PERIODIC (weekly, monthly, as needed):►Participate in Lean Events ►Champion the Lean Transformation by understanding the Ideal State and coach team members on why the Ideal State exists►Discuss alignment of Model Cell activity with Enterprise objectives ►Review Watlow Way self-assessments and provide feedback for alignment to Enterprise goals►Observe activity in a cell relative to Visual Management of Standard Work, Andon, and Prod ction Control Sheets Act all alk
KNOWLEDGE LIBRARY:►Recipe Cards -Cell Physical Attributes -Cell Improvement Center -Standard Work Center -Point of Use -Problem Solving Center►Dimension Library: -Job Family Dimension Wheel►Watlow Way Training Plan►Watlow Way Training Modules►VS metric board►Opportunity Funnel
KEY QUESTIONS:► Have a Fishbone or 5-Why been started?►Are multiple cell members involved in the improvement activity?►Are all cell members aware of the improvement activity?►Why have we chosen this issue? (show me the data)►Is additional support needed?►Does each member of the cell team understand what is happening?►Are we following the recipe card as defined in the Problem Solving
STANDARD OPERATING PROCESS --- Support Team Member ROLES & RESPONSIBILITIES:DAILY:► Respond to Andon within 5 minutes of notification.►Participate in a GEMBA walk and review opportunities across all cells. ►Across the support team, review each Cell Improvement Center and pick one SQDC improvement to resolve. Prioritize based upon SQDC as well as pareto. (Data Based)►Ensure that all items that you are responsible for have been provided to the cell.►Utilize the Problem Solving Center to
PERIODIC (weekly, monthly, as needed):► Initiate with one cell a waste elimination activity weekly.►Improve knowledge of Lean by leading 1 Kaizen or participating in 1 Kaizen (minimum) yearly.►Participate in Strategy Deployment, Value Stream VSA's, and Watlow Way Self Assessments.►Conduct an audit to review Standard Work Compliance, 6S, and Visual M t 1 ll thl
KNOWLEDGE LIBRARY:►Recipe Cards -Cell Physical Attributes -Cell Improvement Center -Standard Work Center -Point of Use -Problem Solving Center►Dimension Library: -Job Family Dimension Wheel►Watlow Way Training Plan►Watlow Way Training Modules►VS metric board►Capacity planning tool►MSDS Library
Roles, Org. Structure & Responsibilities
Revision Date: 6//6/09 Content Owner: Sheryl Hicks
Organizational Philosophy & Key Points:Watlow is positioned as a teaching organizationPrimary role of Leaders has shifted to teaching others toward true north and encouraging and recognizing the the right behaviorsLeaders spend 50% of time developing individuals and 50% of timemanaging the businessLeaders seek to understand rather than directing workAll levels of organization execute daily to Std operating processesOne solution does not fit all locations or vs’s
Responsible for Execution: All Leaders Users: Team Members
results4 Support Resource- Respond to Andon in 5 minutes or less- Seek understanding & work to improve processes in
the Gemba for 50% of time- Reinforce functional excellence by helping others
identify and solve problems5 Manufacturing Leader- Span of direct reports is 4 to 8 people- Teaching and mentoring teams 80% of time- Remove ambiguity by teaching mfg to structure and
standardize activities6 Value Stream Leader- Span of direct reports is 6 to 10 people- Teaching and mentoring teams 50% of time
-
Establish and communicate the vision - explain how each team member can contribute
- Achieve breakthrough performance by expecting and rewarding the best from teams
7 Functional Leaders- Seek understanding & work to improve processes in
the Gemba for 30% of time- Company wide resource for Yokoten- Reinforce functional excellence by helping design and
standardize best practice8 Executive Level Leaders- Primary sponsors of the organizational change- Engaged in catching people doing the right things- Recognizes and encourages the right behaviors
Site Leader (LOB)
Executive Team
Eng. M anager
Controller
Quality Mgr
Busine ss Develop
NPD
COI M anager
Product M anager
HR M anager
inside value stre am org
outs ide value s tr eam or g
Specia list
Span = 8 to 10 r epor ts
st
KEY QUESTIONS:► Are we working on the correct things?► Are we doing it the correct way?► Are we winning or losing? ► Are we improving? ► How do you look for waste in your job?► What is the KPI telling us today?► What do we need to do to improve our cell assessment?► What is takt?► Show me your Standard Work Combination sheet and tell me what it means to you?
STANDARD OPERATING PROCESS --- Lead Operator ROLES & RESPONSIBILITIES:DAILY:► Gather prior day's data► Load/Release work to cell► Initiate/Update Prod Control Sheet► Facilitate and coach at cell start-of-shift team meeting► Lead Gemba walk around Cell Improvement, Std Work & PSCs► Follow Andon process ► Provide on the job training► Coach team to follow standard work► Verify daily 6S is followed► Recognize 1 team member for cell or personal improvements► Create value by building product► Conduct communication handoff with next or prior shift► Update KPI at the end of the shift► Follow up on actions on Cell I S d W k & PSC
PERIODIC (weekly, monthly, as needed):► Update training matrix / as needed► Facilitate Just Do It improvements / weekly► Evaluate employee performance to MDI standard operating process and give feedback / monthly► Backup PTL / as needed► Participate in Kaizens / as needed► Create and follow up on maintenance work orders / as needed► Resolution of customer concerns / as needed► Develop Lead Operator backup / ongoing► Verify 6S Improvements / weekly► Verify team is following cross-training plan► Share learnings across the team► Updated Workforce - time and attendance / weekly► Audit one area per Point of Use Recipe Card, capture actions on KPI► Inventory Accuracy►Goal Setting and Performance Reviews of
KNOWLEDGE LIBRARY:►Recipe Cards -Cell Physical Attributes -Cell Improvement Center -Standard Work Center -Point of Use -Problem Solving Center►Dimension Library: -Adaptability -Continuous Learning - Initiating Action - Work Standards - Building Trust - Coaching - Builidng a Successful Team - Managing Work - Decision Making►Knowledge Assessment►Lead Operator Training Plan &
KEY QUESTIONS:► What is the teams takt time for today? How do you know?► What is the process when you have an abnormality (safety, quality, delivery …)?► What is being done to eliminate the abnormality from reoccurring?► Are we working on the correct things?► Are we doing it the correct way?► Are we winning or losing? ► Are we improving?
STANDARD OPERATING PROCESS --- Production Team Leader ROLES & RESPONSIBILITIES:DAILY: Review prior day data for Gemba
Walk► Make staffing adjustments to meet customer takt► Go, see and listen at cell start-of-shift meetings (rotate as necessary)► Coach Lead Operator on feedback from daily cell meetings► Facilitate Gemba walk around Cell Improvement, Standard Work and Problem Solving Centers ► Follow up on actions on Cell Improvement, Standard Work and Problem Solving Centers (drive SQDC improvement)► Teach one problem solving activity - drive to root cause (opportunity from KPI or Hr.xHr. Board)
PERIODIC (weekly, monthly, as needed):► Updated Workforce - time and attendance► Provide updates for VS weekly metric meeting► Update checkbook► Support operations capacity planning thru SOFP► Share insights/learnings across teams / as needed► Perform cell assessments / monthly► Audit for team 6S improvement activities / weekly► Develop Lead Operator backfill► Lead Kaizens► Execute Performance Management Process► Develop cross training plan.► Evaluate Lead Operator performance to MDI Standard Operating Process and give feedback. / monthly ► Approve Standard Work updates and close loop with team members.
KNOWLEDGE LIBRARY:►Recipe Cards -Cell Physical Attributes -Cell Improvement Center -Standard Work Center -Point of Use -Problem Solving Center►Dimension Library: -Job Family Dimension Wheel►Watlow Way Training Plan►Watlow Way Training Modules►VS metric board►Capacity planning tool►MSDS Library►Andon Process
KEY QUESTIONS:►What is the Standard Work Center board telling us?►What key barriers are identified on the KPI sheet? What actions are in place to attack the barriers?►Are there other barriers to the cell that aren't defined on the Cell boards? Why?►Does everyone understand what just happened here? Does everyone agree? What other issues does this cause?►What can we do now to make this better tomorrow?►Are we demonstrating Watlow Way Values, Principles and Behaviors?►What did the team learn?►How are the MDI SOP worksheets helping you? What are the barriers to following the sheet?
STANDARD OPERATING PROCESS --- Value Stream LeaderROLES & RESPONSIBILITIES:DAILY:►Lead daily opportunity and funnel review to support VS growth►Facilitate site Demand Creation Gemba Walk with VS team to review support groups Cell Improvement Center and Standard Work Center to understand the performance of the cells►Seek out key barriers within the VS with the team and provide support as needed.►Verify 1 cell's (admin or production) adherence to Standard Work, 6S, and utilization of Andon process.►Review 1 cell's (admin or production) Problem Solving Center to verify adherence to the Lean Problem Solving tools.►Recognize 1 team or individual►Ask a member of the VS team how they supported a cell today.
PERIODIC (weekly, monthly, as needed):►Conduct weekly VS meetings to review progress of Future Growth, Weekly Metrics, True North Metrics and Strategy Deployment ►Conduct meetings with the Channel to get actionable feedback to ensure future growth►Attend Delivery Gemba Walk with VS team to review Cell Improvement Center and Standard Work Center to understand the performance of the cells►Develop communications to cascade down to each cell level from Customer, MCAB, Mission Control and key Enterprise meetings. ►Ensure that the VS Board is updated weekly prior to the VS Review Meeting. ►Own the Watlow Way VS self-assessment and ensure it is updated to reflect current state.►Develop the VS roadmap to achieving Strategy
KNOWLEDGE LIBRARY:►Recipe Cards -Cell Physical Attributes -Cell Improvement Center -Standard Work Center -Point of Use -Problem Solving Center►Dimension Library: -Job Family Dimension Wheel►Watlow Way Training Plan►Watlow Way Training Modules►VS metric board►Capacity planning tool►MSDS Library►Andon Process►Opprotunity Funnel
►What steps do you follow to make an improvement?►What are the barriers to improvement for your team?►Are we demonstrating Watlow Way Values, Principles and Behaviors?
FOLLOW-UP ACTIONS: Today's Date:
Production Control Sheets. Actually walk through the Standard Work. Draw out insights from the team through questions►Have a coaching discussion with each direct report at least once per month - verfiy they are using SOP worksheet►Recognize an individual or team that typifies the behavior that is driving the team towards the Ideal State weekly
►Opportunity Funnel►Enterprise Mission Control
Recognizes and encourages the right
behaviors
defined in the Problem Solving Center?►What questions do you have that you need help with?
FOLLOW-UP ACTIONS: Today's Date:
►Utilize the Problem Solving Center to teach cell members how to utilize Lean Problem solving tools while resolving each SQDC improvement.►Observe activity in each cell relative to Visual Management of Standard Work, Andon, and Production Control Sheets. This activity starts at the Standard Work Center. Draw out insights from the team through questions►Ensure that standard work is updated as improvement/problem solving occurs.
Management on 1 cell monthly. Initiate gap closure with the team immediately.►Share learnings across the team►Gather feedback and measure performance of functional systems in support of Model Cell.
►MSDS Library►Andon Process
Reinforce functional excellence by helping
others identify and solve problems
h e a t e r s | s e n s o r s | c o n t r o l l e r s
FOLLOW-UP ACTIONS: Today's Date:
Improvement, Std Work & PSCs► Follow-up on identified opportunties of improvement from team members.► Assess need for Overtime ► Lead one team problem solving activity from KPI or Hr.xHr. - drive to root cause
Team members►Support Cell A3 RAIL►Coaching/Development(Team and themselves - possible A3)►Participate in systematic or catastrophic problem solving
►Lead Operator Training Plan & Modules►MSDS Library
Coach your team members to embrace
change.
FOLLOW-UP ACTIONS: Today's Date:
► Recognize 1 team member embracing change and taking action to eliminate waste ► Follow Andon process as defined ► Audit cell Standard Work and SOP
► Conduct one audit against one MDI recipe card and document actions on KPI ► Backup ML/VSL as needed
Be teachers of proper behavior - explain
desired results
FOLLOW-UP ACTIONS: Today's Date:
suppo ted a ce today►Discuss the MDI Standard Operating Process sheet with one team member
p p g gyDeployment and True North Metrics through the VSA process semi-annually.►Continue to learn Lean Tools through going to Gemba, leading Kaizens, consultations with Lean Sensei, and TPOC generation.►Lead SOFP for the VS (monthly)►Have a coaching discussion with each direct report at least once per week.
Establish and communicate the vision -
explain how team members contribute
Daily Improvement Requires Engaging All Levels of the Organization…
MDI Event 2 Examples
Organization Structure & Lean LeadershipTeam Member
Team Leader
Value Stream LeaderProduction Production
IDEAL ORGANIZATIONAL STRUCTURE 1 Operator- Adding value thru mfg or support for 90% of time- Team based problem solving consume 10% of time- Eliminate one abnormality each day2 Lead Operator
-Working Leader responsible for daily coaching 3 to 6 team members
- Adding value thru mfg for 80% of time- Team based problem solving consumes 20% of time- Focus on consistent, repeatable, least-waste way-
p gembrace it.
3 Production Team Leader- Responsible for a group of no more than 3 - 6 cells- Teaching and mentoring teams 80% of time- Administrative tasks consume no more than 20% of - Be teachers of proper behavior - explain desired
results4 Support Resource- Respond to Andon in 5 minutes or less- Seek understanding & work to improve processes in
the Gemba for 50% of timeR i f f ti l ll b h l i th
PT L
W ate r Str ide r
COI Facilitator
Maint. Mec hanic
Engine er
Pro du ct En g
BuyerPlanner
Qu ality E ng.
D es ig ner
Produ ct Sp ec.
Si te Leader (L OB)
E ng. Manager
Controller
Quality Mgr
B usiness Develop
NPD
COI Manager
Product Manager
VSL
H R Manager
ins id e valu e s tream org
Finance Analyst
ou tsid e value stream org
H R Special i
st
Ideal State Value Stream OrganizationMay 2009
Span = 8 to 10 reports
VSL Span = 6 to 8 reports
Opera to r
L ead Op era to r
=
Op eratorOperator
OperatorOp erator
L ea d Oper ator
Op erator
Operato rOpe ra to r
Op eratorOperator
L ead Op era to r
Ope ra to r Op erator
Op eratorOperator
Operator
L ea d Ope rator
Operator
Ope ra to rOp erator
Op eratorOperato r
Le ad Op erato r
Operator Opera to r
Op eratorOp erator
L ead Op era tor
Operator
OperatorOperator
L ead O pera tor
Operato r
Opera to rOp erator
L ea d Ope rator
Op erator
Op eratorOp erator
Op erator
Op eratorOp erator
Opera to r
L ead Op era to r
Ope rato r
Op eratorOperator
OperatorOp erator
L ea d Oper ator
Operato r
Operato rOpe rato r
Op eratorOperator
L ea d Ope rator
Ope ra to r
Ope rato rOp erator
Op eratorOpe ra to r
Op erator
L ead Oper ator
Op erator
OperatorOpe ra to r
Op eratorOperator
L ea d Ope rator
Operator Operator
Ope ra to rOp erator
PT L
PT L
PTL
PTL
PTL
Water Stride r
E nginee r
Maint. Mec hanic
L ea d Oper ator
Operato r
Opera to rOpe rato r
Op eratorOperator
L ead Op era tor
Op erator
OperatorOperator
Operato rOp erator
L ea d Oper ator
Operato r
Opera to rOpe rato r
Op eratorOperator
L ea d Ope rator
Ope ra to r
Ope ra to rOp erator
Op eratorOpera to r
Le ad Op erato r
Op erator
Op eratorOp erator
OperatorOp erator
Le ad Op erato r
Operator Operato r
Op eratorOp erator
Le ad Op erato r
Operato r Ope ra to r
Op eratorOperator
L ead Op era tor
Ope ra to r Op erator
Op eratorOperator
Op erator
L ead Oper ator
Op erator
OperatorOpera to r
Ope ra to rOperator
Op erator
L ea d Oper ator
Operator
Opera to rOpe rato r
Op eratorOperator
Operator
Le ad Op erato r
Ope ra to r
Op eratorOp erator
OperatorOp erator
L ea d Op erator
Op erator
Op eratorOpe ra to r
Le ad Op erato r
Op erator
OperatorOp erator
L ea d Ope rator
Op erator
Op eratorOperato r
L ead Op era tor
Operator
OperatorOp erator
VSL
VSL
MFG L eader
Product Eng
B uyerPla nner
Quality Eng.
Designer
Product Spec.
C us tomer Service
COI Tech
Product Spec.
Design er
PTL
Maint. Mechanic
Water Strider
W ate r Str ider
B uyerP lanner
E nginee r
Value Stream #1 Value Stream #2
Value Stream #3
Low mfg support needs = Mfg Leader not
appropriate
Low mfg support needs = Mfg Leader not
appropriate High cell / PTL content so Mfg Leader is
needed
PTL Span = 3 to 6 Ops
ML Span = 3 to 6 Leads
COI
Qua lity Eng
Finance Analys t
HR Speciali
st
Production Team Leader
Value Stream Leader
Sr. Leaders
Team Leader Team Leader
Team & Team Leader
h e a t e r s | s e n s o r s | c o n t r o l l e r s
Revision Date: 6//6/09 Content Owner: Sheryl Hicks
Organizational Philosophy & Key Points:Watlow is positioned as a teaching organizationPrimary role of Leaders has shifted to teaching others toward true north and encouraging and recognizing the the right behaviorsLeaders spend 50% of time developing individuals and 50% of timemanaging the businessLeaders seek to understand rather than directing workAll levels of organization execute daily to Std operating processesOne solution does not fit all locations or vs’s
Responsible for Execution: All Leaders Users: Team Members
- Reinforce functional excellence by helping others identify and solve problems
5 Manufacturing Leader- Span of direct reports is 4 to 8 people- Teaching and mentoring teams 80% of time- Remove ambiguity by teaching mfg to structure and
standardize activities6 Value Stream Leader- Span of direct reports is 6 to 10 people- Teaching and mentoring teams 50% of time
-
Establish and communicate the vision - explain how each team member can contribute
- Achieve breakthrough performance by expecting and rewarding the best from teams
7 Functional Leaders- Seek understanding & work to improve processes in
the Gemba for 30% of time- Company wide resource for Yokoten- Reinforce functional excellence by helping design and
standardize best practice8 Executive Level Leaders- Primary sponsors of the organizational change- Engaged in catching people doing the right things- Recognizes and encourages the right behaviors
Executive Team
Daily Improvement Requires Engaging All Levels of the Organization…
Support Sr. Leadership

9/20/2011
13
MDI Event 2 Examples
Lead Operator Responsibilities
KEY QUESTIONS:► Are we working on the correct things?► A d i it th t ?
STANDARD OPERATING PROCESS --- Lead Operator ROLES & RESPONSIBILITIES:DAILY:► Gather prior day's data► Load/Release work to cell
PERIODIC (weekly, monthly, as needed):► Update training matrix / as needed► Facilitate Just Do It improvements / weekly
KNOWLEDGE LIBRARY:►Recipe Cards -Cell Physical Attributes
C ll I t C t ► Are we doing it the correct way?► Are we winning or losing? ► Are we improving? ► How do you look for waste in your job?► What is the KPI telling us today?► What do we need to do to improve our cell assessment?► What is takt?► Show me your Standard Work Combination sheet and tell me what it means to you?
► Load/Release work to cell► Initiate/Update Prod Control Sheet► Facilitate and coach at cell start-of-shift team meeting► Lead Gemba walk around Cell Improvement, Std Work & PSCs► Follow Andon process ► Provide on the job training► Coach team to follow standard work► Verify daily 6S is followed► Recognize 1 team member for cell or personal improvements► Create value by building product► Conduct communication handoff with next or prior shift► Update KPI at the end of the shift► Follow up on actions on Cell Improvement, Std Work & PSCs► Follow-up on identified opportunties of improvement from team members.► Assess need for Overtime ► Lead one team problem solving
► Facilitate Just Do It improvements / weekly► Evaluate employee performance to MDI standard operating process and give feedback / monthly► Backup PTL / as needed► Participate in Kaizens / as needed► Create and follow up on maintenance work orders / as needed► Resolution of customer concerns / as needed► Develop Lead Operator backup / ongoing► Verify 6S Improvements / weekly► Verify team is following cross-training plan► Share learnings across the team► Updated Workforce - time and attendance / weekly► Audit one area per Point of Use Recipe Card, capture actions on KPI► Inventory Accuracy►Goal Setting and Performance Reviews of Team members►Support Cell A3 RAIL►Coaching/Development(Team and themselves - possible A3)►Participate in systematic or catastrophic
-Cell Improvement Center -Standard Work Center -Point of Use -Problem Solving Center►Dimension Library: -Adaptability -Continuous Learning - Initiating Action - Work Standards - Building Trust - Coaching - Builidng a Successful Team - Managing Work - Decision Making►Knowledge Assessment►Lead Operator Training Plan & Modules►MSDS Library Coach your team
members to embrace
h e a t e r s | s e n s o r s | c o n t r o l l e r s
FOLLOW-UP ACTIONS: Today's Date:
p gactivity from KPI or Hr.xHr. - drive to root cause
problem solving
members to embrace change.
The “Rapid Experiment”
Setting Up the Model
Model Cell was an Existing Flow-cellModel Cell was an Existing Flow cellHighly Complex Cell – High VariationHigh Potential Leaders (Team Leader, Production Team Leader, Andon Support)“Average” Team (4 Diverse Team Members)Team Leadership Participated in 3 MDI Events
h e a t e r s | s e n s o r s | c o n t r o l l e r s
Improvements Implemented During 3 MDI Events
Will The MDI Model Achieve Breakthrough Results?Will MDI Create a Sustainable Continuous Improvement Culture?

9/20/2011
14
Model Cell
IF CALLSet Andon Light To:
No Problems Not Applicable Green
Barb HaleyRon Loper by cell phone Cell Phone (314) 651-2359
There is an accident Emergency Team Red
F04 Cartridge Flow Cell ANDON Process
SAFETY
Dial 59 # 01 then page: "Emergency Team come to Firerod Line "F04". Say this twice.
Yellow
TELEPHONE NUMBER
Someone needs first aid for a minor injury
Cultural Results
Team Stops When a Problem is Identified and Support Responds Immediately
No Problems Not Applicable Green
Duane Kujawa by cell phone Cell Phone (314) 258-1724
Ron Loper by cell phone Cell Phone (314) 651-2359
No Problems Not Applicable Green
Duane Kujawa by cell phone Cell Phone (314) 258-1724
Ron Loper by cell phone Cell Phone (314) 651-2359 Duane Kujawa by cell phone Cell Phone (314) 258-1724Ron Loper by cell phone Cell Phone (314) 651-2359 Maintenance Call or page the Maintenance Department
Over Capacity Ron Loper by cell phone Cell Phone (314) 651-2359 Red
Under Capacity Not Applicable Green
QUALITY
Red
DELIVERY
Scrap three or more heaters in a row or five in an hour
The Line is not meeting hourly Takt goals
DELIVERY
Visual Scheduling Board ANDON Process Cumulative Points:
Yellow
RedThe Line is completely down: Equipment, Design, Material
Problems are Resolved Through Structured, Team Based Problem SolvingTeam Gets First Shot at Solving ProblemSupportive/Coaching Leadership Style Creates Comfort & Trust With the Transformation ProcessFront-Line Leadership & Andon Support
h e a t e r s | s e n s o r s | c o n t r o l l e r s
Front Line Leadership & Andon Support are “Where the Game is Won or Lost”Focus on the Processes When Problem Solving – Not Blaming People
Model Cell is Sustaining Improvement…Given the Choice, The Team Would Not Return to Old Ways
MDI Results1/2" Firerod On Time Performance
50.0%
60.0%
70.0%
80.0%
90.0%
100.0%
On Time Pe
rformance
1/2" Firerod Quality
89.0%
91.0%
93.0%
95.0%
97.0%
99.0%
Yield Pe
rcentage
1/2" Firerod Productivity
44.5
55.5
66.5
77.5
Units per Lab
or Hou
r 44% Improvement
8 Months @99% Yieldu50% Improvement
Innovation/ Planning
Continuous Improvement
the Business Processes
Lean Enterprise Perception of Job Functions
40.0%
50.0%
3/8/09
5/8/09
7/8/09
9/8/09
11/8/09
1/8/10
3/8/10
5/8/10
7/8/10
Week (February 2009 to August 2010)
O
On Time Performance Percentage4 per. Mov. Avg. (On Time Performance Percentage)
85.0%
87.0%
2/22/09
4/22/09
6/22/09
8/22/09
10/22/09
12/22/09
2/22/10
4/22/10
6/22/10
8/22/10
Week (February 2009 to August 2010)
Unit Yield Percentage 4 per. Mov. Avg. (Unit Yield Percentage)
33.5
4
2/22/09
4/22/09
6/22/09
8/22/09
10/22/09
12/22/09
2/22/10
4/22/10
6/22/10
8/22/10
Week (February 2009 to August 2010)
Un
Units per Labor Hour 4 per. Mov. Avg. (Units per Labor Hour)
99% Yieldu50% Improvement
MDI I O M th d t E t th
Daily Management(Run the Business Processes)
Co
(Improve the B
0% 100%% of Time Spent
h e a t e r s | s e n s o r s | c o n t r o l l e r s
MDI Is Our Method to Execute the Watlow Business System At All Levels of the Organization !

9/20/2011
15
Epiphany 3
Purpose
h e a t e r s | s e n s o r s | c o n t r o l l e r s
Lean As A System
h e a t e r s | s e n s o r s | c o n t r o l l e r s
Plan/Do/Check/Act is Not Just A Platitude –It Actually Means Something!

9/20/2011
16
Feedback
WatlowEnterprise
Strategy & EVSA
Strategic Goals & Priorities
1 2 3 4
vity
(1.5
% S
ales
/FTE
/Mon
th)
y Re
duct
ion
(2 tu
rns)
and
Asi
a G
row
th ($
)
r Met
ric
Plac
ehol
der (
prof
itabi
lity
impr
ovem
ent)
ppor
tuni
ty M
etri
c Pl
aceh
olde
r
Stan
dard
izaa
tion
Met
ric
Plac
ehol
der
artic
ipat
ion
(50%
of t
he p
opul
atio
n on
2 e
vent
s)
PPM
) Red
uctio
n (5
0%)
Cyc
le T
ime
Red
uctio
ns (2
4%)
Small Customer Growth and SupportMeet Engineering Capability and Capacity Needs
Active A3'sby 12/31/09
~unless otherwise noted~
3 Year Strategies
Breakthrough Goals
e to
driv
e th
e W
atlo
w W
ay T
rans
form
atio
n
e ou
r stre
ngth
s to
aggr
essi
vely
gro
w la
rge
OEM
's
custo
mer
s by
incr
easi
ng c
over
age
& fo
cusin
g ou
r pro
duct
& se
rvic
e offe
ring
Product Standardization and Improvement
owth
to a
chie
ve a
mor
e ba
lanc
ed re
gion
al re
venu
e st
ream
Sim
plic
ity a
nd S
cala
bilit
y as
a G
row
th E
ngin
e
1.TL A3 Metrics
Watlow Way Transformation A3 (Enterprise TPOC)Mega Opportunity GrowthEurope and Asia Growth Strategy
Deployment L11 2 3
Watlow Way Transformation A3 (Enterprise TPOC)Mega Opportunity GrowthEurope and Asia Growth
LOB L2
Watlow Business System – Rev 1
What Does This Picture Tell Us? Complexity is King – We love it!Not easily understood or explained2006 W tl E t i St t
True North Metrics & Visual Boards
Updated
P f R i
0
1
2
3
Business
Value StreamCell
0
1
2
3
Core Fundamentals• Enterprise level focus (portfolio)• Solid Growth Strategy + True North +
Stretch Goals + Alignment & Linkage + Operating Systems
• Drive WW Transformation:- 3% of population full time COI- N/10 Pace of change- Event Participation- Engage Everyone in daily CI
Value Stream Analysis (2x/yr.)
1 2 3 4 5 6 1 2 3 4 5 6 7 8 9 10 11 12 13 14
Prod
uctiv
Inve
ntor
y
Euro
pe a
n
End
Use
r
Meg
a O
pp
Grow Market Share (revenue at 3* Regional GDP)
Cycle Times (-25% / Yr.)
Operating Income (15%)
Prod
uct S
Even
t Par
Def
ect(
PP
Prod
uct C
Cont
inue
Leve
rag e
Gro
w sm
all
Driv
e G
ro
Busi
ness
4
1 2 3 4 5 6 1 2 3 4 5 6 7 8 9 10 11 12 13 14
Prod
uctiv
ity (1
.5%
Sal
es/F
TE/M
onth
)
Inve
ntor
y R
educ
tion
(2 tu
rns)
Euro
pe an
d A
sia G
row
th ($
)
End
Use
r Met
ric P
lace
hold
er (p
rofit
abili
ty im
prov
emen
t)
Meg
a O
ppor
tuni
ty M
etric
Pla
ceho
lder
Grow Market Share (revenue at 3* Regional GDP)
Cycle Times (-25% / Yr.)
Operating Income (15%)
Prod
uct S
tand
ardi
zaat
ion
Met
ric P
lace
hold
er
Even
t Par
ticip
atio
n (5
0% o
f the
pop
ulat
ion
on 2
eve
nts)
Def
ect(P
PM) R
educ
tion
(50%
)
Prod
uct C
ycle
Tim
e Re
duct
ions
(24%
)
Small Customer Growth and SupportMeet Engineering Capability and Capacity Needs
Active A3'sby 12/31/09
~unless otherwise noted~
3 Year Strategies
Breakthrough Goals
Cont
inue
to d
rive
the
Wat
low
Way
Tra
nsfo
rmat
ion
Leve
rage
our
stre
ngth
s to
agg
ress
ivel
y gr
ow la
rge O
EM's
Gro
w sm
all c
usto
mer
s by
incr
easi
ng co
vera
ge &
focu
sing
our
pro
duct
& se
rvic
e offe
ring
Product Standardization and Improvement
Driv
e G
row
th to
ach
ieve
a m
ore
bala
nced
regi
onal
reve
nue
strea
m
Busi
ness
Sim
plic
ity a
nd S
cala
bilit
y as
a G
row
th E
ngin
e
1.TL A3 Metrics
LOB L2
VS L3
“Linkage” Process with VS & Cell Teams
Op
1-ITEMFLOW
STD.WORK
BASIC6-S
PULLSYS.
SETUPREDUC-TION
BASICQUALITY CHECKS
TPM
TAKT TIME OUT -PUT
LOT-SIZE 1
ZERODEFECTS LEVEL-
ING
LOAD- LOAD
DEFECT-FREE ON-DEMAND
1-BY-1 LOWEST COST
VISUAL MANAGEMENT
WATLOW WAY BEHAVIORS
1-ITEMFLOW
STD.WORK
BASIC6-S
PULLSYS.
SETUPREDUC-TION
BASICQUALITY CHECKS
TPM
TAKT TIME OUT -PUT
LOT-SIZE 1
ZERODEFECTS LEVEL-
ING
LOAD- LOAD
DEFECT-FREE ON-DEMAND
1-BY-1 LOWEST COST
VISUAL MANAGEMENT
WATLOW WAY BEHAVIORS
Value Stream Management Op System
Sales, Operations, Financial Plan (“SOFP”)
Not easily understood or explainedPlanning activity is not holistic – primarily designed for manufacturingWe realized that the pieces of the process must connect to form a system We realized the system must be closed loopFocused on Process Only – It was mechanical!Addresses Variation WithinDoes not address those things that
2006 Watlow Enterprise StrategyGrow Organic Sales to US $400 M by 2010Longest Custom Turn Time (Days): Quotes-5/Prototypes-10/Shipments-10Improve Labor Productivity by 1.5% monthly to regain Price CompetitivenessBuild world class engineering functional
h e a t e r s | s e n s o r s | c o n t r o l l e r s
Future State VS PlanRIE A3s; VS Improvement Target & Future state Box
Score
Performance ReviewsMission Control Meetings
VSM Op SystemGemba Walks
Problem SolvingRCCA & Robust
CountermeasuresWW Self-AssessmentsInclude all Stakeholders
Reset Expectations
pportunity
Support Value Streams
Design & Development
Product Management
Demand Creation
New Product Development Value Streams
Supply Chain Delivery
Update VS Operating
System (VSM)
Linkage Process
Just Do-Its
Projects
Managing for Daily Improvement
affect variation between (linkages)PeoplePurpose
Build world class engineering functional excellence
Watlow Business System Rev 5Watlow Business System:
The Model to Lean Transformation OVERVIEWRED OUTLINES are Links To Details
FeedbackACT
WatlowEnterprise
Strategy & EVSA
Strategic Goals & PrioritiesWW Transformation A3WW Transformation A3 Update VS
Operating
System (VSM)
inkage
Rev 7
Aug 09
2007 Watlow Business StrategyC
H
E
CP
LTrue North Metrics
& Visual Boards Updated
0
1
2
3
0
1
2
3
Business
Value StreamCell
0
1
2
3
0
1
2
3
Core Fundamentals• Enterprise level focus (portfolio)• Solid Growth Strategy + True North +
Stretch Goals + Alignment & Linkage + Operating Systems
• Drive WW Transformation:- 3% of population full time COI- N/10 Pace of change- Event Participation- Engage Everyone in daily CI
Value Stream
1 2 3 4
1 2 3 4 5 6 1 2 3 4 5 6 7 8 9 10 11 12 13 14
Prod
uctiv
ity (1
.5%
Sales
/FTE/
Mon
th)
Inve
ntor
y Red
uctio
n (2
turn
s)
Euro
pe a
nd A
sia
Gro
wth ($)
End
Use
r M
etric
Place
hold
er (p
rofitabi
lity im
prov
emen
t)
Meg
a Opp
ortu
nity M
etric Pl
aceh
olde
r
Grow Market Share (revenue at 3* Regional GDP)
Cycle Times (-25% / Yr.)
Operating Income (15%)
Prod
uct S
tand
ardi
zaat
ion M
etric Pl
aceh
olde
r
Even
t Par
ticipat
ion (5
0% of the
popu
latio
n on
2 eve
nts)
Def
ect(PP
M) Red
uctio
n (5
0%)
Prod
uct C
ycle T
ime Red
uctio
ns (2
4%)
Small Customer Growth and SupportMeet Engineering Capability and Capacity Needs
Active A3'sby 12/31/09
~unless otherwise noted~
3 Year Strategies
Breakthrough Goals
Con
tinue
to d
rive th
e W
atlo
w W
ay T
rans
form
atio
n
Leve
rage
our
stren
gths
to agg
ressiv
ely gr
ow la
rge
OEM
's
Gro
w sm
all c
ustom
ers by
increa
sing
cov
erag
e &
focu
sing
our
pro
duct
& ser
vice
offerin
g
Product Standardization and Improvement
Drive
Gro
wth
to ach
ieve
a m
ore ba
lanc
ed re
gion
al rev
enue
stre
am
Bus
ines
s Sim
plic
ity and
Sca
lability
as a Gro
wth
Eng
ine
1.TL A3 Metrics
Watlow Way Transformation A3 (Enterprise TPOC)Mega Opportunity GrowthEurope and Asia Growth
Strategy Deployment L1
1 2 3 4
1 2 3 4 5 6 1 2 3 4 5 6 7 8 9 10 11 12 13 14
Prod
uctiv
ity (1
.5%
Sal
es/F
TE/M
onth
)
Inve
ntor
y R
educ
tion
(2 tu
rns)
Euro
pe a
nd A
sia
Gro
wth
($)
End
Use
r Met
ric P
lace
hold
er (p
rofi
tabi
lity
impr
ovem
ent)
Meg
a O
ppor
tuni
ty M
etric
Pla
ceho
lder
Grow Market Share (revenue at 3* Regional GDP)
Cycle Times (-25% / Yr.)
Operating Income (15%)
Prod
uct S
tand
ardi
zaat
ion
Met
ric P
lace
hold
er
Even
t Par
ticip
atio
n (5
0% o
f the
pop
ulat
ion
on 2
eve
nts)
Def
ect(P
PM)
Redu
ctio
n (5
0%)
Prod
uct C
ycle
Tim
e R
educ
tions
(24%
)
Small Customer Growth and SupportMeet Engineering Capability and Capacity Needs
Active A3'sby 12/31/09
~unless otherwise noted~
3 Year Strategies
Breakthrough Goals
Con
tinue
to d
rive
the
Wat
low
Way
Tra
nsfo
rmat
ion
Leve
rage
our
stre
ngth
s to
agg
ress
ivel
y gr
ow la
rge
OE
M's
Gro
w s
mal
l cus
tom
ers
by in
crea
sing
cov
erag
e &
focu
sing
our
pro
duct
& s
ervi
ce o
ffer
ing
Product Standardization and Improvement
Driv
e G
row
th to
ach
ieve
a m
ore
bala
nced
regi
onal
reve
nue
stre
am
Bus
ines
s Si
mpl
icity
and
Sca
labi
lity
as a
Gro
wth
Eng
ine
1.TL A3 Metrics
Watlow Way Transformation A3 (Enterprise TPOC)Mega Opportunity GrowthEurope and Asia Growth
LOB L2
VS L3
LOB/Site TPOCLOB/Site TPOC
“Linkage” Process with VS & Cell Teams
1-ITEMFLOW
STD.WORK
BASIC6-S
PULLSYS.
SETUPREDUC-TION
BASICQUALITY CHECKS
TPM
TAKT TIME OUT -PUT
LOT-SIZE 1
ZERODEFECTS LEVEL-
ING
LOAD- LOAD
DEFECT-FREE ON-DEMAND
1-BY-1 LOWEST COST
VISUAL MANAGEMENT
WATLOW WAY BEHAVIORS
1-ITEMFLOW
STD.WORK
BASIC6-S
PULLSYS.
SETUPREDUC-TION
BASICQUALITY CHECKS
TPM
TAKT TIME OUT -PUT
LOT-SIZE 1
ZERODEFECTS LEVEL-
ING
LOAD- LOAD
DEFECT-FREE ON-DEMAND
1-BY-1 LOWEST COST
VISUAL MANAGEMENT
WATLOW WAY BEHAVIORS
Linkag
Process
Value Stream Management Op System
What Does This Picture Tell Us? • Complexity is Still King• Recognized the WBS is a PDCA Cycle• Designed for Manufacturing• We recognized the need to incorporate people development through our WW transformationi h
Double Revenue Every 3-5 Yrs.50% Reduction in Defects every Year95% On Time to Request for Quotes, Prototypes, and Shipments
h e a t e r s | s e n s o r s | c o n t r o l l e r s
KA
N Future State VS PlanRIE A3s; VS Improvement Target & Future state Box
Score
Performance ReviewsMission Control Meetings
VSM Op SystemGemba Walks
Problem SolvingRCCA & Robust
CountermeasuresWW Self-AssessmentsInclude all Stakeholders
Reset Expectations
Analysis (2x/yr.)Customer
Satisfaction
SQDC Grow
th
& OP
Opportunity
Support Value Streams
Design & Development
Product Management
Demand Creation
New Product Development Value Streams
Supply Chain Delivery
Customer
Satisfaction
SQDC Grow
th
& OP
Opportunity
Support Value Streams
Design & Development
Product Management
Demand Creation
New Product Development Value Streams
Supply Chain Delivery
Update VS Operating
System (VSM)Linkage Process
Just Do-Its
Projects
Team Based Continuous
Improvement
Individual
IdeasManaging for Daily Improvement
g Op y
Sales, Operations, Financial Plan (“SOFP”)into the process
• Unfortunately, we looked at it as separateactivities
• We introduced a new term call Transformation Plan of Care was (TPOC)
•Purpose has not yet been addressed
Improve Labor Productivity by 1.5% MonthlyMeasure and Improve Organizational Effectiveness
Do

9/20/2011
17
Watlow Business System – Rev 38Strategy
Development
StrategyDeployment/True North
Plan
Act
What does this picture tell us:•Much more simplified and understandable
2011 Watlow Strategy• Grow to $500M by achieving #1 or #2 leadership
VSA
SOFPLead
ersh
ipLean NPDPortfolio
D
Act•The WBS is a simple PDCA Cycle•More holistic approach including all
improvement and development activities•All planning activities roll up into 1
business plan (SOFP)• Lean Product development integrated into
the system
y g pposition in targeted spaces (Optimize Performance of the Customers Thermal System)
• $150 M Revenue from new breakthroughsolutions (Product Leadership)
• Create capacity to grow by using the WatlowBusiness System (WBS) to achieve 12% annual
h e a t e r s | s e n s o r s | c o n t r o l l e r s
Breakthrough
VisualMgmt
Kaizen MDI Lean NPD
Do
Check
the system•People culture/culture development
integrated into the system•Leadership is defined as critical
productivity improvement• All Leaders achieve level 4 maturity in their personal
development
Epiphany 3 - Purpose
2011 Watlow Strategy• Grow to $500M by achieving #1 or #2
leadership position in targeted spaces (Optimize Performance of the Customers
From To2007 Watlow Business Strategy
Double Revenue Every 3-5 Yrs.50% Reduction in Defects every Year (Optimize Performance of the Customers
Thermal System)• $150 M Revenue from new breakthrough
solutions (Product Leadership)• Create capacity to grow by using the
Watlow Business System (WBS) to achieve 12% annual productivity improvement
• All Leaders achieve level 4 maturity in their
50% Reduction in Defects every Year95% On Time to Request for Quotes, Prototypes, and Shipments Improve Labor Productivity by 1.5% MonthlyMeasure and Improve Organizational Effectiveness
h e a t e r s | s e n s o r s | c o n t r o l l e r s
personal development
WE FINALLY GOT IT! ITS ABOUT…PEOPLE
PURPOSEPROCESS

9/20/2011
18
Epiphany 3: The Impact of Strategy/PurposeThe first principle of lean is about Creating Value
Our strategy now reflects where and with whom that value is being createdOur history and DNA said we were a “product leadership” company but our flow down was around QDC for 4 – 5 years of our transformation
This very much confused the organization and in some ways paralyzed our transformation
W h t t d h ld l VPWe have never targeted where we would apply our VPWe have always provided “everything for everybody” which created a very large job shop with high complexity and without scale
What’s Changed Since Our Strategy Has Better Articulated?We are very focused:
Attractive spacesStrategic Products and CustomersImprovement and Development Activities
Our Value Streams look very different. They are better focused on where the value is created
D d C ti d D li
h e a t e r s | s e n s o r s | c o n t r o l l e r s
Demand Creation and DeliveryWe have and are “cleaning out” products that are not strategic and do not flow
Creating ScaleWe have defined and focused on “Critical Capabilities”
Lean Product Development Thermal System ExpertiseLarge Customer ManagementUnderstanding our Markets and positioning ourselves to Win
5 Year True North ResultsSafety - TCIR Quality Escapes – Parts Per Million
4,000
6,000
8,000
10,000
12,000
Cus
tom
er E
scap
es (P
PM
)
1.00
1.50
2.00
2.50
66%% Improvement71% Improvement
Delivery - OED Productivity
-2,000
0
2,000
History 7,000 5,282 4,499 5,850 2,958
Target 3-Mo Avg 2,835 2,712 2,588 2,465 2,342 2,219 2,095 1,972 1,849 1,726 1,602 1,479
Actual 3-Mo Avg 3,877 5,762 4,669 4,993 3,485 3,254 2,564
Month PPM 2,759 10,447 2,503 4,223 4,027 1,765 2,169
UCL 5997.741242 5997.741242 5997.741242 5997.741242 5997.741242 5997.741242 5997.741242 5997.741242 5997.741242 5997.741242 5997.741242 5997.741242
LCL -82.04188633 -82.04188633 -82.04188633 -82.04188633 -82.04188633 -82.04188633 -82.04188633 -82.04188633 -82.04188633 -82.04188633 -82.04188633 -82.04188633
2006 2007 2008 2009 2010 Jan Feb Mar Apr May Jun Jul Aug Sep Oct Nov Dec0.00
0.50
History 2.32 1.89 2.24 2.24 1.17
3 Month Average 0.51 0.51 0.78 0.61 0.98 0.9 0.8
Target 2.00 1.95 1.95 1.90 1.85 1.80 1.75 1.70 1.65 1.60 1.55 1.50
YTD Average Actual 0.51 0.51 0.78 0.85 0.98 0.89 0.85
2006 2007 2008 2009 2010 Jan Feb Mar Apr May Jun Jul Aug Sep Oct Nov Dec
16.0
18.0
120 0%
140.0%
Sales $ / Team Member
h e a t e r s | s e n s o r s | c o n t r o l l e r s
0.0
2.0
4.0
6.0
8.0
10.0
12.0
14.0
Hist
oric
al D
ays
OED
(Bar
s)
0.0%
20.0%
40.0%
60.0%
80.0%
100.0%
120.0%
OED
Per
cent
of B
asel
ine
(Lin
es)
History 18.0 15.0 15.0 14.0 13.0
Target Pct of Baseline 97.9% 95.8% 93.8% 91.7% 89.6% 87.5% 85.4% 83.3% 81.3% 79.2% 77.1% 75.0%
Actual Pct of Baseline 102.0% 103.0% 101.0% 96.0% 95.0% 95.0% 94.0%
2006 2007 2008 2009 2010 Jan Feb Mar Apr May Jun Jul Aug Sep Oct Nov Dec
$147,600$147,400$149,900
$140,000$138,800
$90,000
$100,000
$110,000
$120,000
$130,000
$140,000
$150,000
$160,000
History $105,00 $115,00 $126,00 $130,00 $123,58 $139,40
Target $140,49 $141,89 $143,31 $144,74 $146,19 $147,65 $149,13 $150,62 $152,13 $153,65 $155,18 $156,74
Actual $138,80 $140,00 $149,90 $147,40 $147,60 $0 $0 $0 $0 $0
2005 2006 2007 2008 2009 2010 Jan Feb Mar Apr May Jun Jul Aug Sep Oct Nov Dec
History 2011
47% Improvement32% Improvement
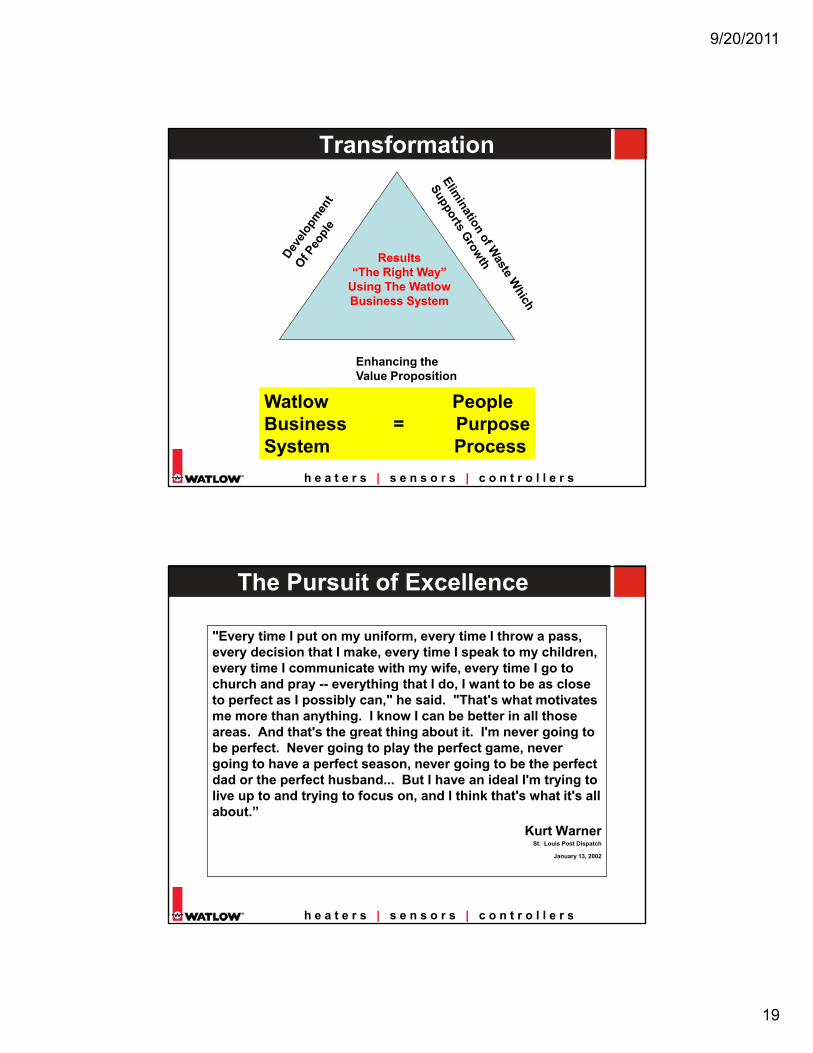
9/20/2011
19
Transformation
Enhancing the
Results“The Right Way”
Using The WatlowBusiness System
h e a t e r s | s e n s o r s | c o n t r o l l e r s
gValue Proposition
Watlow PeopleBusiness = PurposeSystem Process
"Every time I put on my uniform, every time I throw a pass, every decision that I make, every time I speak to my children, every time I communicate with my wife, every time I go to church and pray -- everything that I do I want to be as close
The Pursuit of Excellence
church and pray -- everything that I do, I want to be as close to perfect as I possibly can," he said. "That's what motivates me more than anything. I know I can be better in all those areas. And that's the great thing about it. I'm never going to be perfect. Never going to play the perfect game, never going to have a perfect season, never going to be the perfect dad or the perfect husband... But I have an ideal I'm trying to live up to and trying to focus on, and I think that's what it's all
h e a t e r s | s e n s o r s | c o n t r o l l e r s
about.”Kurt Warner
St. Louis Post Dispatch
January 13, 2002

9/20/2011
20
StrategyDevelopment
StrategyDeployment/True North
Failure ModesWe Have Seen
•Lack of clarity around strategy•Linkage gaps from level 1 to the cell•SD Created Without Team•Level 2 Contains Initiatives That Did Not Connect to Level 1
• Too Many Initiatives•Level 3 Reprioritized Level 1•Manufacturing Improvement Only•Improvement Plan Not Quantified
Plan
Act
Epiphany 4 - WBS Failure Modes
True North
VSA
SOFP
p Q•Not clear that the improvement actionsadd up to level 2 SD requirements
•Every VSA has n/10 events – whatdoes it take to deliver SD
• Productivity expectation for MDI and othercells not built in or communicated
•Not viewed as the business playbook•Labor Capacity Plan Only•VSA results not included•Product Development plans not included•Implementation Not a Priority
Lead
ersh
ip
Lean NPDPortfolio
Act
h e a t e r s | s e n s o r s | c o n t r o l l e r s
Breakthrough
VisualMgmt
•Event Benefit Tracker Not being used•Event Targets not established•MDI Cell not properly staffed•Lead and PTL developmentplans not being followed
•Not asking deep enough questions On the Gemba walks
•Ineffective event execution•Objective for Visual Mgmt Unclear• Not following standards•Unable to identify abnormalities
Kaizen MDI Lean NPD
Do
Check
Clarity of WBS and The Failure ModesBetter understanding of the WBS as a PDCA process
Closed loopEver changing and improving
Epiphany 4 – Results of Understanding WBS Failure Modes
Created some level of improvement and consistencySite Reviews – they follow the processVisual Management – PDCAImproved VSA processPortfolio Decision Making – VSA and Product DevelopmentUnderstanding the role of SOFPGoal linkage from the Enterprise to the cell
h e a t e r s | s e n s o r s | c o n t r o l l e r s
Goal linkage from the Enterprise to the cellImproved focus on “standards”
Better understood that “variation between” is just as harmful as “variation within”
Allowed us to focus on gaps/failure modes
Recommended