VEHICLE WATCH AND CAR THEFT:AN EVALUATION
TERRY HONESS AND MICHAEL MAGUIRE
WITH THE ASSISTANCE OF ELIZABETH CHARMAN
POLICE RESEARCH GROUPCRIME PREVENTION UNIT SERIES: PAPER NO.50LONDON: HOME OFFICE POLICE DEPARTMENT
Editor: Gloria Laycock
Home Office Police Research Group
50 Queen Anne’s Gate
London SW1H 9AT
© Crown Copyright 1993First Published 1993
Police Research Group: Crime Prevention Unit Series
The Home Office Police Research Group (PRG) was formed in 1992 to carry out andmanage research in the social and management sciences relevant to the work of thepolice service and Home Office policy divisions. One of the major police departmentdivisions which acts as customer for the PRG is the Home Office Crime PreventionUnit which was formed in 1983 to promote preventive action against crime. It has aparticular responsibility to disseminate information on crime prevention topics.
The object of the present series of occasional papers is to present research material in away which should help and inform practitioners, including the police, whose workcan help reduce crime.
ISBN 1 85893 091 X
(ii)

Foreword
Neighbourhood Watch has proved to be one of the most popular of crime preventionmeasures with over 115,000 schemes in existence in England and Wales coveringsome 5 million households. It has spawned a wide variety of look-alikes – Boat Watch,Shop Watch and, of course, Vehicle Watch.
The scheme was popular with the public and on the Welsh housing estate which wasthe focus of a pilot scheme. The police too were enthusiastic supporters.
However, as with all these initiatives a key question is the extent to which they reducecrime and this report attempts to assess the extent to which Vehicle Watch reducesthe risk of vehicle theft for members of the scheme. This proved a difficult question toanswer because of evidence provided in the report that Vehicle Watch members weremore likely to take greater care of their cars than non-members – they garage theirvehicles overnight, for example, which significantly reduces risk, and they are morelikely to leave their cars where they can keep an eye on them.
Vehicle Watch, if implemented properly, is extremely resource-intensive for thepolice. This report shows that it may well be worth the investment in local areassuffering high rates of motor vehicle theft, but that we should not necessarily expectmajor reductions in vehicle theft across the board.
I M BurnsDeputy Under Secretary of StateHome OfficePolice Department
December 1993
(iii)
Acknowledgements
The considerable co-operation afforded by Gwent Police, in particular Superintend-ent Joe Sanderson and Sergeant Jon Brown, is gratefully acknowledged, as is thesupport and interest of members of the Police Research Group at the Home Office,particularly Mr Ben Brown.
The Authors
The research presented in this paper was carried out up under the auspices of Michaeland Associates, an independent social policy research organisation, and undertakenby Terry Honess and Michael Maguire of the University of Wales, Cardiff. TerryHoness is Senior Lecturer in Psychology and Michael Maguire is a Senior Lecturer inCriminology. Assistance was provided by Elizabeth Charman, who is a SeniorResearch Associate at the University of Wales.
(iv)
ContentsPage
Foreword. . .iii
Acknowledgements iv
List of Tables vii
List of Figures vii
1. Introduction 1
Origins and development of Vehicle Watch 1Vehicle Watch in Wales 1Existing analyses of Vehicle Watch 2Aims and methods of the current study 5Structure of the report 5
2. Vehicle Watch and Trends in Vehicle Theft 7
Trends in vehicle theft in Gwent 8Vehicle theft: comparison with other force areas 9Vehicle theft: comparison with the national figures 10Discussion of findings 11
3. Comparison of Members’ and Non-Members’ Victimisation Rates 13
Difficulties in establishing levels of victimisation 13Methodology adopted in the current study 13Obtaining victim information 16Results of analysis 16Summary of findings 17
4. Comparison of Members’ and Non-Members’ Vulnerability to Car Theft 18
Methodology employed 18Age, gender and vehicle ownership 18Car use, parking and security behaviour 19
5. Views and Experiences of the Scheme 22
Views of members 22Views of non-members 23The police perspective 24
(v)
6. Summary and Conclusions
Assessment of effect in key areasOverall conclusions
References
Appendix A All Recorded Offences of Theft and Unauthorised Taking forNewport, Gwent, Avon & Somerset and South Wales,September 1990 – August 1992
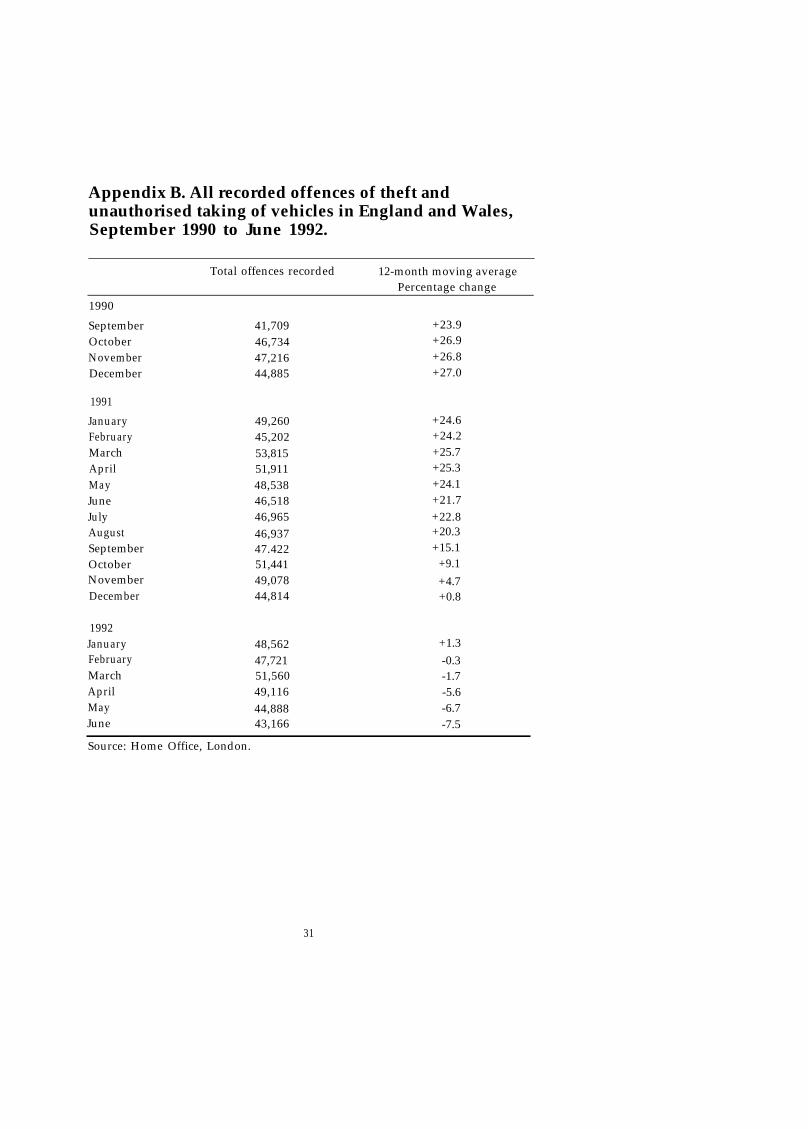
Appendix B All Recorded Offences of Theft and Unauthorised Taking ofVehicles for England and Wales, September 1990 - June 1992
Appendix C Postal Questionnaire concerning Victims of Car Theft
Appendix D Home Office Car Crime Survey: Questionnaire for StreetSurvey of Newport Car Owners
Appendix E Comparison of Parking Habits of Members and Non-Members
Police Research Group Crime Prevention Unit Papers
26
2627
28
29
31
32
34
41
43
(vi)
List of Figures
Figure No. Caption
1 Monthly figures for theft and unauthorised taking ofvehicles in Newport and Gwent, September 1990 toAugust 1992.
2 Monthly figures for theft and unauthorised taking ofvehicles in South Wales and Avon & Somerset policeforces, September 1990 to August 1992.
3 Monthly figures for theft and unauthorised taking ofvehicles in all England and Wales, September 1990 toJune 1992.
List of Tables
Table No. Caption
1 Changes in the annual totals of car theft, September1990 to August 1991 and September 1991 to August1992 – one year before and one year after the Gwentlaunch of Vehicle Watch
2 Vehicle Watch membership in Gwent to September1992
3 Method of arriving at ‘true figure’ for thefts of cars fromGwent residents April to June 1992
4 Membership in relation to risk category of car owned
5 A summary of the differences in security related behav-iour between members and non-members of VehicleWatch
Page
8
9
11
Page
10
14
15
19
20
(vii)
1. Introduction
Origins and development of Vehicle Watch
Vehicle Watch, like Neighbourhood Watch, has North American origins. The basicconcept has been credited to US Senator P. Stavisky who, in April 1986, persuadedpolice in the Queen’s area of New York to set up a pilot project called ‘Combat AutoTheft’, or ‘CAT’. Under this project, participating car owners signed a form statingthat their vehicle would not normally be in use between 1am and 5am. They also gavepermission for police officers to stop and check their car, without further reason, if itwas seen being driven during those hours. A bright yellow sticker was then attached tothe windscreen of each member’s car in order that such vehicles could be readilyidentified by the police.
The first British police force to adopt a similar scheme, and to coin the name ‘VehicleWatch’, was Cumbria Constabulary. In October 1989, it issued stickers for front andrear windows of cars to all owners willing to give permission for police stops betweenmidnight and 5am. Several other forces quickly followed suit and a survey conductedby the Home Office Crime Prevention Unit during 1990 identified a total of 13 forceswith such schemes. In February 1990, the Association of Chief Police Officers(ACPO) noted that the various schemes had failed to adopt any standardised code ofpractice and issued guidelines for future operation. These recommended that night-time schemes, which were by far the most common, should cover the period chosen byCumbria Constabulary (midnight to 5am) and should use circular, fluorescent yellowstickers made of high quality plastic, displayed on front and rear windows.
The most recent national picture of the development of Vehicle Watch was obtainedby Brown (1992) through a survey of all the 43 police forces in England and Wales,which was conducted in September-October 1991. This showed that 27 of the 43forces were operating, or would be operating by the end of 1991, a Vehicle Watchscheme in at least part of their territory. Brown’s survey showed that schemes werestill developing in a diverse and generally uncoordinated fashion, varying from forcewide initiatives to ‘shoestring’ projects in small areas. They also varied widely in termsof whether or not members were formally registered and lists kept of their names,whether or not a joining fee was levied and whether incentives, such as free windowetching, were offered. Owing to the generally poor standard of the registration andrecord-keeping systems used, Brown rightly questioned the accuracy of the levels of‘take up’ reported by many of the forces. With suitable expressions of caution, heestimated total participation in England and Wales at just under 440,000 vehicles atthe end of October 1991. This represented well under two percent of all registeredvehicles.
Vehicle Watch in Wales
Forces in the Principality of Wales have demonstrated a particularly high level ofcommitment to the Vehicle Watch concept. The first scheme was set up in Septem-
1
ber 1990 by Gwent Constabulary in Bettw’s, a large housing estate with a populationof about 9,000, which is situated on the outskirts of Newport, Gwent. This area waschosen as car crime made up an abnormally large proportion of its recorded crimefigures. The Bettws scheme conformed to the ACPO guidelines, but differed frommost others in terms of the extra benefits which it offered to members. Owing to anexceptional level of cooperation between the local police and other organisations(especially garages, motor manufacturers and insurance companies), membership wasfree and included the provision of security markings for cars and car radios, publicityin the local media – in the event of a member’s car or contents being stolen – andvarious insurance and motor trade discounts. Largely as a result of the energy withwhich the scheme was promoted, enhanced by a well organised enrolment system,membership rates in Bettws were impressive with over 50 percent of car owners on theestate joining within a few weeks. This was far in excess of rates reported by otherschemes.
A brief initial evaluation of the Bettws scheme, which was undertaken by GwentConstabulary (Brown, 1990), suggested that it had proved successful in gaining publicsupport and had resulted in an immediate fall in the level of car crime on this estate.Consequently, Gwent Constabulary enlisted the cooperation of the other Welshpolice forces in setting up an all-Wales Vehicle Watch scheme, which was launched,with considerable publicity, in September 1991. The extended scheme was lesselaborate than that implemented in Bettws, but membership remained free and someof the additional incentives were still provided. Membership rates among the Gwentpublic were particularly impressive with over 25,000 people enroling within the firstfour months and more than twenty percent of relevant vehicles registered in the forcearea ultimately entering the scheme. Like its predecessors, the Gwent scheme wastargeted at private cars and light vans. Precise figures are not available for other forceareas in Wales, but the membership rate is generally accepted to he far lower. Thehigher penetration of the Gwent scheme has been attributed to the strong sense oflocal identity in this small county coupled with the publicity surrounding the launchwhich is believed to have reached a high proportion of the population and to havefixed the scheme in people’s minds as a local initiative.
Existing analyses of Vehicle Watch
Reliable evaluations of Vehicle Watch are very difficult to achieve. Several policeforces have claimed encouraging results but there are only two evaluations, bothhighly favorable to the scheme, which deserve serious attention. These are a moredetailed study undertaken by Gwent Constabulary (Brown, 1992) and an assessmentcarried out by the Hartlepool Safer Cities Project Research Unit (1992).
Hartlepool study
The Safer Cities evaluation, which examined the operation of a Vehicle Watchscheme in Hartlepool during the period August 1990 to July 1991, concluded that
2
II
I
“vehicles not registered with the scheme are … over four times more likely to bestolen than vehicles which are registered” (page 7). However, the authors concedethat, encouraging though this sounds, there was no conclusive evidence that it was aneffect of Vehicle Watch per se rather than a feature of other differences (e.g. insecurity behaviour or exposure to risk) between members and non-members of thescheme.
Furthermore, the method used to calculate the relative victimisation rates of thesetwo groups may be open to some criticism. This involved constructing a list of theregistration numbers of all vehicles recorded by the police as ‘taken without consent’during the one year period in question and comparing the contents with vehicleregistration numbers given by all 4,172 people who had joined the Hartlepool VehicleWatch scheme in that year. This showed that only 66 (less than four percent) of theenroled vehicles appeared in the stolen vehicle records. The figure of under fourpercent was juxtaposed with a figure of approximately fifteen percent for the VehicleWatch ‘take up’ in the town and the conclusion was drawn that thefts from membersstood at about a quarter of the ‘expected’ rate. Unfortunately, this conclusion did nottake into account that:
l
l
l
l
Vehicles were constantly moving in and out of the area: Hartlepool residents’ cars,including those registered with Vehicle Watch, may be stolen elsewhere. Equally,vehicles belonging to mm-residents, a few of whom would be enroled in otherVehicle Watch schemes, may be stolen in Hartlepool. At a minimum, thefts ofvehicles belonging to people not resident in Hartlepool should have been excludedbefore further analysis was undertaken;
Membership of Vehicle Watch was not static throughout the year: the authorspoint out that the figure of 4,172 members includes people joining at any timeduring the twelve month period. No detailed information on joining dates wasavailable to determine whether the reported thefts occurred before or after anyindividual joined;
People frequently change their vehicles and some of the stolen cars assumed tobelong to non-members may have belonged to members who had transferredtickers from a previous vehicle without recording the change. Similarly, somenon-member vehicles might still have displayed stickers belonging to a previousowner;
Some of the non-members’ vehicles which were stolen were likely to have beenmotor cycles, lorries and other commercial vehicles, rather than the private carsand light vans which constitute the bulk of vehicles registered to Vehicle Watchmembers. If the researchers were to make an accurate comparison, all such theftsshould have been excluded from the initial sample to avoid biasing results in favourof the Vehicle Watch scheme.
3
All of the above factors are likely to have reduced the accuracy of the estimates of thevulnerability of members and non-members of Vehicle Watch to car theft. It is notpossible to determine with any certainty whether this led to an over or under estimateof the impact of Vehicle Watch. The researchers were of the opinion that the secondand final factors may have exercised particularly biasing effects and together producedan over estimate of the impact of Vehicle Watch.
Gwent study
Brown’s study (1992) of Vehicle Watch in Gwent concludes that:
“While there are many factors which can influence the degree of vehicle crime,there can be little doubt from the evidence examined that the implementationof Vehicle Watch has resulted in lower crime rates for its members and has had asignificant impact on the overall level of vehicle crime in the county. Inaddition, fear of crime has been reduced and police/public relations haveimproved. There is also evidence to suggest that Vehicle Watch has led tomembers being less complacent and more security conscious, many fittingadditional security devices to their vehicles.” (p 125).
Unfortunately, although the study provided much valuable material unavailableelsewhere, it again failed to produce a completely reliable answer to the key questionof whether membership of Vehicle Watch reduces a person’s chances of falling victimto car theft. The research design employed represents an important advance on thatadopted in Hartlepool: efforts were made to take account of the possibility that thekinds of people who join Vehicle Watch constitute a population which is already lessvulnerable to car theft than the population not inclined to enrol. However, therewere certain flaws in the data purporting to establish the actual rates of theft againstmembers and non-members. The central problem stemmed from the method chosento classify offences according to whether they were against ‘members’ or ‘non-members’. Here, Brown’s system was potentially weaker than that used in Hartlepool,in that it depended upon the diligence of the numerous individual police officersresponding to reports of car theft.
The classification system used required all Gwent officers attending such incidents toask victims whether they were members of the scheme and, if they were, to mark thecrime report form with ‘Vehicle Watch’. Members of CID Administration staff werethen required to pick out all reports marked ‘Vehicle Watch’ and to pass these on tothe Vehicle Watch office at police headquarters. This faith in the memory andcommitment of busy police officers may have been misplaced and, as later analysis willdemonstrate (see section 3), can lead to major under-counting of cases in which thevictims were members. Brown also failed to exclude from his theft rates vehicles suchas lorries which would not normally be targeted by the scheme, and may accordinglyhave over-estimated further the level of crime against non-Vehicle Watch members.Finally causality was perhaps too readily attributed by this study when the level ofvehicle crime in Gwent fell after Vehicle Watch was introduced (see section 2).
4
Aims and methods of the current study
The study described within the current report was designed to throw further lightupon questions about the impact and effectiveness of Vehicle Watch. This involved amore detailed evaluation focusing upon the whole of Gwent and taking separateaccount of findings for the main town in the area (Newport) in some instances. Fourkey research questions were addressed:
i. Does Vehicle Watch appear to have had any effect upon the overall level ofvehicle theft (including unauthorised taking) in the areas studied?
ii. Does membership of Vehicle Watch reduce an individual’s chances of becom-ing a victim of vehicle theft (in comparison with non-members)?
iii. Does the Vehicle Watch scheme attract individuals who are anyway lessvulnerable to vehicle theft? In addition, does membership of the scheme haveany impact upon the security behaviour of those who join?
iv. What do members, non-members and police officers see as the main benefitsand the main disadvantages of the scheme?
It has to be acknowledged at the outset that this was not an exhaustive study of theimpact of Vehicle Watch. The study does not consider effects on theft from vehiclesand on crime detection; longer term impacts of Vehicle Watch are not assessed andthe offender’s perspective is not addressed. A full and conclusive evaluation wouldinevitably have involved the detailed consideration of these and other questions,several of which raise complex methodological problems and all of which meritattention in future studies. For example, separate analysis of each category of carcrime (theft of, theft from, damage to, unauthorised taking of and so on) mightsubsequently he required. A wider variety of possible effects produced by VehicleWatch, including those relating to crime displacement and public perceptions of thepolice, could also be considered. The question of whether the level of impact ‘peaks’at a certain membership level, with growth thereafter having a lesser (or evennegative) effect, might also be addressed.
Structure of the report
Section 2 of the report presents a comparison between car theft figures for Gwent andthose for surrounding areas before and after the launch of the initiative. A comparisonis also made with national data. The extent to which this material confirms thatVehicle Watch has had a positive impact upon car theft is considered. An attempt isthen made in section 3 to compare victimisation rates for members and non-membersusing data gathered in a postal survey of Gwent residents who had their cars stolenbetween 1 April and 30 June 1992. Section 4 describes results from a street survey,which was carried out to discover whether there were any key differences between
5

members and non-members in Newport, including age, gender and attitudes and/orbehaviour in respect to car security. Section 5 goes on to provide a general descriptionof the views and experiences of the scheme communicated by both police officers andthe general public. Final conclusions about the impact of Vehicle Watch are pres-ented in section 6.
Fuller discussion of data sources and the research methodology is presented atappropriate points in the course of the report; questionnaires and research instru-ments are reproduced within the appendices.
6
2. Vehicle Watch & Trends in Vehicle Theft
The possible impact of Vehicle Watch on trends in vehicle theft in Gwent was firstexamined directly using police data. It was anticipated that, if Vehicle Watch had hadany impact, the level of car theft might have diminished after the scheme waslaunched in this area during September 1991. These car theft figures were comparedwith those for surrounding areas in order to measure Gwent’s relative performanceand to ensure that less marked impacts, or even reductions on the expected increase,were not overlooked.
It might be expected that, if Vehicle Watch exhibited any real impact on car crime,Gwent would outperform South Wales, which in turn might have been expected tooutperform Avon and Somerset. This is so in that the “take up” rates in South Walesare widely believed to be much lower than those in Gwent even though the “AllWales” scheme was launched in all counties of the principality at the same time. Thesituation for Avon and Somerset is quite different and deserves brief mention.
There is no police-led Vehicle Watch scheme in Avon and Somerset, rather there is ascheme in operation that is described by the police as “co-ordinated by volunteersthrough the Crime Prevention Panel with police advice only”, i.e. the scheme is notsupported by police involvement in the way that it is in Gwent.
There is, moreover, a one pound charge levied for membership, funds for which areused for a variety of different crime prevention projects. Voluntary effort is directedtowards returning forms and stickers. No membership records have been kept butmembership is estimated to be a negligible proportion of the number of registeredvehicles according to the chair of the Crime Prevention Panel (personal communi-cation to the authors). This is consistent with Brown (1992) who reports membershipof 18,000 in the Avon and Somerset scheme at November 1991. Using December1991 ‘plg’ vehicle registration figurd as a base this would give a membership level ofless than three percent. On any criterion, the Avon and Somerset scheme is unlikethat operating in Gwent.
Monthly totals of vehicle thefts recorded by the police in the Gwent, South Walesand Avon and Somerset force areas, as well as in the Newport division of GwentConstabulary, were obtained from the various forces in support of the exercise1. Thesefigures covered the year leading up to the launch of Vehicle Watch in Wales and theyear following its introduction i.e. September 1990 through to August 1992. A lessdetailed comparison of the Gwent situation with national figures was also undertaken.
Before examining these figures, it should be remembered that the reporting rate for cartheft, i.e. the proportion of all car thefts known to victims which are subsequently
1‘Newport’ is used throughout consideration of police crime houses as shorthand for ‘A’ Division of GwentConstabulary.
7
reported to the police, is higher than that for virtually any other kind of offence(Hough & Mayhew, 1985). Therefore, any observed shifts in the officially recordedtotals for this category of crime are unlikely to be explained simply by changes in thereporting habits of the public or the recording practices of the police.
Trends in vehicle theft in Gwent
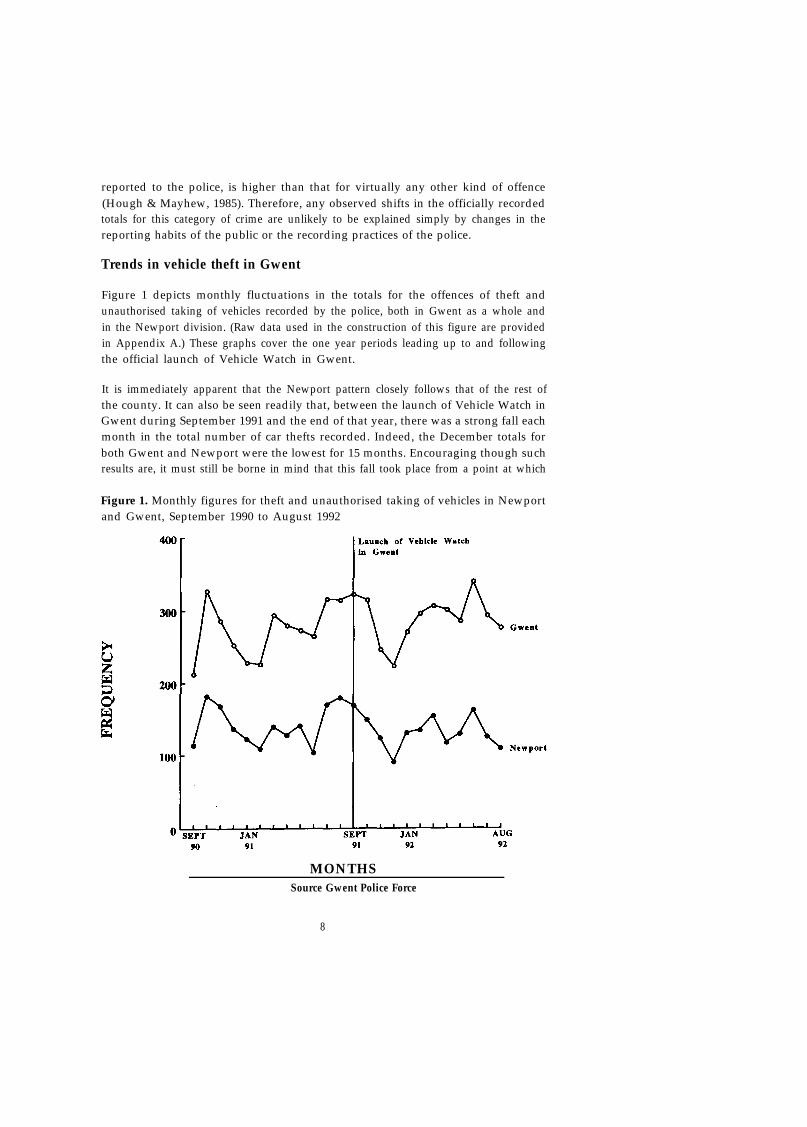
Figure 1 depicts monthly fluctuations in the totals for the offences of theft andunauthorised taking of vehicles recorded by the police, both in Gwent as a whole andin the Newport division. (Raw data used in the construction of this figure are providedin Appendix A.) These graphs cover the one year periods leading up to and followingthe official launch of Vehicle Watch in Gwent.
It is immediately apparent that the Newport pattern closely follows that of the rest ofthe county. It can also be seen readily that, between the launch of Vehicle Watch inGwent during September 1991 and the end of that year, there was a strong fall eachmonth in the total number of car thefts recorded. Indeed, the December totals forboth Gwent and Newport were the lowest for 15 months. Encouraging though suchresults are, it must still be borne in mind that this fall took place from a point at which
Figure 1. Monthly figures for theft and unauthorised taking of vehicles in Newportand Gwent, September 1990 to August 1992
MONTHSSource Gwent Police Force
8
car thefts were historically high, i.e. there is a possibility that a random peak wassimply followed by an equally random trough. Moreover, figure 1 demonstrates thatrecorded thefts began to rise again from the beginning of 1992 and by mid-summerstood at or above the pre-launch level. The incidence of car theft did, however, fall inthe last two months included in the analysis (July and August 1992).
Vehicle theft: comparison with other force areas
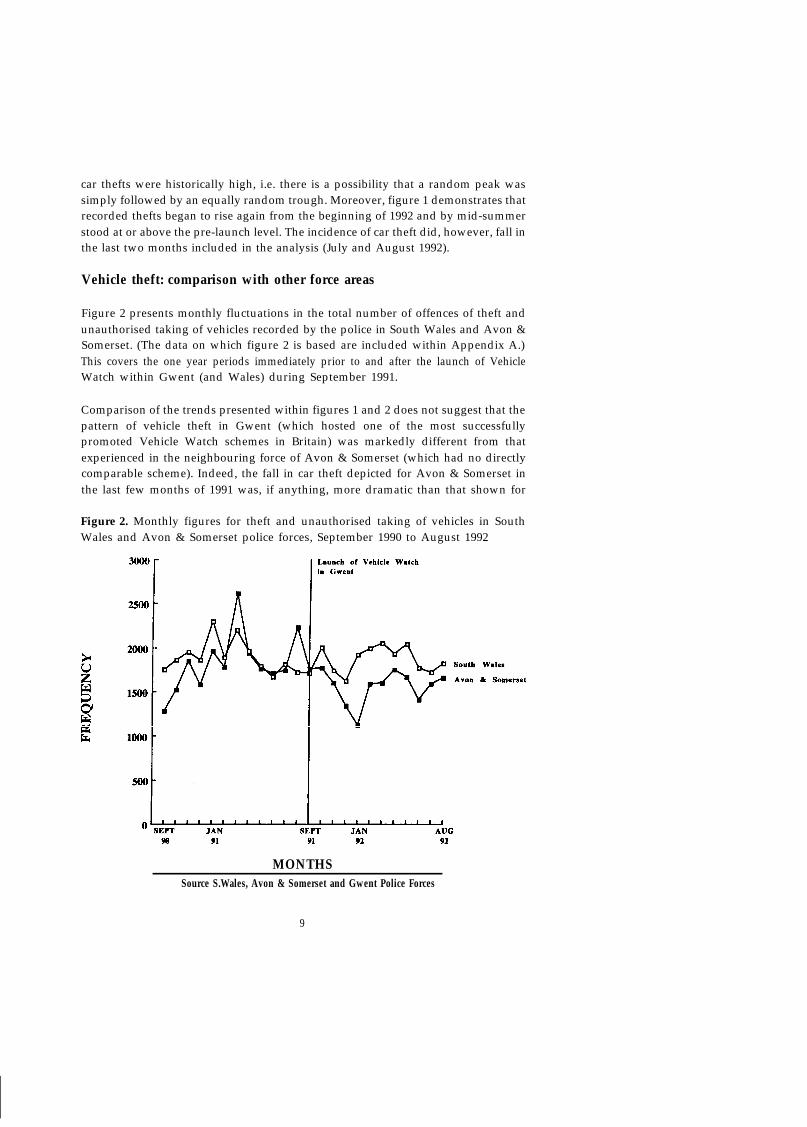
Figure 2 presents monthly fluctuations in the total number of offences of theft andunauthorised taking of vehicles recorded by the police in South Wales and Avon &Somerset. (The data on which figure 2 is based are included within Appendix A.)This covers the one year periods immediately prior to and after the launch of VehicleWatch within Gwent (and Wales) during September 1991.
Comparison of the trends presented within figures 1 and 2 does not suggest that thepattern of vehicle theft in Gwent (which hosted one of the most successfullypromoted Vehicle Watch schemes in Britain) was markedly different from thatexperienced in the neighbouring force of Avon & Somerset (which had no directlycomparable scheme). Indeed, the fall in car theft depicted for Avon & Somerset inthe last few months of 1991 was, if anything, more dramatic than that shown for
Figure 2. Monthly figures for theft and unauthorised taking of vehicles in SouthWales and Avon & Somerset police forces, September 1990 to August 1992
MONTHSSource S.Wales, Avon & Somerset and Gwent Police Forces
9
Gwent. This does not immediately suggest that the introduction of Vehicle Watchexerted any significant impact upon the level of car crime in Gwent.
The comparison with South Wales, Gwent’s other neighbouring force, provides amore ambivalent picture. Nevertheless, an overall comparison of information con-tained within figures 1 and 2 suggests that car crime trends in all the areas followedroughly the same pattern and that Gwent did not exhibit a more marked decrease.
It had also been planned to compare car crime trends for Newport with those fromCardiff (the principal city in South Wales) and Bristol (the principal city in Avon &Somerset). Unfortunately, changes to the boundaries used in the collection ofstatistics within the two latter cities meant that comparable data were not availableover the two year period of interest. Changes in offence totals in Newport (andGwent) between the years before and after the Vehicle Watch launch could, how-ever, be calculated and were compared with those experienced in South Wales andAvon & Somerset. The results presented in table 1 suggest that Newport performedconsiderably better than the rest of Gwent and slightly better than South Wales.When compared to other areas, Gwent does not appear to have experienced anyparticular success in combating car theft. Even the six percent reduction recorded forNewport was overshadowed by a more dramatic decrease of fourteen percent in Avon& Somerset where there was no comparable Vehicle Watch scheme.
Table 1: Changes in the annual totals of car theft, September 1990 to August 1991and September 1991 to August 1992 - one year before and one year after the Gwentlaunch of Vehicle Watch.
Change in Total Number Percentage Change
Newport -102 -6.0%Gwent +195 + 6 . %Avon & Somerset -3106 -14.1%South Wales -451 -2.0%
Source: Gwent, Avon & Somerset and South Wales police forces.
Vehicle theft: comparison with the national figures
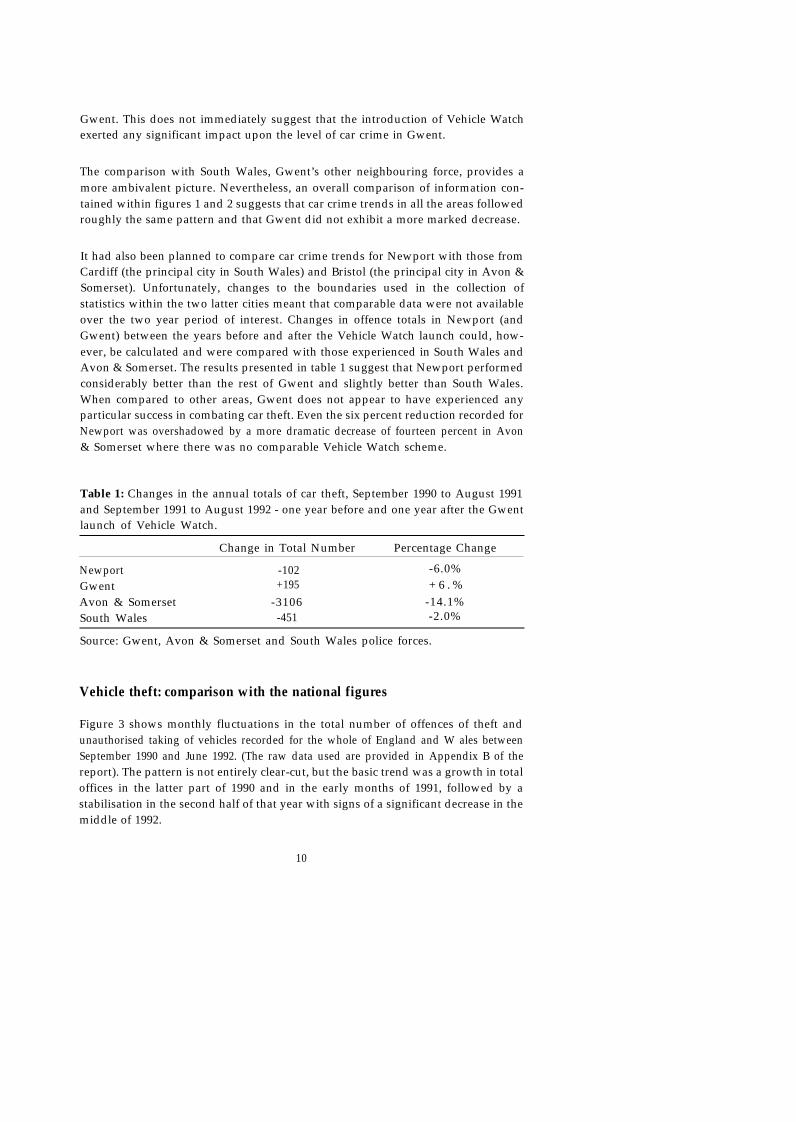
Figure 3 shows monthly fluctuations in the total number of offences of theft andunauthorised taking of vehicles recorded for the whole of England and W ales betweenSeptember 1990 and June 1992. (The raw data used are provided in Appendix B of thereport). The pattern is not entirely clear-cut, but the basic trend was a growth in totaloffices in the latter part of 1990 and in the early months of 1991, followed by astabilisation in the second half of that year with signs of a significant decrease in themiddle of 1992.
10
In this context, it becomes apparent that the decline in car theft experienced inGwent following the introduction of the Vehicle Watch scheme (see figure 1) needsto be interpreted with utmost caution. It was not significantly out of line with nationaltrends. Indeed, if one compares all forces over a longer period, Gwent does not rate asone of the more successful in reducing car theft. The total offences of car theft inEngland and Wales for the year July 1991 to June 1992 (the latest 12 month period forwhich figures were available at the time of writing) were 3.6 percent greater then thetotal for the previous twelve months. In Gwent, the increase over the equivalentperiod was 16.4 percent.
Figure 3. Monthly figures for theft and unauthorised taking of vehicles in all Englandand Wales, September 1990 to June 1992
MONTHSSource: Home Office, London
Discussion of findings
The data presented in this section suggest that while it is possible that Vehicle Watchhad a temporary effect on car theft rates in Gwent, the case is by no means a strongone. It is anyway notoriously unsafe to draw causal inferences from apparent associ-ations between any one factor and a change in recorded crime rates, even when theassociation appears strong and consistent. There are so many other possible factorswhich could account for the change. To do so on the basis of a ‘dip’ in car crime figuresin one area is unjustifiable, especially if there is evidence of decreases in surroundingareas which have negligible take up rates.
11
It is also tempting, given the high level of publicity which accompanied the launch inGwent, to conclude that Vehicle Watch produced there what Cook (1980) hasreferred to as a “slam bang” deterrent effect. A sudden fall in crime rates, followed by asteady return to previous levels. This effect is observed with many high profile crimeprevention initiatives (Maguire, 1982) and could have manifested itself in this case bypromoting temporary caution among potential car thieves or ‘joy riders’, who werefaced with a new and not yet fully understood threat of being caught. However, theresults of a small number of interviews conducted by Brown (1992) in Gwent and amuch larger number carried out by Light (1993) in other parts of the country,contains little evidence to suggest that the presence of a Vehicle Watch stickerparticularly deters potential offenders. Eighty two percent of the offenders in Light’sstudy did not think the scheme would be effective in stopping cars being stolen, and asmall number had taken cars with Vehicle Watch stickers in them. According toLight, some offenders claimed that the stickers could be easily peeled off, and oneeven claimed to steal ‘Vehicle Watch’ cars deliberately – “because as it’s got a stickerin they [the police] never bother” (Light 1993, p53).
In sum, from this part of the analysis, there is no conclusive evidence of any impact ofVehicle Watch on the overall incidence of car theft in a particular area.
12
3. Comparison of Members’ and Non-Members’Victimisation Rates
Difficulties in establishing levels of victimisation
Earlier discussions of existing studies (see section 1) suggested that the question ofwhether there were discernible differences in victimisation rates between VehicleWatch members and non-members requires careful attention if it is to be answeredaccurately. Ideally, a scrupulously accurate list of vehicles stolen in a defined area andtime period would be available and every case would be carefully checked againstperfectly maintained records of local Vehicle Watch membership providing precise.joining dates. This procedure would ensure that victims would be more accuratelyclassified as members and non-members before comparisons were made with expectedlevels of victimisation (based on detailed local population statistics) for both groups.Nonetheless, the calculation of the relative theft rates would still be complicated bythe problem of vehicles from other areas being stolen in the area of interest and viceversa, as well by the need to separate out, from the full set of vehicle thefts, thoseagainst private cars and light vans
Available data and statistics in Gwent did not allow the above procedures to befollowed. It quickly became apparent that membership records were inadequatelystructured and that it would prove enormously difficult to check the victim of eachrecorded crime against a full list of members. Even if each name could have beenchecked, the absence of a date on the Vehicle Watch enrolment form meant thatthere would still be no way of knowing whether the person had joined before or afterthe theft took place1. Gwent Constabulary had already recognised these difficultiesand, to counter them, had introduced a method of identifying victimisation againstVechicle Watch members which instead relied upon officers noting “Vehicle Watch”on crime reports. Potential problems with this approach have already been discussed(see section 1) and, as will be shown presently, it is considered to lead to substantialunder-reporting of crime against Vehicle Watch members. The researchers conse-quently concluded that the most practical and reliable way of establishing whether ornot victims had been members of Vehicle Watch at the time of the theft was to contactthem and ask for this information. The question then became how to achieve thiseconomically with a large enough sample of cases to allow confidence in the results.
Methodology adopted in the current study
The strategy adopted in the current study revolved contacting a sample of victimsdrawn from police crime reports through a short postal questionnaire. This device was
1Members’ details are slowly being recorded on the Police National computer, which could eventually besearched for the relevant information, but large backlogs have built up with only one third of membersrecorded. This makes the PNC as yet an unreliable source of information about members. Furthermore,adding members’ details to PNC is also considered to be a time consuming and expensive exercise and willneed to be carefully monitored.
13
used to establish what proportion of the sample had been displaying a Vehicle Watchsticker on their car at the time it was stolen. The resulting figure was then comparedwith the proportion of Vehicle Watch members in the local car-owning population asa whole. The hypothesis was that if the former proportion was significantly lower thanthe latter, this would provide prima facie evidence that Vehicle Watch members wereless likely than non-members to have their cars stolen.
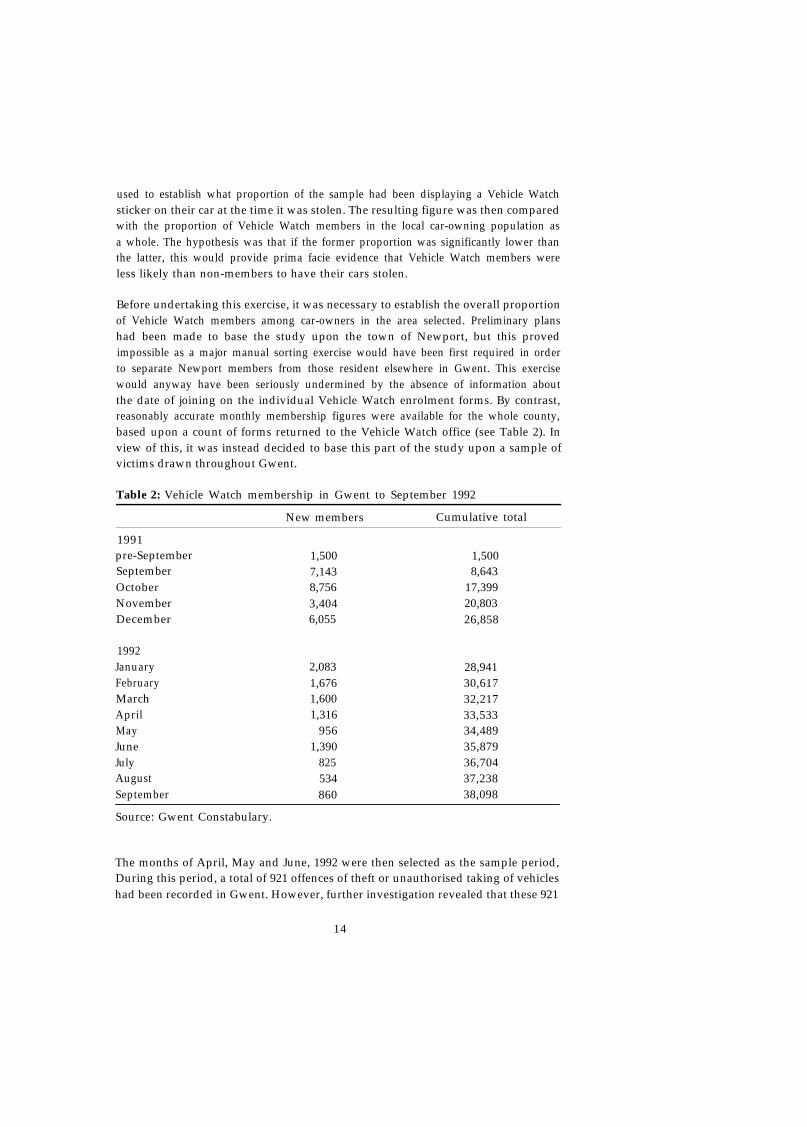
Before undertaking this exercise, it was necessary to establish the overall proportionof Vehicle Watch members among car-owners in the area selected. Preliminary planshad been made to base the study upon the town of Newport, but this provedimpossible as a major manual sorting exercise would have been first required in orderto separate Newport members from those resident elsewhere in Gwent. This exercisewould anyway have been seriously undermined by the absence of information aboutthe date of joining on the individual Vehicle Watch enrolment forms. By contrast,reasonably accurate monthly membership figures were available for the whole county,based upon a count of forms returned to the Vehicle Watch office (see Table 2). Inview of this, it was instead decided to base this part of the study upon a sample ofvictims drawn throughout Gwent.
Table 2: Vehicle Watch membership in Gwent to September 1992
New members Cumulative total
1991pre-SeptemberSeptemberOctoberNovemberDecember
1992JanuaryFebruaryMarchAprilMayJuneJulyAugustSeptember
1,5007,1438,7563,4046,055
2,0831,6761,6001,316
9561,390
825534860
1,5008,643
17,39920,80326,858
28,94130,61732,21733,53334,48935,87936,70437,23838,098
Source: Gwent Constabulary.
The months of April, May and June, 1992 were then selected as the sample period,During this period, a total of 921 offences of theft or unauthorised taking of vehicleshad been recorded in Gwent. However, further investigation revealed that these 921
14
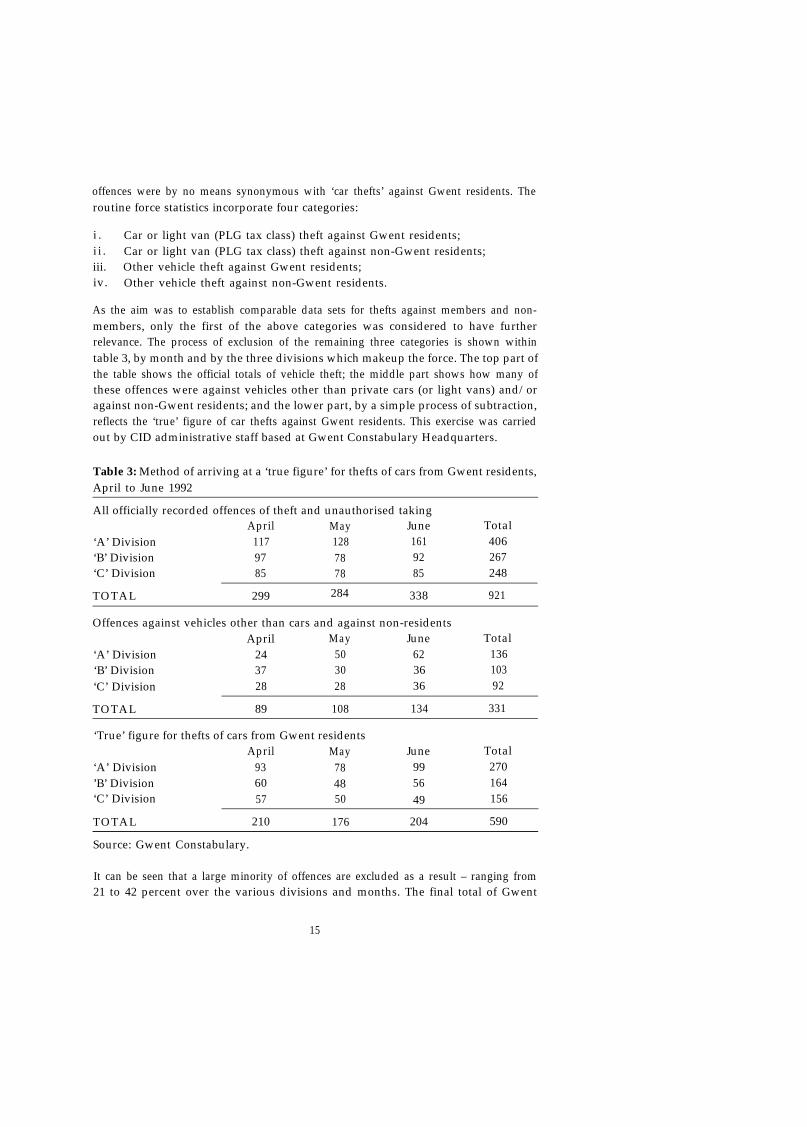
offences were by no means synonymous with ‘car thefts’ against Gwent residents. Theroutine force statistics incorporate four categories:
i . Car or light van (PLG tax class) theft against Gwent residents;i i . Car or light van (PLG tax class) theft against non-Gwent residents;iii. Other vehicle theft against Gwent residents;iv. Other vehicle theft against non-Gwent residents.
As the aim was to establish comparable data sets for thefts against members and non-members, only the first of the above categories was considered to have furtherrelevance. The process of exclusion of the remaining three categories is shown withintable 3, by month and by the three divisions which makeup the force. The top part ofthe table shows the official totals of vehicle theft; the middle part shows how many ofthese offences were against vehicles other than private cars (or light vans) and/oragainst non-Gwent residents; and the lower part, by a simple process of subtraction,reflects the ‘true’ figure of car thefts against Gwent residents. This exercise was carriedout by CID administrative staff based at Gwent Constabulary Headquarters.
Table 3: Method of arriving at a ‘true figure’ for thefts of cars from Gwent residents,April to June 1992
All officially recorded offences of theft and unauthorised takingApril May June Total
‘A’ Division 117 128 161 406‘B’ Division 97 78 92 267‘C’ Division 85 78 85 248
TOTAL 299 284 338 921
Offences against vehicles other than cars and against non-residentsApril May June Total
‘A’ Division 24 50 62 136‘B’ Division 37 30 36 103‘C’ Division 28 28 36 92
TOTAL 89 108 134 331
‘True’ figure for thefts of cars from Gwent residentsApril May June Total
‘A’ Division 93 78 99 270’B’ Division 60 48 56 164‘C’ Division 57 50 49 156
TOTAL 210 176 204 590
Source: Gwent Constabulary.
It can be seen that a large minority of offences are excluded as a result – ranging from21 to 42 percent over the various divisions and months. The final total of Gwent
15
residents who had been victims of theft of cars or light vans in the three month periodconsidered was 590, which represents an overall reduction on the criticial figures of 36percent. The largest category excluded was that of vehicles other than private carsand light vans, which accounted for 236 of the 331 offences excluded from furtherconsideration. Most of these latter thefts related to motor cycles and lorries, but asurprising number of coaches, farm and builders’ vehicles, and cars for sale on garageforecourts were also found to have been stolen.
Obtaining victim information
In August 1992, Gwent Constabulary sent a letter on the researchers’ behalf, with acovering letter from the Superintendent of Community Affairs, to the 590 ‘genuine’Gwent-based victims of car theft identified in the above way. Enclosed was a simpleone page form which asked respondents to state whether or not Vehicle Watchstickers had been displayed at the time their car or van was taken1. The form was thenreturned direct to the researchers. (The form and the accompanying letter arereproduced in Appendix C.) In total, 259 of the 590 victims (44 percent) replied tothe questionnaire; five of the letters were returned ‘address or person unknown’.
Results of the analysis
Forty one (sixteen percent) of the 259 questionnaire respondents stated that aVehicle Watch sticker had been displayed on the window of their vehicle at the timeof the theft. Thirty two of these 41 gave their names and addresses, which allowedsome extra confidence to be placed in the veracity of their replies. The total of 41‘member victims’ uncovered in this way showed that victimisation was considerablyhigher than suggested by the number of crime files which had been marked “VehicleWatch” by police officers; only six of the 590 victims had been identified as VehicleWatch members in this way. In other words, if this file marking method had been usedto assess the relative victimisation rates of members and non-members, it would havepointed to the false conclusion that only one percent of all car thefts had been againstVehicle Watch members, thus underestimating the true rate to a dramatic extent.
Given that direct, unsolicited postal contact with car crime victims is, as far as can beascertained, a novel procedure, it is not possible to judge whether or not a 44 percentresponse rate without a follow-up letter is reasonable. However, a higher rate wouldclearly be desirable in order to allow more definitive conclusions to be reached. Un-fortunately, methodological considerations dictated against a follow up mailing. Fol-lowing advice, from Gwent’s Data Protection Officer, it was agreed that return formswould not be marked, so respondents could not be identified if they did not volunteertheir name and address in their reply, Thus, non-respondents could not be identifiedand targeted as part of a follow up study. The possibility of re-contacting the entire
1 It was decided not to ask victims at what time of day their car was stolen for two reasons: first, reports ofactual time of car theft are notoriously unreliable, and second, there would be no merit in a scheme thatdisplaced crime against members to periods outside the curfew hours.
16
sample and asking only non-respondents to return their forms was considered. Thelatter approach might, however, have resulted in “double” returns from some victims.Future studies employing postal surveys of this kind would benefit from a procedurethat allowed a targeted follow up to achieve a higher response rate from victims.
Clearly, given that only 44 percent of the population returned their forms, it is notpossible to make a definite statement about the relative risks of members andnon-members falling victim to car crime. Working on the assumption that VehicleWatch membership in the population of non-respondents was the same as that forrespondents, it would be concluded that sixteen percent of car thefts had beencommitted against Vehicle Watch members. This could he seen as an upper estimatesince it is likely that the proportion of replies from Vehicle Watch members wasactually higher than that from non-members owing to greater interest in VehicleWatch1. If it was assumed that all of the non-respondents were not members, then theproportion of crimes against members would reduce to seven percent. This being so, itseems reasonable to conclude that the proportion of victims who were members ofVehicle Watch lies somewhere between the logically possible, but highly unlikely,lower limit of seven percent and the actually recorded level of sixteen percent. Theresearchers’ intuition suggests that the actual figure may lie somewhere around themid-point of the two estimates (approximately eleven to twelve percent), but nofurther objective evidence is available to support this view.
Summary of Findings
During the three month period in question, about twenty one percent of car and lightvan owners in Gwent were estimated to have been members of Vehicle Watch2. Themid-point estimate of eleven to twelve percent victimisation for members supportsthe conclusion that members of Vehicle Watch are less likely than non-members tohave their cars stolen. In simple terms, the twenty one percent of the population atrisk of car theft in Gwent who were members of Vehicle Watch appear to havesuffered only some eleven to twelve percent of the total theft. If the estimate ofvictimisation rates is correct, this suggests that the risk to Vehicle Watch memberswas nearly one half of the risk to the population as a whole. Although this is,superficially at least, a positive finding for the scheme, the existence of dramaticdifferences in victimisation rates for members and non-members, as reported byBrown (1992) and the Hartlepool Safer Cities Project Research Unit (1992), was notborne out. Certain methodological criticisms could be levelled at this aspect of thestudy because of the low response rate, but it nonetheless demonstrates clearly thatthe procedures adopted by these earlier studies were likely to have led to an underestimate of victimisation among Vehicle Watch members.
1The logically possible upper limit of theft against members would assume that all non-respondents weremembers. This has been calculated at 63%. However, it seems highly implausible that persons voluntarilyinvolved in an initiative (in this case Vehicle Watch) would be less likely to respond to questions aboutthat initiative.2The total number of registered vehicles in the relevant ‘PLG’ classes in the Gwent area in December 1991was 160,154.
17
4. Comparison of Members’ and Non-Members’Vulnerability to Car Theft
Methodology employed
Any comprehensive evaluation of the potential benefits of Vehicle Watch member-ship must take into account the point that there may be prior differences in thecharacteristics or behaviour of those who are and who are not likely to join such ascheme. For example, behaviour with respect to vehicle security might affect therelative vulnerability to crime of the two groups more than membership per se.
In order to answer the question of whether people who join Vehicle Watch fall,independently of their membership of the scheme, into a below average risk category,a street survey of car owners was carried out. This was undertaken in Newport on10-13 August and 17-19 August 1992. In total, 422 people resident in the town wereinterviewed. The interviews were staggered throughout the day and early evening, inorder to catch as wide a cross-section of the target population as possible. Interviewerswere instructed to approach every third person aged 17 or over. The first part of thesurvey questionnaire (see Appendix D) covered age and model of car driven, drivingand security habits and experience of car theft. After this information had beenobtained, respondents were asked if they were members of Vehicle Watch and abouttheir views and experiences of the scheme. (The latter issues are discussed in section 5of the report.)
In the first week of interviewing, some 23 percent of those interviewed were found tobe members of Vehicle Watch – a proportion closely in line with the best estimates ofthe level of Vehicle Watch membership in Newport as a whole. This gave someconfidence in the capacity of the survey method to produce a sample adequatelyrepresentative of Newport drivers. A second week of interviewing was then initiatedand the approach amended so that the interview was continued only if the personapproached indicated that he or she was a Vehicle Watch member. This revisedstrategy was adopted to produce samples of members and non-members of roughlyequivalent size. Eventually, a final total of 422 car-owners resident in the town (andpresent on the streets at the appropriate points in time) were interviewed; 199 of thesewere members of Vehicle Watch and 223 were not.
Age, gender and vehicle ownership
Members of Vehicle Watch can be compared to non-members on a number ofdimensions. Analysis showed that there was no significant difference between theVehicle Watch members and non-members in terms of gender: males made up 58percent and 53 percent of the two samples, respectively. However, the Vehicle Watchmembers were considerably older as a group: 87 percent were over thirty years of ageand 50 percent over fifty; the comparable figures for non-members were 75 percentand 26 percent.
18
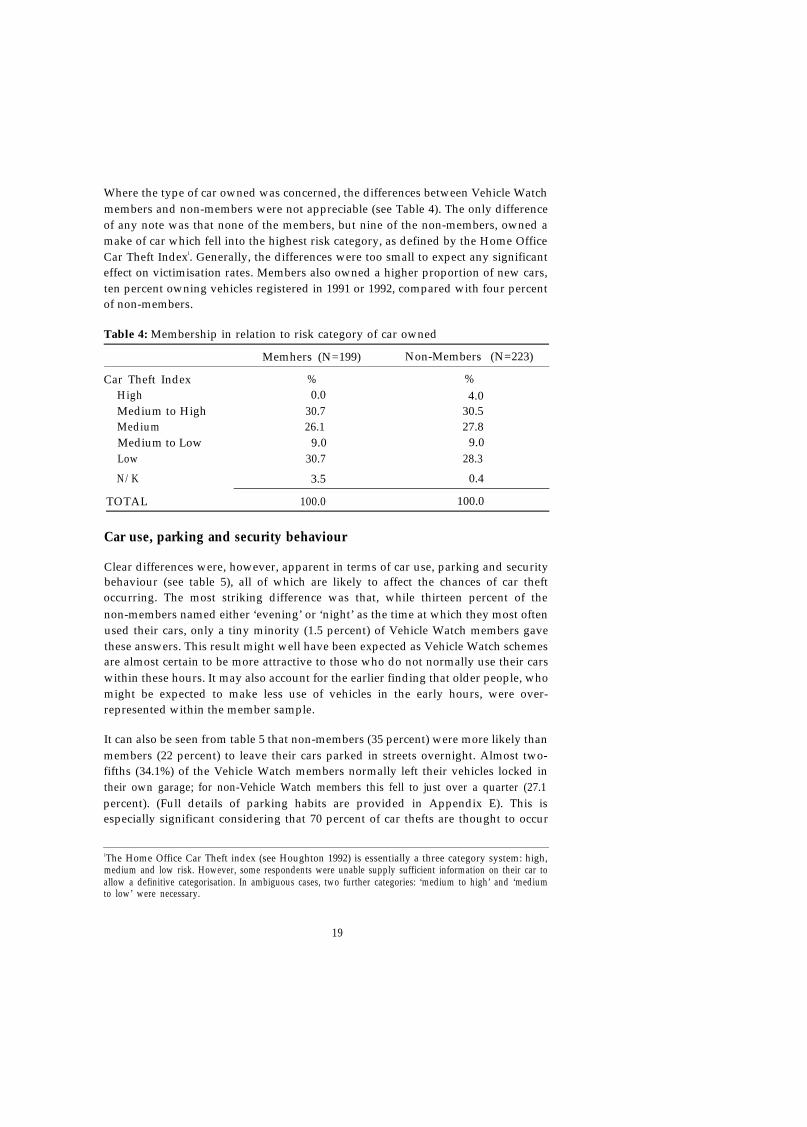
Where the type of car owned was concerned, the differences between Vehicle Watchmembers and non-members were not appreciable (see Table 4). The only differenceof any note was that none of the members, but nine of the non-members, owned amake of car which fell into the highest risk category, as defined by the Home OfficeCar Theft Indexl. Generally, the differences were too small to expect any significanteffect on victimisation rates. Members also owned a higher proportion of new cars,ten percent owning vehicles registered in 1991 or 1992, compared with four percentof non-members.
Table 4: Membership in relation to risk category of car owned
Memhers (N=199) Non-Members (N=223)
Car Theft Index % %High 0.0 4.0Medium to High 30.7 30.5Medium 26.1 27.8Medium to Low 9.0 9.0Low 30.7 28.3
N/K 3.5 0.4
TOTAL 100.0 100.0
Car use, parking and security behaviour
Clear differences were, however, apparent in terms of car use, parking and securitybehaviour (see table 5), all of which are likely to affect the chances of car theftoccurring. The most striking difference was that, while thirteen percent of thenon-members named either ‘evening’ or ‘night’ as the time at which they most oftenused their cars, only a tiny minority (1.5 percent) of Vehicle Watch members gavethese answers. This result might well have been expected as Vehicle Watch schemesare almost certain to be more attractive to those who do not normally use their carswithin these hours. It may also account for the earlier finding that older people, whomight be expected to make less use of vehicles in the early hours, were over-represented within the member sample.
It can also be seen from table 5 that non-members (35 percent) were more likely thanmembers (22 percent) to leave their cars parked in streets overnight. Almost two-fifths (34.1%) of the Vehicle Watch members normally left their vehicles locked intheir own garage; for non-Vehicle Watch members this fell to just over a quarter (27.1percent). (Full details of parking habits are provided in Appendix E). This isespecially significant considering that 70 percent of car thefts are thought to occur
1The Home Office Car Theft index (see Houghton 1992) is essentially a three category system: high,medium and low risk. However, some respondents were unable supply sufficient information on their car toallow a definitive categorisation. In ambiguous cases, two further categories: ‘medium to high’ and ‘mediumto low’ were necessary.
19
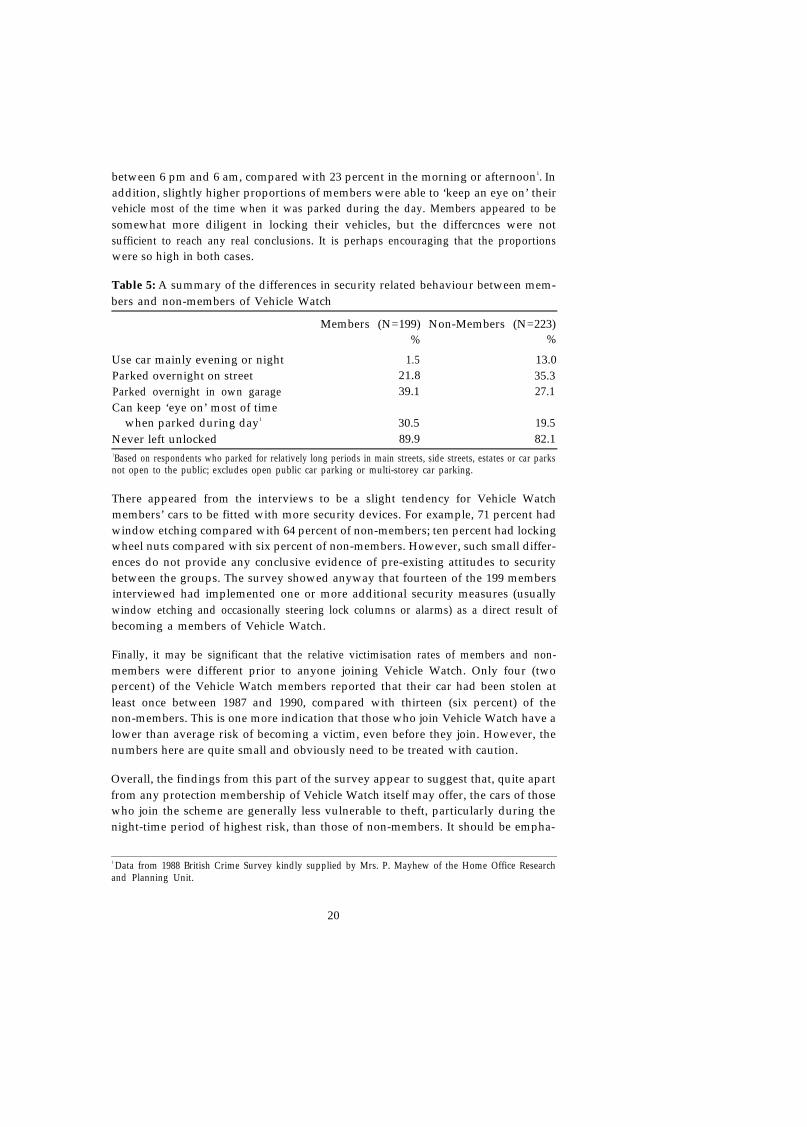
between 6 pm and 6 am, compared with 23 percent in the morning or afternoon1. Inaddition, slightly higher proportions of members were able to ‘keep an eye on’ theirvehicle most of the time when it was parked during the day. Members appeared to besomewhat more diligent in locking their vehicles, but the differcnces were notsufficient to reach any real conclusions. It is perhaps encouraging that the proportionswere so high in both cases.
Table 5: A summary of the differences in security related behaviour between mem-bers and non-members of Vehicle Watch
Members (N=199) Non-Members (N=223)% %
Use car mainly evening or night 1.5 13.0Parked overnight on street 21.8 35.3Parked overnight in own garage 39.1 27.1Can keep ‘eye on’ most of time
when parked during day1 30.5 19.5Never left unlocked 89.9 82.11Based on respondents who parked for relatively long periods in main streets, side streets, estates or car parksnot open to the public; excludes open public car parking or multi-storey car parking.
There appeared from the interviews to be a slight tendency for Vehicle Watchmembers’ cars to be fitted with more security devices. For example, 71 percent hadwindow etching compared with 64 percent of non-members; ten percent had lockingwheel nuts compared with six percent of non-members. However, such small differ-ences do not provide any conclusive evidence of pre-existing attitudes to securitybetween the groups. The survey showed anyway that fourteen of the 199 membersinterviewed had implemented one or more additional security measures (usuallywindow etching and occasionally steering lock columns or alarms) as a direct result ofbecoming a members of Vehicle Watch.
Finally, it may be significant that the relative victimisation rates of members and non-members were different prior to anyone joining Vehicle Watch. Only four (twopercent) of the Vehicle Watch members reported that their car had been stolen atleast once between 1987 and 1990, compared with thirteen (six percent) of thenon-members. This is one more indication that those who join Vehicle Watch have alower than average risk of becoming a victim, even before they join. However, thenumbers here are quite small and obviously need to be treated with caution.
Overall, the findings from this part of the survey appear to suggest that, quite apartfrom any protection membership of Vehicle Watch itself may offer, the cars of thosewho join the scheme are generally less vulnerable to theft, particularly during thenight-time period of highest risk, than those of non-members. It should be empha-
1 Data from 1988 British Crime Survey kindly supplied by Mrs. P. Mayhew of the Home Office Researchand Planning Unit.
20

sised that most of the differences were relatively small. Nevertheless, their cumulativeweight does point to the conclusion that the Vehicle Watch scheme seems to haveattracted drivers who were less at risk, either because of their already relatively highsecurity consciousness, or because of their lower exposure to risk (for example, interms of their parking or car usage habits). Clearly, as will be discussed later, thisdifference has implications for the assessment of Vehicle Watch in preventing thefts.
21
5. Views and Experiences of the Scheme
The 422 Newport car-owners interviewed as part of the street survey were asked anumber of questions to elicit their views and feelings about Vehicle Watch. Thesequestions formed the second half of the questionnaire discussed in section 4. (Thesurvey instrument is reproduced in Appendix D.) In addition, numerous informaldiscussions were supplemented by more structured interviews conducted with twelvepolice officers from Newport in order to ascertain how they felt about the scheme.
Views of membersBenefits
Only eight of the 199 respondents who had joined Vehicle Watch were not currentlydisplaying their stickers and just one of these had decided to withdraw from thescheme entirely. (It was not possible to determine why this latter individual hadchosen to withdraw.) In answer to a direct question about security, 24 percent saidthat they felt “much more secure” about their car as a result of joining and 46 percentcategorised themselves as feeling “a little more secure”.
Whten respondents were asked, without interviewer prompts, what they saw as thebenefits, if any, of being a member of Vehicle Watch, over two-thirds named at leastone benefit. The most common first response, given by a quarter of the whole sample,was words to the effect that it gave them “peace of mind”. A further twelve percent ofthe “respondents saw the main benefit as a greater likelihood of their car beingrecovered, should it be stolen, and nine percent mentioned the police in some sense“keeping an eye on” their car as an advantage. Although these factors would in turnbe expected to promote higher levels of deterrence or detection, surprisingly onlyseven percent and three percent, respectively, mentioned these outcomes directly asbenefits. Finally, only a handful of respondents named financial discounts or free radiomarking as benefits of membership.
Improvements
Vehicle Watch members were asked whether the scheme could be improved in anyway and a total of 25 percent suggested that it could. Well over half of these (fifteenpercent of all members interviewed) suxgested that the level of commitment to thescheme exhibited by the police was the area most in need of improvement. Inparticular, respondents criticised the frequent failure of patrols to stop cars displayingstickers during the night time ‘curfew’. Evidence on the infrequency of police stopsalso emerged from answers to direct questions in relation to this subject. Of the 199members interviewed, 110 said that they had used a car displaying Vehicle Watchstickers during the ‘curfew’ hours; 62 of these stated that they had seen a police patrolon at least one such occasion, but only seven had ever been stopped. Other desiredimprovements covered a range of minor points, concerned mainly with the size orquality of the stickers, or with suggested extensions to the period during which the‘curfew’ was in operation.
22
Views of non-members
Knowledge of the scheme
Non-members demonstrated a fair level of knowledge about the existence andoperation of the Vehicle Watch scheme. Only twenty of the 223 interviewed had notheard of Vehicle Watch. Among the remaining 203, perceptions of ‘what it is for’were broadly accurate; prevention was mentioned much more often than detection.Some respondents also confused its operating principles with those of NeighbourhoodWatch, thinking that either the police or neighbours kept a special ‘watch’ onmembers’ cars. Even so, well over twenty percent mentioned the key feature of policesteps during a night-time ‘curfew’ period without any specific prompting by theinterviewers.
Reasons for not joining
Non-members were also asked to state the main reason why they had not joined thescheme. Despite the generally high level of awareness of its existence and of its broadpurposes, the reason most frequently given was that they ‘did not know enough aboutit’. This explanation was put forward by almost 30 percent of those who had heard ofVehicle Watch. A further twenty percent had ‘not thought about it’, sixteen per centhad ‘not found time’, eight percent said that they had ‘not been asked to join’ and ninepercent cited their working patterns as reasons for not wishing to be stopped by thepolice. Significantly, only fifteen interviewees (seven percent) expressed clearlynegative views and categorised the whole scheme as a ‘waste of time’. In other words,the main obstacles to the achievement of higher take up rates appear to be apathy andlack of detailed knowledge about Vehicle Watch, rather than any widespread dislikeor distrust of the scheme.
Confirmation of this last point came from the final question put to non-members:“Would you consider joining in the future?“. Twenty percent said no, twenty percentwere unsure, but a clear majority – 122 of the 203 asked – replied in the affirmative.
Overview of public response
Several of the survey findings echo the positive public responses to Vehicle Watchfound by Brown (1992) in an opinion survey covering several locations in Gwent andundertaken by special constables. The current study provided clear evidence that thescheme has a favourable image with the public and makes members feel more secure.As expected, there were differences of perception between members and non-members, but the majority reaction to the scheme was positive among both groups.The scheme also appeared to have the potential to achieve exceptionally high “takeup” rates if sufficient publicity is provided to explain how it works and if enrolment ismade simple and convenient. On the negative side, some public confidence in thescheme is lost through the apparent failure of police officers to stop and check cars asoften as members are led to expect.
23
The police perspective
In addition to informal interviews, more structured discussions were undertaken withtwelve officers based at Newport. Three of these officers were stationed at Bettwsestate, the site of the pilot Vehicle Watch scheme. The structured discussionscomplied with the following topic guide:
– Knowledge of the scheme: including their introduction to the scheme and theextent of further briefings or reminders on the scheme;
– The main advantages and disadvantages of the scheme: including specific questionson their perceptions of its impact upon car crime, offenders and the public;
– The influence of the Vehicle Watch sticker on the likelihood of their stopping a carin the ‘curfew’ hours;
– Their own willingness to become members of Vehicle Watch and the reasons forthis;
– overall reaction to the scheme, particularly in comparison m other crime preven-tion initiatives of which they had experience.
Bettws officers
The officers based at Bettws were convinced that the scheme had significantlydecreased the theft of cars. Moreover, they thought that the use of radio securitycodes, which were encouraged as part of the Vehicle Watch scheme, decreased theattractiveness of thefts from cars. This, in turn, may also impact on thefts of cars.
It was felt that the scheme had been invaluable for improving police-communityrelations and the officers suggested that it had provided useful opportunities for thepublic to engage with their local police in a role other than that of witness to, orvictim of, a crime. The officers were keen that the scheme should not be identified toostrongly with the police and should instead be seen as a community initiative. (Thisprinciple had influenced an earlier decision to avoid the word ‘police’ on the VehicleWatch sticker.) Nonetheless, the Bettws officers suggested that some younger driversmay have avoided the scheme because its image lacked “street cred”.
Other officers
Informal and structured discussions with officers based elsewhere in Newport revealeda more cautious appraisal. All of the officers interviewed knew the basic structure ofthe scheme (i.e. the expectation of stopping cars with a Vehicle Watch stickerdisplayed), but suggested that this would not be true throughout the service. Oneofficer reported a discussion with two colleagues which involved the following
24
comment “No, we don’t stop Vehicle Watch drivers – they are going to be law abidingcitizens”. Such misunderstandings may not be widespread amongst officers, but it wasclear that few formal briefings and reminders on Vehicle Watch procedures weregiven and these were largely limited to information sheets emanating from theVehicle Watch office.
It was also clear from discussions that competing operational demands on officerswhether from Bettws or Newport Central) meant that stopping Vehicle Watch carsbetween midnight and 5am was not a high priority. Further, officers would normallyexpect to stop only a few vehicles during the course of a night shift and the presence ofa Vehicle Watch sticker alone would not be a sufficient condition to initiate such acontact. Other factors, such as driving behaviour, age of driver, make and age of carand so on, were more likely to be salient. In addition, three officers noted that thesticker was difficult to distinguish from other stickers from a distance at night. Hence,Vehicle Watch appears to have had little effect on officer behaviour in this respect.The finding is consistent with members’ low reports of being stopped and the viewthat there should be more police commitment to the scheme. In response to this issue,one police officer observed that it was unrealistic to expect Vehicle Watch stops totake high priority and that the public should not be led to believe that a stop withincurfew hours was in any sense inevitable. Finally, the observation was made that,should the scheme prove increasingly successful in terms of membership, the likeli-hood of Vehicle Watch cars being stopped during curfew hours would decrease stillfurther.
The above factors might be interpreted as suggesting that the Vehicle Watch schemehad not been implemented as fully as it might have been. However, responses alsosuggested that Vehicle Watch had been implemented in Gwent as far as was realisticgiven other pressures on resources, particularly upon night time patrols. It should not,therefore, be assumed that more intensive implementation would be routinely viablein other forces. Some police respondents also argued that it was too early to make anyclaims regarding the success of the scheme. In many ways, it appeared to be like othercrime prevention initiatives – much publicity at the beginning, but salience for bothofficers and potential offenders may have already begun to fade. To counter this,regular publicity was felt to be necessary. In terms of both public involvement andpolice commitment, the central Newport police respondents argued that a schemesuch as Vehicle Watch was much more likely to be effective in a small communitywhere there was a relatively small and stable population of cars. High impact on anurban centre with much through traffic was felt to be far less likely.
25
6. Summary and Conclusions
The study set out to address four distinct questions relating to Vehicle Watchschemes. The findings in relation to these are summarised below and overall con-clusions are presented.
Assessment of effect in key areas
Does Vehicle Watch appear to have any effect upon the over-all level of vehicle theft (includingunauthorised taking) in the areas studied?
There was a dip in car theft in Gwent in the first few months after the introduction ofVehicle Watch in September 1991. However, several other police forces also re-corded a decline at this time. Moreover, theft rates in Gwent rose steeply in at thebeginning of 1992. Hence, nothing conclusive can be drawn from crime figures alone.
Does membership of Vehicle Watch improve an individual’s chances of avoiding becoming avictim of vehicle theft in comparison with non-members?
This is apparently a simple question, but reliable data are difficult to collect. Aquestionnaire based study of car theft during a three month period in the county ofGwent suggested that the proportion committed against Vehicle Watch members wassixteen percent. The study did, however, suffer from a low response rate (44 percent).Allowing that members may be more likely than non-members to respond to thequestionnaire, a speculative ‘best estimate’ of eleven to twelve percent for car theftagainst Vehicle Watch members was subsequently produced. This compares favoura-bly with an average membership of Vehicle Watch of twenty one percent withinGwent during the three months in question. If the best estimate of victimisation rateswas correct, the risk to Vehicle Watch members appears to have been about one halfless than to the population at risk as a whole. However, the low response rate to thequestionnaire means that this conclusion must be treated with considerable caution.
Does the Vehicle Watch scheme attract individuals who are anyway less vulnerable to vehicletheft? In addition, does membership of the scheme have any impact upon the securitybehaviour of those who join?
A street survey revealed a number of important differences between the two groups.For example, the Vehicle Watch members were older, they were more likely to garagetheir cars overnight and during the day they were more likely to leave their car wherethey could keep an eye on it. Vehicle Watch members also tended to have slightlymore security features fitted to their cars, although no firm conclusions can be reachedon whether or not this difference existed prior to joining the scheme or results from it.Finally, it is worth noting that relatively few persons who subsequently becamemembers of Vehicle Watch (two percent) reported that their cars had been stolenduring the previous tour years. In comparison, six percent of those who did notbecome members had had their cars stolen in the previous four years.
26
Thus, Vehicle Watch members do differ in a number of ways to non-members andthese differences together indicate that the members may be a less vulnerablepopulation both before and after joining.
What do members, non-members and police officers see as the main benefits and the maindisadvantages of the scheme?
Vehicle Watch was well received by members and non-members alike. The mostcommon response from Vehicle Watch members was that the scheme made them feelmore secure and 55 percent of the non-members indicated that they would considerjoining. The main suggestion for improving the scheme was that the police shouldtake more interest in it and should stop cars with Vehicle Watch stickers more regu-larly. In summary, Vehicle Watch appeared to be a popular scheme which encouragedmembers’ confidence and was welcomed as a sign that the police were active.
Police officers who had experience of the scheme varied in their attitudes towards it.Officers who had been involved in the pilot scheme on the Bettws estate and hadwitnessed a very high rate of enrolment in their community, with a simultaneous dropin car theft, were enthusiastic supporters. Those officers working out of an urbancentre were more cautious, some believing that its importance was likely to wane for avariety of reasons. For example, if publicity were not sustained or if the numbersjoining increased appreciably and made policing the scheme less viable.
It was also clear that police could not fulfil the commitment to stop all cars carryingVehicle Watch stickers which were active during curfew hours. The sticker was atbest a contributory factor in a decision on whether to stop a vehicle. Other policingcommitments (e.g attending a call to an incident) always took priority and suspiciousbehaviour (e.g. driving dangerously, age of driver, type of car) tended to be regarded asmore important than the presence of a sticker, which was not always easy to see. Insummary, police attitudes were relatively cautious and suggested that the scheme wasmost likely to he effective in clearly defined communities with a high level of vehiclecrime.
Overall conclusions
Although no definite statement can be made about the protective benefits of VehicleWatch membership, the findings do indicate that Vehicle Watch members are lesslikely than non-members to become victims of car theft. However, how much this isdue to membership of the scheme per se is less clear, as members – independent of thefact of joining the scheme – constitute a less vulnerable population. The primaryadvantages of the scheme are likely to be similar to those of Neighbourhood Watch: itmakes people feel more secure and is potentially a good avenue for facilitating police/public relations. This, in turn, may have pay-offs in encouraging better securityhabits. Finally, if the scheme is effective in protecting members’ cars, it is likely tohave more impact in clearly identifiable local communities rather than relativelyopen urban areas.
27
References
Brown, J. (1990) The Bettws Vehicle Watch Pilot Scheme Newport: Gwent Constabu-lary (unpublished).
Brown, J. (1992) Vehicle Watch: A Multi-Agency Approach. London: Home Office.
Cook, P. (1980) ‘Research in General Deterrence’ in N. Morris & M. Tonry (Eds.)Crime And Justice, Vol. 2, Chicago: University of Chicago Press
Hough, J.J.M. and Mayhew, P. (1985) ‘Taking Account of Crime: Key findings fromthe 1984 British Crime Survey’. Home Office Research Study No 85. London, H.M.S.O.
Houghton, G. (1992) Car Theft in England and Wales: The Home Office Car TheftIndex. Crime Prevention Unit Paper 33. London: Home Office.
Light, R. (1993) Car theft: The offender’s perspective. Home Office Research Study 130.H.M.S.O., London.
Maguire, M. (1982) Burglary in a Dwelling: The Offence, the Offender and the VictimLondon: Heinemann.
Hartlepool Safer Cities Project (1992) Vehicle Watch Evaluation Hartlepool: Hartle-pool SCP Research Unit.
Riley, D. and Mayhew, P. (1980) ‘Crime Prevention Publicity: An Assessment’. HomeOffice Research Study No 63. London, H.M.S.O.
Webb, B. and Laycock, G. (1992) Tackling Car Crime: The Nature and Extent of theProblem Crime Prevention Unit Paper 32. London: Home Office.
28
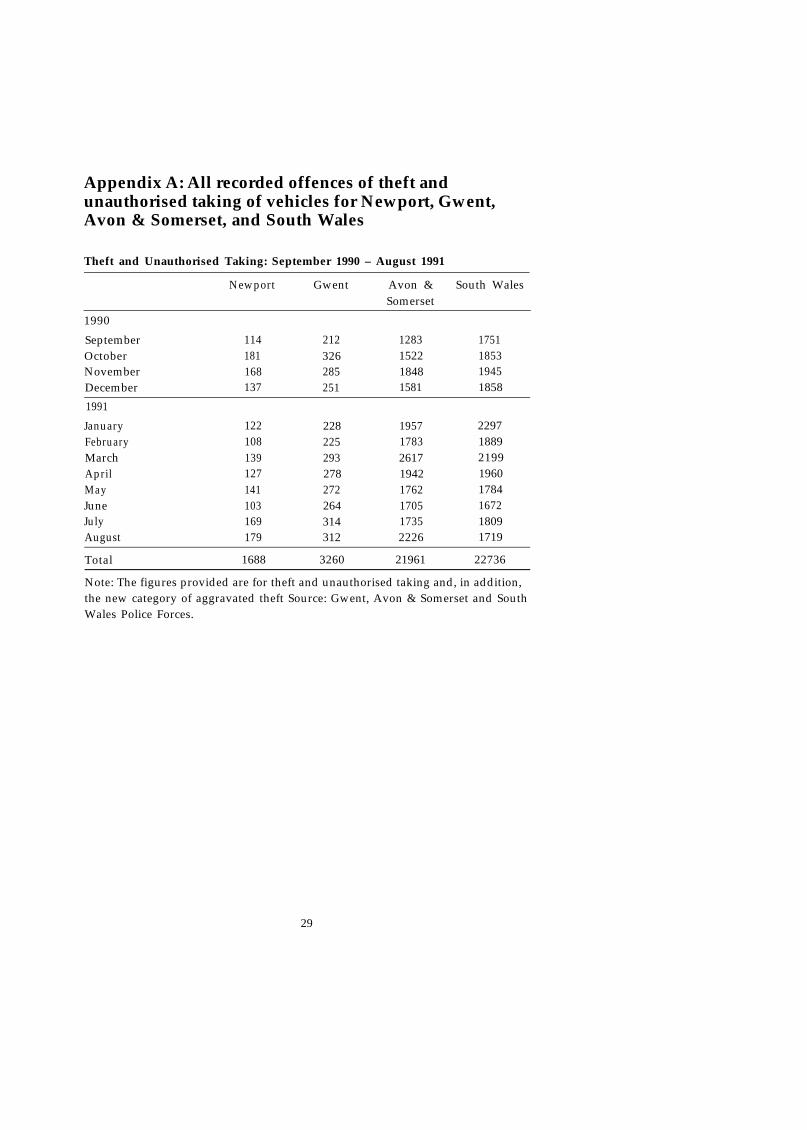
Appendix A: All recorded offences of theft andunauthorised taking of vehicles for Newport, Gwent,Avon & Somerset, and South Wales
Theft and Unauthorised Taking: September 1990 – August 1991
Newport Gwent Avon & South WalesSomerset
1990
September 114 212 1283 1751October 181 326 1522 1853November 168 285 1848 1945December 137 251 1581 1858
1991
JanuaryFebruaryMarchAprilMayJuneJulyAugust
122108139127141103169179
228225293278272264314312
19571783261719421762170517352226
22971889219919601784167218091719
Total 1688 3260 21961 22736
Note: The figures provided are for theft and unauthorised taking and, in addition,the new category of aggravated theft Source: Gwent, Avon & Somerset and SouthWales Police Forces.
29
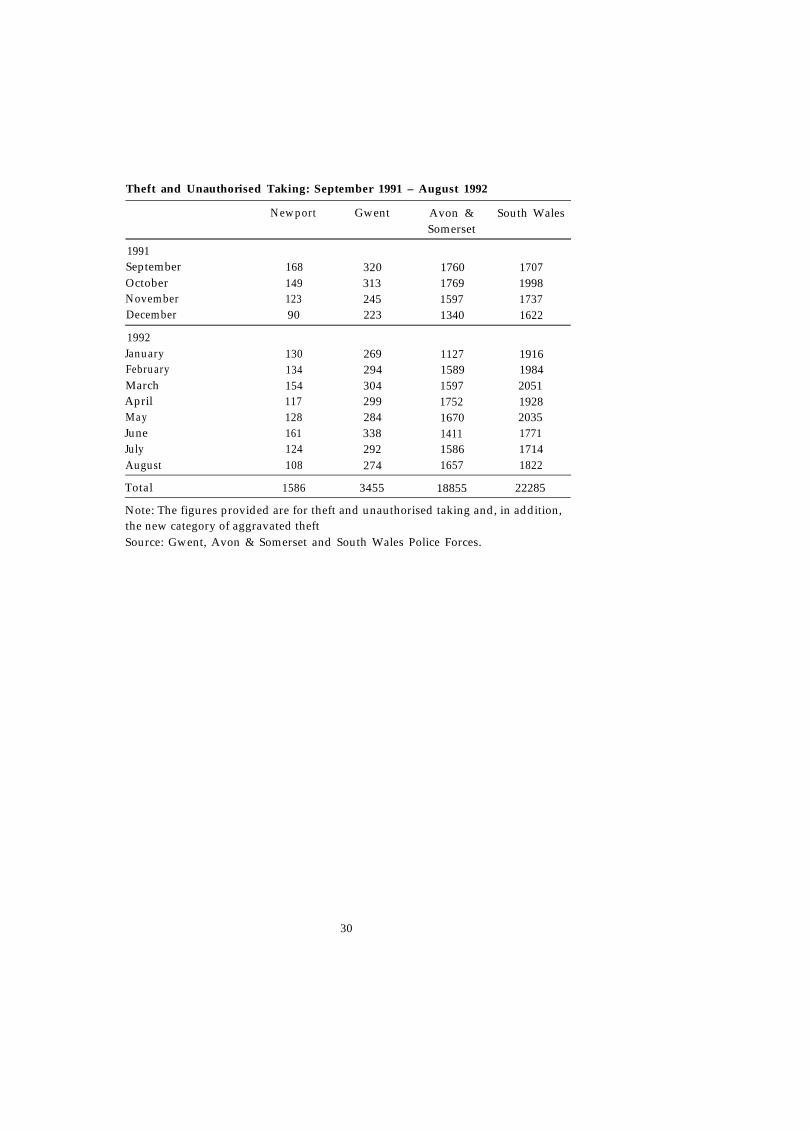
Theft and Unauthorised Taking: September 1991 – August 1992
Newport Gwent Avon & South WalesSomerset
1991September 168 320 1760 1707October 149 313 1769 1998November 123 245 1597 1737December 90 223 1340 1622
1992January 130 269 1127 1916February 134 294 1589 1984March 154 304 1597 2051April 117 299 1752 1928May 128 284 1670 2035June 161 338 1411 1771July 124 292 1586 1714August 108 274 1657 1822
Total 1586 3455 18855 22285
Note: The figures provided are for theft and unauthorised taking and, in addition,the new category of aggravated theftSource: Gwent, Avon & Somerset and South Wales Police Forces.
30
Appendix B. All recorded offences of theft andunauthorised taking of vehicles in England and Wales,September 1990 to June 1992.
Total offences recorded 12-month moving averagePercentage change
1990
September 41,709 +23.9October 46,734 +26.9November 47,216 +26.8December 44,885 +27.0
1991
JanuaryFebruaryMarchAprilMayJuneJulyAugustSeptember
49,26045,20253,81551,91148,53846,51846,96546,93747.422
+24.6+24.2+25.7+25.3+24.1+21.7+22.8+20.3+15.1
October 51,441 +9.1November 49,078 +4.7December 44,814 +0.8
1992January 48,562 +1.3February 47,721 -0.3March 51,560 -1.7April 49,116 -5.6May 44,888 -6.7June 43,166 -7.5
Source: Home Office, London.
31

Appendix C: Postal questionnaire concerning victims ofcar theft
August 1992
Dear Sir/Madam,
INDEPENDENT HOME OFFICE STUDY ON CAR THEFT
We are carrying out an independent study for the Crime Prevention Unit of theHome Office to find out if car registration with a scheme called Vehicle Watchhas any impact on car theft.
According to records held by (Gwent Police, you reported the theft of a carbetween the periods April 1st to June 30th 1992 and we would like to knowwhether Vehicle Watch stickers were displayed on the car at the time of the theft(see reply slip).
We would stress that we have not had direct access to your name and address buthave simply supplied this letter to Gwent Police who have forwarded it to you.
Please return the reply slip attached to this letter and send it back to us in thestamped addressed envelope supplied. The sealed envelopes will be passed directlyto the research team. No-one but the independent researchers will have access toyour reply. Should you provide us with your name and address, this will be usedsolely for the purpose stated on the reply slip.
It is really important for us that everyone replies so that we can get as good anevaluation as possible.
32
Please reply as soon as possible, but if you do not receive this letter for some timebecause you have been away (for example, on holiday) we would still very muchlike you to return it to us.
With many thanks for your help,
Yours sincerely,
Dr Terry HonessDirector, Michael and Associates
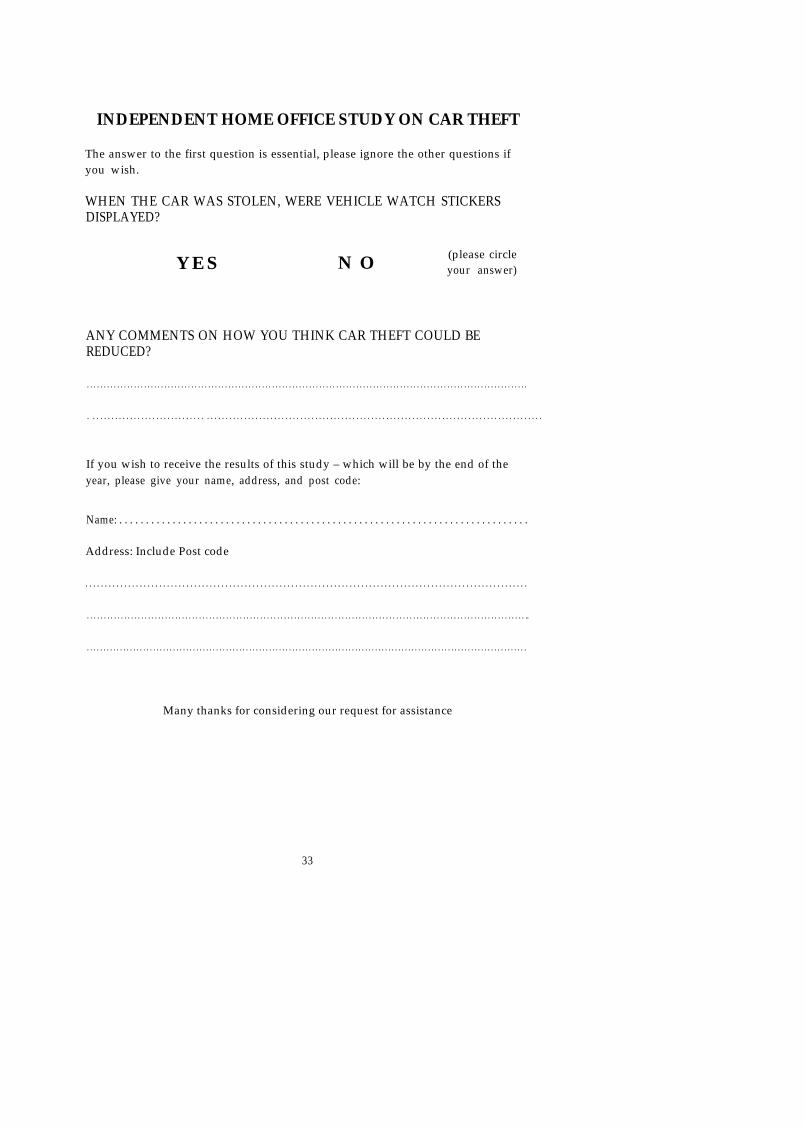
INDEPENDENT HOME OFFICE STUDY ON CAR THEFT
The answer to the first question is essential, please ignore the other questions ifyou wish.
WHEN THE CAR WAS STOLEN, WERE VEHICLE WATCH STICKERSDISPLAYED?
Y E S N O (please circleyour answer)
ANY COMMENTS ON HOW YOU THINK CAR THEFT COULD BEREDUCED?
. . . . . . . . . . . . . . . . . . . . . . . . . . . . . . . . . . . . . . . . . . . . . . . . . . . . . . . . . . . . . . . . . . . . . . . . . . . . . . . . . . . . . . . . . . . . . . . . . . . . . . . . . . . . . . . . . . . . . . . . . . . . . . . . . . .
. . . . . . . . . . . . . . . . . . . . . . . . . . . . . . . . . . . . . . . . . . . . . . . . . . . . . . . . . . . . . . . . . . . . . . . . . . . . . . . . . . . . . . . . . . . . . . . . . . . . . . . . . . . . . . . . . . . . . . . . .
If you wish to receive the results of this study – which will be by the end of theyear, please give your name, address, and post code:
Name: . . . . . . . . . . . . . . . . . . . . . . . . . . . . . . . . . . . . . . . . . . . . . . . . . . . . . . . . . . . . . . . . . . . . . . . . . . . . .
Address: Include Post code
. . . . . . . . . . . . . . . . . . . . . . . . . . . . . . . . . . . . . . . . . . . . . . . . . . . . . . . . . . . . . . . . . . . . . . . . . . . . . . . . . . . . . . . . . . . . . . . . . . . . . . . . . . . . . . . . . .
. . . . . . . . . . . . . . . . . . . . . . . . . . . . . . . . . . . . . . . . . . . . . . . . . . . . . . . . . . . . . . . . . . . . . . . . . . . . . . . . . . . . . . . . . . . . . . . . . . . . . . . . . . . . . . . . . . . . . . . . . . . . . . . . . ..
. . . . . . . . . . . . . . . . . . . . . . . . . . . . . . . . . . . . . . . . . . . . . . . . . . . . . . . . . . . . . . . . . . . . . . . . . . . . . . . . . . . . . . . . . . . . . . . . . . . . . . . . . . . . . . . . . . . . . . . . . . . . . . . . . . . . .
Many thanks for considering our request for assistance
33

Appendix D: Home Office – Car crime survey
INTRO: We are carrying out a short survey for the Home Office on crime prevention.We want to talk to Newport residents who are also car owners.Do you have a few minutes?
CHECK: NEWPORT RESIDENT AND CAR OWNER. IF NOT BOTH, DON’TINTERVIEW.
How many cars do you own? . . . . . . . . . . . . . . . . . . . . . . . .
IF MORE THAN ONE CAR, ASK THEM TO ANSWER THE QUESTIONSIN RESPECT OF THE ONE THEY USE MOST.
What is the make, model and year (reg.) of your car?
Make/Model: . . . . . . . . . . . . . . . . . . . . . . . . . . . . . . . . . . . . . . . . . . . Year/Reg: . . . . . . . . . . . . . . . . . . . . . . . . . . ./
D R I V I N G H A B I T S
How often do you use your car?
1 — Every day2 — Several times a week3 -— Once a week4 — Less than once a week
What time of day do you tend to use your car most?
l — Mainly daytime2 — Mainly evening3 — Mainly night-time
Where do you tend to park your car . . .
…during the day (long periods)? (E.g., whilst in work)
1 — Main street2 — Side street3 — Estate parking4 — Carpark not open to public5 — Open public carpark6 — Multi-storey carpark7 — Other: . . . . . . . . . . . . . . . . . . . . . . . .
34

In which street/area/carpark does this tend to be?ONE ANSWER ONLY
. . . . . . . . . . . . . . . . . . . . . . . . . . . . . . . . . . . . . . . . . . . . . . . . . . . . . . . . . . . . . . . . . . . . . . . . . . . . . . . . . . . . . . . . . . . . . . . .
IF 1, 2, 3 OR 4 ONLY: Are you able to “keep an eye” on it?
1 — Most of the time2 — Some of the time3 — None of the time
…during the day (short periods)? (E.g., popping down to the shops)
1 — Main street2 — Side street3 — Estate parking4 — Carpark not open to public5 — Open public carpark6 — Multi-storey carpark7 — Other: . . . . . . . . . . . . . . . . . . . . . . . .
…overnight
1 — Main street2 — Side street3 — Estate parking4 — Cat-park not open to public5 — Driveway of house6 — Own garage7 — Cul-de-sac8 — Other: . . . . . . . . . . . . . . . . . . . . . . . . . . . . . . . . . . . . . . . . . . . . .
In which street/area/carpark does this tend to be?ONE ANSWER ONLY
............................................................................................................................................
How often do you leave your car unlocked?
1 — Often2 — Occasionally3 — Rarely4 — Never
Does anybody else regularly drive your car?
1 — N o2 — Y e s
35
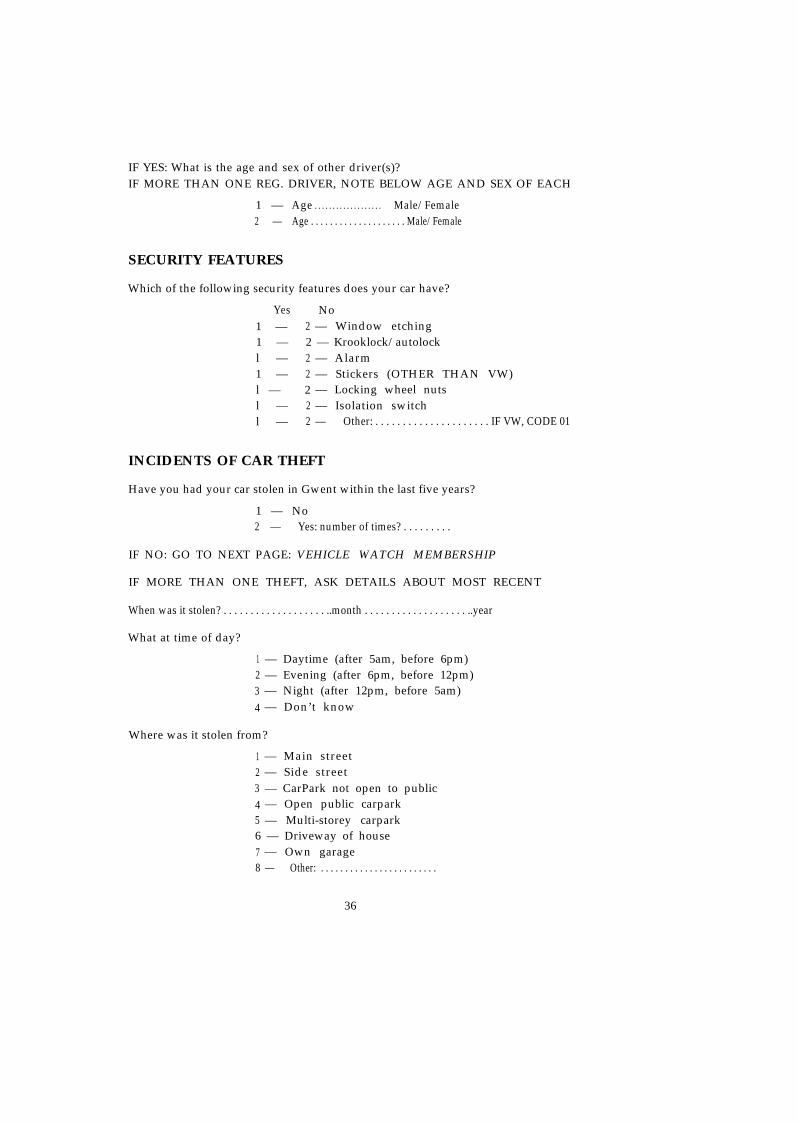
IF YES: What is the age and sex of other driver(s)?IF MORE THAN ONE REG. DRIVER, NOTE BELOW AGE AND SEX OF EACH
1 — Age . . . . . . . . . . . . . . . . . . . Male/Female2 — Age . . . . . . . . . . . . . . . . . . . . Male/Female
SECURITY FEATURES
Which of the following security features does your car have?
Yes No1 — 2 — Window etching1 — 2 — Krooklock/autolockl — 2 — Alarm1 — 2 — Stickers (OTHER THAN VW)l — 2 — Locking wheel nutsl — 2 — Isolation switchl — 2 — Other: . . . . . . . . . . . . . . . . . . . . . IF VW, CODE 01
INCIDENTS OF CAR THEFT
Have you had your car stolen in Gwent within the last five years?
1 — No2 — Yes: number of times? . . . . . . . . .
IF NO: GO TO NEXT PAGE: VEHICLE WATCH MEMBERSHIP
IF MORE THAN ONE THEFT, ASK DETAILS ABOUT MOST RECENT
When was it stolen? . . . . . . . . . . . . . . . . . . . ..month . . . . . . . . . . . . . . . . . . . ..year
What at time of day?
1 — Daytime (after 5am, before 6pm)2 — Evening (after 6pm, before 12pm)3 — Night (after 12pm, before 5am)4 — Don’t know
Where was it stolen from?
1 — Main street2 — Side street3 — CarPark not open to public4 — Open public carpark5 — Multi-storey carpark6 — Driveway of house7 — Own garage8 — Other: . . . . . . . . . . . . . . . . . . . . . . . .
36
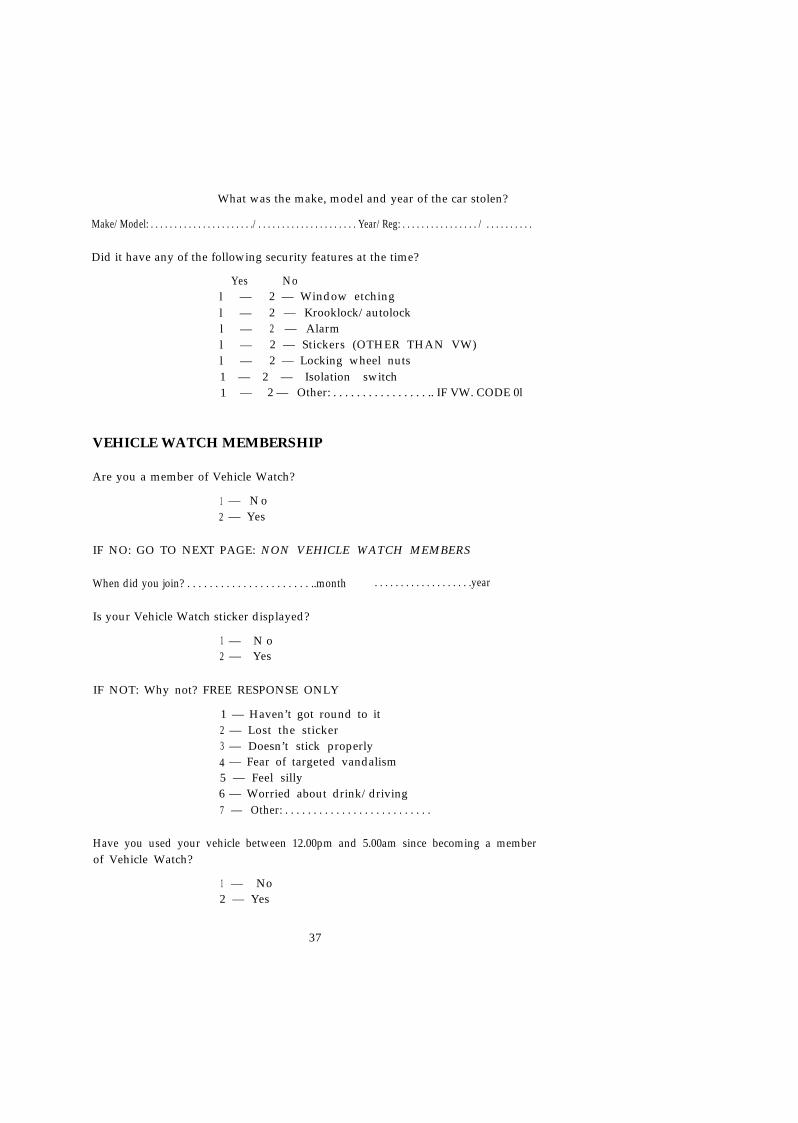
What was the make, model and year of the car stolen?
Make/Model: . . . . . . . . . . . . . . . . . . . . . ./. . . . . . . . . . . . . . . . . . . . . Year/Reg: . . . . . . . . . . . . . . . . / . . . . . . . . . .
Did it have any of the following security features at the time?
Yes Nol — 2 — Window etchingl — 2 — Krooklock/autolockl — 2 — Alarml — 2 — Stickers (OTHER THAN VW)l — 2 — Locking wheel nuts1 — 2 — Isolation switch1 — 2 — Other: . . . . . . . . . . . . . . . . .. IF VW. CODE 0l
VEHICLE WATCH MEMBERSHIP
Are you a member of Vehicle Watch?
1 — N o2 — Yes
IF NO: GO TO NEXT PAGE: NON VEHICLE WATCH MEMBERS
When did you join? . . . . . . . . . . . . . . . . . . . . . . ..month . . . . . . . . . . . . . . . . . . .year
Is your Vehicle Watch sticker displayed?
1 — N o2 — Yes
IF NOT: Why not? FREE RESPONSE ONLY
1 — Haven’t got round to it2 — Lost the sticker3 — Doesn’t stick properly4 — Fear of targeted vandalism5 — Feel silly
6 — Worried about drink/driving7 — Other: . . . . . . . . . . . . . . . . . . . . . . . . . .
Have you used your vehicle between 12.00pm and 5.00am since becoming a memberof Vehicle Watch?
1 — No2 — Yes
37

IF YES: How often?
1 — 1-2 times2 — 3-5 times3 — more than 5 times
HOW many times, in total, have you seen police officers on patrol (in cars or on foot)?
1 — None2 — 1-2 times3 — 3-5 times4 — More than 5 times
How many times have you been stopped by the police under the Vehicle Watchscheme?
1 — None2 — Once3 — Twice4 — 3-5 times5 — More than 5 times
REF. EARLIER ANSWER ON CURRENT SECURITY FEATURESDid you add any of the following security features to your car at same time as or sincebecoming a member of Vehicle Watch?
Yes1 —l —l —l —1 —l —1 —
No2 — Window etching2 — Krooklock/autolock2 — Alarm2 — Stickers (OTHER THAN VW)2 — Locking wheel nuts2 — Isolation switch2 — Other: . . . . . . . . . . . . . . . . . . . .. IF VW, CODE 01
IF YES TO ANY OPTION: Was this specifically prompted by your Vehicle Watchmembership?
1 — No2 — Yes
What, if any, do you feel are the benefits FOR YOU of being a member of VehicleWatch? FREE RESPONSE ONLY
.. . . . . . . . . . . . . . . . . . . . . . . . . . . . . . . . . . . . . . . . . . . . . . . . . . . . . . . . . . . . . . . . . . . . . . . . . . . . . . . . . . . . . . . . . . . . . . . . . . . . .
38

Does being a member of Vehicle Watch make a differenceabout your car?
1 — Yes, much more secure2 — Yes, a little more secure3 — No difference4 — Don’t know
to how secure you feel
Do you think the Vehicle Watch scheme can be improved in any way?
1 — N o2 — Y e s
IF YES: How? FREE RESPONSE ONLY
...........................................................................................................................
Will you continue to be a member of Vehicle Watch?
1 — N o2 — Y e s
IF NOT: Why not? FREE RESPONSE ONLY
1 — Police not interested2 — Fear of targeted vandalism3 — Feel silly4 — Worried about drink/driving5 — Other: . . . . . . . . . . . . . . . . . . . . . .
THANK YOU FOR HELPING WITH THIS SURVEY
For our records, would you mind telling me how old you are?
NON VEHICLE-WATCH MEMBERS
Have you heard of the Vehicle Watch scheme?
1 — No2 — Yes
IF NO: THANK YOU FOR HELPING WITH THIS SURVEY
For our records, would you mind telling me how old you are?
IF YES: CONTINUE
39

What do you think it is for? FREE RESPONSE ONLY
1 — Don’t know2 — Police to keep a special eye on my car3 — Like Neghbourhood Watch4 — Reduce car theft5 — Catch car thieves6 — Other: . . . . . . . . . . . . . .
Do you think the Vehicle Watch scheme can be improved in any way?
1 — No2 — Yes3 — Don’t know enough about it
IF YES: How? FREE RESPONSE ONLY
. . . . . . . . . . . . . . . . . . . . . . . . . . . . . . . . . . . . . . . . . . . . . . . . . . . . . . . . . . . . . . . . . . . . . . . . . . . . . . . . . . . . . . . . . . . . . . . . . . .
Why didn’t you join? FREE RESPONSE ONLY
1 — Didn’t know enough about it2 — Didn’t get round to it3 — Thought it was a waste of time4 — Haven’t thought about it5 — Other: . . . . . . . . . . . . . . . . . . . .
Would you consider joining in the future?
1 — No2 — Yes3 — don’t know
THANK YOU FOR HELPING WITH THIS SURVEY
For our records, would you mind telling me how old you are?
40
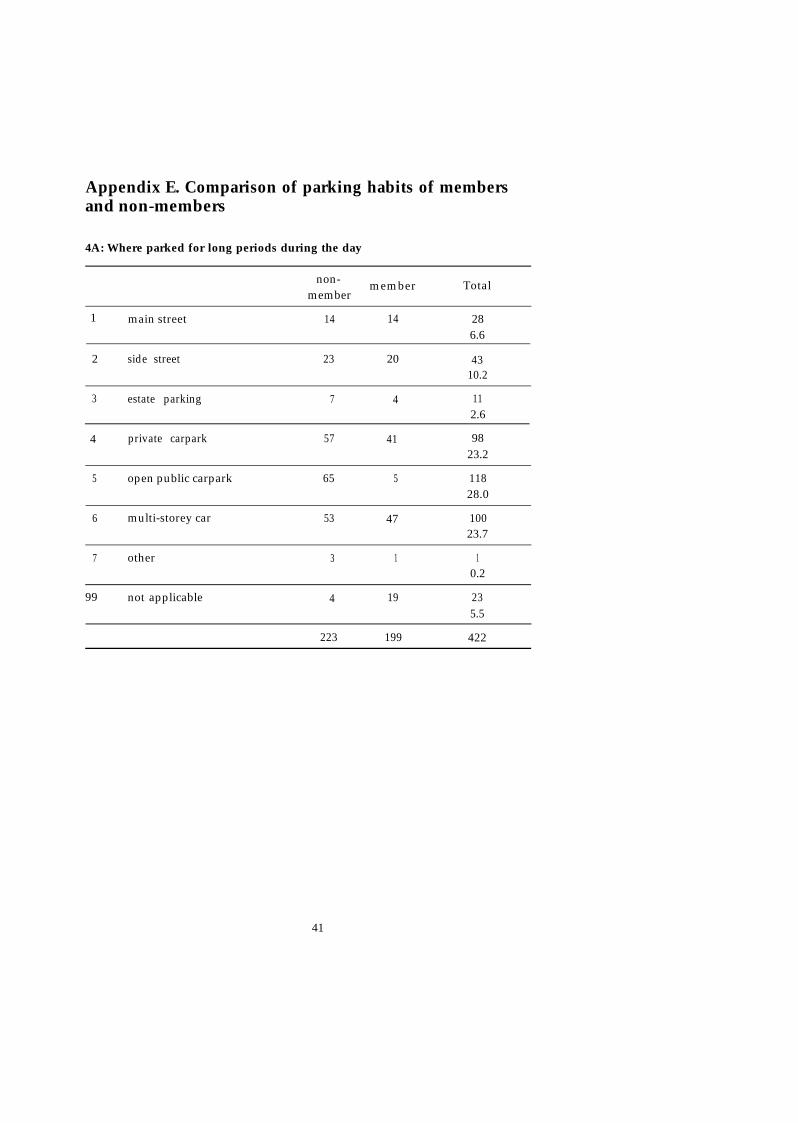
Appendix E. Comparison of parking habits of membersand non-members
4A: Where parked for long periods during the day
non- member Totalmember
main street 14 14 286.6
2 side street 23 20 4310.2
1
3 estate parking 7 4 112.6
4 private carpark 57 41 9823.2
5 open public carpark 65 5 11828.0
6 multi-storey car 53 47 10023.7
7 other 3 1 10.2
99 not applicable 4 19 235.5
223 199 422
41
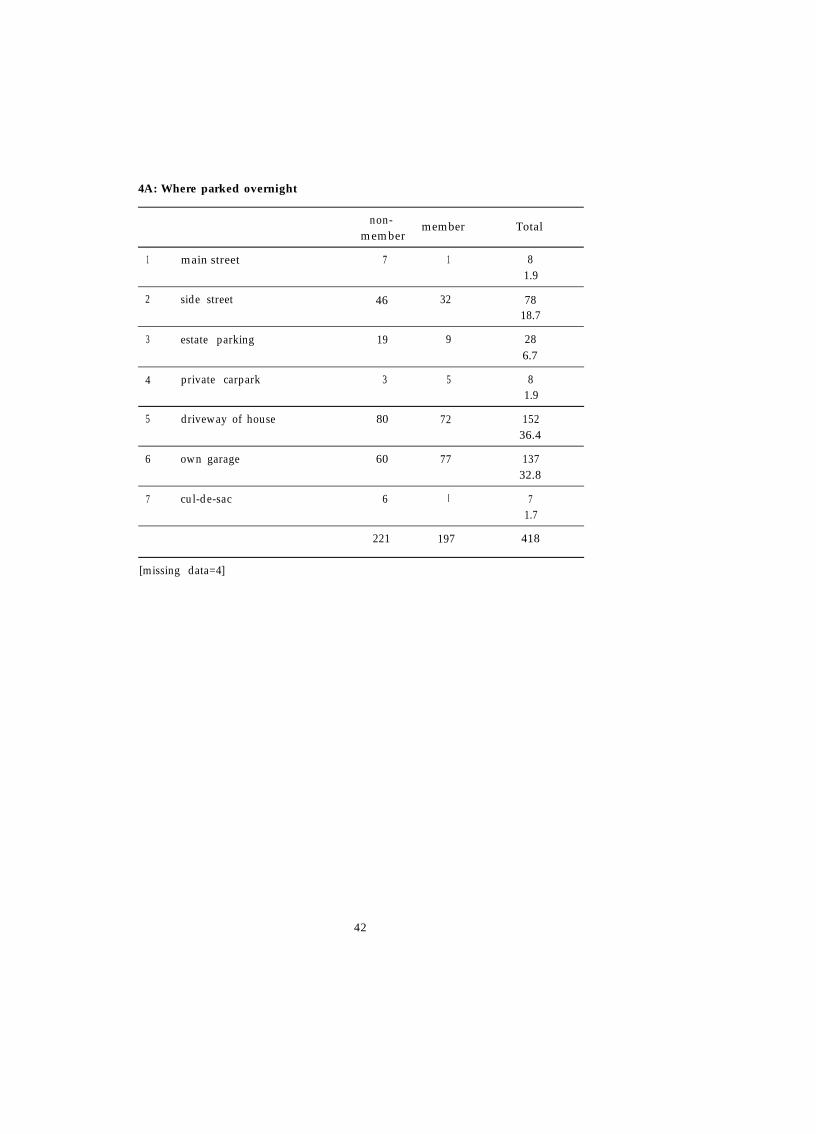
4A: Where parked overnight
non- membermember
Total
1 main street 7 1 81.9
2 side street 46 32 7818.7
3 estate parking 19 9 286.7
4 private carpark 3 5 81.9
5 driveway of house 80 72 15236.4
6 own garage 60 77 13732.8
7 cul-de-sac 6 71.7
221 197 418
[missing data=4]
42
Police Research Group Crime Prevention Unit Series
1. Reducing Burglary: a study of chemists’ shops. Gloria Laycock. 1985. v+7pp.(0 86.353 154 8).
2. Reducing Crime: developing the role of crime prevention panels. Lorna J. F.Smith and Gloria Laycock. 1985. v+14pp. (0 86252 189 0).
3. Property Marking: a deterrent to domestic burglary? Gloria Laycock. 1985.v+25pp. (0 86252 193 9).
4. Designing for Car Security: towards a crime free car. Dean Southall and PaulEkblom. 1986. v+25pp. (0 86252 222 6).
5. The Prevention of Shop Theft: an approach through crime analysis. PaulEkblom. 1986. v+19pp. (0 86252 237 4).
6. Prepayment Coin Meters: a target for burglary. Nigel Hill. 1986. v+15pp.(0 86252 245 5).
7. Crime in Hospitals: diagnosis and prevention. Lorna J. F. Smith. 1987. v+25pp.(0 86252 267 6).
8. Preventing Juvenile Crime: the Staffordshire Experience. Kevin Heal andGloria Laycock. 1987. v+29pp. (0 86252 297 8).
9. Preventing Robberies at Sub-Post Offices: an evaluation of a security initiative.Paul Ekblom. 1987. v+34pp. (0 86252 300 1).
10. Getting the Best out of Crime Analysis. Paul Ekblom. 1988. v+38pp. (0 86252307 8).
11. Retail Crime: Prevention through Crime Analysis. John Burrows. 1988.v+30pp. (0 86252 313 3).
12. Neighbourhood Watch in England and Wales: a locational analysis. SohailHusain. 1988. v+63pp. (0 86252 314 1).
13. The Kirkholt Burglary Prevention Project, Rochdale. David Forrester, MikeChatterton and Ken Pease with the assistance of Robin Brown. 1988. v+34pp.(0 86252 333 8).
14. The Prevention of Robbery at Building Society Branches. Claire Austin. 1988.v+18pp. (0 86252 337 0).
15. Crime Prevention and Racial Harassment in Asian-run Small Shops: the scopefor prevention. Paul Ekblom and Frances Simon with the assistance of SnehBirdi. 1988. v+54pp. (0 86252 348 6).
16 Crime and Nuisance in the Shopping Centre: a case study in crime prevention.Susan Phillips and Raymond Cochrane. 1988. v+32pp. (0 86252 358 3).
17. The Prevention of Fraud. Michael Levi. 1988. v+19pp. (0 86252 359 1).18. An Evaluation of Domestic Security Surveys. Gloria Laycock. 1989. v+33pp.
(0 86252 408 3).19. Downtown Drinkers: the perceptions and fears of the public in a city centre.
Malcolm Ramsey. 1989 v+23pp. (0 86252 419 9).20. The Management and Prevention of Juvenile Crime Problems. Barrymore
Cooper. 1989. v+63pp. (0 86252 420 2).
43
21. Victim Support and Crime Prevention in an Inner-City Setting. Alice Sampsonand Graham Farrell. 1990. v+27pp. (0 86252 504 7).
22. Lagerland Lost? An experiment in keeping Drinkers off the street in centralCoventry and elsewhere. Malcolm Ramsey. 1990. v+38pp. (0 86252 520 9).
23. The Kirkholt Burglary Prevention Project: Phase II. David Forrester,Samantha Frenz, Martin O’Connell and Ken Pease. 1990. v+51pp. (0 86252).
24. Probation Practice in Crime Prevention. Jane Geraghty. 1991. v+45pp.(0 86252 605 1).
25. Lessons from a Victim Support Crime Prevention Project. Alice Sampson.1991. v+41pp. (0 86252 616 7).
26. The Prevention of Cheque and Credit Card Fraud. Michael Levi, Paul Bisselland Tony Richardson. 1991. v+52pp. (0 86252 633 7).
27. Making Crime Prevention Pay: initiatives from business. John Burrows. 1991.v+50pp. (0 86252 629 9).
28. The Influence of Street Lighting on Crime and Fear of Crime. Stephen Atkins,Sohail Husain and Angele Storey. 1991. v+59pp. (0 86252 668 X).
29. The Effect of Better Street Lighting on Crime and Fear: a Review. MalcolmRamsay with the assistance of Rosemary Newton. 1991. v+48pp. (0 86252 670 1).
30. Reducing Crime on the London Underground. Barry Webb and Gloria Laycock.1992. v+30pp. (0 86252 688 4).
31. Assessing Crime Prevention Initiatives: The First Steps. Geoff Berry and MikeCarter. 1992. v+46pp. (0 86252 823 2).
32. Tackling Car Crime. Barry Webb and Gloria Laycock. 1992. v+32pp. (0 86252832 1).
33. Car Theft in England and Wales: The Home Office Car Theft Index. GeorgeHoughton. 1992. v+36pp. (0 86252 712 0).
34. Preventing Car Crime in Car Parks. Barry Webb, Ben Brown and KatherineBennett. 1992. v+40pp. (0 86252 708 2)
35. Closed Circuit Television in Public Places. Terry Honess and ElizabethCharman. 1992 v+41pp. (0 86252 711 2).
36. Multiple Victimisation. Racial Attacks on an East London Estate. AliceSampson and Coretta Phillips, 1992 v+33pp. (0 86252 736 8).
37. Theft and Loss from UK Libraries: A National Survey. John Burrows and DianeCooper. 1992. v+56pp. (0 86252 777 5).
38. Safer Cities and Community Safety Strategies. Nick Tilley. 1992. v+41pp.(0 86252 763 5).
39. Community Service and Crime Prevention: the Cheadle Heath Project.Mary Barker, Ken Pease and Barry Webb. 1992. v+36pp. (0 86252 769 4).
40. Car Crime and Young People on a Sunderland Housing Estate. Eileen Spencer.1993 v+34pp. (0 86252 790 2).
41. Developing Police Crime Prevention Management and Organisational Change.Valerie Johnston, Joanna Shapland and Paul Wiles. 1993, v+31pp.(0 86252 910 7).
44
42. Understanding Public Car Parks, Crime and CCTV: Evaluation Lessons fromSafer Cities. Nick Tilley. 1993, v+33pp. (0 86252 935 2).
43. Kerb-Crawling, Prostitution and Multi-Agency Policing. Roger Matthews.1993, v+40pp. (0 86252 978 0).
44. The Prevention of Street Robbery. Mary Barker, Jane Geraghty, Barry Webb,Tom Key. 1993, v+39pp. (1 85893 008 1).
45. The Prevention of Crime Against Small Businesses: The Safer CitiesExperience. Nick Tilley. 1993, v+29pp. (1 85893 022 7).
46. Once Bitten, Twice Bitten: Repeat Victimisation and its Implications forCrime Prevention. Graham Farrell and Ken Pease. v+32pp. (1 85893 090 1).
47. After Kirkholt-Theory, Method and Results of Replication Evaluations. NickTilley. 1994. v+25pp. (1 85893 098 7).
48. Preventing Domestic Violence to Women. Rebecca Morley and AudreyMullender. 1994. v+49pp. (1 85893 140 1)
49. Preventing Repeated Domestic Violence: A Demonstration Project onMerseyside. Sam Lloyd, Graham Farrell and Ken Pease. 1994. vi+28pp. (1 85893139 8)
45
Recommended


![SELECTION QUESTIONNAIRE [SQ] - Affordable … Housing Services... · Web viewfraud or theft within the meaning of the Theft Act 1968, the Theft Act (Northern Ireland) 1969, the Theft](https://img.pdfslide.us/doc/110x75/5abe79967f8b9a5d718d075d/selection-questionnaire-sq-affordable-housing-servicesweb-viewfraud-or.jpg)