Vattenfall Q1 2012 results
Øystein Løseth, CEO and Peter Smink, acting CFO
Press Conference, 3 May 2012
2 | Press Conference | 3 May 2012
Successful first quarter – continued consolidation
• Vattenfall continues to deliver on its strategy:
- asset disposal programme successfully completed by sale of Finnish distribution and heat operations in January 2012
- total cash proceeds during Q1 2012 from divestments: SEK 21 billion, reducing net debt substantially
- cost reductions ahead of plan. Cost-cutting programme (SEK 6 billion) planned to be completed by end of 2012 (one year ahead of previous target)
• Solid underlying EBIT despite significantly lower Nordic electricity spot prices.
3 | Press Conference | 3 May 2012
Financial highlights Q1 2012
• Net sales: SEK 49 billion (51.9)
• EBITDA: SEK 23.8 billion (16.9)
• EBIT: SEK 19.0 billion (11.8)
• Underlying EBIT: SEK 11.7 billion (12.3)
• Cash flow (FFO): SEK 12.7 billion (12.2)
• Net debt: SEK 120.6 billion (138.3)
• FFO/adj. net debt: 25%
• Return on equity (RoE): 13.4%

4 | Press Conference | 3 May 2012
Important events Q1 2012 (I)
• Divestment of non-core assets completed
- Q1 2012: Divestment proceeds of SEK 21 billion
• Finland (SEK 13.2 billion), Vattenfall Heat Poland (SEK 5.8 billion),
Vattenfall Belgian operations (SEK 1.9 billion)
- Decision to keep Danish CHP plants
• Vattenfall enters partnership on French hydro power
- Consortium agreement under the name Force Hydro with three
strong partners (ArcelorMittal, Rhodia, SNCF)
• Impairment charges and provisions posted for biomass project in Liberia
- In total SEK 1,341 million, of which EBIT-impact SEK 512 million
5 | Press Conference | 3 May 2012
Important events Q1 2012 (II)
• Moorburg power plant: A solution regarding the problems with the T24 steel has been found with the supplier. The plant is planned to be commissioned at the beginning of 2014 (unit B) and during summer(unit A).
• Swedish nuclear:
- Availability at Forsmark (3 reactors) 98.6%
- Availability at Ringhals (4 reactors) 71.0%.
- Ringhals 2 online since 2 April after nearly one year standstill
- Ringhals 1 and 2 run with reduced capacity (83% and 94%)
• Status as of 3 May: all 7 reactors in Sweden are delivering electricity
6 | Press Conference | 3 May 2012
Lower generation output, lower heat and gas sales
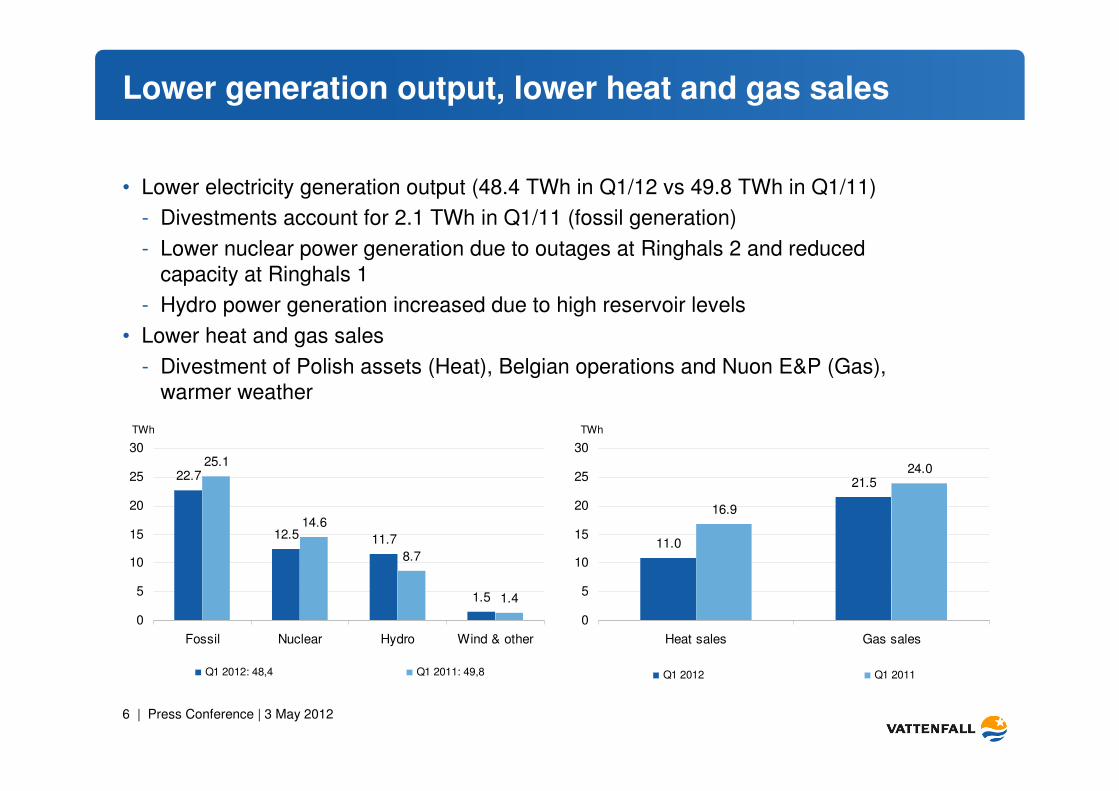
• Lower electricity generation output (48.4 TWh in Q1/12 vs 49.8 TWh in Q1/11)
- Divestments account for 2.1 TWh in Q1/11 (fossil generation)
- Lower nuclear power generation due to outages at Ringhals 2 and reduced capacity at Ringhals 1
- Hydro power generation increased due to high reservoir levels
• Lower heat and gas sales
- Divestment of Polish assets (Heat), Belgian operations and Nuon E&P (Gas), warmer weather
TWh TWh
1.5
11.712.5
22.7
1.4
8.7
14.6
25.1
0
5
10
15
20
25
30
Fossil Nuclear Hydro Wind & other
Q1 2012: 48,4 Q1 2011: 49,8
21.5
11.0
24.0
16.9
0
5
10
15
20
25
30
Heat sales Gas sales
Q1 2012 Q1 2011
7 | Press Conference | 3 May 2012
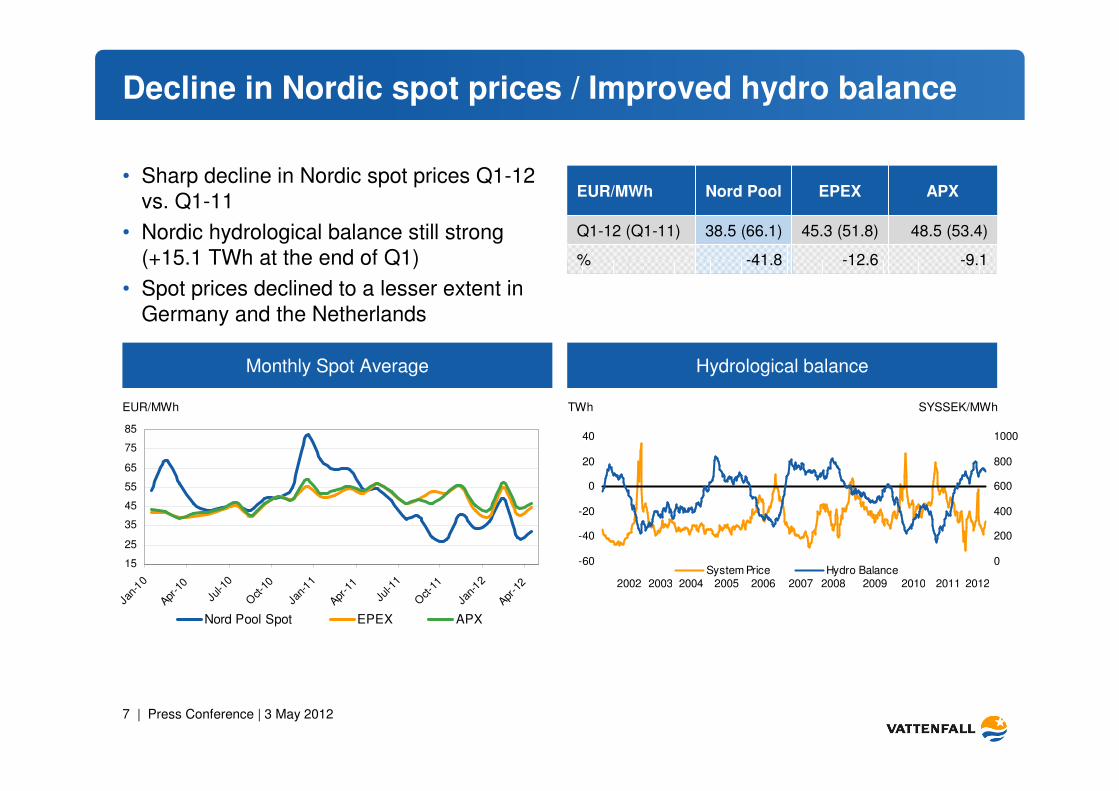
Decline in Nordic spot prices / Improved hydro balance
• Sharp decline in Nordic spot prices Q1-12 vs. Q1-11
• Nordic hydrological balance still strong (+15.1 TWh at the end of Q1)
• Spot prices declined to a lesser extent in Germany and the Netherlands
Monthly Spot Average Hydrological balance
15
25
35
45
55
65
75
85
Jan-
10
Apr-1
0
Jul-1
0
Oct
-10
Jan-
11
Apr-1
1
Jul-1
1
Oct
-11
Jan-
12
Apr-1
2
Nord Pool Spot EPEX APX
0
200
400
600
800
1000
-60
-40
-20
0
20
40
System Price Hydro Balance 200720032002 2004 2005 2006 2008 2009 2010 2011 2012
EUR/MWh TWh SYSSEK/MWh
-12.6
45.3 (51.8)
EPEX
-41.8
38.5 (66.1)
Nord PoolEUR/MWh APX
Q1-12 (Q1-11) 48.5 (53.4)
% -9.1
8 | Press Conference | 3 May 2012
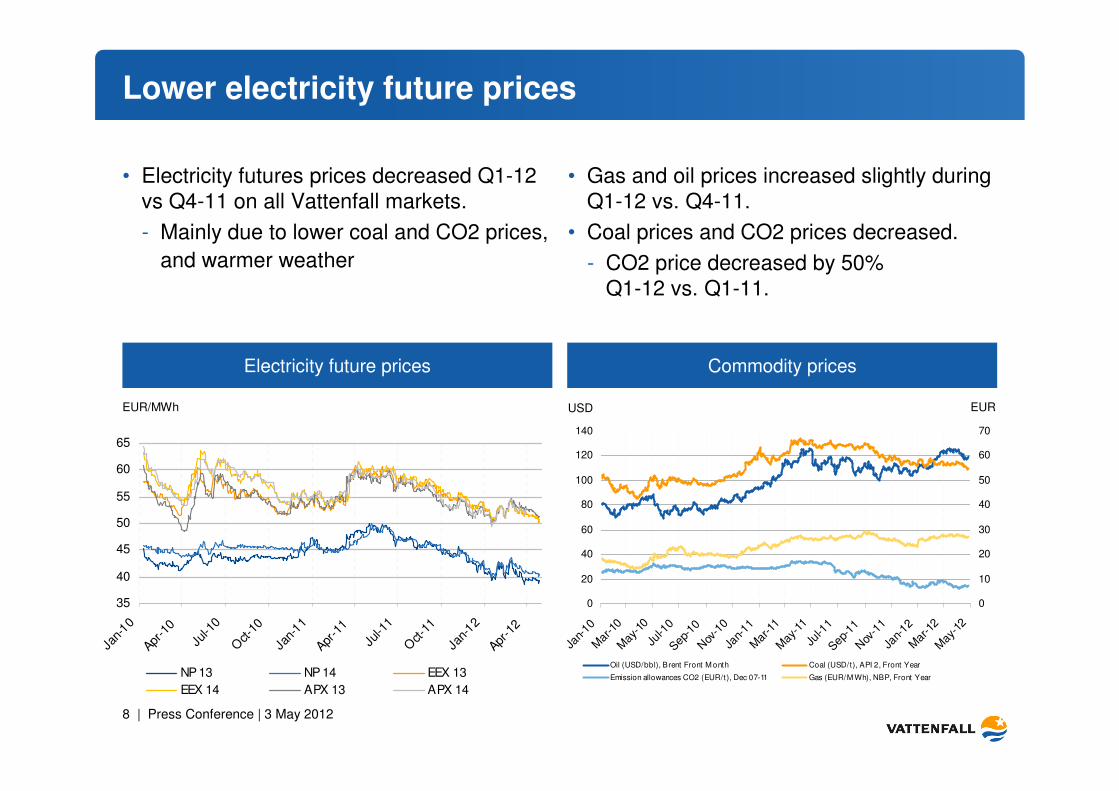
Lower electricity future prices
• Electricity futures prices decreased Q1-12 vs Q4-11 on all Vattenfall markets.
- Mainly due to lower coal and CO2 prices,
and warmer weather
• Gas and oil prices increased slightly during Q1-12 vs. Q4-11.
• Coal prices and CO2 prices decreased.
- CO2 price decreased by 50% Q1-12 vs. Q1-11.
Electricity future prices Commodity prices
0
20
40
60
80
100
120
140
Jan-
10M
ar-1
0M
ay-1
0Ju
l-10
Sep-1
0N
ov-1
0Ja
n-11
Mar
-11
May
-11
Jul-1
1Sep
-11
Nov
-11
Jan-
12M
ar-1
2M
ay-1
2
0
10
20
30
40
50
60
70
Oil (USD/bbl), Brent Front M onth Coal (USD/t), API 2, Front Year
Emission allowances CO2 (EUR/t), Dec 07-11 Gas (EUR/M Wh), NBP, Front Year
EUR/MWh USD EUR
35
40
45
50
55
60
65
Jan-
10
Apr-1
0
Jul-1
0
Oct
-10
Jan-
11
Apr-1
1
Jul-1
1
Oct
-11
Jan-
12
Apr-1
2
NP 13 NP 14 EEX 13
EEX 14 APX 13 APX 14

9 | Press Conference | 3 May 2012
Other notable events in Q1
• Volvo V60 Plug in hybrid – developed in a joint venture with Vattenfall – has been launched
and is on a European roadshow that started in March.
• Vattenfall launched it’s new sponsorship program for Olympic Talents together with the
National Olympic Committees in Sweden, Germany and the Netherlands.
• New Ocean Energy venture in the UK
- Agreement for new test site outside Orkney
The Pelamis wave energy converter Volvo V60 Plug-In Hybrid with Vattenfall charging box
FinancialsPeter Smink, acting CFO
11 | Press Conference | 3 May 2012
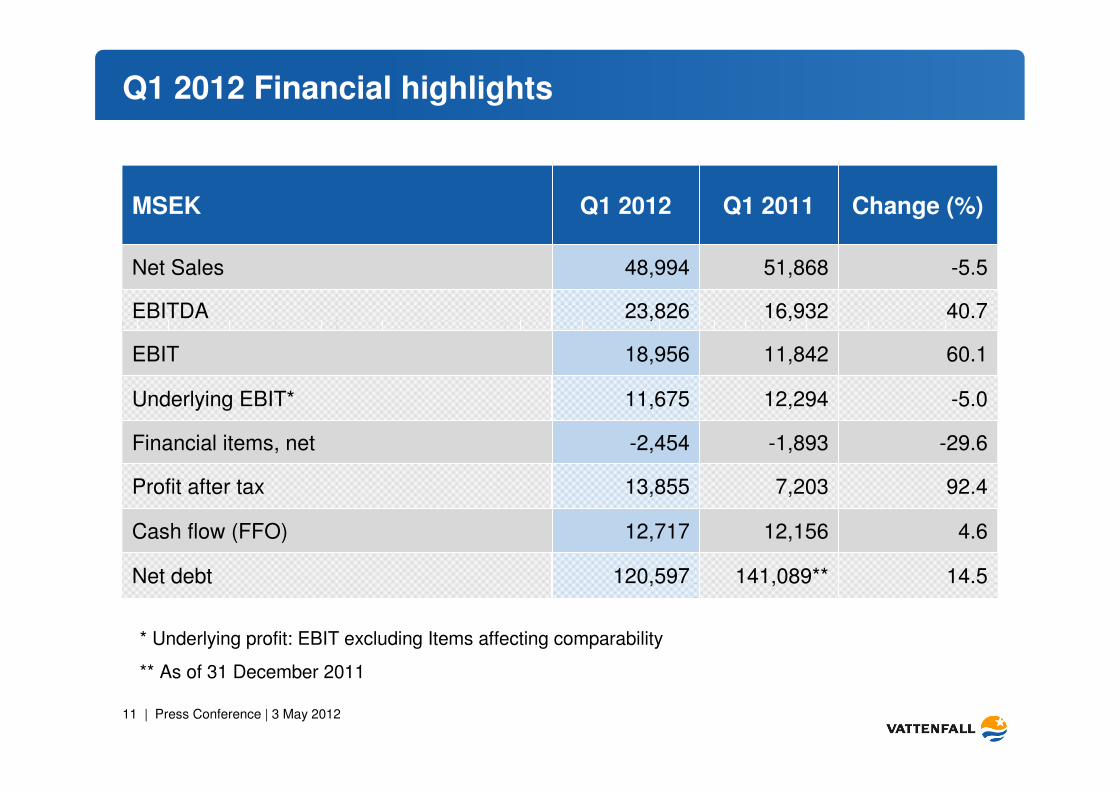
Q1 2012 Financial highlights
92.47,20313,855Profit after tax
4.612,15612,717Cash flow (FFO)
14.5141,089**120,597Net debt
-1,893
12,294
11,842
16,932
51,868
Q1 2011
-2,454
11,675
18,956
23,826
48,994
Q1 2012MSEK Change (%)
Net Sales -5.5
EBITDA 40.7
EBIT 60.1
Underlying EBIT* -5.0
Financial items, net -29.6
* Underlying profit: EBIT excluding Items affecting comparability
** As of 31 December 2011
12 | Press Conference | 3 May 2012
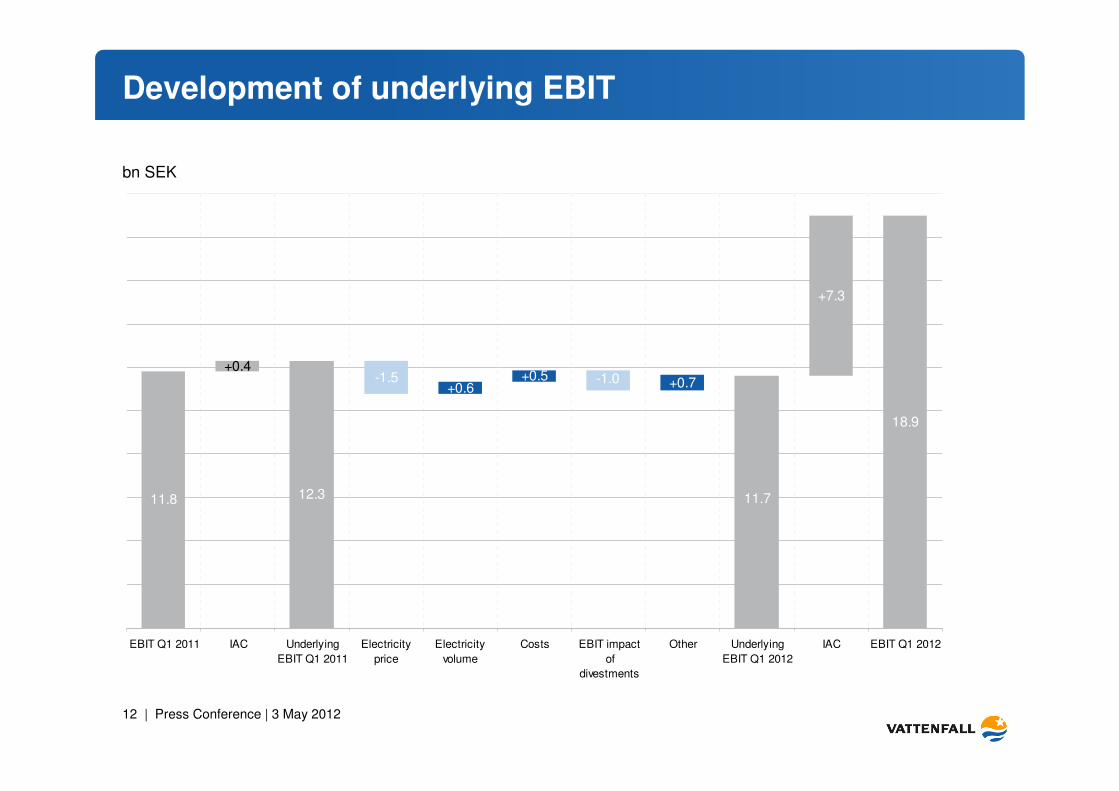
+0.6-1.5
+0.4
11.8 11.7
-1.0+0.5
12.3
+0.7
+7.3
18.9
EBIT Q1 2011 IAC Underlying
EBIT Q1 2011
Electricity
price
Electricity
volume
Costs EBIT impact
of
divestments
Other Underlying
EBIT Q1 2012
IAC EBIT Q1 2012
Development of underlying EBIT
bn SEK
13 | Press Conference | 3 May 2012
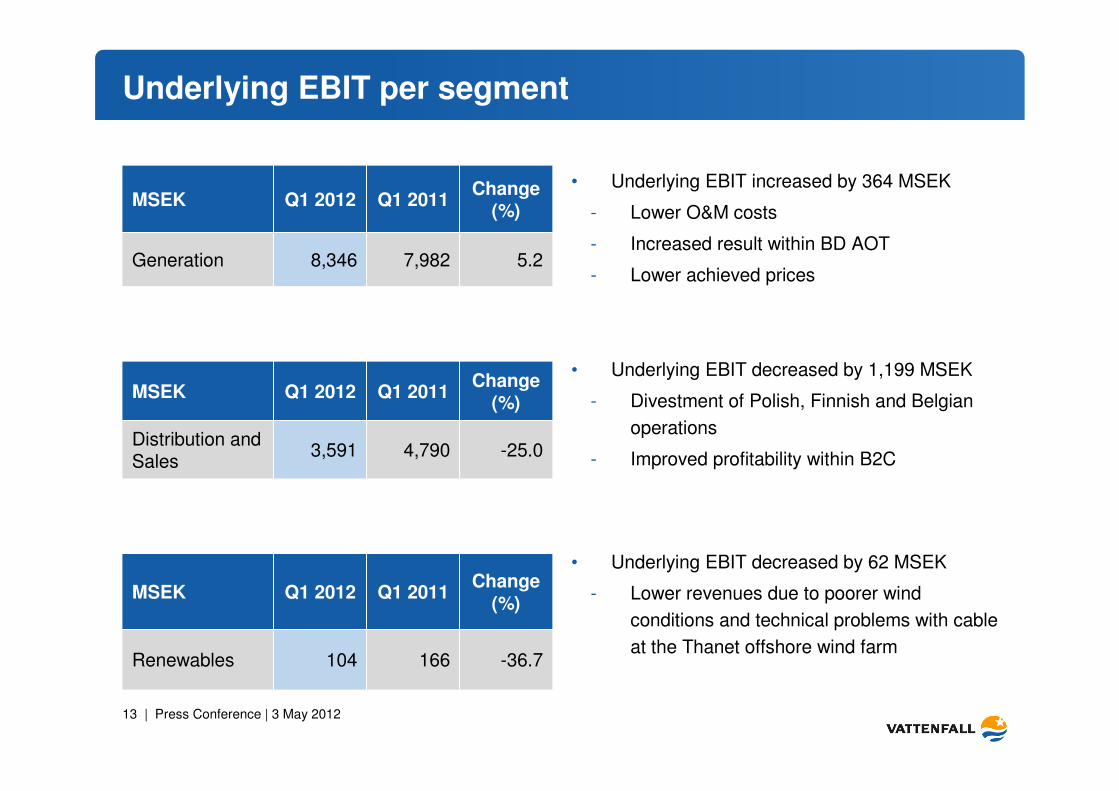
Underlying EBIT per segment
5.2
Change (%)
7,982
Q1 2011
8,346
Q1 2012MSEK
Generation
• Underlying EBIT increased by 364 MSEK
- Lower O&M costs
- Increased result within BD AOT
- Lower achieved prices
-25.0
Change (%)
4,790
Q1 2011
3,591
Q1 2012MSEK
Distribution and Sales
-36.7
Change (%)
166
Q1 2011
104
Q1 2012MSEK
Renewables
• Underlying EBIT decreased by 1,199 MSEK
- Divestment of Polish, Finnish and Belgian
operations
- Improved profitability within B2C
• Underlying EBIT decreased by 62 MSEK
- Lower revenues due to poorer wind
conditions and technical problems with cable
at the Thanet offshore wind farm
14 | Press Conference | 3 May 2012
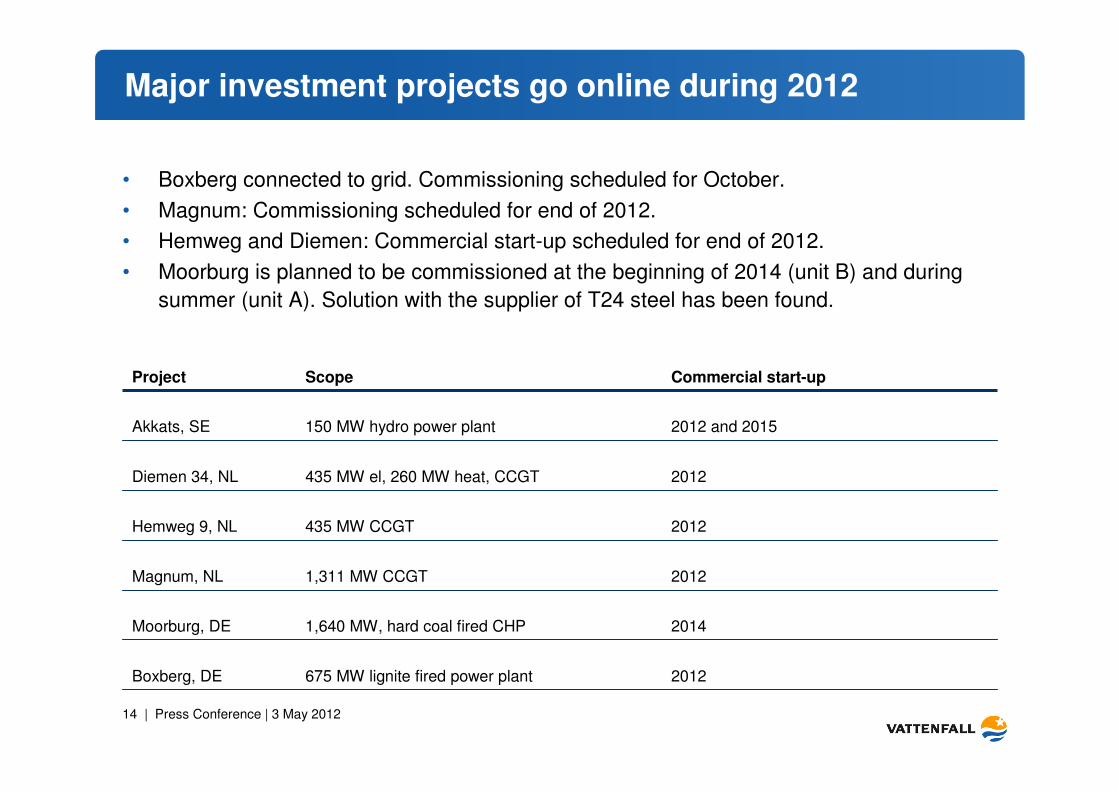
Major investment projects go online during 2012
2012
2014
2012
2012
2012
2012 and 2015
Commercial start-up
1,640 MW, hard coal fired CHPMoorburg, DE
1,311 MW CCGT Magnum, NL
435 MW CCGTHemweg 9, NL
435 MW el, 260 MW heat, CCGTDiemen 34, NL
675 MW lignite fired power plantBoxberg, DE
150 MW hydro power plantAkkats, SE
ScopeProject
• Boxberg connected to grid. Commissioning scheduled for October.
• Magnum: Commissioning scheduled for end of 2012.
• Hemweg and Diemen: Commercial start-up scheduled for end of 2012.
• Moorburg is planned to be commissioned at the beginning of 2014 (unit B) and during
summer (unit A). Solution with the supplier of T24 steel has been found.
15 | Press Conference | 3 May 2012
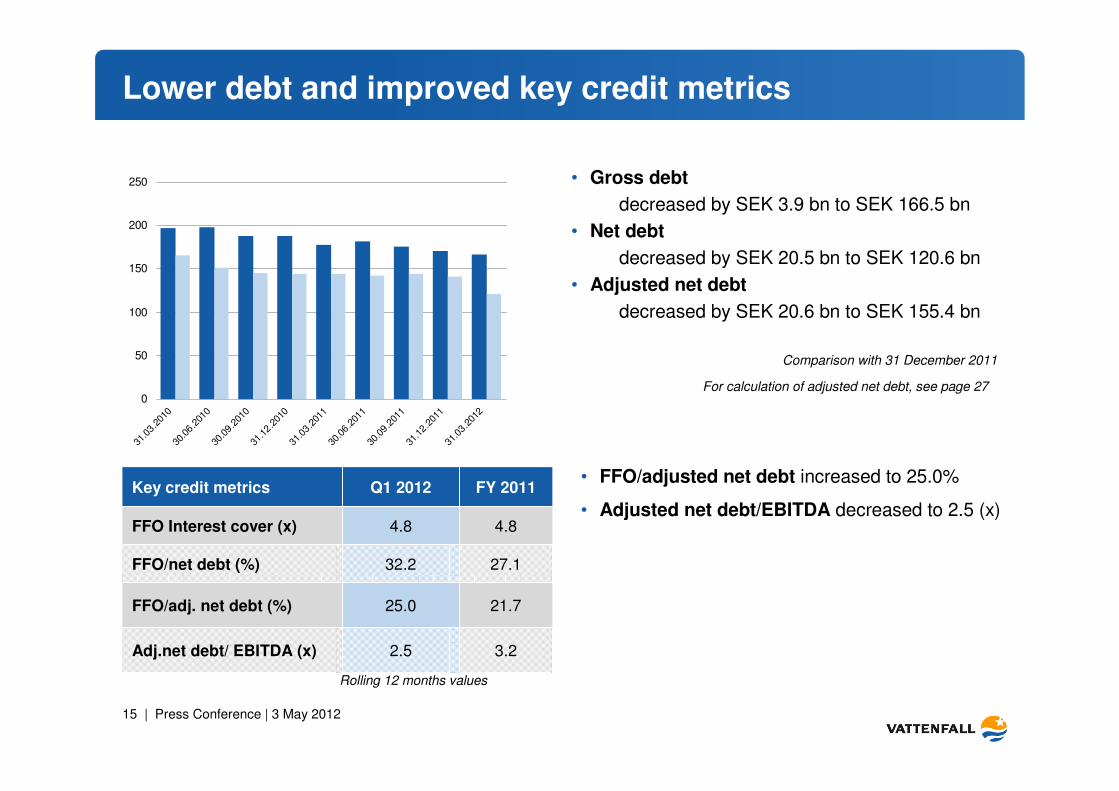
Lower debt and improved key credit metrics
• FFO/adjusted net debt increased to 25.0%
• Adjusted net debt/EBITDA decreased to 2.5 (x)
• Gross debt
decreased by SEK 3.9 bn to SEK 166.5 bn
• Net debt
decreased by SEK 20.5 bn to SEK 120.6 bn
• Adjusted net debt
decreased by SEK 20.6 bn to SEK 155.4 bn
Comparison with 31 December 2011
3.22.5Adj.net debt/ EBITDA (x)
21.7
27.1
4.8
FY 2011
25.0
32.2
4.8
Q1 2012Key credit metrics
FFO Interest cover (x)
FFO/net debt (%)
FFO/adj. net debt (%)
0
50
100
150
200
250
31.0
3.201
030
.06.2
010
30.0
9.201
031
.12.2
010
31.0
3.201
130
.06.2
011
30.0
9.201
131
.12.2
011
31.0
3.201
2
For calculation of adjusted net debt, see page 27
Rolling 12 months values

Q&A

Appendix
18 | Press Conference | 3 May 2012
Underlying EBIT – Operating profit excl. IAC
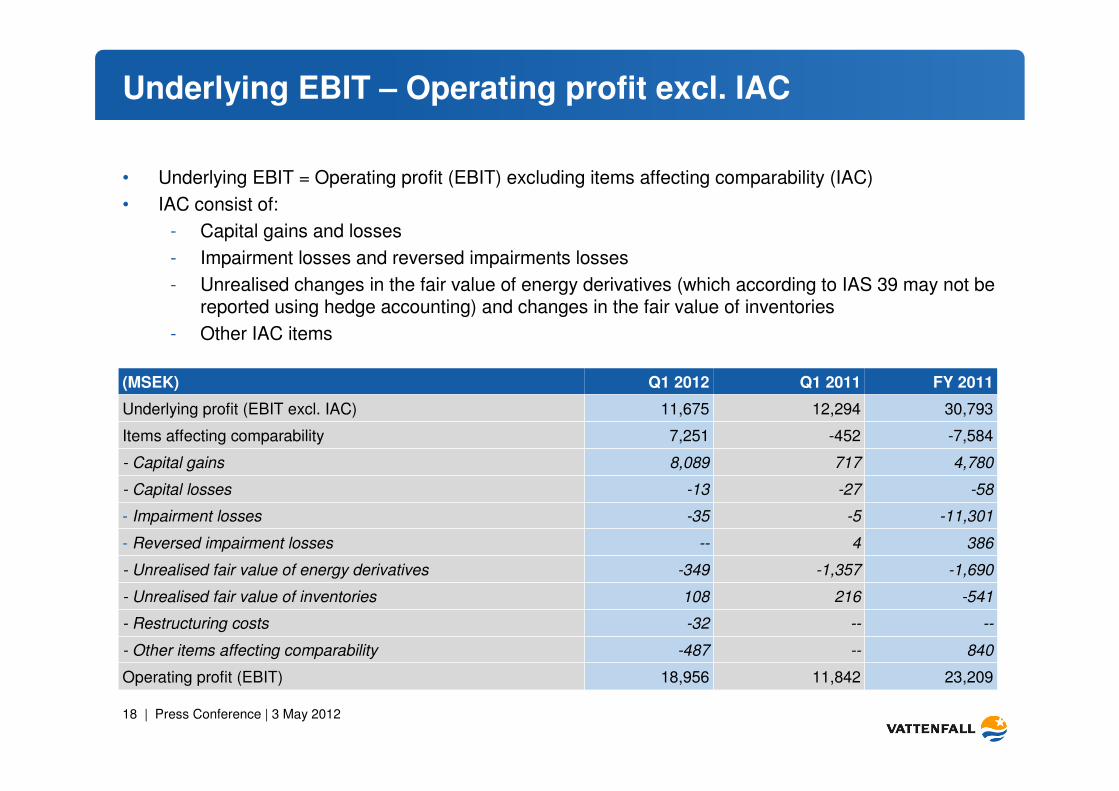
23,20911,84218,956Operating profit (EBIT)
-7,584-4527,251Items affecting comparability
840---487- Other items affecting comparability
-----32- Restructuring costs
-58-27-13- Capital losses
4,7807178,089- Capital gains
3864--- Reversed impairment losses
-11,301-5-35- Impairment losses
-541216108- Unrealised fair value of inventories
-1,690-1,357-349- Unrealised fair value of energy derivatives
30,793
FY 2011Q1 2012
11,675
(MSEK) Q1 2011
12,294Underlying profit (EBIT excl. IAC)
• Underlying EBIT = Operating profit (EBIT) excluding items affecting comparability (IAC)
• IAC consist of:
- Capital gains and losses
- Impairment losses and reversed impairments losses
- Unrealised changes in the fair value of energy derivatives (which according to IAS 39 may not be reported using hedge accounting) and changes in the fair value of inventories
- Other IAC items
19 | Press Conference | 3 May 2012
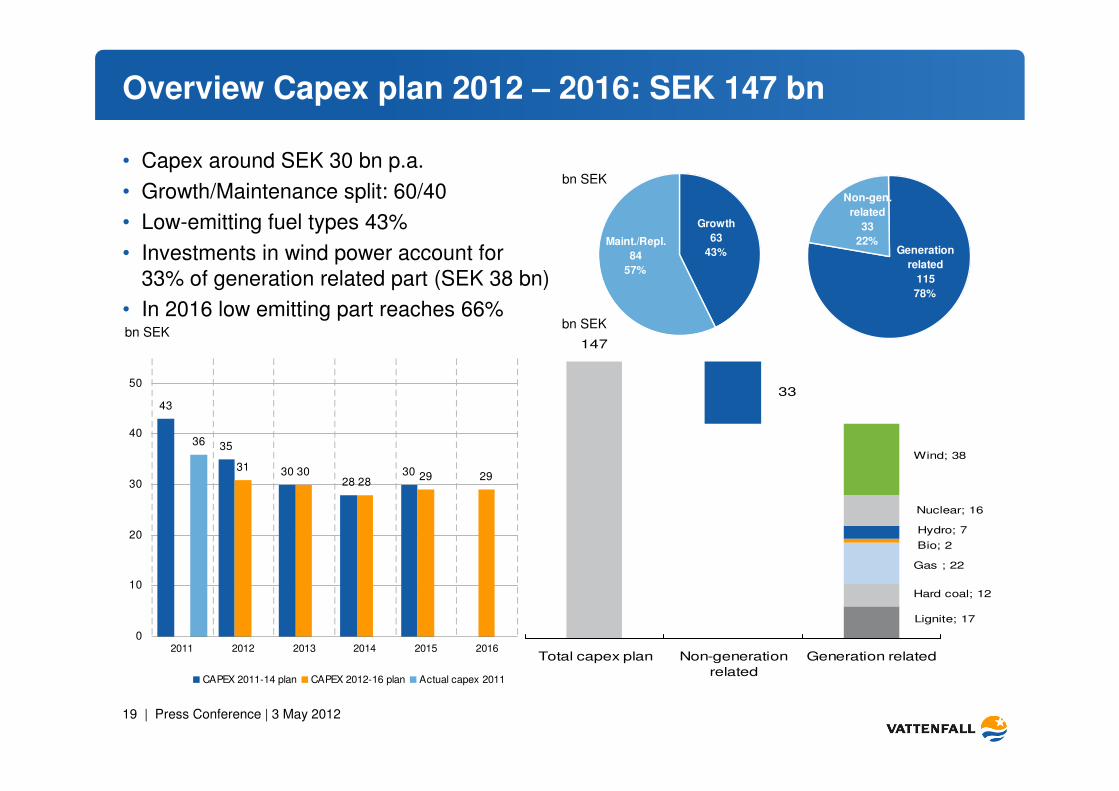
Growth
63
43%Maint./Repl.
84
57%
Generation
related
115
78%
Non-gen.
related
33
22%
43
35
3028
3031 3028
29 29
36
0
10
20
30
40
50
2011 2012 2013 2014 2015 2016
CAPEX 2011-14 plan CAPEX 2012-16 plan Actual capex 2011
Overview Capex plan 2012 – 2016: SEK 147 bn
bn SEK
bn SEK
33
147
Lignite; 17
Hard coal; 12
Gas ; 22
Bio; 2
Hydro; 7
Nuclear; 16
Wind; 38
Total capex plan Non-generation
related
Generation related
bn SEK
• Capex around SEK 30 bn p.a.
• Growth/Maintenance split: 60/40
• Low-emitting fuel types 43%
• Investments in wind power account for 33% of generation related part (SEK 38 bn)
• In 2016 low emitting part reaches 66%
20 | Press Conference | 3 May 2012
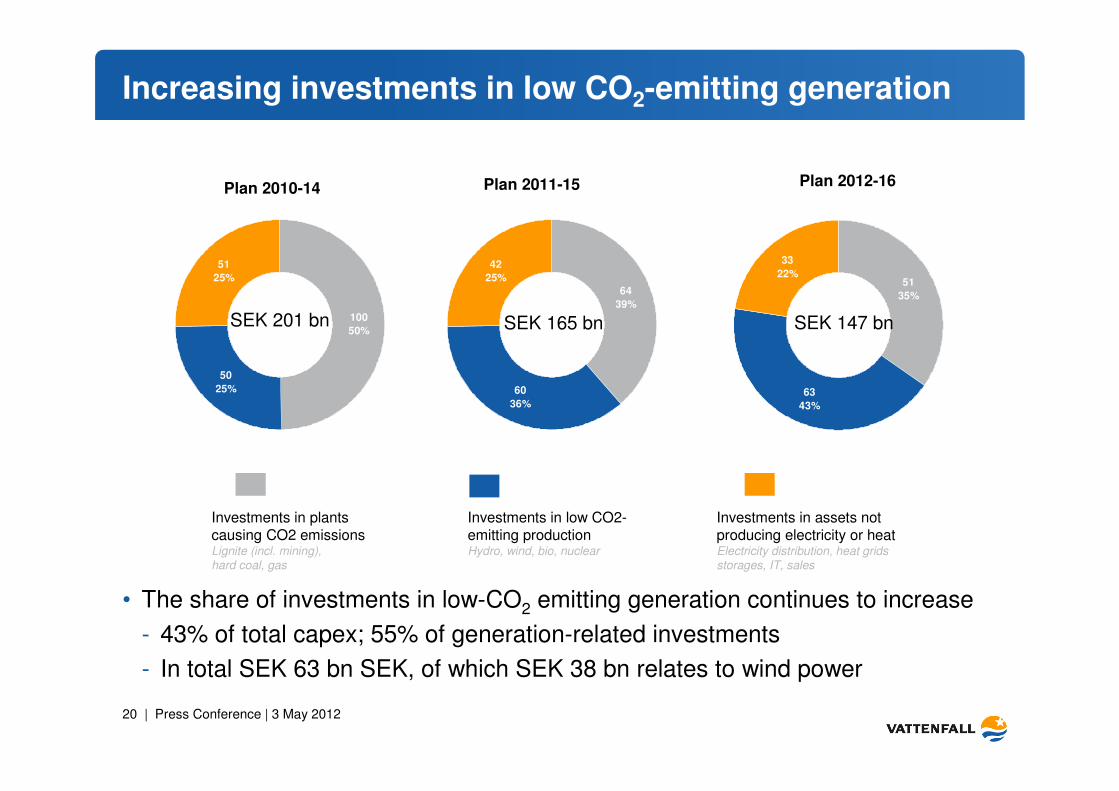
Increasing investments in low CO2-emitting generation
100
50%
50
25%
51
25%
64
39%
60
36%
42
25% 51
35%
63
43%
33
22%
SEK 165 bnSEK 201 bn SEK 147 bn
Plan 2010-14 Plan 2011-15 Plan 2012-16
Investments in low CO2-emitting productionHydro, wind, bio, nuclear
Investments in plantscausing CO2 emissionsLignite (incl. mining), hard coal, gas
Investments in assets not producing electricity or heatElectricity distribution, heat gridsstorages, IT, sales
• The share of investments in low-CO2 emitting generation continues to increase
- 43% of total capex; 55% of generation-related investments
- In total SEK 63 bn SEK, of which SEK 38 bn relates to wind power
21 | Press Conference | 3 May 2012
Q1 Q2 Q3 Q4
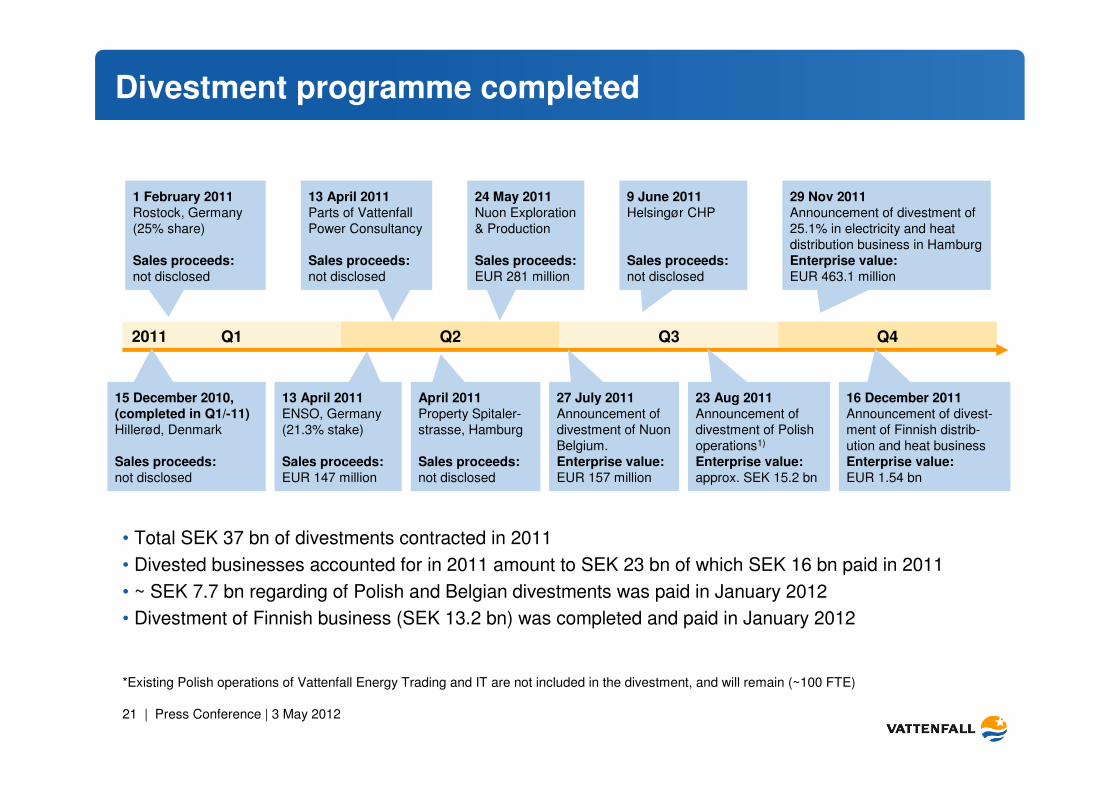
Divestment programme completed
*Existing Polish operations of Vattenfall Energy Trading and IT are not included in the divestment, and will remain (~100 FTE)
15 December 2010,
(completed in Q1/-11)
Hillerød, Denmark
Sales proceeds:
not disclosed
2011
April 2011
Property Spitaler-strasse, Hamburg
Sales proceeds:
not disclosed
13 April 2011
Parts of Vattenfall Power Consultancy
Sales proceeds:
not disclosed
24 May 2011
Nuon Exploration & Production
Sales proceeds:
EUR 281 million
9 June 2011
Helsingør CHP
Sales proceeds:
not disclosed
23 Aug 2011
Announcement of divestment of Polish operations1)
Enterprise value:
approx. SEK 15.2 bn
13 April 2011
ENSO, Germany (21.3% stake)
Sales proceeds:
EUR 147 million
27 July 2011
Announcement of divestment of Nuon Belgium.Enterprise value:
EUR 157 million
• Total SEK 37 bn of divestments contracted in 2011
• Divested businesses accounted for in 2011 amount to SEK 23 bn of which SEK 16 bn paid in 2011
• ~ SEK 7.7 bn regarding of Polish and Belgian divestments was paid in January 2012
• Divestment of Finnish business (SEK 13.2 bn) was completed and paid in January 2012
1 February 2011
Rostock, Germany(25% share)
Sales proceeds:
not disclosed
29 Nov 2011
Announcement of divestment of 25.1% in electricity and heat distribution business in HamburgEnterprise value:
EUR 463.1 million
16 December 2011
Announcement of divest-ment of Finnish distrib-ution and heat businessEnterprise value:
EUR 1.54 bn
22 | Press Conference | 3 May 2012
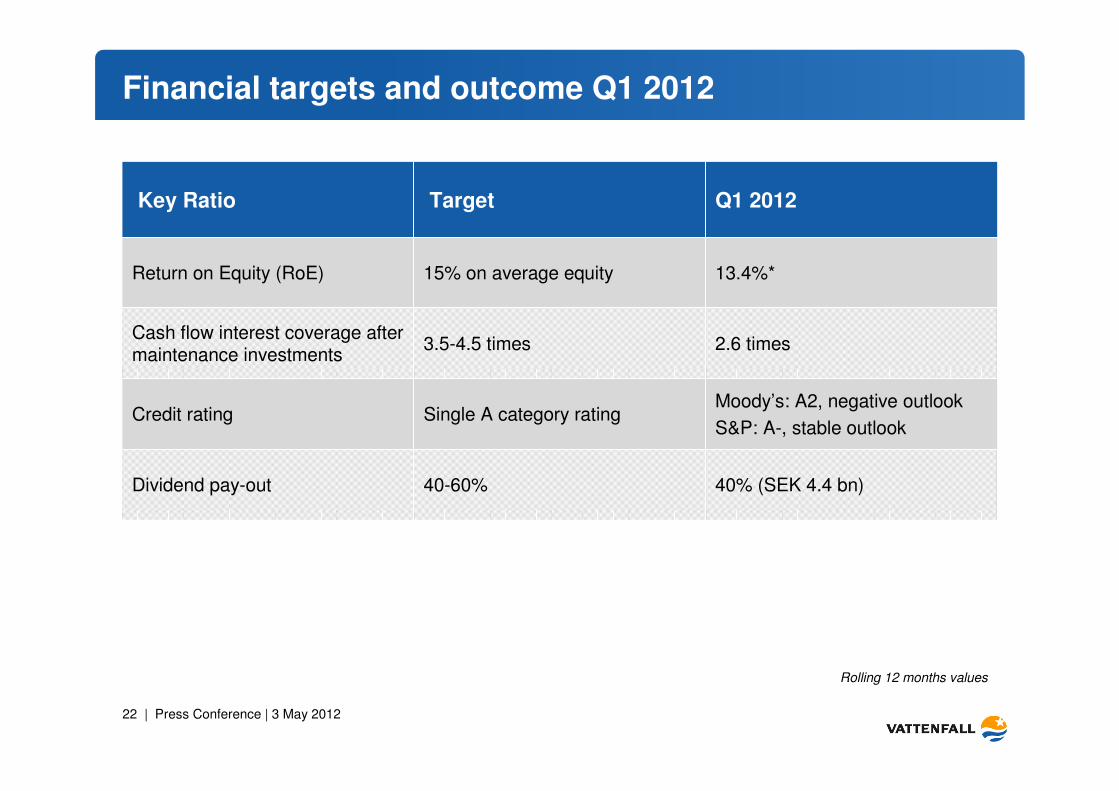
Financial targets and outcome Q1 2012
2.6 times3.5-4.5 timesCash flow interest coverage after maintenance investments
13.4%*15% on average equityReturn on Equity (RoE)
40-60%
Single A category rating
Target
40% (SEK 4.4 bn)
Moody’s: A2, negative outlook
S&P: A-, stable outlook
Q1 2012Key Ratio
Credit rating
Dividend pay-out
Rolling 12 months values
23 | Press Conference | 3 May 2012
Ex-ante regulation
• The ex-post regulation in Sweden has been changed into ex-ante regulation as from 2012 with four-year tariff periods
• The tariffs shall cover reasonable costs to run the network business during the supervisory period (4 years) and allow a reasonable return on the assets that are needed in the network business. The quality of delivery (network performance) shall influence the tariffs.
• On 31 October 2012 the Regulator (Energimarknadsinspektionen) published its decision regarding the tariffs for the period 2012-2015.
• The Regulator has in principle approved Vattenfalls application according to its method - but after a transition period of eighteen years. This means that for the period 2012-2015 Vattenfall is only allowed to increase tariffs by a third of the difference between 2006-2009 tariffs and the 2024-2027 tariffs (Vattenfalls applied tariffs).
• Vattenfall and about half of all DSOs in Sweden have appealed the Regulators decision.The industry believes that the transition rule are not compliant with the Swedish Electricity Act. A judgment from the first court level is expected in H1 2013
24 | Press Conference | 3 May 2012
Credit ratings
Standard & Poor’sA- (stable outlook). Research update: 9 December 2011
Outlook:“The stable outlook reflects our expectations that Vattenfall's own efficiency measures will mitigate pressure on profitability from falling power prices. It further reflects […] that Vattenfall's investments will decrease in the near term and average about SEK30 billion annually over the next few years. Based on these factors, combined with proceeds from asset disposals, which we believe Vattenfall will use to reduce adjusted debt, we anticipate that Vattenfall should be able to maintain credit measures in line with the ratings, including adjusted FFO to debt of about 20%.
We could lower the ratings if Vattenfall's operating and/or financial performance significantly weakens from current levels, leading to a negative impact on credit measures, such as a sustained decline in adjusted FFO to debt below 20%. […] We could also lower the ratings is if we see evidence of government support weakening. […]
We could raise the ratings if we believed that Vattenfall's financial risk profile and credit measures could improve sustainablyto a level commensurate with a one notch higher SACP, for example through an sustainable increase in adjusted FFO to debt to about 25%, based on the existing business risk profile. […]
We could also raise the ratings by one notch if we saw evidence of strengthened government support, leading us to revise upward our assessment of the likelihood of government support for Vattenfall.”
Moody’sA2 (negative outlook). Announcement: 21 February 2012, A2 rating affirmed but outlook changed from stable to negative.
Outlook:“The negative outlook reflects the possibility that Vattenfall's performance will not improve to the extent required for the company to maintain its A2 rating. The continued challenging macroeconomic conditions in Sweden, combined with the
country's strong hydro reservoir levels, could result in sustained downward pressure on both demand and electricity price
levels, thereby reducing available revenues from Vattenfall's generating fleet well into 2012. Moody's expects that spreads
on thermal generation will also remain relatively weak during 2012. A further credit negative is the modest deterioration in
Vattenfall's business risk profile resulting from the company's sale of its heat and electricity distribution business which will result in lower quality cash flow for 2012.
Recommended