Variability of Atmospheric Composition associated with
Global Circulation Patterns using Satellite Data
A contribution to ACCENT-TROPOSAT-2, Task Group 2
Célia Gouveia1 and Margarida L. R. Liberato2
1EST/ISP 2UTAD

• 2006 - begin participation at AT2 group
• Analyze the changes in tropospheric NO2 patterns, using GOME and SCIAMACHY over Europe
• Related the NO2 inter-annual variability with climatic variability, using North Atlantic Oscillation.
Despite the short dataset, results highlight the add value of the extended dataset NO2 for climate change and climate variability studies
• Investigate the high number of O3 excedences in a background station in the Portugal
Need of daily values of O3 tropospheric observations and vertical profiles

AIM
• Investigate, from a climatological point of view, the changes in tropospheric NO2 patterns – temporal – spatial
• GOME measurements from 1996 to 2003 over Europe
• GOME and SCIAMACHY measurements from 1996 to 2006

DATA and METHODS -1
• Tropospheric NO2 columns from GOME derived at the Institute of Environmental Physics of the University of Bremen.
• NAO index from Climatic Research Unit (University of East Anglia, UK).

Trend Analysis
Seasonal Anomalie
s
GRID POINTCORRELATIONS
Winter
NAO
Monthly Tropospheri
cNO2
Winter: JFM Summer: JJA

NO2 monthly means January to December
(1996 to 2003)

NO2 seasonal anomalies
(1996 to 2003)
WINTER
(JFM)
NO2 seasonal anomalies
(1996 to 2002)
SUMMER
(JJA)

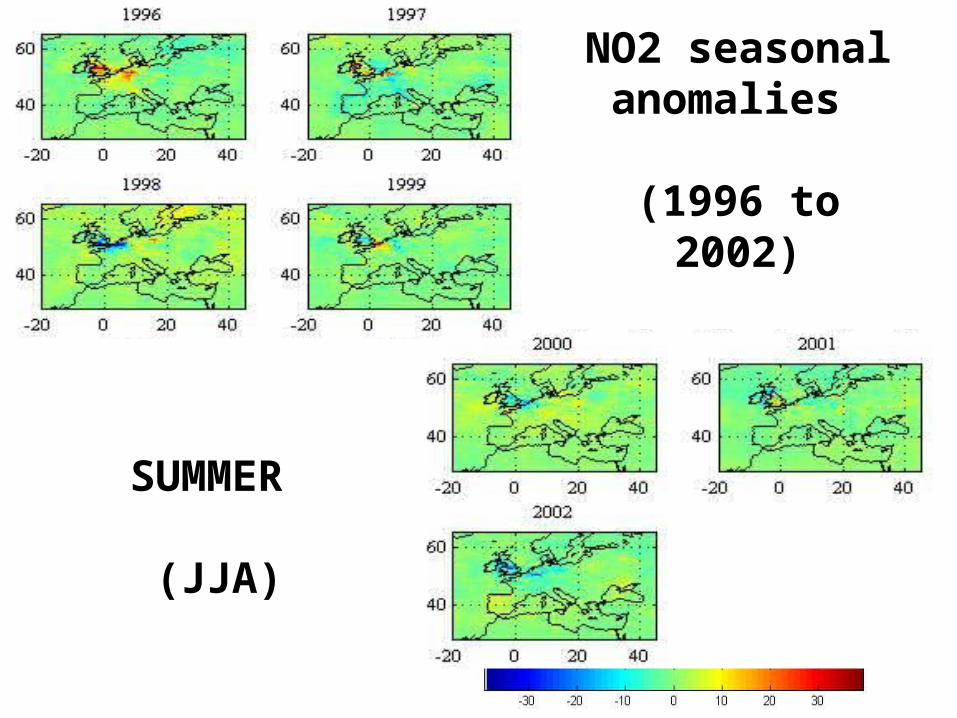
NO2 trends
3 boxes in Europe(1996 to 2003)
• Northern Italy (NI)
• Northern Europe (NE)
• North-western Iberian Peninsula (IP)
SUMMER (JJA)
WINTER (JFM)
Very short time series!!!!

Lat Lon Winter Summer Northern Italy 44.25ºN 10.25ºE -0.56 -0.48
Northern Europe 52.25ºN 8.25ºE -0.71 -0.68 Iberian Peninsula 41.25ºN 7.25ºW 0.33 0.03
Correlation coefficient between winter (JFM) NAO index and both winter and summer NO2 anomalies
Very short time series!!!!
Motivate further analyses

CONCLUSIONS - 1• Winter months present higher NO2 anomaly values than
summer months (relative maximum over central Europe); • In winter Northern Europe and Northern Italy boxes
present a significant decreasing trend, while the Iberian Peninsula does not present a significant trend;
• In summer Northern Europe box presents also a significant decreasing trend, while Northern Italy region does not present significant trend. Iberia presents an increasing trend (summer wildfires);
• Northern Europe and Northern Italy boxes present negative correlation values with North Atlantic Oscillation for both seasons (relative maximum for NO2 anomalies over Northern Europe -0.70.
• This result will be analyzed in detail in further works.
Need of an extended dataset
Impact of climate variability on tropospheric NO2 retrieved
from GOME and SCIAMACHY measurements
1996-2006 period

Simultaneous data -2
• Simultaneous data from GOME and SCIAMACHY instruments are available from August 2002 to June 2003;
• Monthly data from SCIAMACHY were resampled to the same spatial resolution of GOME, with a nearest neighbour interpolation, in order to compare simultaneous data;
• Anomalies, i.e., departures from the averages, have been calculated separately, for GOME and SCIAMACHY datasets.

Several methods have been applied. The nearest neighbour interpolation was considered to allow
better fit and spatial coverage

Seasonal Anomalies
GOME winter
SCIAMACHY winter
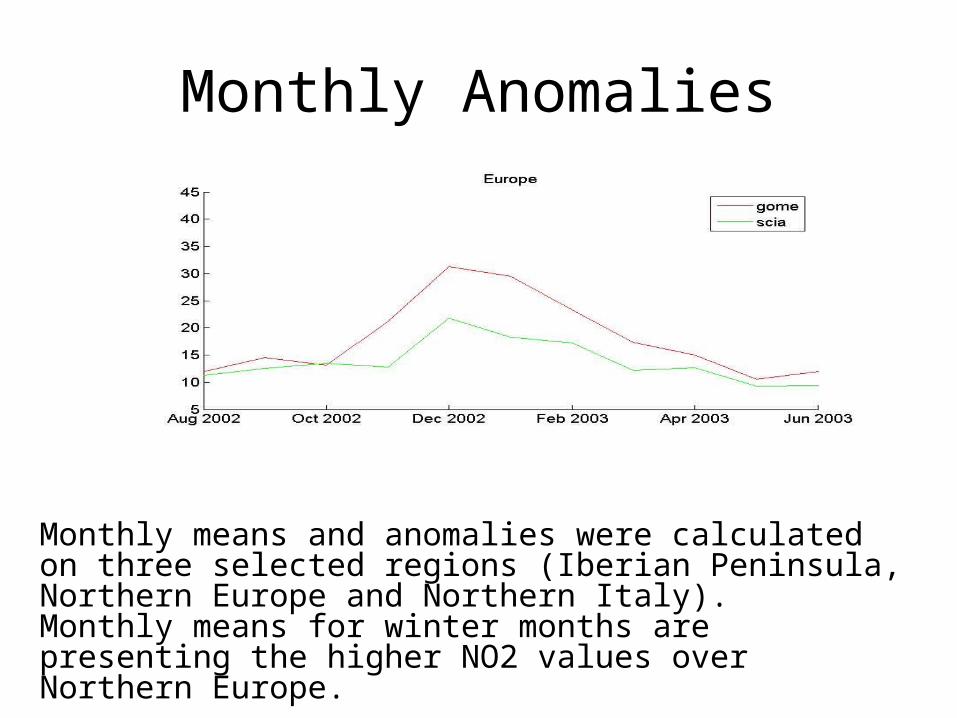
Monthly means and anomalies were calculated on three selected regions (Iberian Peninsula, Northern Europe and Northern Italy). Monthly means for winter months are presenting the higher NO2 values over Northern Europe.
Monthly Anomalies
Monthly Anomalies
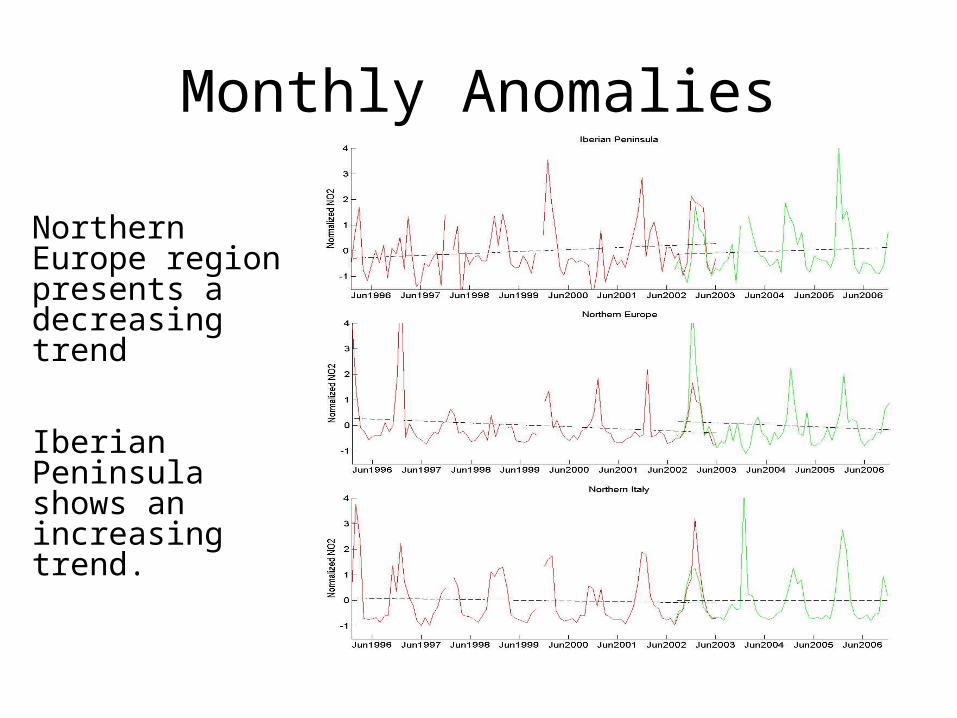
Northern Europe region presents a decreasing trend
Iberian Peninsula shows an increasing trend.

Conclusions - 2
•Monthly means and anomalies were calculated on three selected regions (Iberian Peninsula, Northern Europe and Northern Italy).
•Monthly means for winter months are presenting the higher NO2 values over Northern Europe.
•Individual trends were analyzed and Northern Europe region presents a decreasing trend while the Iberian Peninsula shows an increasing trend.
•This result will be analyzed with daily dataset.
Need of a daily dataset
Tropospheric Ozone levels in the North of Portugal
60
120
180
240
300
360
Jan Feb Mar Apr May Jun Jul Aug Sep Oct Nov Dec
Time (month)
Ozo
ne
(µg
/m^
3)
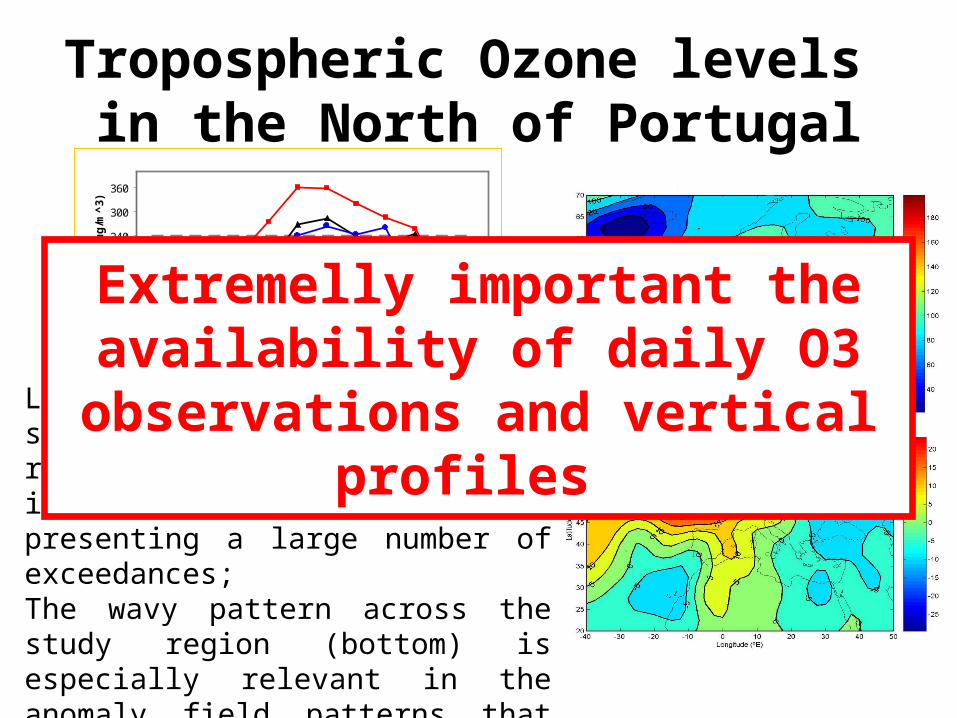
Lamas de Olo is a background station, located in a rural region (at 1086 m height), inside a Natural Park presenting a large number of exceedances;The wavy pattern across the study region (bottom) is especially relevant in the anomaly field patterns that present a well defined dipole with a SW-NE orientation
Extremelly important the availability of daily O3
observations and vertical profiles

Papers in conference proceedings and Communications
• Gouveia, C., M. L. R. Liberato, A. Richter e J. P. Burrows, 2007: Using 8 Years of Satellite Data to Assess Tropospheric Concentration over European Region, 32nd International Symposium on Remote Sensing of Environment - Sustainable Development Through Global Earth Observations, San José, Costa Rica (poster).
• Gouveia, C. e M. L. R. Liberato, 2007: Variability of Tropospheric Composition Over Europe Using Satellite Data, Second ACCENT Symposium, Urbino, Italy, (poster) .
• Liberato, M. L. R., C. Gouveia, A. Richter, J. P. Burrows, 2008: Impact of climate variability on tropospheric NO2 retrieved from GOME and SCIAMACHY measurements. In Geophysical Research Abstracts, Vol. 10, EGU2008-A-10446, 2008 (poster).
• Gouveia, C., M. L. R. Liberato, M. Weber, J. P. Burrows, 2008: GOME global distribution of total ozone – a comparison study, Quadrennial Ozone Symposium 2008, Tromsø, Norway (poster).
• Gouveia, C., M. L. R. Liberato, R. M. Trigo, M. Weber, J. P. Burrows, 2008: Evidence of high ozone levels in Europe during summer 2003, Quadrennial Ozone Symposium 2008, Tromsø, Norway (poster).
• Liberato M. L. R., C. Gouveia, J. M. Castanheira, C. C. DaCamara, M. Weber, J. P. Burrows, 2008: On the effect of planetary Rossby waves on total ozone from GOME, 4th SPARC General Assembly, Bolonha, Itália (poster).
Recommended