REPORT NO. 2353
VALUES, COLLABORATIVE PROCESSES AND INDICATORS FOR FRESHWATER PLANNING

CAWTHRON INSTITUTE | REPORT NO. 2353 JULY 2013
VALUES, COLLABORATIVE PROCESSES AND INDICATORS FOR FRESHWATER PLANNING
1NATASHA BERKETT, 1IAN CHALLENGER, 1JIM SINNER, 2MARC TADAKI 1 CAWTHRON INSTITUTE 2 SCHOOL OF ENVIRONMENT, AUCKLAND UNIVERSITY
Prepared for Auckland Council: National Policy Statement Freshwater Management Implementation Programme
CAWTHRON INSTITUTE 98 Halifax Street East, Nelson 7010 | Private Bag 2, Nelson 7042 | New Zealand Ph. +64 3 548 2319 | Fax. +64 3 546 9464 www.cawthron.org.nz
REVIEWED BY: Andrew Fenemor
APPROVED FOR RELEASE BY: Chris Cornelisen
ISSUE DATE: 4 July 2013
RECOMMENDED CITATION: Berkett N, Challenger I, Sinner J, Tadaki M 2013. Values, Collaborative Processes and Indicators for Freshwater Planning. Prepared for Auckland Council: National Policy Statement Freshwater Management Implementation Programme. Cawthron Report No. 2353. 57 p plus appendix. © COPYRIGHT: Apart from any fair dealing for the purpose of study, research, criticism, or review, as permitted under the Copyright Act, this publication must not be reproduced in whole or in part without the written permission of the Copyright Holder, who, unless other authorship is cited in the text or acknowledgements, is the commissioner of the report.
CAWTHRON INSTITUTE | REPORT NO. 2353 JULY 2013
iii
EXECUTIVE SUMMARY
The context of values The National Policy Statement Freshwater Management (NPSFM) issued in 2011 directs councils to set objectives and catchment-wide limits for abstractions and discharges for all freshwater bodies in their respective regions by 2030. The NPSFM and other recent documents indicate a growing expectation that freshwater management objectives will be based on both national and local ‘freshwater values’. However there is a lack of clarity about what the term ‘freshwater values’ means, and even less clarity about how such values should be identified, assessed and deployed in freshwater planning. There are several meanings of ‘value’ and ‘values’ of relevance to freshwater planning, including one that conflates three other definitions. This last, conflated definition of values as “things that have value or meaning”, including but not limited to what we consider “uses” of water, is the best way to understand most of the recent discourse on freshwater values but it still leaves ample room for (mis)interpretation.
Stakeholders can have constructive conversations about freshwater values without being precise about definitions, because the meaning can emerge from the context. However, if the term ‘value; or ‘values’ is to be used in planning documents, it should be carefully defined to avoid unintended ambiguity. Categories of ‘values’ are simplifications that approximate the complexity of how people value water bodies, and are often not discrete. Cultural values are not distinct from social values; social values can overlap with environmental values or economic values etc. E.g. swimming can be seen as an environmental, social and cultural value, and swimming by tourists as an economic value. Categories such as ‘environmental values’ and ‘social values’ may be useful as prompts or reminders of different aspects of how people value or find meaning in their environment, but they are not distinct enough to be used for planning purposes. The simple act of defining categories and documenting values can privilege some uses and values over others and provoke conflict. This conflict can perhaps be reduced if values are identified, assessed and documented as part of the same planning process that determines management objectives, policies and methods so that the debate is appropriately focused on the latter rather than on what values are worthy of documenting in a regional plan. Decisions about freshwater management objectives inevitably involve some determination of the relative significance or importance (or ‘value’) to be given to different aspects of freshwater systems. Value is not always bounded (well-defined), stable and hence measurable, as certain methods based in economics tend to assume. Rather, value is often constructed in context. That is, how a person’s feelings for a freshwater system or place manifest themselves
CAWTHRON INSTITUTE | REPORT NO. 2353 JULY 2013
iv
depends not only on the person’s experiences but also on other context-specific matters, such as how a question is asked and by whom. Collaborative governance offers a promising way through the problem of highly contextualised values, precisely because it provides a context in which values can be jointly constructed and prioritised, leading to agreed management objectives and strategies. The enduring outcome is not the decision about the intended state (i.e. the management objectives) but rather the on-going process for managing under uncertainty, since the actual outcome will inevitably be different than intended. One of the key challenges is to be ever-mindful of the various ways that imbalances of power between different stakeholders can affect the outcomes of deliberative democracy. Collaborative governance ‘Collaborative governance’ is not consultation. It involves public organisations engaging with stakeholders in collective decision-making processes in a formal, consensus-oriented and deliberative way. Collaborative processes may well offer the best approach for dealing with complex, multi-attribute wicked problems that are of long-term social, economic and environmental importance. In establishing and implementing a collaborative process, a regional or unitary council plays many roles. It leads and sponsors the process by giving the collaborative stakeholder group (CSG) a mandate and defining the scope of its work. It provides, through staff, expert technical information and policy analysis and advice. It is also a stakeholder in the process, with interests and responsibilities of its own. As envisaged by the Land and Water Forum (LaWF), collaboration involves a commitment by a public agency to give effect to consensus recommendations from the CSG, to the extent allowed by law. We recommend that a council give a good faith undertaking to implement consensus recommendations as long as these are consistent with higher level documents (e.g. the regional policy statement and long-term plan), the Resource Management Act 1991 (RMA) and other legal requirements. The mandate for a CSG also needs to define the group’s scope and outline how the process aligns with other planning processes that may be occurring concurrently (such as amendments to a regional policy statement). It is important to identify these and be clear about which issues will be dealt with in which process. Recruitment of participants is another key aspect of designing a successful collaborative process and will depend on the nature of the issue being addressed. Membership should include not only the ‘deal makers and deal breakers’ but, ideally, a wide range of voices and perspectives on the issues under consideration. Methods to identify and recruit participants are available and should be considered at the design stage.
CAWTHRON INSTITUTE | REPORT NO. 2353 JULY 2013
v
Careful consideration should also be given to the provision of technical science information to a CSG, when it will be required, and how it will be communicated during the collaborative process. This should lead to identifying, scoping and resourcing the required studies, so that information will be ready when needed. The CSG itself should also be involved in this process, so it receives information it has requested rather than information that the council thinks it should have. Technical experts often do not participate as stakeholders but rather attend a CSG as needed to present or explain scientific information or answer questions. Technical experts need to have a trusting relationship with the members of the CSG so that they feel confident enough to engage with stakeholders in a “free and frank” manner on matters that can be contentious. Ways in which this trust can be developed should be addressed at the design stage of the process.
Monitoring and indicators In a framework where values are prioritised through collaborative governance to identify agreed management objectives and strategies, monitoring both informs this process and provides the data for on-going evaluation of policy effectiveness. The purpose of monitoring is to improve the system being monitored. Sustainability assessment is a useful way of understanding the task of monitoring, and can be seen as being either retrospective — measuring what has happened so as to inform future decisions — or prospective — assessing a proposed course of action for its likely effects on a system of interest. Both of these involve the use of indicators, the basic building blocks of a monitoring system, which are sometimes integrated into one or more indices that provide an overall assessment. Indicators are often presented as fact, but they are actually social constructs and disagreements can arise regarding their meaning. To avoid this, credible methods and data need to be used when developing an indicator set, e.g. through a process of public participation. An expert-driven ‘top-down’ approach may have limited legitimacy within a community, while a ‘bottom-up’ approach can have a problem with technical credibility of the indicators, so an element of both is required. The Bellagio SusTainability Assessment and Measurement Principles provide one model for approaching this task and have been used by the OECD. The Mauri Model presented in Section 4.3.1 is an example of what a holistic and culturally derived indicator set could look like. The hallmark of a complex adaptive system is that it cannot simply be taken to pieces to understand how it works. Indicators can contribute to understanding by measuring the different aspects of a complex system, but indicators are better seen as providing a focus around which different stakeholders can come together and discuss progress towards management objectives. In other words, management of complex adaptive systems lends itself to collaborative governance arrangements, involving the choice of objectives to be
CAWTHRON INSTITUTE | REPORT NO. 2353 JULY 2013
vi
monitored, the design of indicator sets for monitoring, and the discussion and interpretation of monitoring results to assess progress and revise implementation plans. The indicators themselves need to be adaptive and change over time as new information becomes available and policy decisions start to impact on a system, while being mindful of the need to also have continuity of some indicators to track change over time. Integration of freshwater and coastal management Coastal users are freshwater stakeholders, and nowhere in New Zealand is this truer than in the Auckland region, where estuaries have been adversely impacted by runoff from the multitude of small rivers, streams and stormwater channels that drain the urban, peri-urban and rural areas. Coastal users should therefore have a key role in freshwater planning processes. Coastal ecology will be an essential component of the science required to inform freshwater planning, and any collaborative process and the wider public dialogue on the freshwater and coastal management will need to be ‘joined up’. Done well, Auckland Council has an opportunity to achieve something that no other regional authority has thus far achieved: integrated management of its freshwater and coastal environments.
CAWTHRON INSTITUTE | REPORT NO. 2353 JULY 2013
vii
TABLE OF CONTENTS
1. BACKGROUND ................................................................................................................ 1 1.1. National Policy Statement on Freshwater Management ................................................................................. 1
1.2. Scope of report ............................................................................................................................................... 2
2. VALUE FRAMEWORKS ................................................................................................... 3 2.1. The emergence of freshwater values ............................................................................................................. 3
2.2. Understanding values in freshwater planning ................................................................................................. 5 2.2.1. Values as evaluative norms ...................................................................................................................... 6 2.2.2. Value as contribution towards fulfilment of an objective ............................................................................ 7 2.2.3. Value as a magnitude of preference ......................................................................................................... 8 2.2.4. Values as ways of meaning or orienting oneself to the world .................................................................. 10 2.2.5. Values as ‘things that have value or meaning’ ........................................................................................ 11 2.2.6. Recap: Five meanings of freshwater values ............................................................................................ 11
2.3. Planning for freshwater values ..................................................................................................................... 12 2.3.1. An economics approach to balancing competing values ......................................................................... 12 2.3.2. Multi-criteria approaches to assessing values ......................................................................................... 13 2.3.3. Deliberative methods ............................................................................................................................... 14
2.4. Implications for planning practice ................................................................................................................. 15
3. COLLABORATIVE GOVERNANCE METHODS ............................................................ 18 3.1. What is collaborative governance? ............................................................................................................... 19
3.2. The benefits of using collaborative processes .............................................................................................. 21
3.3. When to use a collaborative process (or when not to) .................................................................................. 22
3.4. The role of the council .................................................................................................................................. 23 3.4.1. Expert ...................................................................................................................................................... 23 3.4.2. Analyst .................................................................................................................................................... 24 3.4.3. Stakeholder ............................................................................................................................................. 24 3.4.4. Facilitator ................................................................................................................................................. 25 3.4.5. Leader ..................................................................................................................................................... 26
3.5. Designing a collaborative process — key design aspects ............................................................................ 27 3.5.1. The TANK process — a case study ........................................................................................................ 27 3.5.2. Recruitment ............................................................................................................................................. 27 3.5.3. Mandate for the process .......................................................................................................................... 30 3.5.4. Strategic timing for the process (around other planning projects) ........................................................... 30 3.5.5. Mandate of individuals ............................................................................................................................. 30
3.6. Knowledge, science and collaborative processes ........................................................................................ 31
4. MONITORING AND INDICATOR FRAMEWORKS ........................................................ 36 4.1. Sustainability assessment methodologies .................................................................................................... 36 4.1.1. Indicators and indices .............................................................................................................................. 37 4.1.2. Integrated assessments .......................................................................................................................... 37 4.1.3. Monetary valuations ................................................................................................................................ 38
4.2. Selecting appropriate indicators ................................................................................................................... 39
4.3. Measuring progress towards community outcomes ...................................................................................... 42 4.3.1. The Mauri Model ..................................................................................................................................... 43
4.4. Relating environmental indicators to catchment decision making................................................................. 45
5. CONCLUSIONS .............................................................................................................. 47 5.1. The context of values ................................................................................................................................... 47
CAWTHRON INSTITUTE | REPORT NO. 2353 JULY 2013
viii
5.2. Collaborative governance ............................................................................................................................. 47
5.3. Monitoring and indicators ............................................................................................................................. 48
5.4. Integrating freshwater and coastal management .......................................................................................... 49
6. REFERENCES ............................................................................................................... 50
7. APPENDIX ...................................................................................................................... 58
LIST OF FIGURES
Figure 1. The International Association for Public Participation spectrum showing increasing levels of public participation from left to right. ................................................................... 19
Figure 2. Sea Sketch GIS map for part of the Hauraki Gulf Marine Park. ....................................... 35 Figure 3. Framework for sustainability assessment tools. ............................................................... 39 Figure 4. Conceptual model of Bellagio SusTainability Assessment and Measurement
Principles. .......................................................................................................................... 41 Figure 5. Representation of the Mauri Model. .................................................................................. 43
LIST OF TABLES
Table 1. General indicator characteristics....................................................................................... 42
LIST OF APPENDICES
Appendix 1. A spatial decision-support system. ................................................................................... 58
CAWTHRON INSTITUTE | REPORT NO. 2353 JULY 2013
1
1. BACKGROUND
Freshwater management has been a major focus of environmental policy in New Zealand since at least 2000 (Ministry for the Environment 2000 ). In 2003 the government launched a programme of action for sustainable development with freshwater quality and allocation as one of the government’s top five priorities (New Zealand Government 2003). The programme gave further impetus to work already underway to address concerns that “in some areas, demand cannot be met at some times of the year” and “the quality of many lowland streams, lakes, groundwaters and wetlands in areas of intensive land use continues to fall below acceptable standards” (ibid. pp.13-14). A wide-ranging programme of work has continued since then, with a number of reports and policy proposals being considered1. Meanwhile, regional councils and unitary authorities have continued to address freshwater management challenges. Environment Canterbury has the most ambitious programme of work underway, though a number of other councils have also been actively exploring, and implementing, new approaches. Since its enactment in 1991, the Resource Management Act (RMA) has been interpreted by practitioners and interested parties as focusing on addressing adverse environmental effects of activities rather than specifying what activities were allowed (Ministry for the Environment 1994; Upton 1996). Accordingly the task of local authorities responsible for freshwater management was to translate the generic, qualitative ‘bottom lines’ described in the RMA (e.g. “safeguarding the life-supporting capacity of air, water, soil and ecosystems”) into quantitative, management-relevant policies and rules. Increasing pressure on freshwater systems, worsening water quality and the slow progress in establishing quantitative limits finally led the government to take stronger action. A new government, elected in 2008, announced its New Start for Fresh Water strategy in 2009, including the establishment of a multi-stakeholder process known as the Land and Water Forum (LaWF), which produced its first report in 2010 and recommended stronger government direction on freshwater management.2
1.1. National Policy Statement on Freshwater Management
As described above, the need for improved freshwater management frameworks has been recognised by central government for several years. In 2011, the Government released a National Policy Statement on Freshwater Management (NPSFM)3 to
1 See for example http://www.mfe.govt.nz/issues/water/prog-action/ and
http://www.mfe.govt.nz/issues/water/freshwater/new-start-fresh-water.html. 2 http://www.mfe.govt.nz/issues/water/freshwater/fresh-start-for-fresh-water/index.html 3In 2008, the previous government also released a proposed national environmental standard (NES) for setting in-
stream flows and levels to protect aquatic ecosystems, including default values for water bodies for which regional councils have not set them. Public submissions were received on the proposal, but it has been on hold since the change of government in 2008 and its future remains uncertain.
CAWTHRON INSTITUTE | REPORT NO. 2353 JULY 2013
2
provide direction on the outcomes it sought and the approaches it wanted councils to use.
As stated in its preamble, the NPSFM aims to “direct local government to manage water in an integrated and sustainable way, while providing for economic growth within set water quantity and quality limits” (New Zealand Government 2011).
The NPSFM refers to the diverse values associated with freshwater systems in New Zealand and recognises the need for clear objectives and limits:
Setting enforceable quality and quantity limits is a key purpose of this national policy statement. This is a fundamental step to achieving environmental outcomes and creating the necessary incentives to use fresh water efficiently, while providing certainty for investment (New Zealand Government 2011).
The NPSFM directs councils to set objectives and catchment-wide limits for abstractions and discharges for all freshwater bodies in their respective regions by 2030. Councils must also implement methods to address over-allocation and to ensure limits are achieved. Allocation refers not just to water abstraction but also to the ability of aquatic systems to tolerate or assimilate contaminants. The government also issued an NPS on Renewable Electricity Generation in 2011. This NPS directs RMA decision-makers to “recognise and provide for the national significance of renewable electricity generation activities”. It directs councils to provide for these activities where applicable within their regions by making any necessary changes to their policies and plans by mid-2013. It does not, however, require that councils give priority to hydro-electric power generation over other uses, leaving that for councils to decide in light of the two NPSs and the RMA more generally. This means regional councils still face the challenge of identifying, assessing and managing for diverse values. Collaborative processes have been recommended by the LaWF as a means of community decision making about these diverse and often competing values, and the latest RMA and freshwater reforms from central government include proposed changes to encourage this approach. To support the process of limit-setting and to evaluate its effectiveness in delivering on the community’s values, a robust framework for monitoring is required.
1.2. Scope of report
This report begins with an analysis of the methodologies to integrate diverse values into the Auckland Unitary Plan in order to give effect to the NPSFM. The report then provides a synopsis of the science of collaborative governance, community
CAWTHRON INSTITUTE | REPORT NO. 2353 JULY 2013
3
engagement and participation and discusses the interface between traditional western science and the community particularly with respect to freshwater governance. The last section of the report recommends methodologies for relating environmental indicators to catchment management decision making and makes recommendations on how to measure progress towards achieving community outcomes for freshwater.
2. VALUE FRAMEWORKS
2.1. The emergence of freshwater values
The concepts of value and values are gaining prominence in freshwater planning. In establishing its approach to freshwater management, the New Zealand Government stated that “Outcomes will only be achieved by considering and making trade-offs between values, within a decision-making framework that sets limits and bottom lines”4. The preamble to the NPSFM provides examples of “nationally important freshwater values” (see Box 1) and, among other statements about values, says the following:
To respond effectively to these challenges and issues we need to have a good understanding of our freshwater resources, the threats to them and provide a management framework that enables water to contribute both to New Zealand’s economic growth and environmental integrity and provides for the values that are important to New Zealanders [emphasis added].
More recently, the Government’s proposed freshwater reforms described a proposal for a national objectives framework for water management, listing a number of freshwater ‘values’ and the biophysical attributes that councils will be expected to manage to provide for those values (Ministry for the Environment 2013c). Those reforms, as well as proposed RMA reforms (Ministry for the Environment 2013b) and a government project to develop guidance for analysis of regional plans (Ministry for the Environment 2013a), all indicate a stronger emphasis on the consistency of policy development approaches between regions and more explicit consideration of trade-offs (see for example, Stage 6 of the freshwater management process depicted in (Ministry for the Environment 2013c)).
4 From NZ Government Cabinet paper, June 2009 accessed at
http://www.mfe.govt.nz/issues/water/freshwater/new-start-for-fresh-water-paper.html
CAWTHRON INSTITUTE | REPORT NO. 2353 JULY 2013
4
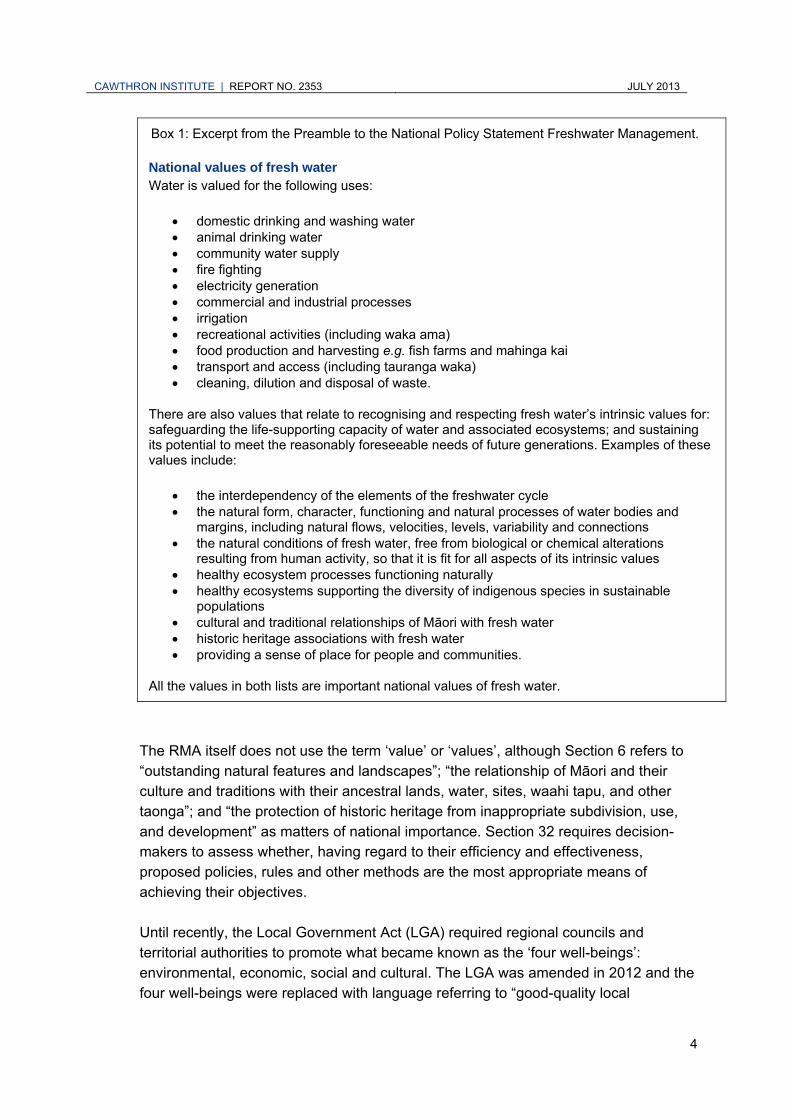
Box 1: Excerpt from the Preamble to the National Policy Statement Freshwater Management. National values of fresh water Water is valued for the following uses:
domestic drinking and washing water animal drinking water community water supply fire fighting electricity generation commercial and industrial processes irrigation recreational activities (including waka ama) food production and harvesting e.g. fish farms and mahinga kai transport and access (including tauranga waka) cleaning, dilution and disposal of waste.
There are also values that relate to recognising and respecting fresh water’s intrinsic values for: safeguarding the life-supporting capacity of water and associated ecosystems; and sustaining its potential to meet the reasonably foreseeable needs of future generations. Examples of these values include:
the interdependency of the elements of the freshwater cycle the natural form, character, functioning and natural processes of water bodies and
margins, including natural flows, velocities, levels, variability and connections the natural conditions of fresh water, free from biological or chemical alterations
resulting from human activity, so that it is fit for all aspects of its intrinsic values healthy ecosystem processes functioning naturally healthy ecosystems supporting the diversity of indigenous species in sustainable
populations cultural and traditional relationships of Māori with fresh water historic heritage associations with fresh water providing a sense of place for people and communities.
All the values in both lists are important national values of fresh water.
The RMA itself does not use the term ‘value’ or ‘values’, although Section 6 refers to “outstanding natural features and landscapes”; “the relationship of Māori and their culture and traditions with their ancestral lands, water, sites, waahi tapu, and other taonga”; and “the protection of historic heritage from inappropriate subdivision, use, and development” as matters of national importance. Section 32 requires decision-makers to assess whether, having regard to their efficiency and effectiveness, proposed policies, rules and other methods are the most appropriate means of achieving their objectives. Until recently, the Local Government Act (LGA) required regional councils and territorial authorities to promote what became known as the ‘four well-beings’: environmental, economic, social and cultural. The LGA was amended in 2012 and the four well-beings were replaced with language referring to “good-quality local
CAWTHRON INSTITUTE | REPORT NO. 2353 JULY 2013
5
infrastructure, local public services, and performance of regulatory functions.” However, the construct of environmental, economic, social and cultural values remains firmly embedded in the discourse of planning in New Zealand. For example, a new report prepared for Auckland Council says that efficient allocation of fresh water requires knowing how “water values… are related to the four well-beings (economic, social, environmental and cultural)…” (Rohani 2013). This mirrors the requirements of Section 5 of the RMA to enable people and communities to provide for their “social, economic, and cultural well-being” while satisfying the environmental tests in that section. This discourse suggests multiple and diverse attempts to identify, document and in some cases measure freshwater value and values. Yet there has been no clear statement about what these terms mean or how they should be assessed or deployed for freshwater planning purposes. What is the boundary between social and economic values? Is enhancing income for socially deprived families a social or economic value? Is swimming an environmental, social or cultural value? Is swimming by tourists an economic value? Are cultural values distinct from social values? Or does ‘cultural’ refer only to values held by Māori? How do we define, identify, elicit, measure and compare these values, as current policy direction from central government suggests that regional councils must do? Is it possible to understand an entire river or catchment through disaggregation and scoring of individual ‘freshwater values’? Even more fundamentally, are ‘values’ something that can be measured — implying that they can be clearly defined, are relatively stable and thus can be used as a basis for decision making — or are they essentially based in context and therefore only able to be understood as human expression? This chapter briefly summarises the diverse meanings that ‘value’ and ‘values’ can take and suggests an approach to values for regional authorities undertaking freshwater planning.
2.2. Understanding values in freshwater planning
From the international literature and from our own research (e.g. Sinner et al. 2012), we have identified four distinct meanings of ‘value’ and ‘values’ of relevance to this project and a fifth meaning that conflates the second, third and fourth definitions.
CAWTHRON INSTITUTE | REPORT NO. 2353 JULY 2013
6
These are:
1. Values as evaluative norms or guides to choice
2. Value as a contribution towards fulfilment of an objective
3. Value as a magnitude of preference
4. Values as ways of meaning or orienting oneself to the world
5. Values as things that have value or meaning.
After explaining each of these meanings, we examine their implications and relevance in the New Zealand freshwater planning context.
2.2.1. Values as evaluative norms
In some contexts, freshwater values refer to general principles that act as guides to what is ‘good’. Akin to Brown’s (1984) ‘held values’, these values refer not to specific places, things or activities but rather refer to human ethics generally; they represent “an enduring conception of the preferable”. These values may be called upon when one faces a difficult situation or decision, or as evidence to support a desired outcome when faced with competing values or interests, within oneself or with another person or group. Equity is a value of this type; others include efficiency, kaitiakitanga (stewardship), and manaakitanga (caring for others), to name a few. The Auckland Plan has several guiding principles that express values as evaluative norms, for example “act fairly” and “value Te Ao Maori”.5 These values are important not just as principles to apply as criteria for decision making, but also because they can carry deep cultural meaning for some people, whose personal identity may be offended if these values are not respected. It is not always possible to adhere to everyone’s normative (held) values, of course — an outcome that one person sees as efficient might be incompatible with another’s views about equity — but people can disagree respectfully if they are given an equal voice to express their values. The recent debate in New Zealand over gay marriage comes to mind as an example. Values as evaluative norms are not typically documented in freshwater planning, but are in some cases reflected in statutory guidance, e.g. Section 7 of the RMA directs decision-makers to have particular regard to “kaitiakitanga” and “the efficient use and development of natural resources”, among other things. These statements provide direction to councils and other decision-makers concerning the criteria to be used when assessing possible objectives and policy and methods to achieve them. Apart from this, it can also be helpful in planning processes to recognise that stakeholder responses to proposed change can be driven by people’s normative values as well as concern about possible changes to more concrete ‘value’, as described next.
5 http://theplan.theaucklandplan.govt.nz/the-journey-to-2040/
CAWTHRON INSTITUTE | REPORT NO. 2353 JULY 2013
7
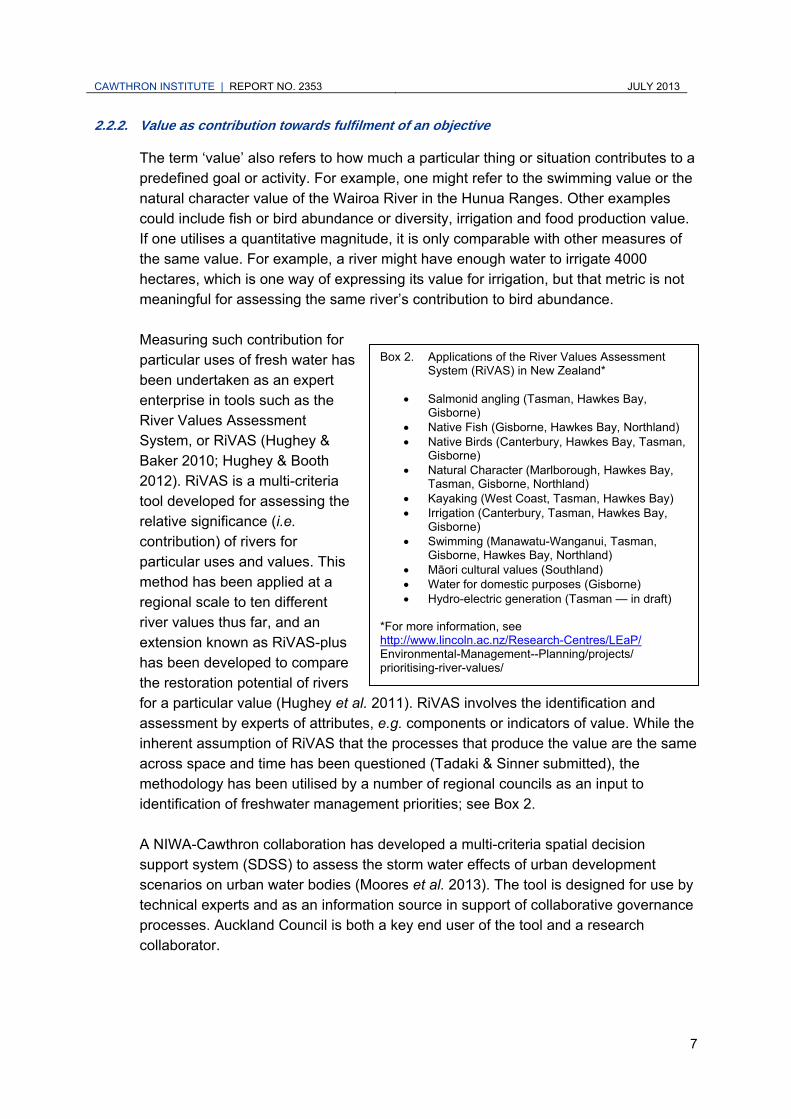
Box 2. Applications of the River Values Assessment System (RiVAS) in New Zealand*
Salmonid angling (Tasman, Hawkes Bay,
Gisborne) Native Fish (Gisborne, Hawkes Bay, Northland) Native Birds (Canterbury, Hawkes Bay, Tasman,
Gisborne) Natural Character (Marlborough, Hawkes Bay,
Tasman, Gisborne, Northland) Kayaking (West Coast, Tasman, Hawkes Bay) Irrigation (Canterbury, Tasman, Hawkes Bay,
Gisborne) Swimming (Manawatu-Wanganui, Tasman,
Gisborne, Hawkes Bay, Northland) Māori cultural values (Southland) Water for domestic purposes (Gisborne) Hydro-electric generation (Tasman — in draft)
*For more information, see http://www.lincoln.ac.nz/Research-Centres/LEaP/ Environmental-Management--Planning/projects/ prioritising-river-values/
2.2.2. Value as contribution towards fulfilment of an objective
The term ‘value’ also refers to how much a particular thing or situation contributes to a predefined goal or activity. For example, one might refer to the swimming value or the natural character value of the Wairoa River in the Hunua Ranges. Other examples could include fish or bird abundance or diversity, irrigation and food production value. If one utilises a quantitative magnitude, it is only comparable with other measures of the same value. For example, a river might have enough water to irrigate 4000 hectares, which is one way of expressing its value for irrigation, but that metric is not meaningful for assessing the same river’s contribution to bird abundance. Measuring such contribution for particular uses of fresh water has been undertaken as an expert enterprise in tools such as the River Values Assessment System, or RiVAS (Hughey & Baker 2010; Hughey & Booth 2012). RiVAS is a multi-criteria tool developed for assessing the relative significance (i.e. contribution) of rivers for particular uses and values. This method has been applied at a regional scale to ten different river values thus far, and an extension known as RiVAS-plus has been developed to compare the restoration potential of rivers for a particular value (Hughey et al. 2011). RiVAS involves the identification and assessment by experts of attributes, e.g. components or indicators of value. While the inherent assumption of RiVAS that the processes that produce the value are the same across space and time has been questioned (Tadaki & Sinner submitted), the methodology has been utilised by a number of regional councils as an input to identification of freshwater management priorities; see Box 2. A NIWA-Cawthron collaboration has developed a multi-criteria spatial decision support system (SDSS) to assess the storm water effects of urban development scenarios on urban water bodies (Moores et al. 2013). The tool is designed for use by technical experts and as an information source in support of collaborative governance processes. Auckland Council is both a key end user of the tool and a research collaborator.
CAWTHRON INSTITUTE | REPORT NO. 2353 JULY 2013
8
The SDSS uses attributes, indices and indicators to assess and report effects on the human values associated with estuaries and fresh water bodies, corresponding to the four well-beings and how these would change under different development scenarios. To date, the construction of indicators for three of the four well-beings is well advanced, with work on a cultural index underway. The indicators represent the contributions of a development scenario to each of the four well-beings in terms of its effects on urban water bodies. Further detail is provided in the Appendix. The concept of ecosystem services has also gained prominence in recent years as a means of highlighting the full range of benefits that humans receive from the natural world. The Auckland Plan notes “Auckland’s environment and its people are intertwined. People depend on the life-supporting services it provides”6. In broad terms, ecosystems services research attempts to estimate the contribution that a given area or ecosystem makes to a particular need of human communities. Kumar et al. (2010) provide a comprehensive summary of these concepts and some of the challenges of implementing them in practice. This includes the estimation of monetary values for these ecosystem services in an attempt to make them comparable with goods and services that are traded in market economies, in the hope that decision-makers would give environmental protection greater consideration if its contribution is presented in monetary terms. This monetary valuation draws upon the third meaning of ‘value’, to which we now turn.
2.2.3. Value as a magnitude of preference
The third concept of value is perhaps the most familiar to planners and policy analysts, for it is deployed in cost-benefit analysis, welfare economics and other frameworks based in utilitarian ethics. How much do children value swimming in their local stream? How much would residents be willing to pay to restore the Hoteo River? This concept, equivalent to ‘assigned value’ as proposed by Brown (1984), refers to a magnitude that is comparable between individuals, and might be as simple as ‘a great deal’ and ‘not at all’, or it might be quantified in monetary terms. If the same units are chosen, and especially if they are quantitative, then benefits and costs can be summed across all persons and values and decisions can seek to maximise or optimise the sum of individual preferences. This is usually the implicit if not explicit aim of cost-benefit analysis, even though economic theory cautions against assuming that a dollar has equal utility for all people (Sinner et al. 2005). Economists have a variety of methods for estimating value in this sense. Many use choice modelling for non-market valuation of environmental goods and services, although other tools such as contingent valuation, hedonic pricing and the travel-cost method are still used in specific situations7. There have been several applications of
6 http://theplan.theaucklandplan.govt.nz/aucklands-environment/ 7 See Rohani (2013) for a summary of these tools.
CAWTHRON INSTITUTE | REPORT NO. 2353 JULY 2013
9
choice modelling in New Zealand (e.g. see Batstone & Sinner 2010; Bell et al. 2012; Kerr & Swaffield 2012). At one level, choice modelling and other survey-based methods democratise the process of measurement because focus groups can be used to define the attributes that matter, and a random sample drawn from the public, not experts, is surveyed to assess the contribution that each attribute makes. Nonetheless, the survey methodologies involves expert judgement in designing the survey instrument and advanced statistics to analyse the data, such that stakeholders not involved in the design may question the results (Sinner et al. 2012). More fundamentally, the way people respond to questions about value depends on the context and bundles of meanings that extend beyond the narrow choices provided, making it difficult to rely on survey methods (or expert judgement, for that matter) as an ’objective’ assessment of value. There have been numerous critiques of this approach to value, too many to describe here (but see Spash 2008; Gregory et al. 2012b). Suffice to say that the strength of a person’s preference for something is likely to be specific to a particular context, especially when the thing being valued is not a marketed commodity. When goods and services are bought and sold, these transactions provide social signals of value, or monetary worth, and the greater the number of transactions and the uniformity of the product, the less likely we are to question a quantum of value so determined. Compare this with the bargaining that occurs over the price of a house, every one of which is unique and is sold only infrequently. Now consider places such as a river reach used for kayaking, an estuary where shellfish are gathered for hosting visitors to a marae, or an aquifer that provides irrigation for a family orchard. While one might be able to assign a monetary value to a kayaking trip, a basket of shellfish or a crate of fruit, such values would not do justice to the quality and specificity of meaning of those places for those people. And the value those people might assign to such things, if they are willing to do so at all, is likely to depend on how they are asked (McNeil et al. 1982; Kahnemann & Tversky 2000). In response to these issues, a number of practitioners have added a deliberative component to valuation studies, but these attempts at “deliberative monetary valuation” (DMV) have lacked a consistent theoretical basis. Rather than resolving challenges to non-market valuation techniques, many DMV studies have seen practitioners using deliberative methods to manipulate responses to fit their models. Others suggest that a more appropriate conclusion from the difficulties encountered by these studies is that there are multiple ways that environmental values can be conceptualised and articulated, and not all can be summarised in a single monetary value (Spash 2008; Lo & Spash 2012). This critique is not meant to invalidate a monetary construction of value, or more generally the concept of value as a magnitude of preference. Clearly, these are meanings of value that must be recognised in freshwater planning. Markets provide a
CAWTHRON INSTITUTE | REPORT NO. 2353 JULY 2013
10
robust mechanism for assigning a value to goods and services that are actively traded, and these are important considerations for decision-making about how we use and enjoy the natural environment. Likewise, some ecosystem services can be valued using techniques that are reasonably robust – such as estimating the marginal cost of substituting for a good or service that nature currently provides for free, e.g. treating drinking water if a natural water supply becomes contaminated. But even in this example, there are aspects of the value of an untreated water supply that exhibit the characteristics described above — unbounded, unstable, dependent upon context and therefore not amenable to quantification. In some cases, accounting for the types of value that can be quantified in monetary terms will suggest a clear direction for decision-makers considering alternative management scenarios. We simply want to highlight here that a monetary or quantified construction of value must not be seen as the only way to understand what people mean by freshwater values.
2.2.4. Values as ways of meaning or orienting oneself to the world
This brings us to the fourth concept of values with relevance for freshwater planning, that of values as ways that fresh water and freshwater systems matter. Following Mattson et al. (2012) and O’Neill et al. (2008), these values are the ways that people make sense of and find meaning in the world. They refer to how particular people interact with and relate to water within a place and time. The notion of home, for instance, reflects a bundle of ways in which a particular environment matters to someone. In Māori, the concept of tūrangawaewae represents the place where one feels empowered and connected to one’s ancestors; one’s home, foundation, and place in the world.8 Emphasis here is on the meaning itself, as an association between a particular person and a particular environment, which cannot be simplified or generalised into a magnitude, contribution or normative guideline that is comparable or transferable to another location. Values in this sense can carry a multiplicity of experiences and meanings — they can refer to a history of interactions over time, can be unique to a place or a constellation of places and can allow for memories of happiness, issues of injustice or other matters that are identified with a place. Identifying such values can therefore be time-consuming and subjective, because every individual will have a different history and therefore different meanings. But recognising ‘ways that matter’ allows people to speak for themselves, which may open up new ways of understanding value unanticipated by the analyst at the outset.
8 http://www.teara.govt.nz/en/papatuanuku-the-land/5
CAWTHRON INSTITUTE | REPORT NO. 2353 JULY 2013
11
This definition also recognises that discussions about the ways that freshwater systems matter often encompass a complex mix of the first three definitions, as people explore and construct meaning through dialogue with others.
2.2.5. Values as ‘things that have value or meaning’
Finally, there is yet another way that people commonly refer to freshwater values: as things or places that ‘have value’ or provide meaning as defined in one of the other concepts. This includes, but is not limited to, what are referred to as uses of water. Hence we have swimming, angling, native fish and irrigation (among others) described as ‘freshwater values’ for the purpose of RiVAS (Hughey & Baker, 2010), and “cultural and traditional relationships of Māori with fresh water” cited as a value in the NPSFM. This terminology is not so much an additional concept as a shorthand way of referring to any or all of the second, third and fourth meanings described above. This usage of ‘freshwater values’ has been employed by Tasman District Council in Schedule 30 of its Tasman Resource Management Plan (discussed in Sinner et al. 2012), in a draft report by an Auckland Council staff member (McFarlane 2013) and by other councils and agencies. This definition, which conflates other meanings, would seem to create the potential for considerable confusion. However, Sinner et al. (2012) found that Tasman stakeholders could have constructive conversations about freshwater values without being precise about which definition is being used, because the meaning was usually clear from the context. The frequent usage of this shorthand definition in New Zealand freshwater planning suggests that this applies more widely as well.
2.2.6. Recap: Five meanings of freshwater values
Thus, we have five ways of understanding value and values as expressed by people interested in freshwater systems and as employed in freshwater planning:
1. Values as evaluative norms can provide criteria (e.g. equity, efficiency, kaitiakitanga) for evaluating alternatives and can help us to understand the motivations and concerns of community members.
2. Value as a contribution tells us how much something contributes to an objective or activity, but without reference to the importance of the objective or activity relative to other objectives or activities.
3. The notion of comparability is inherent in the third meaning, value as a magnitude of preference, which provides a basis for comparing objects that may be similar or quite different.
CAWTHRON INSTITUTE | REPORT NO. 2353 JULY 2013
12
4. The fourth notion of values, as ‘ways that matter’ represents the ways that people find meaning in and make sense of the world through a series of interactions over time, which may be difficult to reduce to one of the other three meanings.
5. And, fifth, we have freshwater values defined as things about, or uses or aspects of, freshwater that have value or meaning, thus conflating the second, third and fourth definitions. This fifth definition is the one that is commonly employed when agencies or stakeholders create lists of values or frameworks for accounting for freshwater values.
These ways of understanding values in freshwater management are useful in understanding the views that stakeholders express in various settings and for clarifying the context of tools and approaches like RiVAS and choice modelling, as many of these define ‘values’ differently. These multiple meanings also suggest that creating a master list of values for any freshwater body or catchment may not be possible or desirable.
2.3. Planning for freshwater values
Broadly speaking, councils and stakeholders seek information on ‘freshwater values’ in order to prioritise competing management objectives, whether in a plan-making process or consideration of a resource consent application. In some cases, the requirements of RMA Section 5 will determine that a certain value must be sustained or provided for, but more often than not there is ambiguity or a need to achieve an overall balance amongst values or objectives that cannot be fully achieved simultaneously. Even if not explicit, then, decisions about freshwater management objectives inevitably involve some determination of the relative significance or importance to be given to different values. In this section we briefly consider alternative ways of approaching this challenge and describe the strengths and limitations of each.
2.3.1. An economics approach to balancing competing values
The discipline of economics provides a framework for thinking about this task, based on the definition of value as a comparable magnitude of preference. This is commonly undertaken using a Total Economic Value (TEV) framework, as explained by Rohani (2013), in which the analyst attempts to define all relevant aspects of value and, where possible, estimates or assigns monetary values to represent the relative significance of each. An example of the application of this framework can be found in Sharp and Kerr (2005), although they stopped short of estimating monetary values for all components.
CAWTHRON INSTITUTE | REPORT NO. 2353 JULY 2013
13
In principle, the TEV framework offers a tidy, logically coherent approach to considering freshwater values and therefore choosing between alternative management objectives. In practice, there are a number of limitations, as described in Section 2.2.3. Foremost amongst these is the fact that, in highly contested freshwater planning situations, values are highly contextual and not conducive to being reduced to categories for ‘objective’ elicitation and measurement. In a case study in Tasman district, Sinner et al. (2012) found that stakeholders challenged the results of a choice modelling survey (designed to estimate non-market value of rivers) on the basis that colours, wording and formatting of the survey form were likely to influence responses, and represented only a subset of stakeholders’ values. And, more fundamentally, many people resist the proposition that all values can be reduced and compared in monetary terms as a basis for making decisions about the environment. Thus, TEV and related economic tools can be useful for accounting for aspects of value that are well-bounded (and thus not prone to over-lapping definitions and double-counting) and reasonably stable (and thus not dependent on the policy context or how the question is asked). In contested freshwater environments, however, we would not recommend attempting to account quantitatively for all aspects of ‘total value’, because for many of the things that are important to people, these two requirements are not met.
2.3.2. Multi-criteria approaches to assessing values
Other researchers have steered away from an economics approach that assumes all types of values can be compared using a single metric, usually monetary, and have instead using multi-criteria methods to assess freshwater values. The RiVAS methodology described in Section 2.2.2 is an example of this; McFarlane (2013) describes many others. Using RiVAS, an expert group assesses rivers within a region or other geographic area for their significance for a particular value, which requires weighting the importance of the various attributes of that value as identified by the expert group (Hughey & Baker 2010). However, RiVAS does not provide for comparing the significance of one value (e.g. native fish or natural character) with another (e.g. tangata whenua values or irrigation). If a river is assessed to have ‘nationally significant’ native fish and ‘regionally significant’ irrigation, it cannot be said that native fish should take priority as a management objective over irrigation, because these labels are not cross-calibrated in any way. To address this, some other multi-criteria tools provide for explicit weighting of different objectives, so that an overall score can be calculated and a preferred option identified (see e.g. Lennox et al. 2011). While intuitively appealing, this simply transfers a debate over competing values into a debate over weights, and does not actually provide a scientifically robust method of comparing values. It also reduces the
CAWTHRON INSTITUTE | REPORT NO. 2353 JULY 2013
14
complex and perhaps diverse notions of ‘value’ being measured into a single (and perhaps contestable) representation by a few indicators (Tadaki & Sinner, submitted). For example, in a RiVAS assessment of angling, some stakeholders contested the inclusion of ‘the proportion of international anglers’ in the significance and ranking of angling value of a river reach (Sinner et al. 2012). Far more than being technical decisions, the creation and choices of criteria and indicators are political in the sense that they promote certain ideas about what is desirable for a community.
2.3.3. Deliberative methods
The limitations of existing methods and the increasing recognition that values can be highly contextual have led many researchers to investigate deliberative methods for working with competing values. Collaborative processes as envisaged by the LaWF and the New Zealand Government’s proposed freshwater reforms (Ministry for the Environment 2013c) are the most recent example of this in New Zealand, but are by no means the only example. In Australia, researchers have combined multi-criteria analysis with deliberative methods (Mooney et al. 2012), and McFarlane (2013) provides other examples. Gregory et al. (2012b) provide a comprehensive and useful guide to what they call ‘structured decision making’. In this process a group first identifies objectives and then criteria for assessing how well policy options deliver on these. This is followed by iterative deliberation over ways to improve the policy approach to achieve better outcomes across the full range of objectives. In similar ways, tools such as ‘mediated modelling’ (van den Belt 2004; van den Belt et al. 2012) and Bayesian Belief Networks (Quinn et al. 2013) are being deployed as ways to facilitate shared understanding of social-ecological systems and build a platform for stakeholder deliberation and, it is hoped, consensus decision making. Another approach is to develop one or more visions or scenarios that people can assess for consistency with their own values and meanings (Sinner et al. 2012). In the sense that people will use heuristics to assess visions in terms of their own values and interests, this does not avoid reductionism except that it allows every person to use their own subjective attributes and criteria, and at least encourages a more holistic perspective. The increasing prominence given to values and to collaborative process is part of a wider recognition that science alone cannot answer what are fundamentally political questions about complex systems. A paradigm of deliberative democracy and adaptive governance is gradually replacing the paradigm of ‘scientific management’ that has dominated natural resource management and policy for the last half-century (Brunner & Steelman, 2005; Fenemor et al. 2011; Healy, 2010; Innes & Booher, 2010).
CAWTHRON INSTITUTE | REPORT NO. 2353 JULY 2013
15
These deliberative methods can be seen as grounded in Habermas’ concept of ‘communicative rationality’, which identified the conditions under which the results of deliberation can be accepted as rational, even if the conditions represent an ideal to be aimed at rather than something that can be perfectly achieved (Innes & Booher 2010). However, Foucault, another philosopher of the same period, argued against application of Habermas’ approach to public policy, on the basis that political power is always present and will shape and perhaps capture any attempt at deliberative democracy (Flyvbjerg 1998). We return to this dilemma below.
2.4. Implications for planning practice
For the purposes of freshwater planning, a number of considerations emerge from this discussion of ways of understanding and working with concepts of value and values. First, value and values have diverse and multiple meanings. It is not necessary to insist on a common terminology for stakeholder discussions, because one can usually tell what is meant by someone from the context (Sinner et al. 2012). But when values are referred to in planning or policy documents, it is helpful to define the terms. Section 2.2 of this report provides a basis for such definitions and for thinking about and how methodologies embody particular concepts. Second, categories of ‘values’ tend to simplify complex phenomena and are often not discrete. Cultural values are not distinct from social values; social values can overlap with environmental values or economic values etc. Further, practices that lump the ‘ways that water bodies matter’ into categories highlight a key concern and tension in working with values in research and policy: to what extent can or should these relationships be considered the same, and to what extent might they be different? Is swimming a suitable category for use, or are there important differences between family, social or residential swimming? Parents with small children will enjoy different freshwater environments for swimming than teenagers. Categories such as ‘environmental values’ and ‘social values’ may be useful as prompts or reminders of different aspects of how people value or find meaning in their environment, but they are not distinct enough to be used for planning purposes. Third, while simplification through categorisation is arguably a necessary practical step in planning for catchment communities, there is also the question of what these categories mean and how they are represented (Sinner et al. 2012). When using categories in planning documents, care must be taken to acknowledge that categories are simplifications that only approximate the complexity of how people value water bodies, and that the simple act of defining categories and documenting values can privilege some uses and values over others and provoke conflict (Sinner & Tadaki 2013; Tadaki & Sinner submitted). This conflict can perhaps be reduced if values are identified, assessed and documented as part of the same planning process that
CAWTHRON INSTITUTE | REPORT NO. 2353 JULY 2013
16
determines management objectives, policies and methods so that the debate is appropriately focused on the latter rather than on what values are worthy of documenting in a regional or unitary plan. A clear rationale is needed for defining and measuring values, as well as a strategy for iteration when new categories and relevant ‘ways that water matters’ emerge. Fourth, value is constructed in context. That is to say that ‘value’ is not always bounded (well-defined), stable and hence measurable, as certain methods used in economics tend to assume. Rather, for most aspects of the environment, people formulate their feelings about a place as a result of experiences over time, and how these feelings manifest depends not only on those experiences but other context-specific matters. This makes measurement of value problematic, especially for those aspects of value that are not bought and sold, and calls into question the robustness of attempts to prepare fully quantitative cost-benefit analyses based on Total Economic Value. Fifth, aside from these limitations, eliciting and collating information on values can be done in many ways. This work should aim, firstly, to identify the diverse ways in which freshwater matters to people. These may be categorised for purpose of summary and presentation, and for further analysis, but those doing so need to acknowledge that the categories are simplifications that will privilege some meanings over others. RIVAS, choice modelling, multi-criteria analysis and other tools that seek to measure values can be useful as ways to highlight components of value and how attributes that matter vary across space and time. RiVAS can, for example, help those involved in planning to have an indication of the range of places that are important for native fish or bird habitat, or other ‘values’, and to understand at least some of the features that make those places special so that these can be protected and perhaps enhanced. Choice modelling can similarly provide indications of how the value of a place is related to key features, and can give some indication of how much some people would be willing to pay to protect or enhance that place. Because of the potential for the context to influence the responses, especially in emotionally charged contests over planning provisions or development proposals, the results of such surveys must be interpreted with caution. Finally, deliberative democracy offers a promising way through the problem of highly contextualised values. At its most essential, democracy is about communities using deliberative and political processes to determine how to balance competing values. Collaborative governance is one way to do this, precisely because it provides a context in which values can be jointly constructed and prioritised, leading to agreed management objectives and strategies. The enduring outcome is not the decision about the intended state (i.e. the management objectives) but rather the process for managing under uncertainty, since the actual outcome will inevitably be different than intended. The concept of adaptive management recognises this reality and suggests

CAWTHRON INSTITUTE | REPORT NO. 2353 JULY 2013
17
that policy and monitoring be designed so that communities can learn from experience in order to inform future policy reviews. One of the key challenges is to be ever-mindful of the various ways that imbalances of power between different stakeholders can affect the outcomes of deliberative democracy.
CAWTHRON INSTITUTE | REPORT NO. 2353 JULY 2013
18
3. COLLABORATIVE GOVERNANCE METHODS
The second report of the Land and Water Forum (LaWF), released in April 2012, recommends that collaborative approaches be used for setting freshwater objectives and limits in regional policy statements (RPS) and regional [and unitary] plans (Land and Water Forum 2012). The LaWF expected that, if used properly, collaborative approaches will result in “faster, more efficient and more equitable” plan and policy making processes than ‘traditional’ planning processes. The LaWF also considered that collaborative processes will help to increase the quality of and commitment to planning documents, increase the agility of planning processes and streamline consent requirements for applications that are within agreed objectives. Acting on the LaWF recommendations, the New Zealand Government has proposed a series of reforms for freshwater management which include provision for collaborative planning processes in the RMA and national guidance on implementing collaborative planning processes (Ministry for the Environment 2013c). The Government sees collaboration as being:
Local government, iwi/Māori, resource users and community members working together early in the decision-making process, and sharing science and knowledge to reduce conflict and achieve wider understanding and buy-in to decisions.
Collaborative planning processes are not new. They have been used successfully overseas for more than 20 years to address natural resource management issues and there is now an extensive body of literature that outlines key design aspects needed for successful collaboration. In New Zealand the practice of collaboration between decision-makers and the public at central and local government level has not previously been undertaken in a formal and statutory manner. Whilst there are examples of elements of collaborative process occurring at the catchment level since the 1980s (e.g. Opihi, Waimea, Motueka and early Hawke’s Bay catchment planning — pers. comm. Andrew Fenemor, Landcare Research, June 2013) there is still much to be learnt. This chapter begins with an analysis of the ‘science’ of collaborative governance and includes:
A definition of collaborative governance
A synopsis of the situations where collaborative governance is likely to be most beneficial and where it is unlikely to result in successful outcomes.
This is followed by a discussion of the various roles that councils might play in collaborative processes and some of the key design aspects for the types of
CAWTHRON INSTITUTE | REPORT NO. 2353 JULY 2013
19
collaborative processes that councils are likely to be engaged in. The discussion of the key design aspects is not intended to be exhaustive, but is based primarily on our experience of a collaborative process underway in Hawke’s Bay. The chapter concludes with suggestions on how to manage the interface between science and collaborative processes and a brief comment on the use of spatial information and mapping during stakeholder engagement.
3.1. What is collaborative governance?
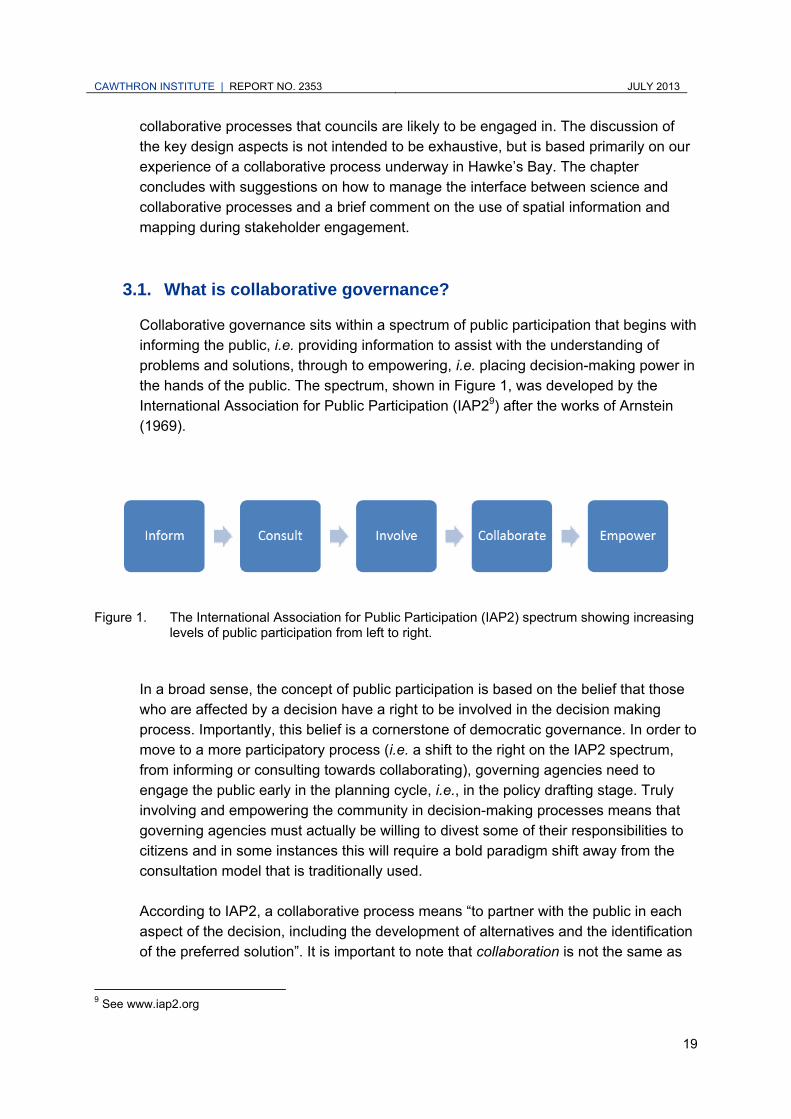
Collaborative governance sits within a spectrum of public participation that begins with informing the public, i.e. providing information to assist with the understanding of problems and solutions, through to empowering, i.e. placing decision-making power in the hands of the public. The spectrum, shown in Figure 1, was developed by the International Association for Public Participation (IAP29) after the works of Arnstein (1969).
Figure 1. The International Association for Public Participation (IAP2) spectrum showing increasing
levels of public participation from left to right. In a broad sense, the concept of public participation is based on the belief that those who are affected by a decision have a right to be involved in the decision making process. Importantly, this belief is a cornerstone of democratic governance. In order to move to a more participatory process (i.e. a shift to the right on the IAP2 spectrum, from informing or consulting towards collaborating), governing agencies need to engage the public early in the planning cycle, i.e., in the policy drafting stage. Truly involving and empowering the community in decision-making processes means that governing agencies must actually be willing to divest some of their responsibilities to citizens and in some instances this will require a bold paradigm shift away from the consultation model that is traditionally used. According to IAP2, a collaborative process means “to partner with the public in each aspect of the decision, including the development of alternatives and the identification of the preferred solution”. It is important to note that collaboration is not the same as
9 See www.iap2.org
CAWTHRON INSTITUTE | REPORT NO. 2353 JULY 2013
20
consultation which is defined by the IAP2 as “to obtain public feedback on analysis, alternatives and/or decisions. This differentiation is important because in New Zealand most resource management practitioners are familiar with consultative processes (because they are required under the RMA and the LGA) but are less familiar (or not familiar at all) with collaborative processes. Collaborative governance involves public organisations engaging with stakeholders in collective decision-making processes in a formal, consensus-oriented and deliberative way, with aims to make or implement public policy or manage public programmes or assets (Ansell & Gash 2007). Emerson et al (2012 p 2) define collaborative governance broadly as “the processes and structures of public policy decision making and management that engage people constructively across the boundaries of public agencies, levels of government, and/or the public, private and civic spheres in order to carry out a public purpose that could not otherwise be accomplished.” Ansell and Gash (2007) set out six criteria that, according to them, characterise collaborative governance:
1. The forum is initiated by public agencies or institutions
2. Participants include non-state actors
3. Participants engage directly in decision making and are not merely “consulted”
4. The forum is organised and meets collectively
5. The forum aims to make decisions by consensus (even if consensus is not achieved in practice)
6. The focus of collaboration is on public policy or public management.
Whilst we agree in principle with these criteria, we argue that collaborative forums do not need to be initiated only by public agencies or institutions, i.e. we believe they can be community-driven. For example, the Guardians of Fiordland were formed when stakeholders in the Fiordland area lobbied both local and central government to take action to protect Fiordland’s marine area from adverse effects associated with increasing human use of the natural environment (Evans & O'Brien 2013). In the Tasman region the Waimea Community Dam Proposal has been initiated and developed by the Waimea Water Augmentation Committee (WWAC), a voluntary collaborative group comprising representation from irrigators, iwi, the Department of Conservation (DOC), Tasman District Council, Nelson City Council and Fish & Game NZ. The WWAC was initiated by irrigators who were part of a water user group who then recruited other representatives to the forum, including the representatives from the local councils (pers. comm. Joseph Thomas, Tasman District Council, June 2013).
CAWTHRON INSTITUTE | REPORT NO. 2353 JULY 2013
21
3.2. The benefits of using collaborative processes
The Government is proposing to amend the RMA to provide a collaborative planning process that councils may choose when preparing, changing and reviewing freshwater policy statements and plans (Ministry for the Environment 2013c). If this reform is adopted councils will have a choice to use either the existing process (Schedule 1 of the RMA) or the proposed new collaborative planning model. This will mean that councils will need to consider the benefits of using collaborative processes over the traditional Schedule 1 approach. Schedule 1 of the RMA describes the process a council must follow in preparation of a proposed policy statement or plan. Councils are required to consult with the Minister for the Environment and other ministers of the Crown who may be affected by the policy statement or plan, local authorities, tangata whenua and any customary marine title group in the area. Councils may consult anyone else during the preparation of a proposed policy statement or plan, but they are not required to do so. By choosing to use the collaborative planning process, councils will be agreeing to partner with communities from the beginning of the process to develop options and solutions jointly. The question that a council might ask is, what are the benefits of using a collaborative process over the status quo, i.e. which process is likely to be more effective (i.e. produce a better outcome)? In an attempt to compare whether collaborative governance was more effective than ‘adversarial or managerial governance’, which we take as comparable to New Zealand’s status quo Schedule 1 process, Ansell and Gash (2007) conducted a study of existing literature. They reviewed 137 cases where collaborative governance had been used across a range of policy sectors but were unable to determine which approach was more effective because very few studies evaluated governance outcomes. However, they did discover that there was an over-representation of natural resource management cases in their search results, which they attributed to the “importance of collaborative strategies for managing contentious local resource disputes.” These types of disputes are examples of the wicked societal problems first described by Rittel and Weber (1973) which no amount of science will solve and where every implemented solution has further consequences that are difficult to anticipate. Wicked problems are by their nature hard to define, and even harder to solve. Moreover, they tend to reoccur unless sustainable and durable decisions can be reached that reflect the competing interests and worldviews of stakeholders (Weber et al. 2011). Innes and Booher (2010) provide a summary of the characteristics of wicked problems which include a lack of consensus of both the definition of the problem and the goals that need to be achieved, no ‘stopping rule’ or ‘correct’ answers and no objective way to determine what is a good decision. Collaborative processes offer an alternative framework to the top-down planning approaches that are traditionally used to deal with wicked problems. A major benefit of
CAWTHRON INSTITUTE | REPORT NO. 2353 JULY 2013
22
collaborative processes is that the values of all participating stakeholders can be recognised in decisions that are more likely to be sustainable, durable and, in the eyes of the stakeholders, legitimate. Other benefits include the building of relationships and networks, greater transparency, the sharing of information and gaining trust (Innes & Booher 2010; McCall & Dunn 2012; Evans & O'Brien 2013).
3.3. When to use a collaborative process (or when not to)
Collaborative processes are “hardly easy, do not solve all of the problems they are supposed to tackle and are no panacea” (Bryson, 2004). To this list we would add that running a collaborative process is also likely to be time consuming and will require considerable resources (principally staff time but also costs associated with engaging an independent facilitator, venue hire, travel and/or time reimbursements for participants, food etc.). It is too early to compare the time and costs of running collaborative processes and Schedule 1 processes. However, the LaWF offered some thoughts on the time that collaborative processes might take in Appendix 9 of its second report (Land and Water Forum 2012). In particular, the forum advises that it could take between three and 24 months for a collaborative stakeholder group to reach policy resolutions and develop them into proposed plan provisions for notification. At this point, LaWF anticipated the independent hearing step should be brief and appeals to the Environment Court or High Court should be on a more narrow range of matters than is currently the case. Conditions present at the outset of collaborative processes contribute to the ultimate outcomes, such as whether or not consensus can be achieved. For example, it is unlikely that a collaborative process will be successful (and should even be attempted) if any or all of the following conditions are present (pers. comm. Andrew Fenemor, Landcare Research, June 2013):
Insufficient time available for the process
Inability to engage any of the major stakeholders in the process
Lack of mandate for the process from councils
Intractable levels of conflict among stake holders
Socio-ecological consequences of the problem (i.e. we are already at a crisis).
Further to this list, Innes and Booher (2010) see no point in attempting a collaborative process if the issues are well understood and there is considerable consensus around solutions, nor do they recommend undertaking a collaborative process if the cost of doing so is going to be more than the cost of making a mistaken decision. An example of this might be a collaborative process to determine whether a small scale irrigation scheme should proceed. We would also add that collaborative processes to make policy recommendations are unlikely to be successful if there is a lack of commitment
CAWTHRON INSTITUTE | REPORT NO. 2353 JULY 2013
23
from councils and/or capability to lead the process. However, if these, and the conditions listed above do not prevail, collaborative processes may well offer the best approach for durable decision making, provided they are carefully designed from the outset. In summary, collaborative processes are best for complex, multi-attribute wicked problems that are of long-term social, economic and environmental importance.
3.4. The role of the council
Participants in collaborative processes have commented that barriers to achieving successful outcomes include the culture within councils, the lack of clarity around the roles of the participants and the lack of training for council personnel in collaborative techniques (e.g.Carr et al. 1998). Jay Benforado, a senior manager with the United States Environmental Protection Agency (USEPA), identified one of the key factors to successful collaborative decision making as getting the front-end design of the process right, and in particular “determining the roles of your organisation” (Belefski & Thurmaier 2006 p144). Identifying the roles that councils play in collaborative processes is critical to achieving successful outcomes because staff participating in such processes must have the skills and capacity to collaborate effectively. Carr et al. (1998) note that employees participating in collaborative efforts must be innovative, visionary and willing to take risks. They question how staff can do this without the basic skills necessary to participate. A literature review conducted for this report identified a very limited amount of academic research published on the roles that councils (or other statutory agencies) play in collaborative processes. However, one study (Ryan 2001) examined the roles that participants from regulatory agencies might play in a collaborative decision-making process. These roles, identified in literature on public administration, bureaucratic behaviour and regulatory theory, were expert, analyst, stakeholder, facilitator and leader. After identifying these roles, Ryan analysed data from documents and from interviews conducted with USEPA participants and non-USEPA participants in order to investigate and rank perceptions of the USEPA’s primary role in a collaborative process.
3.4.1. Expert
According to Ryan (2001) historically the power of administrative agencies was vested in the expertise of agency staff, and the detached, neutral technocratic experts of agencies were viewed as those most able to make decisions. In Ryan’s study participants from the USEPA most often described their primary role as ‘technical expert’ because they saw themselves as playing a substantive role in bringing technical and regulatory expertise to the process. However, non-USEPA participants in the same collaborative process did not see the USEPA’s primary role as technical
CAWTHRON INSTITUTE | REPORT NO. 2353 JULY 2013
24
expert; in fact they had opposite views of the USEPA’s ability to understand the technical aspects of industrial operations and the feasibility of regulatory options. In many ways it is predictable that planning participants from regulatory agencies would identify one of their primary roles as technical expert, because the agencies that employ them generally hold so much technical knowledge that is relevant to decision-making processes. However, Baum (1996) postulates that planners, after recognising social and political realities of practice, choose technical rational roles as a ‘psychological defence’ against appearing “wrong, imperfect or uncertain” and because in doing so they are applying the fundamental principle of guiding action by knowledge. In Baum’s opinion this choice defeats efforts to plan and leads to ineffective outcomes. However, Yaffee and Wondolleck (2003 p 63) perceive a change in attitudes of regulatory agency participants in collaborative processes, from that of “experts with a mission to convince” to “let’s see what we can do together.”
3.4.2. Analyst
Ryan (2001) makes the distinction between agency as expert and agency as analyst. The role of the analyst relates to the ability of staff to produce, manipulate, analyse and interpret data from various sources, whereas the role of the expert relates more generally to technical and administrative capability. In Ryan’s study of the USEPA, industry, state and environmental collaborative stakeholder participants ranked highly the USEPA’s ability to produce and analyse data for the collaborative process, whilst the USEPA participants consistently ranked the analyst role as secondary to their role as experts. The role of analyst is linked to the appropriate use of data and how it might affect planning outcomes. This issue needs to be considered as part of the design of a collaborative process. Ryan (2001) cautions that too much data and analysis can overwhelm the collaborative discussions and may come at the expense of the process itself. Innes (1995) observed that the desire of planners to control data often stymied collaborative efforts in transportation planning and Emerson et al. (2012) noted that data can either “inform or confuse”. The interface between science information and policy is discussed further in Section 3.6.
3.4.3. Stakeholder
Participants in collaborative processes are often referred to as stakeholders. Bryson (2004) discusses how stakeholders are defined in literature, with some authors positing that stakeholders are limited to people or groups who have the power to directly affect an organisation’s future, whilst other authors argue that stakeholders are a broader range of people including the ‘nominally powerless’. The term ‘stakeholder’ as used here, refers to the participation of citizens as individuals and as representatives of organised groups. It also refers to regulatory agencies and non-agency stakeholders.
CAWTHRON INSTITUTE | REPORT NO. 2353 JULY 2013
25
Statutory agencies are stakeholders in collaborative processes in that they are one of many participants with a specific set of interests to advocate and a varying set of skills and abilities with which to do so (Ryan 2001). However, according to Yaffee and Wondolleck (2003) it is not a normal perspective for many agencies to view themselves as stakeholders, with interests that need to be expressed. In Ryan’s study the role of stakeholder was recognised far less often by the USEPA participants than other (non-USEPA) participants. To play the role of stakeholder effectively Ryan considered that the USEPA participants would need to take positions in the collaborative discussions, interpret statutes to illustrate their interests and be open to new ideas and approaches. In particular, Ryan notes that being an effective stakeholder would mean “not restricting one’s role to that of process facilitator” (Ryan 2001 p 237). In one case she observed, where USEPA participants limited their role to solely that of facilitation, there was a “great deal of frustration for the other participants in the negotiations”. This was because the direction and the goals for the process were not bounded in any way, i.e. there were no limits set on the possible outcomes.
3.4.4. Facilitator
In a facilitation role, councils act as a mediator or balancer of interests to ensure the integrity of the collaborative process (Ryan 2001; Ansell & Gash 2007). Facilitation requires a person or persons with sufficient trust and respect from the participants to keep the process moving forward and to ensure that the diversity of views is heard in the dialogue that ensues. The lack of trained, well-resourced facilitators can be a significant barrier to effective stakeholder participation. Carr et al. (1998) list the necessary characteristics of an effective facilitator as empathy, patience, self-assurance, ingenuity and stamina in order to create an environment where participants can feel comfortable enough to respectfully explore differences. Memon et al. (2012) observed a collaborative planning exercise to progress the implementation of the Canterbury Water Management Strategy in the Hurunui and Waiau catchments. The use of a neutral facilitator (i.e. not a council employee) was favoured by some participants of the process that were interviewed by Memon et al. (2012), although other interviewees highly regarded the facilitation undertaken by Canterbury Regional Council staff. A key question that arose as the Memon et al. research proceeded was how the council, as the statutory regulator, could also manage its role as a neutral facilitator of the collaborative process. Such confusion of roles can lead to misunderstandings and conflict among actors and can be costly in terms of effectiveness and efficiency, especially with regard to the reliability and legitimacy of government (Klijn & Koppenjan 2000). Innes and Booher (2010) cite, as an example of the limits to the roles statutory agencies can play in collaborative processes, the scenario where an agency is tasked with environmental protection. According to Innes and Booher, an agency cannot play the role of a neutral
CAWTHRON INSTITUTE | REPORT NO. 2353 JULY 2013
26
facilitator for decision making in a project with potentially negative impacts in the environment.
3.4.5. Leader
Ryan (2001 p 241) defines leadership as “including elements of expertise and analysis, sponsorship, authority, process management and decision-making responsibility.” According to Ryan there are three principal components of effective leadership, i.e. adequate management, maintaining technical credibility and ensuring that collaborative stakeholder groups are empowered to make credible and convincing decisions that are acceptable to all. It is clear from Ryan’s definition that for her the role of leader is much broader than that of the facilitator alone. It includes sponsoring and legitimising the process and establishing the boundaries for the dialogue. Emerson et al. (2012) also identify wider responsibilities of the leader role that include initiating the collaborative effort, providing staffing, technologies and other resources to help the process. Certain leadership roles are essential at the outset, whilst others are more important during moments of deliberation or conflict and still others in championing the collaborative process through to implementation (Agranoff 2006). Yaffee and Wondolleck (2003 p 67) outline the problems associated with leaders who fail to demonstrate adequate commitment to collaborative processes, especially the “worst-case” situation where field level staff “help craft a process, which through hours of hard work and emotion produces a consensus plan, and is then disavowed by agency leadership”. Some researchers do not distinguish between the role of facilitator and leader. Ansell and Gash (2007) for example refer to ‘facilitative leadership’ which they say is crucial for setting and maintaining clear ground rules, building trust, facilitating dialogue and exploring mutual gains. Similarly, Lasker et al. (2001) consider that collaborative leaders must have the skills to promote broad and active participation, ensure broad-based influence and control, facilitate productive group dynamics and extend the scope of the process. Ryan (2001) concludes that the tasks of being an expert, analyst, stakeholder and ultimately a leader imply an expanded array of complex skill-sets necessary for all regulatory agencies that wish to undertake collaborative processes. It is apparent that the regulatory agency’s roles are rich, complex and difficult to fulfil. Councils must be mindful of those roles and must build personal and institutional capacity to enable collaborative processes to reach successful outcomes.
CAWTHRON INSTITUTE | REPORT NO. 2353 JULY 2013
27
3.5. Designing a collaborative process — key design aspects
There are a number of design challenges associated with collaborative processes that have been reported in literature. Bryson et al. (2013) reviewed more than 250 articles and books related more generally to the design of public participation processes and cautioned that it is “neither feasible nor advisable to generate ‘rules’ or a step-by-step design template for organising public participation.” Rather, Bryson et al. advise that “successful public participation requires designing iteratively, in response to specific purposes and contexts”. Bryson et al. (2013) argue that the design of the process will firstly depend on the purpose of the public participation (i.e. the problem to be solved) and the desired outcomes, which must be clearly identified at the outset. The remainder of this section presents a case-study of a collaborative process that is underway in Hawke’s Bay as an example of the design challenges that councils face in implementing a collaborative process.
3.5.1. The TANK process — a case study
In 2012 the Hawke’s Bay Regional Council (HBRC) convened a collaborative stakeholder group (known locally as the TANK group) to recommend allocation limits and water quality targets for the Greater Heretaunga and Ahuriri catchment plan change. The key drivers for the plan change are a requirement for the Council to give effect to the National Policy Statement for Freshwater Management and the expiry of a large number of water permits in the Greater Heretaunga and Ahuriri catchments from 2015 onwards. If successful, i.e. consensus is achieved; the TANK process could provide a model for future collaborative planning processes. It is beyond the scope of this paper to detail all aspects of the design of the TANK process; therefore we limit our comment to four key criteria: the recruitment of appropriate stakeholders, the mandate for the process, timing with respect to other planning processes, and the mandate of individuals.
3.5.2. Recruitment
An early challenge for designers of collaborative processes is how to identify, recruit and retain appropriate participants, as the legitimacy of the whole process centres, to some degree, on who the players are. The LaWF stated, in its second report (Land and Water Forum 2012 p 33), that “the legitimacy of the group is critical to its success - its membership must reflect a balanced representation of interests at play…” Recruitment of those affected by the outcomes of the process, rather than just the ‘deal makers’ and ‘deal breakers’, provides legitimacy for collaborative governance processes (Innes & Booher 2010). Innes and Booher (2010 p 101) see “contrarian and disadvantaged stakeholders as necessary to help achieve robust agreements that break open the unacceptable status quo that brought people to the table in the first place”.
CAWTHRON INSTITUTE | REPORT NO. 2353 JULY 2013
28
One of the barriers to successful outcomes of collaborative processes is an imbalance in power and/or resources. For example if some stakeholders do not have the capacity, organisation, status or resources to participate on an equal footing with other stakeholders then the process will be prone to manipulation by stronger actors (Ansell & Gash 2007). In a situation such as this there must be a commitment to a positive strategy of empowerment and representation of weaker or disadvantaged stakeholders. When considering how to identify and recruit participants designers might consider using one of the fifteen different stakeholder identification and analysis techniques suggested by Bryson (2004) including the ‘basic stakeholder analysis technique’ that has been used in the United States. Another approach might be to use social network analysis stakeholder identification techniques as presented by (Laumann et al. 1989), and practiced by Newton and O’Brien (Newton & O'Brien, In press). Using this approach, stakeholders may be identified based on either:
1. Their participation in certain events
2. Their network ties to each other around a certain theme
3. Their formal position in an organisation.
Social network analysis has also been used by Prell et al. (2008; Prell et al. 2009) to aid in stakeholder selection by identifying which individuals play central roles in their network of interest. Whilst social network analysis is a good way to identify and recruit people within a network the analysis needs to be replicated several times to achieve stakeholder diversity (pers. comm. Marg O’Brien, Cawthron Institute, June 2013). Davies et al. (2005) also offer ways in which individuals can be recruited (via election, random selection, purposive selection and volunteerism). It is beyond the scope of this report to provide specific details of each of the techniques suggested above and in any case the appropriate technique will depend very much on the particular problem that is being addressed by the collaborative process. Most of the TANK participants were recruited directly by HBRC, although some ‘snowballing’, whereby participants suggested other people, did occur. During the first meeting participants were asked, “Who is not here?” and it was noted that females and youth were not well-represented and that kayaker and bather representatives were absent. Following the first meeting representatives from the District Health Board, Friends of Ahuriri and the Napier branch of Forest and Bird were approached to join the TANK process, as were additional Māori representatives. Representatives of two key stakeholder organisations (one a water user, the other environmental) were recruited but have thus far attended only one or two meetings (respectively) and their continued absence could make it difficult to reach a durable consensus.
CAWTHRON INSTITUTE | REPORT NO. 2353 JULY 2013
29
Three councillors were included in the TANK process to advocate for the Council’s statutory responsibilities and the interests of the Hawke’s Bay community at large. The councillors have contributed their understanding of policy and local government legislation, and have offered valuable comment from a ratepayer’s perspective. Whether or not there is any actual or perceived conflict of interest for councillors involved in the TANK process will depend on whether they are also involved in a decision-making role at the end of the process. The LaWF advises that councillors participating in collaborative processes must not participate in any subsequent council discussions or decisions relating to matters under consideration in the collaborative process (Land and Water Forum 2012). Hawke’s Bay Regional Council considered this advice and concluded there was unlikely to be a conflict for councillors involved in the TANK process. Another recruitment challenge that has arisen in the TANK process is whether local interests are best represented by local members of national organisations or by experienced political lobbyists employed by those organisations, who may not necessarily reside in the region. This issue has played out in the TANK process following a request from a local representative of a national organisation for a non-resident executive officer of that organisation to attend TANK meetings. Recent changes to the structure of key stakeholder organisations (such as DOC) might mean that designers of collaborative processes will face this question more often in the future. Innes and Booher (2010) consider that lobbyists can be excellent stakeholders because they are skilled at representing an interest and reporting back to their constituencies and are not afraid to speak up when it might create discomfort and tension. On the other hand, non-resident stakeholders are more likely to be driven by non-local interests and may be less likely to agree to compromise solutions. There are approximately 35 members of the TANK group, which meets approximately every six weeks. Larger groups are possible for collaborative processes but might need to be structured in a different way. For example, the LaWF was made up of a “small group”, with representatives from 21 organisations that met on a monthly basis and reported to the plenary, which had a membership of 62 organisations10. Ostrom (2010) considers that the number of participants involved is a major variable that can affect the outcome of a collaborative process, citing the work of Agrawal (2000) who posits that if the group is very large transaction costs and conflict may arise; if the group is too small it is hard to generate the resources needed to engage effectively in collective action. Comments made to us by council staff involved in collaborative processes would suggest that restricting the numbers of people involved in such processes is a key challenge. Innes and Booher (2010) caution against excluding outside observers to a collaborative process and consider that “membership in a collaborative process should not be regarded as fixed from the outset but should respond to learning and the evolution of tasks and perceptions.”
10 http://www.landandwater.org.nz/Site/About_Us/default.aspx
CAWTHRON INSTITUTE | REPORT NO. 2353 JULY 2013
30
3.5.3. Mandate for the process
Earlier in this chapter we noted that frustration can arise amongst participants if councils establish a collaborative process and then do not implement the stakeholder group’s recommendations. To avoid this problem we recommend that a collaborative process should be established with a formal mandate. As an example, the mandate for the TANK process comes from the Council’s “good faith undertaking to implement the elements of any consensus outcome agreed by the TANK group, if one emerges, which it has the power to implement, and to promote the implementation of the elements which require Regional Planning Committee endorsement.”11 This undertaking is conditional on the recommendations being consistent with the RMA, the regional policy statement and other high level council strategies and plans. The mandate is documented in the TANK terms of reference (TOR) and is based on a recommendation passed by formal Council resolution in August 2012.
3.5.4. Strategic timing for the process (around other planning projects)
We have observed a degree of debate amongst TANK participants with regard to how their participation will influence key outcomes. During the collaborative process the participants have been involved in small group and homework exercises to identify the values, objectives, performance measures and management variables for the Greater Heretaunga and Ahuriri catchments. Variations to the Hawke’s Bay Regional Resource Management Plan (RRMP) must give effect to the Regional Policy Statement (RPS) which has also recently been amended (RPS Change 5). Through the RPS Change 5, Council has proposed primary and secondary values for the Greater Heretaunga catchment. Thus the TANK process and the RPS Change 5 process have been occurring concurrently and it remains to be seen how the RPS process will affect the outcomes of the TANK process. This highlights that collaborative processes do not occur in isolation and other processes can affect the outcome. Whilst some overlap with other processes may be difficult to avoid, we would recommend that councils strategically plan the timing of collaborative processes in order to ensure that consensus outcomes can be faithfully implemented.
3.5.5. Mandate of individuals
Another aspect of design highlighted in this report is the issue of individual mandate. The mandate of individuals refers to the authority they have in the collaborative process to speak on behalf of others (Davies et al. 2005). According to Davies et al. (2005) there are four primary mandate positions. The first three; ‘delegates’, ‘trustees’ and ‘guardians’ can speak or act on behalf of others, whereas the fourth, ‘individuals’ hold a mandate only to represent themselves.
11 Greater Heretaunga and Ahuriri Collaborative Stakeholder Group Terms of Reference.
CAWTHRON INSTITUTE | REPORT NO. 2353 JULY 2013
31
Early on in the TANK process participants were encouraged to network with the wider community. It quickly became clear, however, that for some participants, the question of mandate would be problematic: it would be difficult, for example, for an individual dairy farmer to speak on behalf of the other farmers in a catchment. The issue was addressed by inserting the following words into the TOR:
The members of the TANK group have, in the main, been nominated by their respective sector or group to be their mandated representative. Where members have not been given the mandate of their sector or group, they will participate as individuals and are expected to also convey ideas and perspectives from their wider networks. In meeting three, each member will declare whether they are mandated representatives or not. At the end of the process, each member will declare whether they can support the proposed agreement and promote it to their organisations and networks (see definition of consensus below). Members will also be asked, at that point, whether their organisations (where relevant) would formally endorse the consensus agreement.
As can be seen above the TANK TOR indicated that at the third meeting, participants would be asked to declare whether they were there as individuals, or as representatives of a wider community, group, industry or sector. Through the seven meetings held to date we think TANK participants have generally spoken from their personal experiences and perspectives, although there is evidence that sector groups are starting to consider policy options more formally. We consider that mandate is likely to be an issue only at the end of the process when members decide whether they personally, and their organisations, will endorse a set or recommendations.
3.6. Knowledge, science and collaborative processes
Knowledge of relevance to freshwater planning is not limited to that generated by Western science and technology. In fact, the very nature of collaborative governance is to explore and capture alternative ways of knowing in decision-making processes. Innes and Booher (2010) describe the multiple ways of knowing as ranging from the scientific, objective approach, to a qualitative, interpretive approach focusing on understandings and meanings, to experiential, holistic and pragmatic approaches. According to Innes and Booher (2010), professionals and decision-makers often tacitly use one or more of these ways of knowing without conscious recognition that there is a choice. The challenge for agents involved in the design of collaborative processes is to provide innovative and creative pathways to ensure that alternative ways of knowing can be incorporated into public actions. This said, however, experts are needed in collaborative processes to identify and explain the social, environmental, cultural and economic effects of different policy options (Land and Water Forum 2012). As in a RMA Schedule 1 process, collaborative governance should be underpinned by a sound base of scientific and technical information and
CAWTHRON INSTITUTE | REPORT NO. 2353 JULY 2013
32
Mātauranga Māori. Failure to do this could result in “lowest common denominator” outcomes where “unbridled collaborative processes [have] ignored scientific and legal realities” (McGloskey 1996 in Yaffee & Wondolleck, 2003 pg 68). Experts are people who, by virtue of their training, experience or professional standing have specialised knowledge not available to most people (Gregory et al. 2012a). Just who is an expert will depend on the decision context. Gregory et al. (2012a) provide as an example the scenario of a prescribed burn-off in a forest park near an urban area. If the outcome being assessed is ‘quality of recreational experience’ then non-technical stakeholders or resource users may be the relevant experts; if the outcome concerns changes to local foods then traditional knowledge holders may be the relevant experts. However, the health impacts of air emissions would require air quality experts able to develop and explain air dispersion models and possibly epidemiologists to assess health effects. In the TANK process, as with other recent collaborative processes, technical/science experts are not participants but are brought in to inform the process at key times. This is not to say that they could not be included in every meeting or regarded as ‘stakeholders’. However, the costs of having technical/science experts attend every meeting need to be weighed against the difficulties for those same people when they are asked to provide input without the benefit of understanding the wider discussion and context for the objectives, management variables and performance measures that participants have identified as being important. Technical experts need to have a trusting relationship with the members of the CSG so that they feel confident enough to engage with stakeholders in a “free and frank” manner on matters that can be contentious. Ways in which this trust can be developed should be addressed at the design stage of the process. In our view, collaborative processes are a key opportunity for improved interface between science and policy development. The information that is provided for collaborative processes should fit with the context and the purposes of the process (Bryson et al. 2013) and designers should give some thought as to what information will be required, when it will be required, and how it will be communicated through-out the collaborative process. Thought must also be given to identifying, scoping and resourcing studies that will be needed, in timely fashion, to inform the decision-making process (Gregory et al. 2012a). There is scope for stakeholders to be involved in this process too. TANK participants, for example, have generated ideas for scientific studies that they consider are necessary to effectively manage water resources in the Greater Heretaunga and Ahuriri catchments. More generally, studies might include literature reviews, analysis of existing data and the development of conceptual models capable of illustrating the causal relationships between proposed management options and the measures that will be used to assess performance (e.g. Bayesian belief networks, see Quinn et al. 2010; Quinn et al. 2013). Models can be developed in iterative interactions between scientists and stakeholders (Maguire 2003; Irwin et al. 2011; Cook et al. 2013).
CAWTHRON INSTITUTE | REPORT NO. 2353 JULY 2013
33
The sorts of scientific studies that have been undertaken for the Waimea Water Augmentation Committee include (Cook et al. 2013):
Assessment of environmental, cultural and out-of-stream flow and water quality requirements
Consideration of over 20 potential dam sites and out-of-catchment water augmentation options
Likely future land uses, urban growth and water requirements
Groundwater, flow regime and water quality models updated
Costing and governance options debated.
Scientific assessments were used alongside culturally based monitoring at 25 sites in the Motueka and Riwaka catchments to investigate river health (Fenemor et al. 2011; Harmsworth et al. 2011). Specifically, sites were selected for cultural health monitoring using knowledge of existing scientific monitoring sites as well as areas of strong cultural interest (e.g. areas of mahinga kai or taonga species) or sites where iwi/hapu had concerns about environmental impacts. The results showed how both scientific and cultural assessments are able to successfully capture aspects of river health even though the results are generated from different perspectives and applications. The use of technology to convey information to participants of collaborative processes and their wider networks is an area that can also be considered at the design phase. Technologies include public participation geographic information systems (GIS) computer-generated visualisations, interactive web-sites, keypad voting and strategy mapping tools (Bryson et al. 2013). The IAP2 website gives additional information on methods and technologies that can be used to increase public participation in collaborative processes12. One area of collaborative governance that is receiving attention is participatory spatial planning (PSP) (McCall & Dunn 2012). A central concern of PSP is generating effective knowledge from spatial data, specifically resource management space, dedicated counter-mapping with specific groups and mapping priority problems and spatial conflicts. Specific geo-information tools are required with special functional capabilities. A form of PSP, known as ‘participatory GIS’ or PGIS13 uses combinations of geo-spatial information management tools ranging from sketch maps, Participatory 3D Models (P3DM), aerial photographs, satellite imagery, Global Positioning Systems (GPS) and Geographic Information Systems (GIS) to compose peoples’ spatial knowledge in the forms of virtual or physical, 2 or 3 dimensional maps. These are
12 http://iap2.affiniscape.com/associations/4748/files/06Dec_Toolbox.pdf 13 For an extensive bibliography on PGIS see
www.ppgis.iapad.org/ppgis/pdf/PGIS_PSP_LSK_Biblio_may_2010.pdf
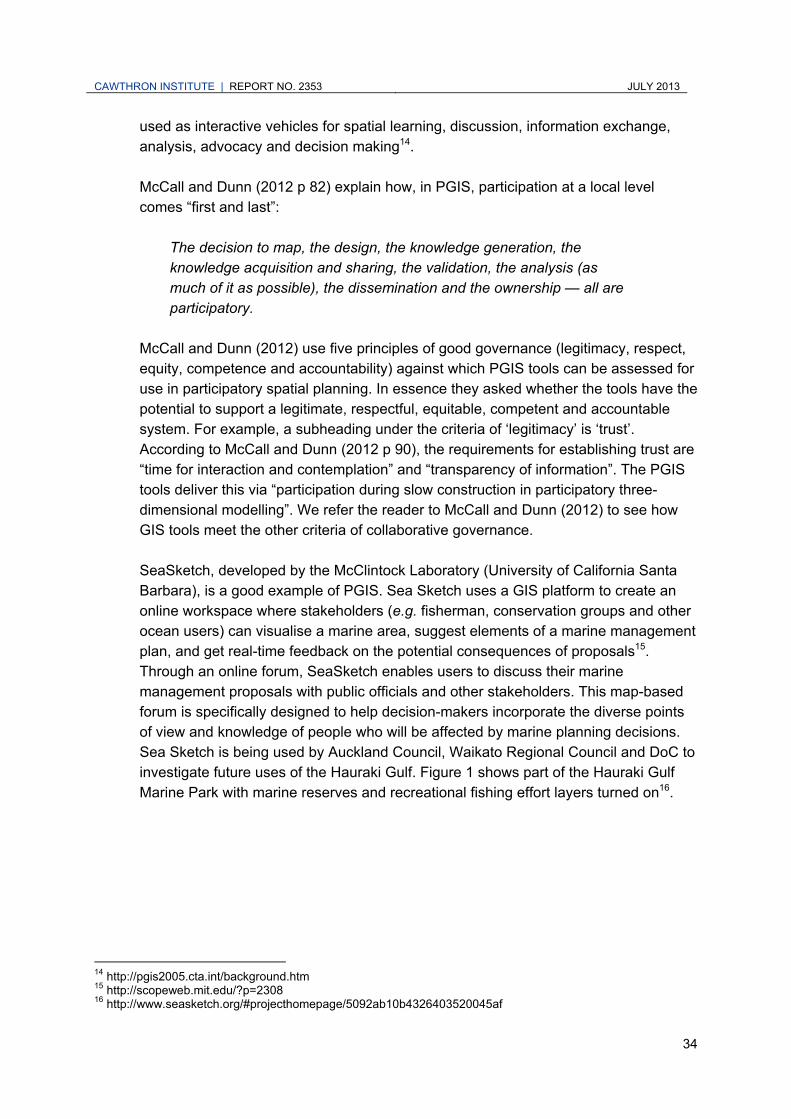
CAWTHRON INSTITUTE | REPORT NO. 2353 JULY 2013
34
used as interactive vehicles for spatial learning, discussion, information exchange, analysis, advocacy and decision making14. McCall and Dunn (2012 p 82) explain how, in PGIS, participation at a local level comes “first and last”:
The decision to map, the design, the knowledge generation, the knowledge acquisition and sharing, the validation, the analysis (as much of it as possible), the dissemination and the ownership — all are participatory.
McCall and Dunn (2012) use five principles of good governance (legitimacy, respect, equity, competence and accountability) against which PGIS tools can be assessed for use in participatory spatial planning. In essence they asked whether the tools have the potential to support a legitimate, respectful, equitable, competent and accountable system. For example, a subheading under the criteria of ‘legitimacy’ is ‘trust’. According to McCall and Dunn (2012 p 90), the requirements for establishing trust are “time for interaction and contemplation” and “transparency of information”. The PGIS tools deliver this via “participation during slow construction in participatory three-dimensional modelling”. We refer the reader to McCall and Dunn (2012) to see how GIS tools meet the other criteria of collaborative governance. SeaSketch, developed by the McClintock Laboratory (University of California Santa Barbara), is a good example of PGIS. Sea Sketch uses a GIS platform to create an online workspace where stakeholders (e.g. fisherman, conservation groups and other ocean users) can visualise a marine area, suggest elements of a marine management plan, and get real-time feedback on the potential consequences of proposals15. Through an online forum, SeaSketch enables users to discuss their marine management proposals with public officials and other stakeholders. This map-based forum is specifically designed to help decision-makers incorporate the diverse points of view and knowledge of people who will be affected by marine planning decisions. Sea Sketch is being used by Auckland Council, Waikato Regional Council and DoC to investigate future uses of the Hauraki Gulf. Figure 1 shows part of the Hauraki Gulf Marine Park with marine reserves and recreational fishing effort layers turned on16.
14 http://pgis2005.cta.int/background.htm 15 http://scopeweb.mit.edu/?p=2308 16 http://www.seasketch.org/#projecthomepage/5092ab10b4326403520045af
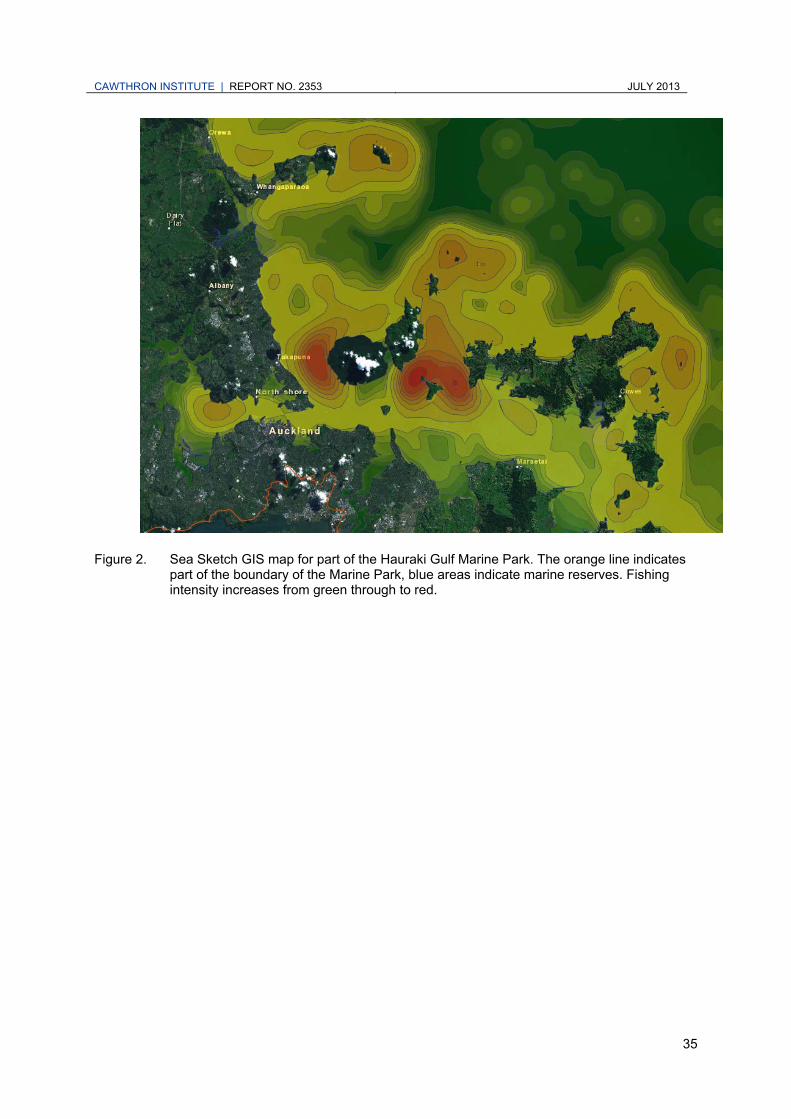
CAWTHRON INSTITUTE | REPORT NO. 2353 JULY 2013
35
Figure 2. Sea Sketch GIS map for part of the Hauraki Gulf Marine Park. The orange line indicates
part of the boundary of the Marine Park, blue areas indicate marine reserves. Fishing intensity increases from green through to red.
CAWTHRON INSTITUTE | REPORT NO. 2353 JULY 2013
36
4. MONITORING AND INDICATOR FRAMEWORKS
The LaWF has proposed that communities, iwi and water users work collaboratively to establish catchment-specific targets, standards and limits (Land and Water Forum 2012). Setting and complying with these targets will require careful monitoring of socio-economic and ecological systems so as to assist in determining the impacts of different policy decisions (Allen et al. 2012). Fundamentally the purpose of monitoring is to improve the object being monitored (Johnston & Memon 2008) and indicators provide the “basic building block” of a monitoring system (Allen et al. 2012 p. 2). Johnston and Memon (2008 p. 8) define an indicator as “a parameter that can be measured e.g. a distance from a goal, target, threshold or benchmark”. Indicators can be quantitative, such as the dissolved oxygen level of a stream. Or they can be qualitative, for example, a person’s feeling in relation to the overall health of a stream (Harmsworth et al. 2011). Indicators are not measures of random activities but carefully selected measurements of theoretical concepts or ideas (Patterson 2002). Thus, dissolved oxygen is measured to understand the life supporting capacity of a water body, based on theoretical principles of chemistry and aquatic ecology. Indicators are also used to measure activities on an on-going basis, report on the strengths and weaknesses of systems, explain the causes of prevailing conditions, and predict future change (Pannozzo & Colman 2009). Indicators can also be seen as tools for measuring values, either directly, or as a proxy for something that contributes to value. See Sections 2.2.2 and 2.2.3 of this report. Environmental monitoring and measuring community outcomes fall within the family of sustainability assessments (Ness et al. 2007 p. 499) which have been defined as tools “that can help decision-makers and policy-makers decide which actions they should or should not take in an attempt to make society more sustainable17”.
4.1. Sustainability assessment methodologies
Ness et al. (2007) group assessment tools on a continuum of three categories of methodologies. At one end are the retrospective methods that measure what has happened in the past so policy-makers can make decisions for the future. At the other extreme are the prospective methods that ask “what happens if …” see Figure 3. These two methodologies are the most relevant for freshwater planning and are discussed in more detail below.
17 In this context, Ness et al (2007 p. 498) define sustainability by combining the Brundtland Commission’s
definition – “development “meets the needs of the present without compromising the ability of future generations to meet their own needs” – with the US National Research Council’s three components of sustainability, social, environmental, and economic. In New Zealand, however, cultural wellbeing has been added as the fourth dimension of sustainability.
CAWTHRON INSTITUTE | REPORT NO. 2353 JULY 2013
37
In-between these two methods are product-related assessment methods. These measure the flows connected with production and consumption of specific products or services. The best known of these methods is life-cycle analysis, which assesses the real and potential pressure that a product has on the environment as a consequence of its production, transport, use, and disposal (Ness et al. 2007). These methodologies are not relevant to Auckland Council in this case so will not be discussed further in this report. The framework of Ness et al. (2007) also includes an overarching category of monetary valuations (such as ‘willingness to pay’), which can be used to further inform assessments done within the other three categories.
4.1.1. Indicators and indices
In the framework of Ness et al., retrospective methods comprise indicators and indices. As outlined above, indicators are quantitative or qualitative measures of economic, environmental, social, or cultural issues within a defined area. When indicators are aggregated in some way they become an index (Ness et al. 2007). Indicators and indices are in turn categorised into three sub-groups (Ness et al. 2007):
1. Non-integrated indicators, meaning the results are not combined into a single index. Examples of these include the large number of indicators included in New Zealand’s latest state of the environment report (Ministry for the Environment 2007) and those reported in Statistics New Zealand’s “Measuring New Zealand’s Progress Using a Sustainable Development Approach” (Statistics New Zealand 2008).
2. Regional flow indicators, which assess material and energy flow within a system to identify any inefficiency. These indicators are not relevant to Auckland Council in terms of this study.
3. Integrated indicators, meaning that the results of the indicators are combined into a single index. Examples of these include Yale University’s Environmental Performance Index (Emerson J W et al. 2012), the ecological footprint (Wackernagel & Rees 1997), and Auckland University’s Mauri Model (Morgan 2010). Another example is the SDSS index being developed by a research consortium involving NIWA, Cawthron and Auckland Council (Moores et al. 2013). See Section 2.2.2 and Appendix 1 for more detail.
4.1.2. Integrated assessments
Within the category of prospective methods are a group of tools based on integrated assessment (which is not to be confused with integrated indicators). These tools are used to assist in decision making for a specific project or policy. Integrated assessments are done before policies or projects are in place and often based on
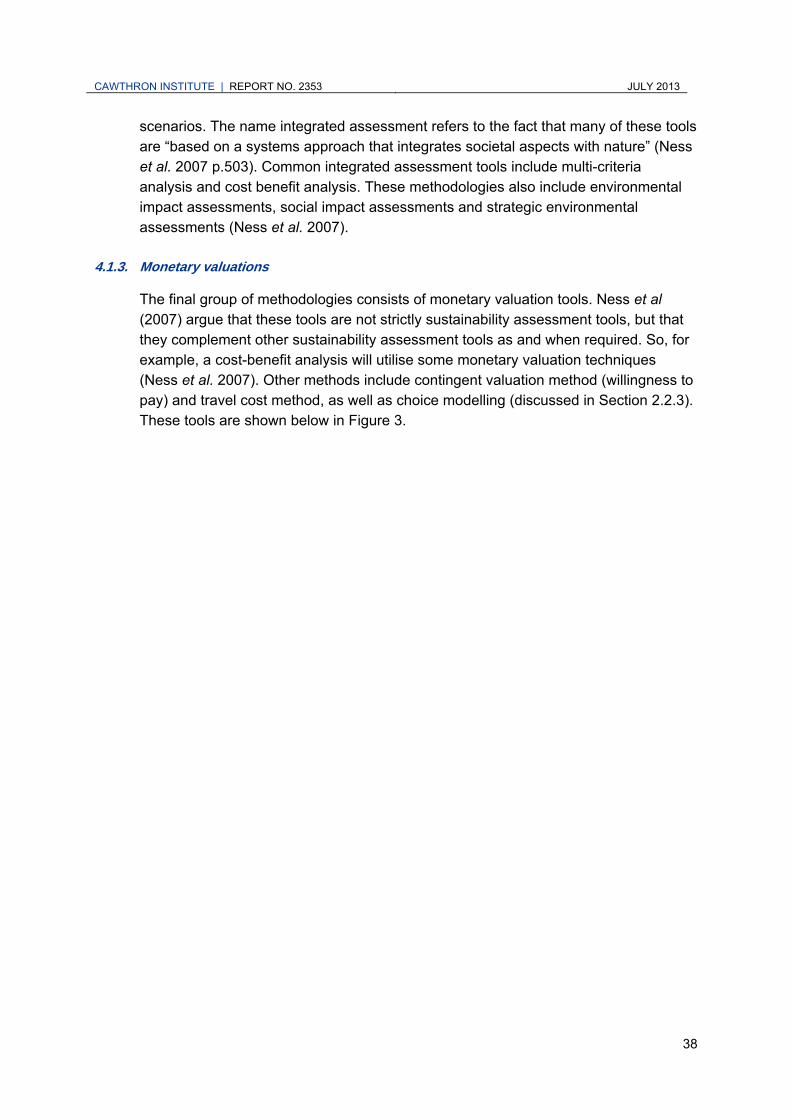
CAWTHRON INSTITUTE | REPORT NO. 2353 JULY 2013
38
scenarios. The name integrated assessment refers to the fact that many of these tools are “based on a systems approach that integrates societal aspects with nature” (Ness et al. 2007 p.503). Common integrated assessment tools include multi-criteria analysis and cost benefit analysis. These methodologies also include environmental impact assessments, social impact assessments and strategic environmental assessments (Ness et al. 2007).
4.1.3. Monetary valuations
The final group of methodologies consists of monetary valuation tools. Ness et al (2007) argue that these tools are not strictly sustainability assessment tools, but that they complement other sustainability assessment tools as and when required. So, for example, a cost-benefit analysis will utilise some monetary valuation techniques (Ness et al. 2007). Other methods include contingent valuation method (willingness to pay) and travel cost method, as well as choice modelling (discussed in Section 2.2.3). These tools are shown below in Figure 3.
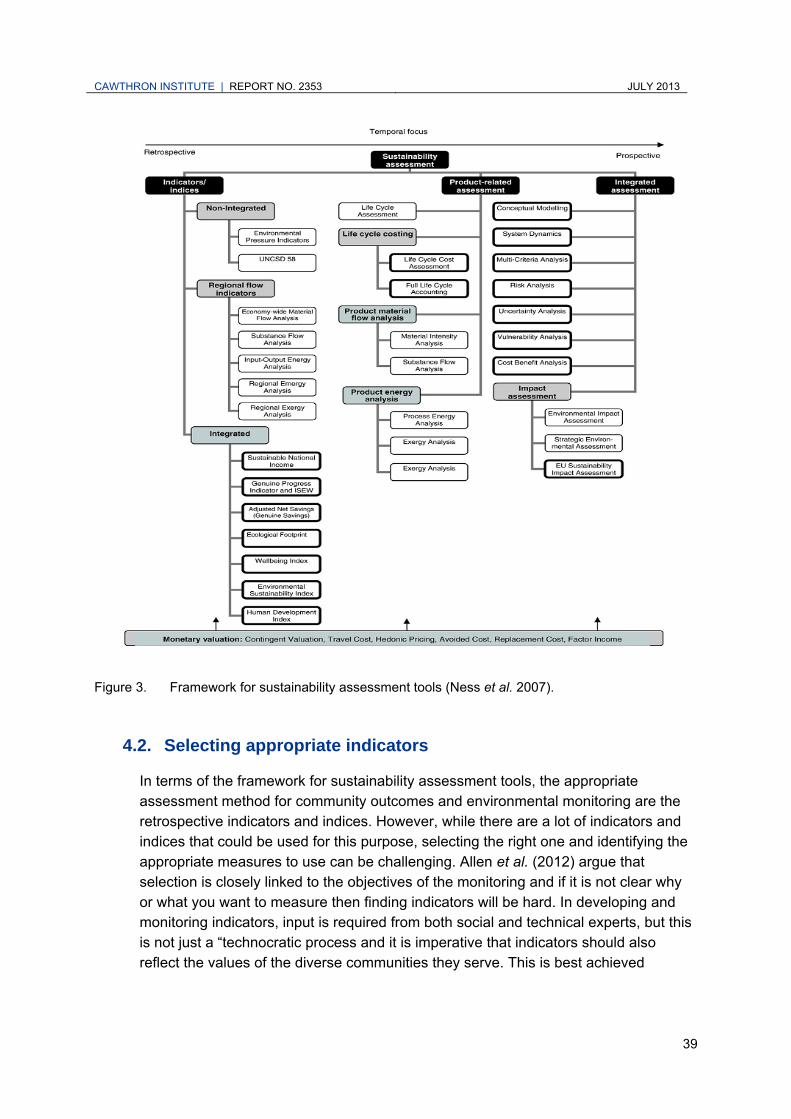
CAWTHRON INSTITUTE | REPORT NO. 2353 JULY 2013
39
Figure 3. Framework for sustainability assessment tools (Ness et al. 2007).
4.2. Selecting appropriate indicators
In terms of the framework for sustainability assessment tools, the appropriate assessment method for community outcomes and environmental monitoring are the retrospective indicators and indices. However, while there are a lot of indicators and indices that could be used for this purpose, selecting the right one and identifying the appropriate measures to use can be challenging. Allen et al. (2012) argue that selection is closely linked to the objectives of the monitoring and if it is not clear why or what you want to measure then finding indicators will be hard. In developing and monitoring indicators, input is required from both social and technical experts, but this is not just a “technocratic process and it is imperative that indicators should also reflect the values of the diverse communities they serve. This is best achieved
CAWTHRON INSTITUTE | REPORT NO. 2353 JULY 2013
40
through a participatory indicator development process” (Johnston & Memon 2008 p. 1). Also while indicators are often presented as fact, they are social constructs (Johnston & Memon 2008) and disagreements can occur regarding their meaning. To avoid this, a legitimate method and credible data need to be used when developing an indicator set (Johnston & Memon 2008). As discussed in Section 3.1, this can be done through a process of public participation. Recent research has also indicated that rather than indicators simply being an aid to management, the development process itself is one of continuous learning and improvement. Developing the indicators therefore contributes to ensuring the success of the journey towards sustainability (Fraser et al. 2006; Wallis et al. 2010) and the process itself becomes a means of social learning (Reed & Dougill 2002; Reed et al. 2006; Wallis et al. 2010). Sustainability can be enhanced, not only by identifying the need for technical interventions, but also by immersing the stakeholders in the process of learning and collaborating around the issues (Reed et al. 2006; Wallis et al. 2010). A community that is involved in the development process will feel the indicator set has greater legitimacy and relevance (Parris & Kates 2003; Reed et al. 2006; Wallis et al. 2007; Wilson et al. 2007; Graymore et al. 2008; Pinter et al. 2012; Scott & Bell 2013). This is not to say that some ‘top-down’ (i.e. expert-driven) development is not appropriate. In fact research from Reed et al. (2006) suggests a combination of ‘top-down’ and ‘bottom-up’ development is necessary for indicator development to be successful. This is because whilst a ‘top-down’ only approach may have limited legitimacy within a community, a ‘bottom-up’ only approach can have a problem with credibility of the indicators themselves. So combining the two approaches means both these issues are tackled (Reed et al. 2006). One way to ensure a good participatory process in indicator development is to use the Bellagio SusTainability Assessment and Measurement Principles (BellagioSTAMP). Developed in Bellagio (Italy) in 2009 by a group of monitoring experts from the IISD and the Organisation of Economic Cooperation and Development (OECD) (Pinter et al. 2012), BellagioSTAMP aims to guide indicator set developers in identifying the content to use, the process and scope to use, and how to maximise the impact of the content (Bakkes 2012). The principles are also designed to be iterative, as shown in Figure 4 below. Core to the process is ‘public participation’, the public contributing to identifying the set’s vision (‘visualisation’) and the design of the indicators themselves (‘content’). The indicators and the results are presented back to the community in a meaningful way (‘presentation’) and the process of data collection and reporting is ‘owned’ by an organisation to ensure the implementation of indicators and regular data collection (‘actualisation’). The cycle then begins again with the initial experience
CAWTHRON INSTITUTE | REPORT NO. 2353 JULY 2013
41
in developing the set contributing to the enhancement of the indicators and monitoring strategy.
Figure 4. Conceptual model of Bellagio SusTainability Assessment and Measurement Principles (STAMP). Adapted from Becker 2004.
BellagioSTAMP was developed through broad consensus by a group of world renowned assessment practitioners specifically to assist communities assessing societal progress, considering policy options, or advocating change (Bakkes 2012). It has been used by the OECD for developing their environmental outlook; by the United Nations Environment Programme in the production of Global Environmental Outlook 5 (GEO5), as well as a number of country specific organisations, such as the Netherlands Environmental Assessment Agency for its environmental outlook (Bakkes 2012; Pinter et al. 2012). BellagioSTAMP provide a set of eight general principles that should be taken into account when developing an indicator set (Pinter et al. 2012). Allen et al. (2012) describe some more specific characteristics good indicators should have which are shown in Table 1.
Content
Essential consideration
Adequate scope Framework and
indicators
Actualisation
Continuity and capital
Visualisation
Guiding vision
Presentation
Effective communication
Public participation
Transparency Broad
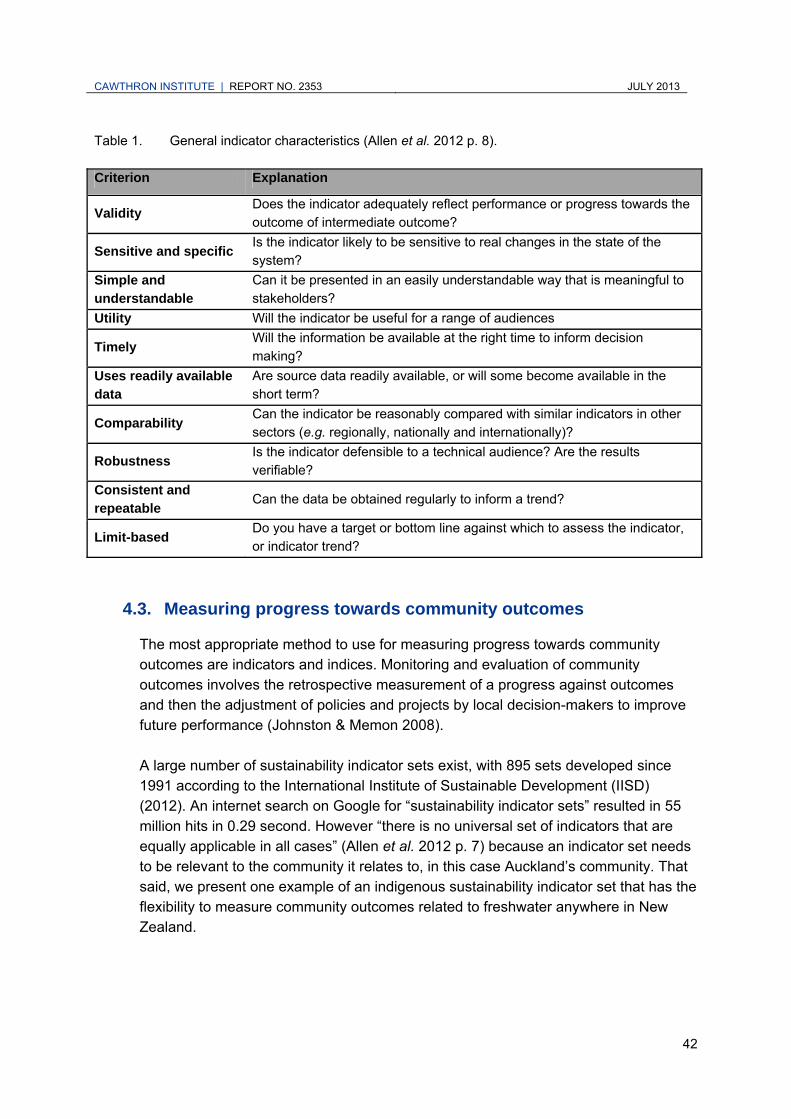
CAWTHRON INSTITUTE | REPORT NO. 2353 JULY 2013
42
Table 1. General indicator characteristics (Allen et al. 2012 p. 8).
Criterion Explanation
Validity Does the indicator adequately reflect performance or progress towards the outcome of intermediate outcome?
Sensitive and specific Is the indicator likely to be sensitive to real changes in the state of the system?
Simple and understandable
Can it be presented in an easily understandable way that is meaningful to stakeholders?
Utility Will the indicator be useful for a range of audiences
Timely Will the information be available at the right time to inform decision making?
Uses readily available data
Are source data readily available, or will some become available in the short term?
Comparability Can the indicator be reasonably compared with similar indicators in other sectors (e.g. regionally, nationally and internationally)?
Robustness Is the indicator defensible to a technical audience? Are the results verifiable?
Consistent and repeatable
Can the data be obtained regularly to inform a trend?
Limit-based Do you have a target or bottom line against which to assess the indicator, or indicator trend?
4.3. Measuring progress towards community outcomes
The most appropriate method to use for measuring progress towards community outcomes are indicators and indices. Monitoring and evaluation of community outcomes involves the retrospective measurement of a progress against outcomes and then the adjustment of policies and projects by local decision-makers to improve future performance (Johnston & Memon 2008). A large number of sustainability indicator sets exist, with 895 sets developed since 1991 according to the International Institute of Sustainable Development (IISD) (2012). An internet search on Google for “sustainability indicator sets” resulted in 55 million hits in 0.29 second. However “there is no universal set of indicators that are equally applicable in all cases” (Allen et al. 2012 p. 7) because an indicator set needs to be relevant to the community it relates to, in this case Auckland’s community. That said, we present one example of an indigenous sustainability indicator set that has the flexibility to measure community outcomes related to freshwater anywhere in New Zealand.

CAWTHRON INSTITUTE | REPORT NO. 2353 JULY 2013
43
4.3.1. The Mauri Model
The Mauri Model was developed by researchers at the University of Auckland (Morgan 2004). It is an indicator set that assesses sustainability ‘using mauri as the measure for sustainability’ (Morgan 2006 p. 172). ‘Mauri’ is a central concept to the worldview of the Māori and how they regard the environment (Morgan 2004). It ‘is a measure of the life force of a particular living thing … [so] how the mauri is affected is an indication of the long-term viability and hence sustainability’ (Morgan 2006 p. 173). All things have mauri, a place, a river, a rock, a tree, a person etc. (Marsden 2003; Hikuroa et al. 2011), and the mauri of a place can easily be degraded. The Mauri Model was ostensibly developed for indigenous communities, but is equally applicable to non-indigenous groups and communities. This is one of just a few examples of indigenous indicator sets in New Zealand, as it is generally recognised that the involvement of indigenous communities in indicator development has been extremely poor (Jollands & Harmsworth 2007) Others include the cultural health index by Tipa and Teirney and ‘the state of the Takiwā (region)’ by Ngāi Tahu (Jollands & Harmsworth 2007). A representation of the Mauri Model can be seen in Figure 5 where the economic, social, and cultural well-beings of sustainability are nested within the environmental (Morgan 2006). This is similar to the concept of ‘strong sustainability’ (Parliamentary Commissioner for the Environment 2002; Sustainable Aotearoa New Zealand 2009), however, the economic, social, cultural, and environmental well-beings are redefined to have greater cultural relevance. They therefore become impact on the mauri of the family/whanau (economic), the community (social), the clan/hapu (cultural), and the ecosystem/taiao (environment) (Morgan 2004).
Figure 5. Representation of the Mauri Model (Morgan 2006).
CAWTHRON INSTITUTE | REPORT NO. 2353 JULY 2013
44
This model has been used at Te Kete Poutama in New Zealand’s Bay of Plenty, an area of approximately 170 hectares (Mikaere 2012) that was a traditional food-gathering area for local Māori. In the 1950s the New Zealand government passed the Tasman Pulp and Paper Company Enabling Act, “in effect, the act removed tangata whenua’s mana-whenua and therefore ability to act as kaitiaki” over part of Te Kete Poutama (Hikuroa et al. 2011 p. 1). Tasman Pulp and Paper Company subsequently used Late Rotoitipaku (a small lake within Te Kete Poutama) for the dumped of 600,000 m3 of mostly toxic waste, filling the lake and consequently significantly degraded the mauri of the area so it was no longer suitable for food gathering (Hikuroa et al. 2011). In using the Mauri Model to assess Te Kete Poutama, community members considered the significance of the area in terms of the four well-beings (family, community, hapu, and ecosystems), and devised indicators to suit. Examples included (Hikuroa et al. 2011):
Environmental, the anthropogenic contaminants in the area
Cultural, the level of traditional food available in the area
Social, the ability to hold fishing camps in the area
Economic, the cost of restoration.
Each indicator was allocated a score, ranging between +2 and -2, to indicate if the area’s mauri has been ‘enhanced’ (+2), ‘maintained’ (+1), ‘neutral’ (0), ‘diminished’ (-1), or ‘destroyed’ (-2) (Morgan 2006; Hikuroa et al. 2011). This is first done for each individual indicator, the scores are then multiplied by a predetermined weighting18 and arithmetically combined to generate a score for each dimension and then arithmetically combined to provide an overall sustainability score (Morgan 2006). While the example provided relates to a specific area, the Mauri Model can readily be applied to freshwater systems. Like all systems, a water body has a mauri (Marsden 2003) so the freshwater outcomes selected by the Auckland community can inform the indicator selection and be used to provide a holistic picture of the system. The potential benefits of linking cultural and scientific indicators, so they work alongside each other, is recognised in the research by Harmsworth et al. (2011). This research suggested that “it is important that scientific monitoring approaches and indicators are not just compared with cultural approaches and indicators to show weaknesses and fallacies, but rather used side by side to illustrate different
18 The weightings are determined by those undertaking the assessment, e.g. the weightings applied by the
Combined Tangata Whenua Forum when they using the Mauri Model on assessing technological options in the Bay of Plenty (Morgan 2006) were: ecosystems (environment) 40%, hapu (cultural) 30%, Community (social) 20% and Whanau (economic) 10%. Consultant engineers working on this project, on the other hand, gave rather different weightings: ecosystems 20%, hapu 10%, community 20% and whanau 50%.
CAWTHRON INSTITUTE | REPORT NO. 2353 JULY 2013
45
perspectives and articulate differing sets of values and human desires” (Harmsworth et al. 2011 p. 434). It goes on to state that using different monitoring approaches “can also articulate better understanding of different views/perspectives, which may help resolve conflicts for resources”.
4.4. Relating environmental indicators to catchment decision making
Indicators play a key role in decision making. Herva and Roca (2013), for example, demonstrate the use of indicator systems in helping decision-makers rank different options for landfills. However, landfills are complicated systems so it is possible to develop engineering solutions to issues that arise during development of a landfill. The role of the indicators is to inform the developers of the issues the design needs to allow for. A freshwater system, on the other hand, is far more complex and adaptive with “catchment management …characterised by socio-economic complexities” (Allen et al. 2012 p. 4). The hallmark of a complex adaptive system is that it cannot simply be taken to pieces to understand how it works (Allen et al. 2012). Management of such systems is in itself extremely complex and requires a trans-disciplinary systems approach to help people to see the overall structure and patterns rather than the individual elements of the system (Creagh 2010; Allen et al. 2012). Within a complex adaptive system, indicators can contribute by measuring the different aspects of the system and providing managers with an idea of how a part of the system is progressing. Indicators help in gathering and analysing information so managers can use it “to make better decisions, measuring progress and monitoring feedback mechanisms” (Marques et al. 2013 p. 36). However “indicators of progress in a complex system are better seen as providing a focus around which different stakeholders can come together and discuss” (Allen et al. 2012 p. 5). In other words, management of complex adaptive systems lends itself to collaborative governance arrangements. There are four ways indicators can contribute to decision making by informing a collaborative governance process (Marques et al. 2013):
1. Indicators can identify the state of the environment relative to how well aspirations (the community outcomes) regarding the system are being met.
2. Indicators can identify trends, provide an early warning regarding issues within a system, and identify signs of improvements in response to policy measures implemented.
3. Indicators can help stakeholders and decision-makers to build an understanding of how a system works which contributes to their ability to make decisions.
CAWTHRON INSTITUTE | REPORT NO. 2353 JULY 2013
46
4. Indicators enable policy and decision-makers to incorporate and monitor stakeholders concerns regarding a system and to build those concerns into their management of the system.
To develop better indicators, which in turn contribute to better decision making, the design and development of indicators should involve a broad participatory process. But not only do the indicators themselves inform the collaborative process and thus decision making, as discussed previously the development of the indicators also contributes to stakeholders learning, which enhances their capability the make the right decisions (Fraser et al. 2006; Reed et al. 2006; Wallis et al. 2010; Marques et al. 2013). The indicators themselves need to be adaptive and change over time as new information becomes available and policy decisions start to impact on a system (Marques et al. 2013).
CAWTHRON INSTITUTE | REPORT NO. 2353 JULY 2013
47
5. CONCLUSIONS
5.1. The context of values
There are several meanings of ‘value’ and ‘values’ of relevance to freshwater planning. Stakeholders can have constructive conversations about freshwater values without being precise about definitions, because the meaning can emerge from the context. However, if a council uses the term “value” or “values” in planning documents, it should carefully define these to avoid unintended ambiguity. Categories of ‘values’ tend to simplify complex phenomena and are often not discrete. Categories such as ‘environmental values’ and ‘social values’ may be useful as prompts or reminders of different aspects of how people value or find meaning in their environment, but they are not distinct enough to be used for planning purposes. The simple act of defining categories and documenting values can privilege some uses and values over others and provoke conflict. This conflict can perhaps be reduced if values are identified, assessed and documented as part of the same planning process that determines management objectives, policies and methods so that the debate is appropriately focused on the latter rather than on what values are worthy of documenting in a regional plan. In freshwater planning, more often than not there is a need to achieve an overall balance amongst values or objectives. This implies a need for some determination of the relative significance or importance to be given to different values. Value is constructed in context, i.e. it is not always bounded (well-defined) and stable. This makes measurement of value problematic, especially for those aspects of value that are not bought and sold, and calls into question the robustness of attempts to prepare fully quantitative cost-benefit analyses based on constructs such as Total Economic Value. Collaborative governance offers a promising way through the problem of highly contextualised values. The enduring outcome of a successful collaborative process is not the decision about the intended state (i.e. the management objectives) but rather the process for managing under uncertainty, since the actual outcome will inevitably be different than intended.
5.2. Collaborative governance
Collaborative governance involves public organisations engaging with stakeholders in collective decision-making processes in a formal, consensus-oriented and deliberative way. Stakeholders are not just consulted but actually share in the decision making.
CAWTHRON INSTITUTE | REPORT NO. 2353 JULY 2013
48
Auckland Council is likely to play a number of different roles if it decides to establish and implement a collaborative process and the resourcing of these roles will need to be considered at the design phase. The Council is likely to lead or sponsor the process by giving the CSG a mandate and defining the scope of its work. It may also need to provide, through staff, expert technical information and policy analysis and advice. Importantly, the Council should also recognise its role as a stakeholder in the process. One way to fulfil this role is to have one or two councillors participate in the process on behalf of the full Council. The Council will also need to consider, at the design stage, who should participate in the process and how to recruit these people. The recruitment of participants will be dependent on the nature of the issue being addressed by the collaborative process. Careful attention to participant recruitment will increase the legitimacy of the CSG and the likelihood that its recommendations will be accepted by the wider community. Collaborative processes do not occur in isolation and other processes can affect the outcome. Whilst some overlap with other processes may be difficult to avoid, we would recommend that councils strategically plan the timing of collaborative processes in order to ensure that consensus outcomes can be faithfully implemented. Those designing the process should consider what technical information will be required, when it will be required, and how it will be communicated during the collaborative process. The CSG itself should also be involved in this process. Information needs could be cultural, environmental, economic or social. Technical experts, like the stakeholders themselves, need to have a trusting relationship with the members of the CSG. The costs of having technical experts attend every meeting need to be weighed against the difficulties for those experts if they are asked to provide input without the benefit of understanding the wider discussion and context.
5.3. Monitoring and indicators
Fundamentally the purpose of monitoring is to improve the system being monitored. Indicators, the basic building blocks of a monitoring system, are often presented as fact, but they are actually social constructs and disagreements can arise regarding their meaning. To avoid this, credible methods and data need to be used when developing an indicator set, e.g. through a process of public participation. An expert-driven ‘top-down’ approach may have limited legitimacy within a community, while a ‘bottom-up’ approach can have a problem with technical credibility of the indicators, so an element of both is required.
CAWTHRON INSTITUTE | REPORT NO. 2353 JULY 2013
49
The hallmark of a complex adaptive system is that it cannot simply be taken to pieces to understand how it works. Indicators can contribute to understanding by measuring the different aspects of a complex system, but indicators are better seen as providing a focus around which different stakeholders can come together and discuss. In other words, management of complex adaptive systems lends itself to collaborative governance arrangements, involving the choice of objectives to be monitored, the design of indicator sets for monitoring, and the discussion and interpretation of monitoring results to assess progress and revise implementation plans. The indicators themselves need to be adaptive and change over time as new information becomes available and policy decisions start to impact on a system.
5.4. Integrating freshwater and coastal management
With local authorities charged with implementing the New Zealand Coastal Policy statement as well as the NPSFM, councils should be looking to integrate the policy and planning processes in these two domains. Coastal users are freshwater stakeholders, and nowhere in New Zealand is this more true than in the Auckland region, where estuaries have been adversely impacted by runoff from the multitude of small rivers, streams and stormwater channels that drain the urban, peri-urban and rural areas. When implementing the NPSFM, the Auckland community’s freshwater management objectives and limits are likely to be driven by desired outcomes in the coastal environment as much or more than freshwater outcomes per se. As a result, coastal stakeholders should have a key role in freshwater planning processes, coastal ecology will be an essential component of the science required to inform freshwater planning, and any collaborative process and the wider public dialogue on the two issues will need to be ‘joined up’. Done well, Auckland Council has an opportunity to achieve something that no other regional authority has thus far achieved: integrated management of its freshwater and coastal environments.
CAWTHRON INSTITUTE | REPORT NO. 2353 JULY 2013
50
6. REFERENCES
Agranoff R 2006. Inside collaborative networks: Ten lessons for public managers. Public Administration Review 66: 56-65.
Agrawal A 2000. Small is beautiful, but is larger better? Forest management institutions in the Kumaon Himulaya, India. In: Gibson, C. McKean, M. Ostrom, E (Eds) People and Forests: Communities, Institutions and Governance. MIT Press, Cambridge, United States.
Allen W, Fenemor A, Wood D 2012. Effective indicators for freshwater management: attributes and frameworks for development.
Ansell C, Gash A 2007. Collaborative governance in theory and practice. Journal of Public Administration Research and Theory 18: 543-571.
Arnstein SR 1969. Ladder of citizen participation. Journal of the American Institute of Planners 35(4): 216-224.
Bakkes J 2012. Bellagio SusTainability Assessment and Measurement Principles (Bellagio STAMP): Significance and examples from international environmental outlooks. In: Von Raggamby A, Rubik F ed. Sustainable Development, Evaluation and Policy-Making: Theory, Practise, and Quality Assurance (Evaluating Sustainable Development series). Cheltenham, Edward Elgar Publishing Ltd.
Batstone C, Sinner J 2010. Techniques for evaluating community preferences for managing coastal ecosystems. Auckland region stormwater case study, discrete choice model estimation. Prepared by Cawthron Instititue for Auckland Regional Council. Auckland Regional Council Technical Report 2010/012.
Batstone C, Moores J, Baines J, Harper S 2013. An investigation into the use of experienced utility scores to assess multi-attribute changes in environmental quality. Paper presented to the annual conference of the Australian Agricultural and Resource Economists Society, 5-8th February, 2013. Sydney, Australia.
Baum HS 1996. Why the rational paradigm persists: Tales from the field. Journal of Planning Education and Research 15(2): 127-135.
Becker J 2004. Making Sustainable Development Evaluations Work. Sustainable Development 12: 200-211.
Belefski M, Thurmaier K 2006. Collaboration at the US environmental protection agency: An interview with two senior managers. Public Administration Review 66: 143-144.
Bell B, Sinner J, Phillips Y, Yap M, Scarpa R, Batstone C, Marsh D 2012. Mixed signals: Stated preferences for future states of three New Zealand rivers. Australian Agricultural & Resource Economics Society Annual Conference. Perth.
CAWTHRON INSTITUTE | REPORT NO. 2353 JULY 2013
51
Brown T 1984. The Concept of Value in Resource Allocation. Land Economics 60(3): 231-245.
Brunner RD, Steelman TA 2005. Beyond scientific management. In: Brunner RD, Steelman TA, Coe-Juell L, Cromley CM, Edwards CM, Tucker DW ed. Adaptive Governance: Integrating science, policy and decision making. New York, Columbia University Press.
Bryson JM 2004. What to do when stakeholders matter - stakeholder identification and analysis techniques. Public Management Review 6(1): 21-53.
Bryson JM, Quick KS, Slotterback CS, Crosby BC 2013. Designing Public Participation Processes. Public Administration Review 73(1): 23-34.
Carr DS, Selin SW, Schuett MA 1998. Managing public forests: Understanding the role of collaborative planning. Environmental Management 22(5): 767-776.
Cook BR, Atkinson M, Chalmers H, Comins L, Cooksley S, Deans N, Fazey I, Fenemor A, Kesby M, Litke S and others 2013. Interrogating participatory catchment organisations: cases from Canada, New Zealand, Scotland and the Scottish-English Borderlands. The Geographical Journal.
Creagh K 2010. Value and Price: A transdisciplinary approach to ecologically sustainable urban water management. Unpublished thesis, University of Auckland, Auckland. 258 p.
Davies BB, Blackstock K, Rauschmayer F 2005. 'Recruitment', 'composition', and 'mandate' issues in deliberative processes: should we focus on arguments rather than individuals? Environment and Planning C-Government and Policy 23(4): 599-615.
Emerson J W, Hsu A, Sherbinin A de, Mara V, Esty D, Jaiteh M 2012. 2012 Environmental Performance Index and Pilot Trend Environmental Performance Index. New Haven, Yale Centre for Environmental Law and Policy.
Emerson K, Nabatchi T, Balogh S 2012. An Integrative Framework for Collaborative Governance. Journal of Public Administration Research and Theory 22(1): 1-29.
Evans B, O'Brien M ed. 2013. Local governance and soft infrastructure for sustainability and resilience, Springer Publications (In print).
Fenemor A, Phillips C, Allen W, Young RG, Harmsworth G, Bowden B, Basher L, Gillespie PA, Kilvington M, Davies-Colley R and others 2011. Integrated catchment management-interweaving social process and science knowledge. New Zealand Journal of Marine and Freshwater Research 45(3): 313-331.
Flyvbjerg B 1998. Habermas and Foucault: thinkers for civil society? British Journal of Sociology 49(2): 210-233.
Fraser E, Dougill A, Mabee W, Reed M, McAlpine P 2006. Bottom up and top down: Analysis of participatory processes for sustainability indicator identification as a
CAWTHRON INSTITUTE | REPORT NO. 2353 JULY 2013
52
pathway to community empowerment and sustainable environmental management. Journal of Environmental Management 78: 114-127.
Graymore M, Sipe N, Rickson R 2008. Regional sustainability: How useful are current tools of sustainability assessment at the regional scale? Ecological Indicators 67: 362 - 372.
Gregory R, Long G, Colligan M, Geiger JG, Laser M 2012a. When experts disagree (and better science won't help much): Using structured deliberations to support endangered species recovery planning. Journal of Environmental Management 105: 30-43.
Gregory R, Failing L, Harstone M, Long G, McDaniels T, Ohlson D 2012b. Structured Decision Making: A Practical Guide to Environmental Management Choices. Chichester, West Sussex, UK, Wiley-Blackwell.
Harmsworth G, Young R, Walker D, Clapcott J, James T 2011. Linkages between cultural and scientific indicators of river and stream health. New Zealand Journal of Marine and Freshwater Research 45(3): 423-436.
Healy P 2010. Making Better Places: The Planning Project in the Twenty-First Century, Palgrave Macmillan.
Herva M, Roca E 2013. Ranking municipal solid waste treatment alternatives based on ecological footprint and multi-criteria analysis. Ecological iIndicators 25: 77-84.
Hikuroa D, Slade A, Gravley D 2011. Implementing Maori indigenous knowlegde (matauranga) in a scientific paradign: Restoring the mauri to Te Keke Poutama. Mai Review(3).
Hughey K, Sinner J, Booth K 2011. RiVAS and RiVAS+: Opportunities for Application of a Multi-Criteria River Value Assessment System Approach Which Considers Existing and Potential States. Presented at Annual Conference of the New Zealand Agricultural and Resource Economics Society. Nelson, New Zealand.
Hughey KFD, Baker MA ed. 2010. The River Values Assessment System: Volume 1: Overview of the Method, Guidelines for Use and Application to Recreational Values. LEaP Report No.24A, Lincoln University, New Zealand.
Hughey K.F.D., Booth K.L. (2012) Monitoring the state of New Zealand rivers: How the River Values Assessment System can help. New Zealand Journal of Marine and Freshwater Research 46:545-556.
Innes JE 1995. Planning theory emerging paradigm - communicative action and interactive practice. Journal of Planning Education and Research 14(3): 183-189.
Innes JE, Booher DE 2010. Planning with Complexity: An introduction to collaborative rationality for public policy. London and New York, Routledge.
CAWTHRON INSTITUTE | REPORT NO. 2353 JULY 2013
53
International Institute of Sustainable Development 2012. Compendium A global database of indicator initiatives. International Institute of Sustainable Development.
Irwin BJ, Wilberg MJ, Jones ML, Bence JR 2011. Applying Structured Decision Making to Recreational Fisheries Management. Fisheries 36(3): 113-122.
Johnston K, Memon A 2008. Choosing Community-based Indicators to Monitor and report progress towards community outcomes, PUCM Report 4.
Jollands N, Harmsworth G 2007. Participation of indigenous groups in sustainable development monitoring: Rationale and examples from New Zealand. Ecological Economics 62: 716-726.
Kahneman D, and Sugden, R 2005. Experienced Utility As A Standard Of Policy Evaluation. Environmental and Resource Economics 32: 161-181.
Kahnemann D, Tversky A ed. 2000. Choices, Values and Frames. New York, Cambridge University Press.
Kerr G, Sharp B 2008. Evaluating off-site environmental mitigation using choice modelling. Australian Journal of Agricultural and Resource Economics 52(4): 381-399.
Kerr GN, Swaffield SR 2012. Identifying Cultural Service Values of a Small River in the Agricultural Landscape of Canterbury, New Zealand, Using Combined Methods. Society & Natural Resources 25(12): 1330-1339.
Klijn EH, Koppenjan JFM 2000. Politicians and interactive decision making: Institutional spoilsports or playmakers. Public Administration 78(2): 365-387.
Kumar P ed. 2010. The Economics of Ecosystems and Biodiversity: Ecological and Economic Foundations. London, Earthscan.
Land and Water Forum 2012. Second report of the Land and Water Forum: setting limits for water quality and quantity, and freshwater policy- and plan-making through collaboration. 94 p.
Lasker RD, Weiss ES, Miller R 2001. Partnership synergy: a practical framework for studying and strengthening the collaborative advantage. The Millbank Quarterly 79(2): 179-205.
Laumann E, Marsden O, Prensky D 1989. The boundary specification problem in network analysis. Research methods in social network analysis: 61-87.
Lennox J, Proctor W, Russell S 2011. Structuring stakeholder participation in New Zealand's water resource governance. Ecological Economics 70(7): 1381-1394.
Lo A, Spash C 2012. Deliberative monetary valuation: in search of a democratic and value plural approach to environmental policy. Journal of Economic Surveys: doi: 10.1111/j.1467-6419.2011.00718.x.
CAWTHRON INSTITUTE | REPORT NO. 2353 JULY 2013
54
Maguire LA 2003. Interplay of science and stakeholder values in Neuse River total maximum daily load process. Journal of Water Resources Planning and Management-Asce 129(4): 261-270.
Marques A, Ramos T, Caeiro S, Costa M 2013. Adaptive-participative sustainability indicators in marine protected areas: Design and communication. Ocean & Coastal Management 72: 36-45.
Marsden M 2003. The Woven Universe: Selected writings of Rev. Maori Marsden. Royal C ed. Otaki, Estate of Rev. Maori Marsden.
Mattson D, Karl H, Clark S 2012. Values in Natural Resource Management and Policy. In: Karl HA, Scarlett L, Vargas-Moreno JC, Flaxman M ed. Restoring Lands - Coordinating Science, Politics and Action: Complexities of Climate and Governance, Springer.
McCall MK, Dunn CE 2012. Geo-information tools for participatory spatial planning: Fulfilling the criteria for 'good' governance? Geoforum 43(1): 81-94.
McFarlane K 2013. Review of Freshwater Values and Valuation: Social and Economic Input. Internal report prepared for the Air Land Water Coastal Unit. Auckland Council. Draft 22.02.13.
McGloskey M 1996. The skeptic: collaboration has its limits. High Country News May 13(7).
McNeil B, Pauker S, Sox Jr H, Tversky A 1982. On the elicitation of preferences for alternative therapies. New England Journal of Medicine 306: 1259-1262.
Memon A, Duncan R, Spicer A 2012. The Hurunui Waiau zone implementation programme as a collaborative planning process: a preliminary review. In: R12/46 CRCRn ed. Pp. 36.
Mikaere B 2012. Te Ahi O Maui Geothermal Project Cultural Impact Assessment.
Ministry for the Environment 1994. Issues, Objectives, Policies, Methods and Results under the Resource Management Act. Working Paper 1. Wellington.
Ministry for the Environment 2000. Making Every Drop Count: Overview. Wellington.
Ministry for the Environment 2007. Environment New Zealand 2007. In: Ministry for the Environment ed. Wellington, Minsitry for the Environment.
Ministry for the Environment 2013a. Request for Proposals For the Ministry for the Environment for Regional Analysis Framework 0213-01-RFP. Wellington.
Ministry for the Environment 2013b. Improving our resource management system. A discussion
document. Wellington.
Ministry for the Environment 2013c. Freshwater reform 2013 and beyond. In: Environment Mft ed. Wellington, Ministry for the Environment.
CAWTHRON INSTITUTE | REPORT NO. 2353 JULY 2013
55
Mooney C, Baldwin C, Tan P-L, Mackenzie J 2012. Transparency and trade-offs in water planning. Journal of Hydrology 474: 66-73.
Moores J, Batstone C, Gadd J, Green M, Harper S, Semadeni-Davies A, Storey R 2013. Evaluating the Sustainability of Urban Development in New Zealand in Relation to Effects on Water Bodies. Paper presented to the Ninth International Conference on Environmental, Cultural, Economic & Social Sustainability, 23-25 January 2013. Hiroshima, Japan.
Morgan TKKB 2004. A Tangata Whenua Perspective on Sustainability using the Mauri Model. International Conference on Sustainability Engineering and Science. 7–9 July 2004 Auckland, New Zealand.
Morgan TKKB 2006. Decision-support tools and the indigenous paradigm. Engineering Sustainability 159(ES4): 169–177.
Morgan TKKB 2010. The Mauri Model Decision-Making Framework: Robust Decision-Making for Community Cultural Mosaics. In: Te Rito JS, Healy S ed. 4th International Traditional Knowledge Conference. Pp. 245–250.
Ness B, Urbel-Piirsalu E, Anderberg S, Olsson L 2007. Categorising tools for sustainability assessment. Ecological Economics 60: 498–508.
New Zealand Government 2003. Sustainable Development for New Zealand: Programme of Action. Department of Prime Minister and Cabinet. Wellington.
New Zealand Government 2011. National Policy Statement on Freshwater Management. www.mfe.govt.nz/rma/central/nps/freshwater-management.html. Accessed 20 December 2012.
Newton M, O'Brien M In press. A social network for sustainable settlements.
O'Neill JO, Holland A, Light A 2008. Environmental Values. London, Routledge.
Ostrom E 2010. Analyzing collective action. Agricultural Economics 41: 155–166.
Pannozzo L, Colman R 2009. New policy directions for Nova Scotia: using the Genuine Progress Index to count what matters. GPIAtlantic.
Parliamentary Commissioner for the Environment 2002. Creating Our Future: Sustainable Development in New Zealand.
Parris T, Kates R 2003. Characterising and Measuring Sustainable Development. Annual Review of Environmental Resources 28(13): 1–28.
Patterson M 2002. Headline Indicators for Tracking Progress to Sustainability in New Zealand. In: Ministry for the Environment ed. Wellington, Ministry for the Environment.
Pinter L, Hardi P, Martinuzzi A, Hall J 2012. Bellagio STAMP: Principles for sustainability assessment and measurement. Ecological Indicators 17: 20–28.
CAWTHRON INSTITUTE | REPORT NO. 2353 JULY 2013
56
Prell C, Hubacek K, Reed M 2009. Stakeholder Analysis and Social Network Analysis in Natural Resource Management. Society & Natural Resources 22(6): 501–518.
Prell C, Hubacek K, Quinn C, Reed M 2008. 'Who's in the Network?' When Stakeholders Influence Data Analysis. Systemic Practice and Action Research 21(6): 443–458.
Quinn JM, Monaghan RM, Wilcock RJ 2010. Linking farm and waterway values — the Bog Burn catchment. In: Currie LF, Christiansen CL ed. Minimising footprints and maximising margins. Massey University, Palmerston North, Fertiliser and Lime Research Centre. pp. 63–77.
Quinn JM, Monaghan RM, Bidwell VJ, Harris SJ 2013. A Bayesian Belief Network approach to evaluating complex effects of irrigation-driven aqricultural intensification scenarios on future aquatic environmental and economic values in a New Zealand catchment. Marine and Freshwater Research 64(5): 460–474.
Reed M, Dougill A 2002. Participatory selection process for indicators of rangeland conditions in the Kalahari. The Geographical Journal 168(3): 1–12.
Reed M, Fraser E, Dougill A 2006. An adaptive learning process for developing and applying sustainability indicators with local communities. Ecological Economics 59: 406–418.
Rittel HWJ, Webber MM 1973. Dliemmas in a general theory of planning. Policy Sciences 4(2): 155-169.
Rohani M 2013. Freshwater Values Framework. A Review of Water Valuation Methods Utilised within Total Economic Valuation. Auckland Council working report, WR2013/001.
Ryan CM 2001. Leadership in collaborative policy-making: An analysis of agency roles in regulatory negotiations. Policy Sciences 34(3-4): 221–245.
Scott K, Bell D 2013. Trying to measure local well-being: indicator development as a site of discursive struggles. Environment and Planning: Government and Policy 31: 522–539.
Sharp B, Kerr G 2005. Option and existence values for the Waitaki Catchment. Report for the Ministry for the Environment, Wellington.
Sinner J, Tadaki MY 2013. Understanding Conflict over Freshwater Values in a Regional Plan. Landcare Research Policy Brief. Lincoln, New Zealand.
Sinner J, Fenemor A, Kilvington M, Allen W, Tadaki MY 2012. Valuing Our Waters: A case study in Tasman District. Cawthron Report No. 2107. Funded by MSI project C09X1003.
CAWTHRON INSTITUTE | REPORT NO. 2353 JULY 2013
57
Sinner J, Baines J, Crengle H, Salmon G, Fenemor A, Tipa G 2005. Key Concepts in Sustainable Development Part I: Economics and Ecology. Public Sector 28(3): 1–9.
Spash CL 2008. Deliberative Monetary Valuation and the Evidence for a New Value Theory. Land Economics 84(3): 469–488.
Statistics New Zealand 2008. Measuring New Zealand's Progress Using a Sustainable Development Approach: 2008. In: Zealand SN ed. Wellington, Statistics New Zealand.
Sustainable Aotearoa New Zealand 2009. Strong sustainability for New Zealand: Principles and scenarios. Wellington Nakedize.
Tadaki MY, Sinner J submitted. Measure, model, optimise: understanding reductionist concepts of value in freshwater governance.
Upton S 1996. Sustainability and the place of amenity values and landscape EAROPH World Planning Conference. Auckland.
van den Belt M 2004. Mediated Modeling: A System Dynamics Approach To Environmental Consensus Building, Island Press.
van den Belt M, McCallion A, Wairepo S, Hardy D, Hale L, Berry M 2012. Mediated Modelling of Coastal Ecosystem Services: A case study of Te Awanui Tauranga Harbour. Manaaki Taha Moana: Enhancing Coastal Ecosystems for Iwi. Report No. 4. Available at http://issuu.com/wakadigital/docs/mm_final_cover_web.
Wackernagel M, Rees W 1997. Perceptual and structural barriers to investing in natural capital: Economics from an ecological footprint perspective. Ecological Economics 20(1): 3–24.
Wallis A, Kelly A, Graymore M 2010. Assessing sustainability: a technical fix or a means of social learning? International Journal of Sustainable Development and World Ecology 17(1): 67–75.
Wallis A, Richards A, O'Toole K, Mitchell B 2007. Measuring regional sustainability: Lessons to be learned. International Journal Environment and Sustainable Development 6(2): 193–207.
Weber EP, Memon A, Painter B 2011. Science, Society, and Water Resources in New Zealand: Recognizing and Overcoming a Societal Impasse. Journal of Environmental Policy & Planning 13(1): 49–69.
Wilson J, Tyedmers P, Pelot R 2007. Contrasting and comparing sustainable development indicator metrics. Ecological Economics 65: 299–314.
Yaffee SL, Wondolleck JM 2003. Collaborative planning and sustainable resource management: the North American experience. Environments 31(2): 59–72.
CAWTHRON INSTITUTE | REPORT NO. 2353 JULY 2013
58
7. APPENDIX
Appendix 1. A spatial decision-support system. A NIWA-Cawthron collaboration has developed a multi-criteria, index-based spatial decision support system (SDSS) to assess the storm water effects of urban development scenarios on urban water bodies (Moores et al. 2013). The Urban Planning that Sustains Waterbodies (UPSW) research programme was funded by the New Zealand Ministry of Science and Innovation (Contract Number C01X0908), and now has funding under the Ministry for Business and Innovation (MBIE) Resilient Urban Futures programme. The tool is designed for use by expert technical audiences and as an information source in support of collaborative governance processes. Auckland Council is both a key end-user of the tool and a research collaborator. The SDSS takes an attribute-based approach to assess effects on the human values associated with provisioning and amenity ecosystem services of estuary and fresh water bodies. It reports indicators that correspond to the four well-beings and how these would change under different development scenarios. To date, the construction of indicators for three of the four well-beings is well advanced, with work on a cultural index under way. Environmental well-being is assessed in terms of modelled changes to key attributes impacted by storm water impacted attributes. Those changes flow through to the other well-beings as changes to water bodies affect the availability of ecosystem services. Economic well-being is expressed as a ratio of costs and benefits (or losses) based on the components of total economic value. Costs are expressed as life cycle costs of storm water and riparian management. Benefits (losses) are estimated using willingness to pay data from recent studies of coastal and fresh water values in the Auckland region (Kerr & Sharp 2008; Batstone & Sinner 2010). Social well-being changes are captured in terms of levels of well-being experienced across a typology of five relationships with water bodies that include full contact, partial contact, non-contact, extractive use activities, and sense of place (Batstone et al. 2013). Data to support the social well-being indicator is derived from expert elicitation workshops that collect ‘experienced utility’ data from respondents (Kahneman 2005).
Recommended