VALUE CREATION THROUGH MERGERS AND ACQUISITIONS IN
SOUTH AFRICA
By
KATEKANI MABASA
Student no: 1379837
A research report submitted to the Faculty of Commerce, Law and
Management. University of Witwatersrand,
In partial fulfilment of the requirements for the degree of: Master of
Management in Finance and Investment
JOHANNESBURG
SUPERVISOR: DR. THABANG MOKOALELI-MOKOTELI
28 FEBRUARY 2019
i
DECLARATION
I, Katekani Mabasa do hereby declare that the work presented in this dissertation is solely done by
me, except where otherwise indicated and acknowledged. This dissertation has not, either in whole
or in part, been submitted at any other University or institution for degree purposes. I further declare
that I was given authorisation by a panel from the Wits Business School research committee to carry
out this research.
Name:
Student Number:
Signature Signed at
Date: 2019.
ii
ABSTRACT
Mergers and Acquisitions (M&As) is a topic that has been researched extensively globally
since their inception, especially on their ability to create value for shareholders. However,
many approaches prevail on how an acquisition or merger can generate value including
synergies, improvements, and amplified market power, amongst others. Evidence from
the stock exchanges shows that over 50% of mergers and acquisitions (M&A) fail to create
value, some argue that only a third of acquisitions were able to create value while some
found the success rate is about 20%.
Given the contradictory findings and the unclear reasons on the variation in M&A
performance across the world, this study adds to the literature of whether mergers and
acquisitions of South African companies create value for shareholders by way of looking
at acquirers and targets of JSE listed companies over the last two decades.
The study looks at the short-term effects on value creation for shareholders during M&A
announcements for acquirers and target shareholders by applying the event study
methodology using the market model to see the abnormal returns upon the 21 days’
announcement period. The study further analysed the results by industry to establish
which industries create the most value and which industries destroy value for
shareholders.
The results showed that both acquirers and targets do not earn statistically significant
abnormal returns during the announcement period. When analysing the event study
results by industry for acquirers, diversified industry M&As yield the most favourable
results, followed by the consumer non-cyclical and communications industry; for targets,
the consumer non-cyclical industry is most favourable followed by the communications
and consumer cyclical industries respectively when comparing CARs, which concludes

iii
that the type of industry matters in value creation for both acquirers and targets in South
Africa, similarly to other studies globally.
iv
Table of Contents
DECLARATION ......................................................................................................................................................... I
ABSTRACT .............................................................................................................................................................. II
CHAPTER 1 ............................................................................................................................................................. 1
1.1 INTRODUCTION ................................................................................................................................................ 1
1.2 CONTEXT OF THE STUDY ..................................................................................................................................... 1
1.3 PROBLEM STATEMENT ....................................................................................................................................... 8
1.4 RESEARCH QUESTIONS....................................................................................................................................... 9
1.5 SIGNIFICANCE OF THE STUDY............................................................................................................................. 10
1.6 STRUCTURE OF THE FINAL THESIS....................................................................................................................... 11
CHAPTER SUMMARY .................................................................................................................................................... 11
CHAPTER 2: LITERATURE REVIEW ......................................................................................................................... 12
2.1 INTRODUCTION .............................................................................................................................................. 12
2.2 NATURE AND HISTORY OF MERGERS AND ACQUISITIONS (M&A) TRANSACTIONS ..................................................... 12
2.3 MERGERS AND ACQUISITION PAYMENT CONSIDERATIONS ...................................................................................... 19
2.4 MOTIVES FOR M&AS...................................................................................................................................... 20
2.5 SHORT-TERM AND LONG-TERM VALUE CREATION THROUGH MERGERS AND ACQUISITIONS ....................................... 23
2.6 FORMULATING THE HYPOTHESES ....................................................................................................................... 24
CHAPTER SUMMARY .................................................................................................................................................... 24
CHAPTER 3: RESEARCH METHODOLOGY .............................................................................................................. 26
3.1 INTRODUCTION .............................................................................................................................................. 26
3.2 DATA AND DATA SOURCES ............................................................................................................................... 26
3.3 RESEARCH DESIGN .......................................................................................................................................... 28
3.3.1 Event Study ............................................................................................................................................ 29
CHAPTER SUMMARY .................................................................................................................................................... 35
CHAPTER 4: PRESENTATION OF RESULTS ............................................................................................................. 37
4.1 INTRODUCTION .............................................................................................................................................. 37
4.2 SAMPLE DESCRIPTIVE STATISTICS ....................................................................................................................... 37
4.2.1 Distribution of Total Sample Transactions by Year ......................................................................... 37
4.2.2 Distribution of Sample Transactions by Year and Method for Acquirers and Targets........................ 39
4.2.3 Sample Statistics ................................................................................................................................... 42
4.3 MARKET REACTION TO M&A ........................................................................................................................... 43
4.3.1 Market reaction to M&A for Acquiring Firms ...................................................................................... 43
4.3.2 Market Reaction to M&A for Target Firms .......................................................................................... 45
4.4 MARKET REACTION TO M&A BY INDUSTRY ........................................................................................................ 48
4.4.1 Market Reaction to M&A for Acquiring Firms by Industry .................................................................. 48
4.4.2 Market reaction to M&A for Target Firms by Industry ........................................................................ 49
CHAPTER SUMMARY ..................................................................................................................................................... 50
CHAPTER 5: DISCUSSION AND CONCLUSION ........................................................................................................ 52
v
5.1 INTRODUCTION .............................................................................................................................................. 52
5.2 DISCUSSION ................................................................................................................................................... 52
5.3 CONCLUSION ................................................................................................................................................. 53
5.4 FURTHER RESEARCH ........................................................................................................................................ 54
REFERENCES ......................................................................................................................................................... 55
TABLE 1: WORLDWIDE ANNOUNCED M&A: MOST TARGETED NATIONS YTD 2017 VS. YTD 2007 ............................................. 4
TABLE 2: M&A WAVES FROM WAVE 1 TILL WAVE 7 ........................................................................................................ 16
TABLE 3: PROCEDURE FOLLOWED TO SELECT SAMPLE ........................................................................................................ 28
TABLE 4: M&A DEALS BY YEAR ................................................................................................................................... 38
TABLE 5: M&A DEALS BY METHOD OF PAYMENT COUNT ................................................................................................. 40
TABLE 6: M&A DEALS BY METHOD OF PAYMENT VALUES ................................................................................................. 41
TABLE 7: M&A SAMPLE STATISTICS FOR ACQUIRERS AND TARGETS .................................................................................... 42
TABLE 8: ACQUIRER FIRM’S PERFORMANCE DURING THE PERIOD 1997-2017 ........................................................................ 43
TABLE 9: TARGET FIRM’S PERFORMANCE DURING THE PERIOD 1997-2017............................................................................ 46
FIGURE 1: MERGERS & ACQUISITIONS SOUTH AFRICA (1991-2018) ..................................................................................... 7
FIGURE 2: EVENT STUDY TIMELINE ............................................................................................................................... 31
FIGURE 3: CUMULATIVE ABNORMAL RETURNS (CAR) FOR ACQUIRER FIRMS LISTED ON THE JOHANNESBURG STOCK EXCHANGE FOR
ANNOUNCEMENTS DURING AN EVENT WINDOW PERIOD (-10,0,10) DAYS ..................................................................... 44
FIGURE 4: CUMULATIVE AVERAGE ABNORMAL RETURNS (CAR) FOR TARGET FIRMS LISTED ON THE JOHANNESBURG STOCK EXCHANGE
FOR ANNOUNCEMENTS DURING AN EVENT WINDOW PERIOD (-10,10) DAYS .................................................................. 47
FIGURE 5: CUMULATIVE ABNORMAL RETURNS (CAR) FOR ACQUIRER INDUSTRY FIRMS LISTED ON THE JOHANNESBURG STOCK EXCHANGE
FOR ANNOUNCEMENTS DURING AN EVENT WINDOW PERIOD (-10,10) DAYS .................................................................. 48
FIGURE 6: CUMULATIVE ABNORMAL RETURNS (CAR) FOR TARGET INDUSTRY FIRMS LISTED ON THE JOHANNESBURG STOCK EXCHANGE
FOR ANNOUNCEMENTS DURING AN EVENT WINDOW PERIOD (-10,10) DAYS .................................................................. 50
1
CHAPTER 1
1.1 Introduction
This chapter introduces the thesis by providing the motive of the study through the
research problem. The chapter is structured as follows: Section 1.2 discusses the context
of the study. Section 1.3 focuses on explaining the problem statement. Section 1.4
contains the research questions the research plans to address and the null hypothesis to
be tested. Section 1.5 discusses the significance and benefits of the study. Section 1.6
provides the structure of the final thesis then summarises the chapter.
1.2 Context of the Study
The main goal of financial management is to maximise the current value per share of
existing shares and as a goal, raises a question of how companies identify which activities
directly impact the current value per share (Ross, Westerfield, & Bradford, 2002).
Shareholders get value from investing in a company through dividends or an appreciation
of the price they originally paid for the share. Value, in this study, means the return from
the investment made by a shareholder which could be either an appreciation of the share
price, dividends or both, as stocks have been known to provide a more reliable estimate
of a company’s performance and, according to strong evidence, the market share price
usually reflects the intrinsic value of a company (McKinsey, 2005), hence its reliability.
There are two main streams in business that can be used to grow the business and
translate that growth into value for shareholders, namely, organic growth and inorganic
growth. Organic growth is achieved through expanding current sales, marketing, planning
strategies and having a strong management team to achieve an improved growth rate in
2
value added to shareholders; this is growth driven internally from day-to-day operations,
whereas inorganic growth comes from a deal that is concluded with another company
through mergers and acquisitions (QuickBooks, 2017). Both methods have advantages
and disadvantages; this study focuses on value creation through mergers and acquisitions
as a strategy in the South African context, looking at various industry sectors, such as basic
materials, communications, consumer products, financial, energy, and power, etc.
Mergers and acquisitions are topics that have been researched extensively for various
countries since their inception especially on their ability to create value for shareholders.
Research by (Franks, Harris, &Mayer 1988) concluded that value creation was not realised
for shareholders in the United Kingdom (UK) with similar findings for Canadian bidding
firms (Eckbo & Thorburn, 2000); Mulhein and Boone (2006) also saw insignificant negative
gains from M&A activity in the UK. The United States (US) mergers and acquisitions on
similar research for deals between 1980-1996 showed insignificant negative abnormal
return. For Nordic countries, Sorheim and Lerkerod (2015) found weak evidence of value
creation for the acquirer's shareholders. Given these results over a couple of years, this
raises questions of why countries across the world still engage in mergers and acquisitions
and if the research has thoroughly analysed all aspects of mergers and acquisitions.
Carr (2015) concluded that the initial reaction from the market tends to increase value
but this is limited to the shareholders of the target company so it does not create
shareholder wealth for the acquiring company. Some authors argued the reasons why
there is a lack of M&A performance improvement in the last few years is because of
managers instigating M&A for their own benefit rather than shareholder value (Seth,
Song, &Pettit, 2000), incomplete research thus far in the field (King, Dalton, Daily, & Covin,
2004) and academic research not reaching the practitioner community (Cartwright &
Cooper, 1996, 2001; Haspeslang & Jamison, 1991). Research in the past has identified that
the integration progress accounted for a significant portion of deal performance and that
3
successful acquisitions must begin with a solid rationale to ensure the deal is tied to the
overall strategy of the firm (Morrissette, 2013).
For South Africa, Smit and Ward (2007) studied whether large acquisitions added value
to acquiring companies listed on the JSE between 2001-2003 and found that shareholders
of acquiring companies do not earn statistically significant positive or negative abnormal
returns around the announcement date. Osae, Fauconnier, &Webber-Youngman (2011)
performed a value assessment of mergers and acquisitions in the South Africa mining
sector, focusing on the Harmony and ARM gold merger. The short-term value add was
positive showing a 12.52% change in the market capital for the combined company using
McKinsey's deal value add (DVA) method to assess the short-term share price reaction.
Mohapi (2017) studied the effects of mergers and acquisitions on investment returns,
focusing on Massmart acquired by Walmart and SABMiller by AB InBev, and concluded
the creation of value is not always achieved in mergers and acquisitions for South Africa
and in the case of Massmart, the value was lost since the acquisition due to negative
news, resulting from disgruntled union members. Ndadza (2014) concluded that mergers
and acquisitions in South Africa for periods between 2002-2013 did create value for
shareholders and target firms benefit the most from M&A, furthermore concluded that
the average acquirer’s excess returns in the periods 2002-2007 were higher than excess
returns realised by acquirers during 2008-2013. Ndlovu (2016) analysed acquirer and
target companies in the same industry listed on the JSE between 2003 and 2013 and
concluded there was no significant abnormal returns or significant differences between
the pre- and post-announcement returns which then raises questions of which industries
created value in the last two decades more than others, which industries have failed to
create any value in the last two decades from a South African context and how the value
creation in some industries has changed over 20 years.
4
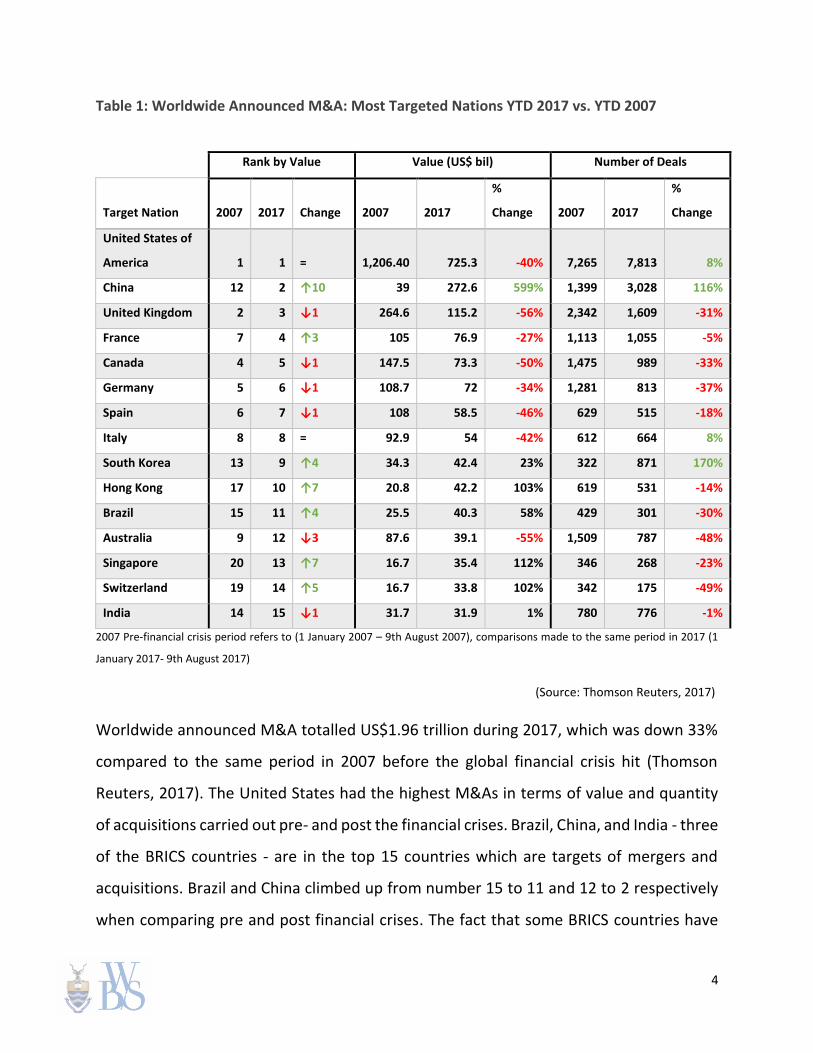
Table 1: Worldwide Announced M&A: Most Targeted Nations YTD 2017 vs. YTD 2007
2007 Pre-financial crisis period refers to (1 January 2007 – 9th August 2007), comparisons made to the same period in 2017 (1
January 2017- 9th August 2017)
(Source: Thomson Reuters, 2017)
Worldwide announced M&A totalled US$1.96 trillion during 2017, which was down 33%
compared to the same period in 2007 before the global financial crisis hit (Thomson
Reuters, 2017). The United States had the highest M&As in terms of value and quantity
of acquisitions carried out pre- and post the financial crises. Brazil, China, and India - three
of the BRICS countries - are in the top 15 countries which are targets of mergers and
acquisitions. Brazil and China climbed up from number 15 to 11 and 12 to 2 respectively
when comparing pre and post financial crises. The fact that some BRICS countries have
Rank by Value Value (US$ bil) Number of Deals
Target Nation 2007 2017 Change 2007 2017
%
Change 2007 2017
%
Change
United States of
America 1 1 = 1,206.40 725.3 -40% 7,265 7,813 8%
China 12 2 ↑10 39 272.6 599% 1,399 3,028 116%
United Kingdom 2 3 ↓1 264.6 115.2 -56% 2,342 1,609 -31%
France 7 4 ↑3 105 76.9 -27% 1,113 1,055 -5%
Canada 4 5 ↓1 147.5 73.3 -50% 1,475 989 -33%
Germany 5 6 ↓1 108.7 72 -34% 1,281 813 -37%
Spain 6 7 ↓1 108 58.5 -46% 629 515 -18%
Italy 8 8 = 92.9 54 -42% 612 664 8%
South Korea 13 9 ↑4 34.3 42.4 23% 322 871 170%
Hong Kong 17 10 ↑7 20.8 42.2 103% 619 531 -14%
Brazil 15 11 ↑4 25.5 40.3 58% 429 301 -30%
Australia 9 12 ↓3 87.6 39.1 -55% 1,509 787 -48%
Singapore 20 13 ↑7 16.7 35.4 112% 346 268 -23%
Switzerland 19 14 ↑5 16.7 33.8 102% 342 175 -49%
India 14 15 ↓1 31.7 31.9 1% 780 776 -1%
5
become competitive M&A targets raises questions in terms of whether mergers and
acquisitions create value in emerging markets.
With a current focus on globalisation and the increasingly competitive nature of the
market, mergers and acquisitions continue to be popular as a growth strategy for
multinational companies (Hitt, Hoskisson, & Irelund, 1990; Ellis, Lamont, Reus, & Faifman,
2015). Mergers and acquisitions picked up significantly in 2014 with BRICS (Brazil, Russia,
India, China, and South Africa) playing a major part in the M&A activities globally. All five
countries in BRICS account for more than 40% of the global population (Reddy, 2017)
which means that global companies are seeing more growth prospects in those countries.
BRICS have become and are likely to continue to be the central source of economic
dynamism; as a whole, they accounted for 56% of the growth of global GNP (at 2005 $PPP)
during 2008-17 and are expected to continue to account for more than half of global
economic growth through to 2030 (Reddy, 2017).
The worldwide M&As view between 2007 and 2017 shows a significant decrease of
financials, telecoms and materials industries' M&As by approximately 60% which could
signal less growth in those industries (Thompson Reuters, 2017). There is a significant
increase in M&A activities in healthcare and real estate which poses a question on the
value creation drivers of both industries at the moment, the significant number of
technology industry M&As with low values shows small technology companies are being
acquired or merging.
Mergers and acquisitions have increased significantly over recent years and have become
a vehicle for foreign direct investment (FDI) in emerging markets. Mergers and
acquisitions allow companies making the investment to control assets and manage
production activities in the country in which they are making the investment (Kyaw,
2003). Companies continually look to mergers and acquisitions (M&As) as a form of
restructuring, reorganising existing businesses, diversifying or streamlining their business
6
towards a specific industry to better align their future growth prospects with value
creation for shareholders as a primary focus. According to Carr (2015), even though
mergers and acquisitions have a high failure rate, CEOs and senior management still
pursue M&A as a form of restructuring strategy as literature and studies have shown that
with the right motivations M&A can produce synergies, a sound corporate culture and
value creation for shareholders. M&As are also used to reduce costs and/or increase
market penetration (Lang, 2003) which raises questions about their ability to create value
for shareholders.
Mergers and acquisitions are two of the strategies businesses use to change the course
of where the company is headed and sometimes this process can include downsizing its
current operations for the company to be linear and move faster in capturing future
opportunities, however acquisitions and mergers can be a risky investment that could
either be successful or become a disaster for both companies involved. Some of these
efforts bear no sustainable value to shareholders either in the short run or in the long run.
The overarching purpose of this research is to analyse the impact of M&As on investor
returns by focusing on South Africa as a member of the BRICS alliance.
7
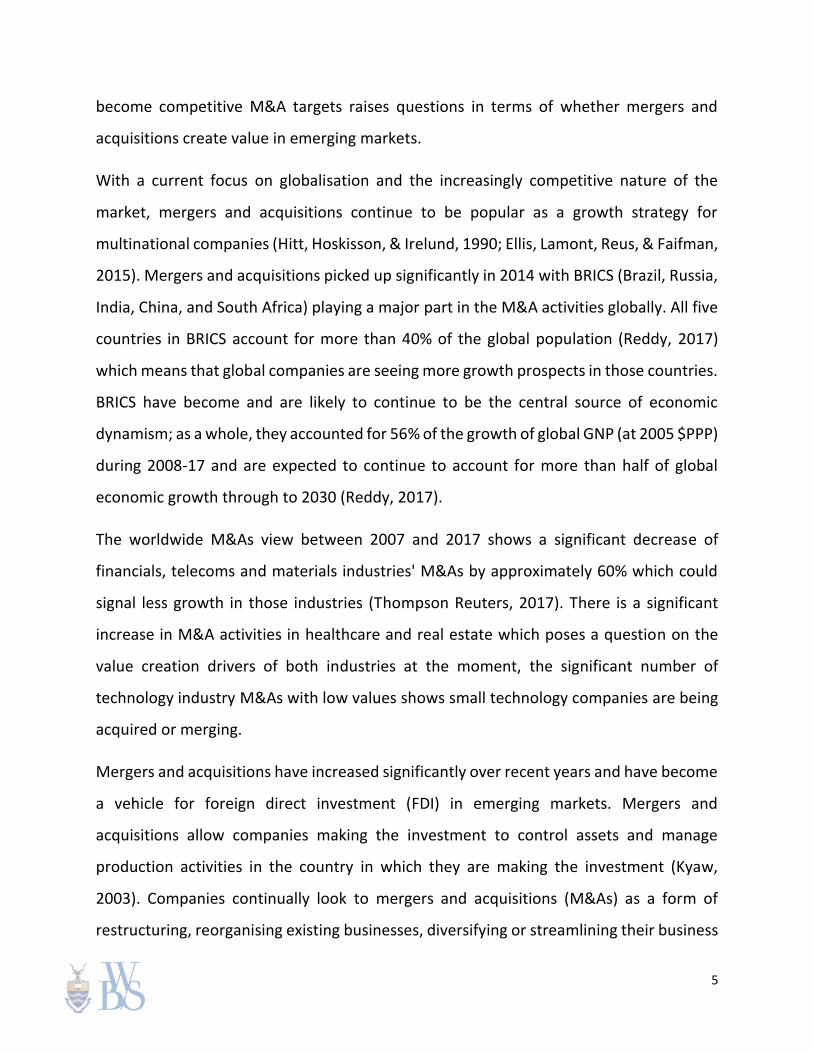
(source: imaa-institute.org)
Figure 1: Mergers & Acquisitions South Africa (1991-2018)
From 1991 through 2017, over 9 000 transactions were performed in South Africa with a
financial value of about 500 billion dollars with 2015 showing the highest transactions
performed by financial value in 25 years. There is an opportunity to evaluate the value
creation from these transactions and the reasons behind significant peaks and downturns
over the past two decades by industry. Four industries accounted for 57% of the top 100
number of deals in South Africa between 1991 and 2018, namely, Metals and Mining,
Other Financials, Banks and Telecommunication services respectively. With South Africa
considered as the richest country in the world with $2.5 trillion in mineral resources by a
Citigroup report (Fin24, 2010), it is no surprise why mergers and acquisitions are more
attractive in the metals and mining sector in South Africa. The year 2014 had the biggest
technology deals, partnerships, mergers and acquisitions announcements in South Africa
(BusinessTech, 2014) which raises questions of the value add in technology deals in
comparison to the other industries.
05101520253035404550
0
100
200
300
400
500
600
700
800
19
91
19
92
19
93
19
94
19
95
19
96
19
97
19
98
19
99
20
00
20
01
20
02
20
03
20
04
20
05
20
06
20
07
20
08
20
09
20
10
20
10
20
12
20
13
20
14
20
15
20
16
20
17
20
18
(Ju
ne
)
20
18
…
Val
ue
of
Tran
sact
ion
s (i
n b
il. U
SD)
Nu
mb
er o
f Tr
ansa
ctio
ns
Mergers & Acquisitions South AfricaNumber
8
1.3 Problem Statement
Uhlenbruck, Hughes-Morgan, Hitt, Ferrier, & Brymer (2017) study indicates that although
mergers and acquisitions are a renowned strategy, the acquiring companies create no or
little value because of their failure to generate synergy, too high premiums, selection of
wrong targets, ineffective processes of integration, amongst others. On the other hand,
careful target selection and the effective implementation of acquisitions creates value
and achieves synergy. Acquisitions which provide fresh knowledge on ways acquiring
firms can be employed in enhancing competitive positioning often generate value. For
instance, the gained knowledge from the acquisitions may enhance modernisation if the
target company has corresponding technologies in the acquiring company. Additionally,
while cross-border acquisitions convey significant openings, they similarly provide
complex contests for creating value.
Recent research in South Africa supports the international results on M&As creating
value. The shareholders of target companies experience short-term abnormal benefits
between 30 and 44% whilst the shareholders of the acquiring firms recorded abnormal
profits of -2 to 11% (Wimberley & Negash, 2004). Ideally, many approaches prevail on
how an acquisition or merger can generate value, including synergies, improvements, and
amplified market power, amongst others. Yet, evidence from the stock exchanges shows
that over 50% of the acquisitions and mergers fail to create value because of deals
reached for the wrong motives. Managers of the firms have private interests in controlling
and building as huge a firm as conceivable (Ellis et al., 2015).
The majority of post-acquisition research employs stock market incident studies that
often are short-term and not recording long-term projected benefits from the acquisition
due to data asymmetries (Cuypers, Cuypers & Martin, 2017).
Ellis et al. (2015) also maintain that because of globalisation, the significance of cross-
border M&As in developing and developed countries is increasing, yet with less research
9
on the generation of wealth by acquirers’ shareholders involved in the cross-border
outbound and inbound acquisitions. Secondly, there is no effort illustrating the integrated
structure for long-term approaches of value creation through advanced methods like
Market Value Added (MVA) and Economic Value Added (EVA). Thirdly, few studies prevail
on whether acquirer and target shareholders create value more in the domestic M&As
than cross-border M&As and which industries create value more seamlessly than others.
Such gaps in prevailing literature need attention for further study in the Mergers and
Acquisitions field.
Companies using mergers and acquisition to create shareholder value have increased in
the last few years and the results of their value-add are somewhat still questionable to a
certain extent. The problem statement this thesis addresses is a question of what has
been the short-term value creation from mergers and acquisition in South Africa over the
past two decades? What were the value creation drivers for M&A activities in South Africa
and which industries yield the most results in the short term by ranking for South Africa
as a target market and why? If the study is able to determine a substantial shareholder
value from using mergers and acquisitions ranking by industries in South Africa, it will
shed light on whether certain M&A industries create value in South Africa taking into
consideration cycles and economic events in the last two decades which is information
relevant for companies and researchers.
1.4 Research Questions
What is the short-term value creation from mergers and acquisition in South
Africa over the past two decades?
What are the value creation drivers for mergers and acquisitions activities in South
Africa?
What is the value creation, if any, by industry ranking, for South Africa?
10
1.5 Significance of the Study
This study reveals if the creation of value by M&As has consequences for imminent
regulatory policies in South Africa. The justification is that since the activity of mergers
and acquisitions is expensive, there would be serious questions on the efficiency impact
of the regulatory policy where the resultant M&A does not create value and or even
destroys value for involved firms. This study also provides evidence on if there is an
occurrence of value gains and the types of dealings most likely to cause such value gains.
This study proves that if the merged businesses create value due to market powers
allowing them to charge very competitive prices, the positive value gained from such
mergers can be adversarial from the anti-trust viewpoint. In contrast, where the firms
create value due to becoming very competitive, efficient and moving market shares from
the less effective competitors, then the Mergers and Acquisitions cannot be a severe
worry for the anti-trust watchdogs.
The study helps the research attain more understanding of value creation through
mergers and acquisitions in South Africa. From this study, the researchers understand
that it might be useful for firm managers to dedicate the scarce resources and time to
consolidation undertakings where mergers are creating value. In this study, the
researcher shall also understand that managerial efforts should profitably be directed
into other actions like improving productivity and efficiency where the mergers have no
or less impact on value creation or perhaps destroying the value.
The study adds to the current literature on value creation through mergers and
acquisitions in South Africa by testing a larger sample across various industries over two
decades and fill a gap in that it gives investors and other relevant stakeholders a new
informative perspective on South Africa for mergers and acquisitions that yield the
desired results for shareholders and the reasons why. It adds to the current studies of this
11
topic, focusing on ranking mergers and acquisition by value-add in the short term.
Through analysing value creation of mergers and acquisitions over two decades, the
research provides a comprehensive view of value creation through mergers in South
Africa which clears some of the contradictory results of value creation studies performed
using different points in time from a South African context.
1.6 Structure of the Final Thesis
Chapter 2 of the thesis covers the literature review and summarises the findings which
include reviewing books, journals, theses and papers reflecting work that has already
been conducted on mergers and acquisitions. Chapter 3 of the thesis captures the
research methodology utilised in analysing the data. Chapter 4 of the thesis presents the
results of the study and Chapter 5 of the thesis discusses the results obtained in chapter
4 and provides conclusions of the study.
Chapter Summary
South Africa is an important market for M&As as it contributed 50% of the mergers and
acquisitions in Africa as a target nation between 2003 and 2012, it is also the most active
acquirer in Africa having initiated 37% of deals in Africa between 2003 and 2012 (Ellis et
al., 2015). Even thou there is evidence of short-term benefit to the target company during
a merger or acquisition and in some studies, there is no evidence, the unclear conclusion
forms the basis and motivation for conducting this study.
12
CHAPTER 2: Literature Review
2.1 Introduction
This chapter presents the literature review on mergers and acquisitions. The chapter is
arranged as follows: Section 2.2 discusses the nature and history of mergers and
acquisition transactions. Section 2.3 presents the mergers and acquisition payment
considerations used. Section 2.4 explores the motives for mergers and acquisition
activities. Section 2.5 discusses the short-term and long-term value creation through
mergers and acquisitions. Section 2.6 discusses the formulation of the hypotheses and
closes the literature review with a summary of key findings from the review.
2.2 Nature and History of Mergers and Acquisitions (M&A) Transactions
A merger is a combination of two or more companies in which the assets and liabilities of
the selling firm(s) are absorbed by the buying firm. Although the buying firm may be a
considerably different organisation after the merger, it retains its original identity (Scott,
2003). Mergers may involve two or more parties in the transaction but often only two
parties are involved where the target company would be the company being acquired and
the acquiring company being the company that is acquiring the target company. The
shareholders of the acquiring entity typically continue holding shares of the newly formed
entity.
Scott (2003) defines acquisition as the purchase of an asset such as a plant, a division, or
even an entire company. It refers to an entity acquiring another entity through mostly
obtaining the majority stake in the entity it has acquired. An acquiring company becomes
13
bigger after the merger transaction. An acquisition does not result in a change of the
entity’s name or legal structure once completed, the acquired entity forms part of the
acquiring company and ceases to exist independently.
There are different types of mergers and acquisitions. A horizontal merger is the
acquisition of a competitor who is usually within the same line of business as the acquiring
entity (Peavler, 2018). This kind of merger or acquisition is used as a form of gaining a
competitive edge, cost savings and an increase in various product segments. A horizontal
merger or acquisition can be an entity in healthcare merging or acquiring another entity
in healthcare as well. In Nead’s (n.d.) article called Merge or die, he illustrated that when
consolidation follows growth, enemies become friends and bitter rivals can find healthy
new profits in strategic collusion through M&A.
There is a belief by most managers and academics that horizontal mergers and
acquisitions create value and abnormal returns about which Barney (1988) studied the
hypothesis of relatedness within two companies as a recipe to abnormal returns.
Relatedness from a finance perspective is when two companies have a Net Present Value
(NPV) that is more if they are combined into one than when they are operating separately
(Copeland & Weston, 1983, as cited in Barney, 1988). In his findings, he concluded that
relatedness of the acquiring firm with the target is not sufficient to yield abnormal returns
but unique attributes that allow synergies to be achieved and transformed into cash flows
that is able to attain abnormal returns.
To evaluate the effects of a horizontal merger on prices of goods, Weinberg (2007)
discussed the three approaches normally used which are event study, merger simulation
and a direct comparison of prices pre- and post the merger. Weinberg (2007) analysed
the previous studies by Anshenfelter and Hosken (2004), Hosken and Taylor (2006),
Barton and Sherman (1984) and others, on the effects of horizontal mergers on prices of
goods sold by the acquiring company competitors pre and post-merger in the short run.
14
Nine studies carried out over the past 22 years concluded that most mergers result in an
increase of goods sold by the acquiring companies as well as that of the competitors in
the short run before and after the completion of the transaction. The studies highlighted
how efficiency is mostly attainable in the short run once the merger is in place and that it
ultimately outweighs gains from the power attained in the market as a result of the
horizontal merger for small mergers.
A vertical merger or vertical integration happens when the acquiring firm acquires buyers
or sellers of goods and services to the company (Peavler, 2018). The reasons behind a
vertical M&A is typically to reduce or eliminate dependency in a supplier, cost-cutting and
gaining more economies of scale to grow the entity. If a healthcare company enters into
a merger or acquisition with one of its suppliers in their product offering, this would be
regarded as a vertical M&A.
A conglomerate merger or acquisition is a type of merger whereby the two companies
that merge with each other are involved in different sorts of businesses (Economy watch,
2010). Typically, there are two types of conglomerates. The mixed conglomerate mergers
are those where the companies that are merging with each other are doing so with the
main purpose of gaining access to a wider market and client base or for expanding the
range of products and services that are being provided by them; the pure conglomerate
merger is one where the merging companies are businesses that are totally unrelated to
each other. The main purpose of a conglomerate M&A is to diversify business risks which
help to reduce the inherent risk in its current entity. When the inherent risk is reduced
through a conglomerate, the entity is able to have stable cash flows because if the other
entity is not performing, the first one will help offset which helps with maintaining a stable
and predictable cash flow and business revenues.
Mergers and acquisitions occurred in different waves which were identified to have begun
in the late eighteenth century and each wave reflected various economic, regulatory and
15
financial events during those periods as research has shown that "merger waves tend to
be caused by a combination of economic, regulatory and technological shocks" (Gaughan,
2011, p.15).
The economic shock comes in the form of an economic expansion that motivates
companies to accommodate a rapidly growing aggregate demand in the economy
(Mitchell & Mulherin, 1996). Regulatory shocks can occur through the elimination of
regulatory barriers that might have prevented corporate combination activities and
technological shocks can come in many forms as technological change in existing
industries and can even create new ones (Gaughan, 2011). It is unclear from various
research why mergers and acquisitions started and who started them, but the end of each
wave was driven by these shocks such as the great depression, the Sherman Antitrust Act
and stock market crash.
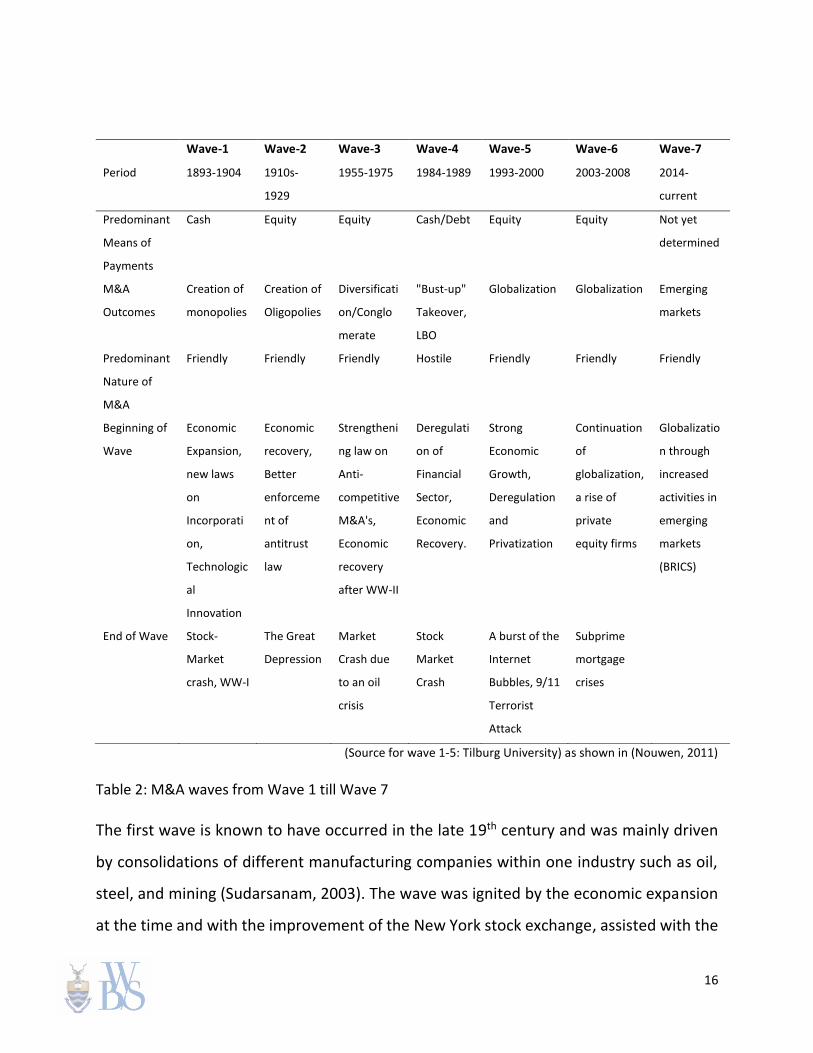
Table 2 summarises the M&A waves from 1893 to date and how mergers and acquisitions
have evolved over 125 years.
16
(Source for wave 1-5: Tilburg University) as shown in (Nouwen, 2011)
Table 2: M&A waves from Wave 1 till Wave 7
The first wave is known to have occurred in the late 19th century and was mainly driven
by consolidations of different manufacturing companies within one industry such as oil,
steel, and mining (Sudarsanam, 2003). The wave was ignited by the economic expansion
at the time and with the improvement of the New York stock exchange, assisted with the
Wave-1 Wave-2 Wave-3 Wave-4 Wave-5 Wave-6 Wave-7
Period 1893-1904 1910s-
1929
1955-1975 1984-1989 1993-2000 2003-2008 2014-
current
Predominant
Means of
Payments
Cash Equity Equity Cash/Debt Equity Equity Not yet
determined
M&A
Outcomes
Creation of
monopolies
Creation of
Oligopolies
Diversificati
on/Conglo
merate
"Bust-up"
Takeover,
LBO
Globalization Globalization Emerging
markets
Predominant
Nature of
M&A
Friendly Friendly Friendly Hostile Friendly Friendly Friendly
Beginning of
Wave
Economic
Expansion,
new laws
on
Incorporati
on,
Technologic
al
Innovation
Economic
recovery,
Better
enforceme
nt of
antitrust
law
Strengtheni
ng law on
Anti-
competitive
M&A's,
Economic
recovery
after WW-II
Deregulati
on of
Financial
Sector,
Economic
Recovery.
Strong
Economic
Growth,
Deregulation
and
Privatization
Continuation
of
globalization,
a rise of
private
equity firms
Globalizatio
n through
increased
activities in
emerging
markets
(BRICS)
End of Wave Stock-
Market
crash, WW-I
The Great
Depression
Market
Crash due
to an oil
crisis
Stock
Market
Crash
A burst of the
Internet
Bubbles, 9/11
Terrorist
Attack
Subprime
mortgage
crises
17
ease of corporations obtaining capital to engage in M&A activities. The mergers were
financed through cash and their nature was regarded as friendly which means that the
approval and consent of the acquired company's management was obtained. There were
a lot of horizontal mergers during this wave which started to create a monopoly in the
market and ultimately laws to govern this, such as the Sherman Antitrust Act 1, were
introduced to limit monopolies that could hurt the competitiveness of a specific industry.
The first wave is known to have ended due to the stock market crash in 1905 and the
beginning of the first world war. The introduction of the Sherman Antitrust Act also
somewhat contributed to the end of the first wave as it made it more difficult for mergers
of a monopolist nature to occur.
The second wave began in the early 20th century after the first world war as the economy
started to recover, which primarily focused on merger activities in the iron industry, food,
printing, and paper and was smaller in deal size compared to the first wave. The first wave
exceeded more than 15% of the total assets in the US market and the second wave had
an impact of less than 10% (Sudarsanam, 2003). The financing of the merger activities
changed from being financed by cash to being financed by equity and were still regarded
as friendly mergers where approval was obtained by the management of the acquired
entity. During the second wave, there were still concerns about the monopolies
dominating the market. The second wave was driven by vertical mergers and not
horizontal mergers like the first wave. The second wave ended due to the market crash
in 1929 which led to the great depression across the world.
The third wave had a delayed start due to the great depression and the second world war
which was from 1939 to 1945. There were further laws imposed to prevent anti-
competitiveness in mergers and acquisitions as this was prominent in the second wave as
well. The third wave had diversifications in the form of conglomerates’ mergers and
acquisitions which means that the purchases were unrelated companies to diversify
18
portfolios and minimise risks. Diversification also assists with cash flow volatility because
if one division makes losses, they can be offset by profits in another unrelated division.
The third wave was financed through capital, like the second wave, and the mergers and
acquisitions activities were still regarded as friendly.
Examples of conglomerates are Philips which was founded in 1891 with divisions in
consumer lifestyle, healthcare, and lighting as well as Unilever which was founded in
1930. Unilever was founded through a merger of a Dutch margarine producer, Margarine
Unie, and Lever brothers which were soap makers. Unilever produces foods, beverages,
cleaning, and personal healthcare products. The third wave ended due to the economic
recession as a result of the oil crises.
The fourth wave started in the late 1980s and M&As were hostile in nature which means
that they were carried out without the approval of the acquired company's management.
The fourth wave was higher in size compared to the third wave; they were financed
through debt and cash which was different from the equity financing in the third wave.
This created the leveraged buyout (LBO) approach to financing mergers and acquisitions
which means that the mergers and acquisitions were financed through external debt. The
fourth wave ended due to the stock market crash.
The firth wave began in the 1990s when the economy was doing well and had recovered
from the world war and great depression. The financial markets were at their peak,
mergers and acquisitions began to grow outside of the US to European countries. The
concept of globalisation came into play at the time which brought the ability of companies
to perform mergers and acquisitions outside their home countries through cross-border
mergers and acquisitions. Companies were able to seek growth which is one of the major
drivers of M&A activities and empires were able to be build worldwide.
The fifth wave was more focused on the technological advancements to be more
competitive in the market. It was regarded as friendly, compared to the fourth wave
19
which was more hostile. The firth wave ended due to an economic recession and the
internet boom phase played a role when the global stock markets crashed.
The sixth wave was a continuation of globalisation as a lot of companies continued to
enter into cross-border mergers and acquisitions. Private equity firms emerged and were
becoming successful as shareholders spread ownership of their companies between
themselves, institutional investors and management tasked to run the day-to-day
management of the company. The sixth wave was financed through the use of equity.
Sudarsam (2003) suggests that the sixth wave was as a result of emerging markets starting
to play a vital role in mergers and acquisitions as well. The sixth wave is known to have
ended due to the financial crises in the United States which began in 2007.
The seventh wave is known to have started in 2014 and more dominated by horizontal
mergers through the acquisition of emerging market companies. BRICS plays a significant
role in mergers and acquisition activities of which empirically, research into the value
creation for shareholders through M&A with focus on emerging markets should be done,
and the motives behind BRICS starting to play a significant role in the M&A space
currently.
2.3 Mergers and acquisition payment considerations
Merger and acquisition transactions can be paid for in cash, securities or a combination
of both. Securities can be in the form of using stock types, such as common stock or
preferred stock and debentures to finance the transaction. The valuation of the shares
can be determined by dividing the number of shares during a pre-specified period which
is called a pricing period (Gaughan, 2011). The pricing period consists of a specific number
of days or months pre and post the announcement of the transaction. The price can either
be fixed or floating during the timeframe of the negotiations which is dependent upon
the parties to the transaction.
20
The payment can be made upon the conclusion of the transaction or over specific
milestones, such as the performance of the acquired entity or securities redeemable after
a specific timeframe. Cash would be considered an easy form of payment when a large
entity acquires a small entity but a challenge when the consideration is more significant
as the acquiring entity might have to borrow money to finance the transaction which
increases the cost of capital for an M&A activity, so the form of payment is quite
important in the process.
Previous research (e.g., Mauboussin, 2017) shows that the stock market favours cash
deals more than stock deals as it is assumed that if the acquirer sells stock to raise funds
for the transaction, it only does so when the stock is expensive which then creates a mixed
signal on the acquirer’s intentions. Mauboussin (2017) further illustrated that in a stock
for stock deal, the risk and rewards from the transaction is shared between the two
companies but if it is a cash deal then the risk and rewards transfer to the acquirer which,
for the market, can be seen as a strong signal, but weak if it is a stock for stock transaction.
Furthermore, there is an advantage in the market when doing mergers and acquisition
activities first before the rest of the other companies do so as it allows the company to
choose from more opportunities than when others are also leveraging the same
information to make moves in the M&A space.
2.4 Motives for M&As
There are various reasons for M&As. The most common reason is for synergy. Synergy
occurs when two or more companies combine and either generate more profits or reduce
costs together (Vaidya, 2018). Synergy suggests that there are benefits that can only be
realised when two companies are jointly operating than when they are operating apart.
Synergies allow growth through revenue, reduction in costs or improvements in any
financial synergies.
21
Revenue synergy is when two companies are able to generate more profits if together,
than when they are separate, this is mainly driven by their ability to leverage each other’s
resources to generate more profits. Revenue synergies, which are usually given less
weight, come from the ability to create greater revenue through a combined company
than the sum of the independent companies’ revenues (Stowell, 2010). With managers
believing that it Is easy to buy growth than build it (Cordeiro, 2014), mergers and
acquisitions become a preferred method of inorganic growth than organic growth for
generating revenue as well.
Having companies joined through a merger or acquisition allows for ease of patent access
which can enable them to create joint products from their patents that are more
competitive in the market thereby increasing revenue. Mergers or acquisitions where
both companies have various geographic foci allows the products from an M&A to have
cross access to these geographies which increases revenue. If two companies were selling
complementary products, a merger or acquisition allows for bundling products to allow a
more solution-driven sales approach in the market which ultimately increases revenue
through this synergy.
Cost synergy occurs when two companies are able to save or reduce costs if combined
that if they are separate. Cost synergies are most important, and they arise through
efficiencies created by the elimination of redundant activities, improved operating
practices, and economies of scale (Stowell, 2010). Notable cost savings as a result of a
merger or acquisition are supply chain efficiencies realised from both companies
leveraging each other's processes and best practices as well, Information technology
sharing and patents access that allows the best and most value-adding approaches to be
shared and implemented. There are also cost savings from salaries and wages as a result
of eliminating duplicated roles which also becomes a process of ensuring the best
employees are what is left between the two companies from various departments.
22
Financial synergy is the ability to have a reduced cost of capital when two companies are
joined together than if separate as the bigger the organisation is the less a risk premium
is for loans. Most organisations do not target to achieve all three types of synergies but a
maximum of each or two depending on their intentions from the transaction.
The second benefit of mergers and acquisitions is that it allows for an instant increase in
market share without having to do anything specific to obtain it. The companies engaging
in a merger or acquisition are able to transfer their customer base which results in an
increase in market share. This form is regarded as simpler than organic growth in market
share as the company would have to engage in various initiatives, such as selling price
cutting (Cordeiro, 2014), increase spend in marketing and advertising, introducing new or
enhanced products in the market, etc. which can take longer to yield results, but with
mergers this happens instantly.
Economies of scales refer to reducing the average cost price per unit by increasing the
volume of production. This is one of the advantages of mergers and acquisitions as the
joint production allows for higher volumes to be produced which ultimately reduces the
average cost price per unit. The economy scope means saving costs by producing more
variety of offerings from sharing common resources. Certain strategic mergers or
acquisitions realise economy of scope as a focus to reducing costs while leveraging the
reduction in similar departments, focusing on efficient and cheaper distribution channels
and marketing costs.
As a result of mergers and acquisition, companies can share knowledge and skills set
easily and freely which promotes higher synergies and smarter solutions from joint
efforts. Both companies are able to leverage the best technical personnel as well as
attract talent from the M&A activities that allow the company to offer better
opportunities from its increase in size.
23
Companies engaging in mergers and acquisition activities are able to assess all of their
assets and only keep focused assets necessary for the growth of the organisation
collectively which can provide higher asset efficiencies.
One of the reasons for mergers and acquisitions is if an entity sees market imperfections
and explores them mostly through cross-border mergers and acquisition activity.
Globalisation has enabled companies to seek growth, competitive advantage,
transformation, etc. in most countries in the world which puts fewer limitations to
opportunities in the market but at the same time, an opportunity to leverage flows in
certain markets and some researchers like Gonzalez, Vasconcellos and Kish (1998) looked
into and offered support for the hypothesis that undervalued companies are a motivation
for cross-border mergers and acquisitions through the interdependencies from
relationships through globalisation.
2.5 Short-Term and Long-Term Value Creation Through Mergers and Acquisitions
Cartwright and Schoenberg (2006) did a consolidation and analysis of mergers and
acquisitions activities for the last 30 years and future opportunities looking at the
financial, strategic, behavioural, operational and cross-culture aspects. Agrawal and Jaffe
(2000) concluded in their research, that the target firm enjoys positive short-term returns
in general, but bidding firms frequently experience share price underperformance in
months after acquisitions which result in negligible overall wealth gain for portfolio
holders.
There is a belief that the weight of evidence shows takeovers bring positive short-term
returns for shareholders of the target firm but the long-run benefit to investors in
acquiring firms is more questionable (Cartwright & Schoenberg, 2006). Conn, Cosh, Guest,
& Hughes (2001) found that approximately 35-45% of acquirers do achieve positive
returns in two to three years’ post-acquisition using standard deviations in the order of
24
10% around the mean return while Kitching (1974) reported failures of 46-50% based on
manager’s self-report, in Rostand and Schoenberg (1994), similar failure rates were
reported of 44-45% using comparable methodology, which means the trend has not
improved.
2.6 Formulating the Hypotheses
Based on the research questions the thesis sought to answer within the focus area of
mergers and acquisitions, the following are the null hypotheses that guides the empirical
research;
Hypothesis 1.1:
H0: Bidders stock returns are negative or no effect on stock price upon the
announcement of the acquisition.
H1: Bidders stock returns are positive upon the announcement of the acquisition.
Hypothesis 1.2:
H0: Target stock returns are negative or no effect on stock price upon the
announcement of the acquisition.
H1: Target stock returns are positive upon the announcement of the acquisition.
Chapter Summary
Mergers and acquisition activities have evolved in the last 125 years since they started,
the evidence of various waves shows the macroeconomic and regulatory elements that
have resulted in their peaks and downturns by the quantity and by deal values. Equity
dominated the majority of waves as a preferred form of payment to finance a merger or
acquisition and mostly was of a friendly nature rather than hostile takeovers. The motives

25
of why mergers and acquisitions exist may have varied in the last 125 years but most of
the motives are still prominent in the current wave, such as exploring different synergies,
using M&A to instantly grow the business, and streamlining the business to focus on a
specific industry.
26
CHAPTER 3: Research Methodology
3.1 Introduction
This chapter focuses on the research methodology and process of gathering the data that
was used to test the research questions and address the research objectives. The chapter
is structured as follows: Section 3.2 discusses the data and the data sources used to test
the hypotheses defined for the research. Section 3.3 provides the research design applied
to test the defined hypotheses and concludes with a chapter summary.
3.2 Data and Data sources
The data needed for this research was mainly mergers and acquisition transactions for
acquirer companies listed on the JSE that completed their M&A transactions between
January 1997 and December 2017. To be included in the analysis, the acquiring company
should have at least 200 days of price data before the M&A announcement. According to
Bartholdy, Oldon and Peare (2007) and the studies of Georgenes and Renneboog (2004),
estimation periods are set to be between 200 and 250 trading days which is equivalent to
between 9 to 12 months of traded stock price data. Also, the acquirer should have a
majority stake in the target company. A company is believed to have the majority stake
in a company when it purchases 50% or more stake in another company.
The data was obtained from Bloomberg. Bloomberg has a comprehensive data for
worldwide announced, pending, completed and cancelled mergers and acquisitions. The
research questions of the thesis and hypotheses were used to guide the data selection
for performing the research. As the focus of the thesis is on the value creation through
mergers and acquisitions in South Africa, the data was gathered for mergers and
acquisitions activities in South Africa.
27
Firstly, the criteria used is that the transaction should be classified as a merger or
acquisition due to the research only focusing on those two areas, other deal types, such
as investments and joint ventures are excluded from the sample. Secondly, the deal had
to have been announced between 01 January 1997 and 31 December 2017 which
captures two decades of mergers and acquisitions activities in South Africa. Two decades
seems sufficient to capture any mergers and acquisitions waves as well as economic
cycles in the South African economy.
Thirdly, the merger or acquisition is completed because the thesis focuses on the value
creation through mergers and acquisition which means that the value will not be
measurable on a deal that is not yet concluded. Sorheim and Lerkerod (2015) believe that
including deals that are not completed has a risk of the market already anticipating non-
completion which would mean the deals might not have any significant price movements.
The fourth criterion applied was that the M&A acquirer or target is publicly listed on the
Johannesburg Stock Exchange and transaction results in the bidding firm owning the
majority stake of the target company which is measured by obtaining more than 50% of
the shares. A company is believed to have the majority stake in a company when it
purchases 50% or more stake in another company. The reason for selecting to use publicly
traded companies is because it makes it easy to track daily share price movements in stock
prices which is a requirement in using the event study; as a result, the sample is not based
on matched deals between acquirers and bidders, hence the asymmetric number of
acquirer and target companies.
The firth criterion applied is that sufficient financial data prior to the announcement is
available to use and stock prices are available ~250 days before the announcement and
at least ~10days after the announcement. According to Bartholdy, Oldon and Peare
(2007) and the studies of Georgenes and Renneboog (2004), the estimated periods are
set to be between 200 and 250 trading days which is equivalent to between 9 to 12
28
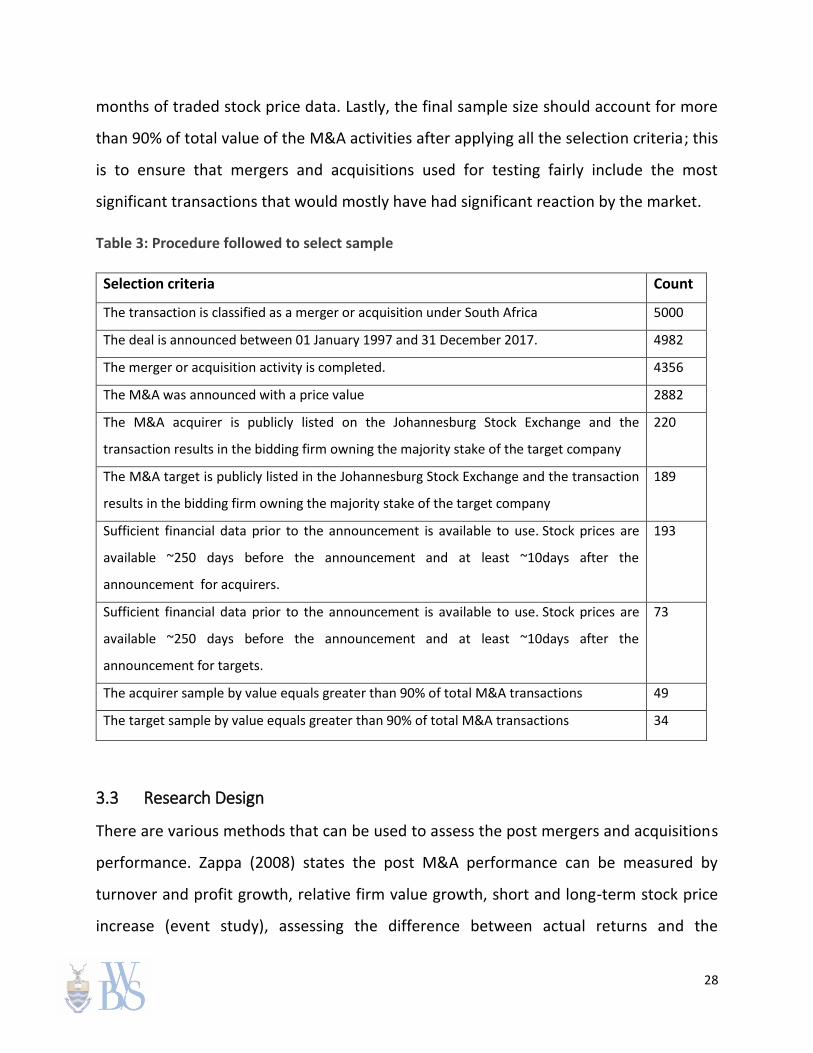
months of traded stock price data. Lastly, the final sample size should account for more
than 90% of total value of the M&A activities after applying all the selection criteria; this
is to ensure that mergers and acquisitions used for testing fairly include the most
significant transactions that would mostly have had significant reaction by the market.
Table 3: Procedure followed to select sample
Selection criteria Count
The transaction is classified as a merger or acquisition under South Africa 5000
The deal is announced between 01 January 1997 and 31 December 2017. 4982
The merger or acquisition activity is completed. 4356
The M&A was announced with a price value 2882
The M&A acquirer is publicly listed on the Johannesburg Stock Exchange and the
transaction results in the bidding firm owning the majority stake of the target company
220
The M&A target is publicly listed in the Johannesburg Stock Exchange and the transaction
results in the bidding firm owning the majority stake of the target company
189
Sufficient financial data prior to the announcement is available to use. Stock prices are
available ~250 days before the announcement and at least ~10days after the
announcement for acquirers.
193
Sufficient financial data prior to the announcement is available to use. Stock prices are
available ~250 days before the announcement and at least ~10days after the
announcement for targets.
73
The acquirer sample by value equals greater than 90% of total M&A transactions 49
The target sample by value equals greater than 90% of total M&A transactions 34
3.3 Research Design
There are various methods that can be used to assess the post mergers and acquisitions
performance. Zappa (2008) states the post M&A performance can be measured by
turnover and profit growth, relative firm value growth, short and long-term stock price
increase (event study), assessing the difference between actual returns and the
29
previously expected returns (abnormal returns) and also the present value of the post-
M&A incremental cash flows. The research obtained estimated abnormal returns of each
firm sampled and accumulated them, which was achieved through the use of an event
study as the event study shows the value created for shareholders overall and is the most
important aspect of the research. The results were then used to test the hypotheses
described. The research was carried out by running regressions on various dependent
variables on the cumulative abnormal returns, if any existed, using the event study
methodology.
3.3.1 Event Study
An event study can be described as a statistical method used to assess the impact an
event has on the value of a company. The event study methodology was used in a paper
by Fama, Fisher, Jensen, & Roll (1969) which was developed for application in the New
Centre for Research in Security Prices (CRSP) monthly data for the New York Stock
Exchange stocks (Binder, 1998). The method has been used commonly to examine the
behaviour of a company's share price during events such as mergers, acquisitions,
changes in the leadership of an organisation, earnings announcements, etc.
According to Blinder (1998), the event study method has become a standard method of
measuring price reaction to some announcement or event, it is commonly used to test
the null hypothesis that the market efficiently incorporates information and also under
the maintained hypothesis of market efficiency when it comes to publicly available
information in order to examine the impact an event has on the wealth of shareholders
of a company.
The use of the event study provides better results in estimating the value creation using
mergers and acquisition because, according to the market efficiency hypothesis in Fama
et al. (1969), the price of shares represents the present value of future cash flows
expected from the assets of the firm at a given time which reflects all available
30
information about the firm’s current and future earnings potential. The event study
process was followed in the next steps.
3.3.1.1 Determine Dates
To perform the event study, it was important to identify the expected returns to derive
the abnormal returns or losses that could arise from an event. An estimation period
should be used to determine the expected returns of a stock and in this analyses, 12
months before the event occur was used as it is sufficient and will not be affected even if
it is increased to infinity. According to Bartholdy, Oldon and Peare (2007) and the studies
of Georgenes and Renneboog (2004), the estimated periods are set to be between 200
and 250 trading days which is equivalent to between 9 to 12 months of traded stock price
data.
Choosing this as an estimation period covered the true and normal return of the stock
and also assumed no sampling errors in the coefficients of the chosen model used as the
sampling error variance term asymptotically approaches zero (Sorheim & Lerkerod,
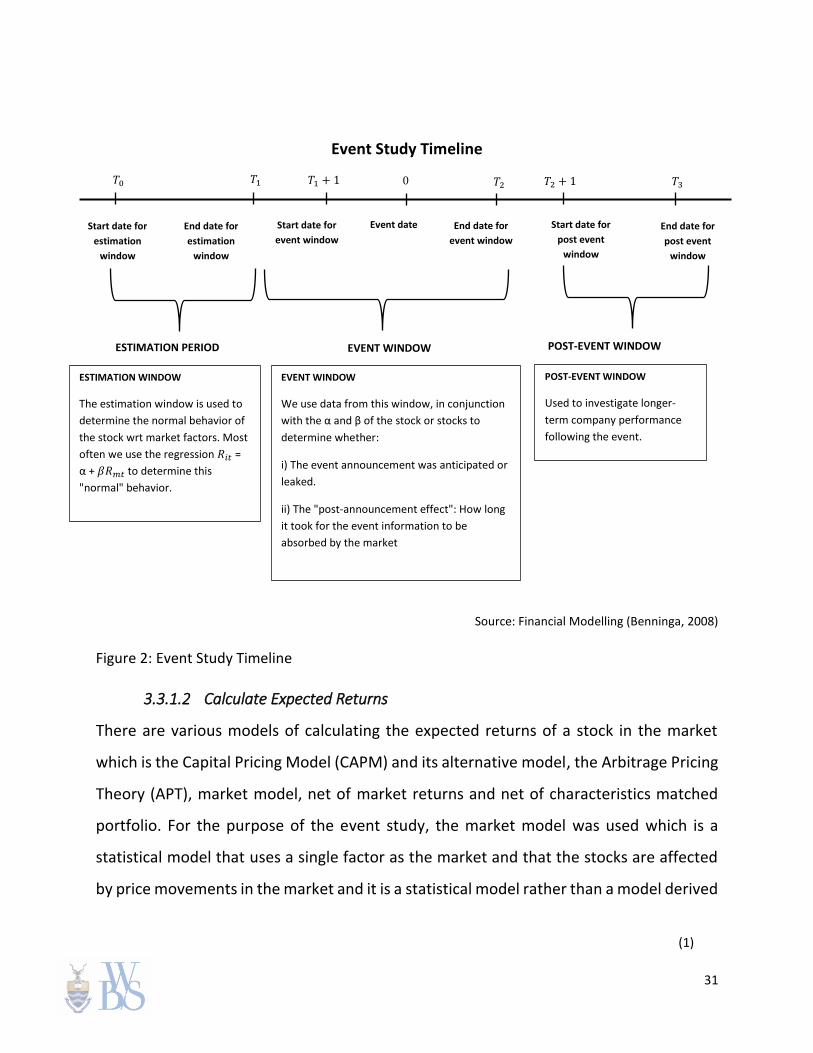
2015). As shown below in figure 2, the initial day in the estimation period was regarded
as 𝑇0 with daily notification of time referred to as t which meant the estimation period
ranged between 𝑇0 to 𝑇1 and event occurs at time 0 with start date for the event window
being from 𝑇1 + 1 to 𝑇2. The post-merger or acquisition period was represented by 𝑇2 +
1 to 𝑇3 . For the study, an event window of 21 days was selected ( -10,0,10) which
reflected results 10 days prior to the event announcement date and 10 days post the
event announcement date.
31
Event Study Timeline
Source: Financial Modelling (Benninga, 2008)
Figure 2: Event Study Timeline
3.3.1.2 Calculate Expected Returns
There are various models of calculating the expected returns of a stock in the market
which is the Capital Pricing Model (CAPM) and its alternative model, the Arbitrage Pricing
Theory (APT), market model, net of market returns and net of characteristics matched
portfolio. For the purpose of the event study, the market model was used which is a
statistical model that uses a single factor as the market and that the stocks are affected
by price movements in the market and it is a statistical model rather than a model derived
𝑇0 0
00
Start date for
estimation
window
End date for
estimation
window
Start date for
event window
Event date End date for
event window
Start date for
post event
window
End date for
post event
window
(1)
𝑇1 𝑇1 + 1 𝑇2 𝑇3 𝑇2 + 1
ESTIMATION PERIOD EVENT WINDOW POST-EVENT WINDOW
ESTIMATION WINDOW
The estimation window is used to
determine the normal behavior of
the stock wrt market factors. Most
often we use the regression 𝑅𝑖𝑡 =
α + 𝛽𝑅𝑚𝑡 to determine this
"normal" behavior.
EVENT WINDOW
We use data from this window, in conjunction
with the α and β of the stock or stocks to
determine whether:
i) The event announcement was anticipated or
leaked.
ii) The "post-announcement effect": How long
it took for the event information to be
absorbed by the market
POST-EVENT WINDOW
Used to investigate longer-
term company performance
following the event.
32
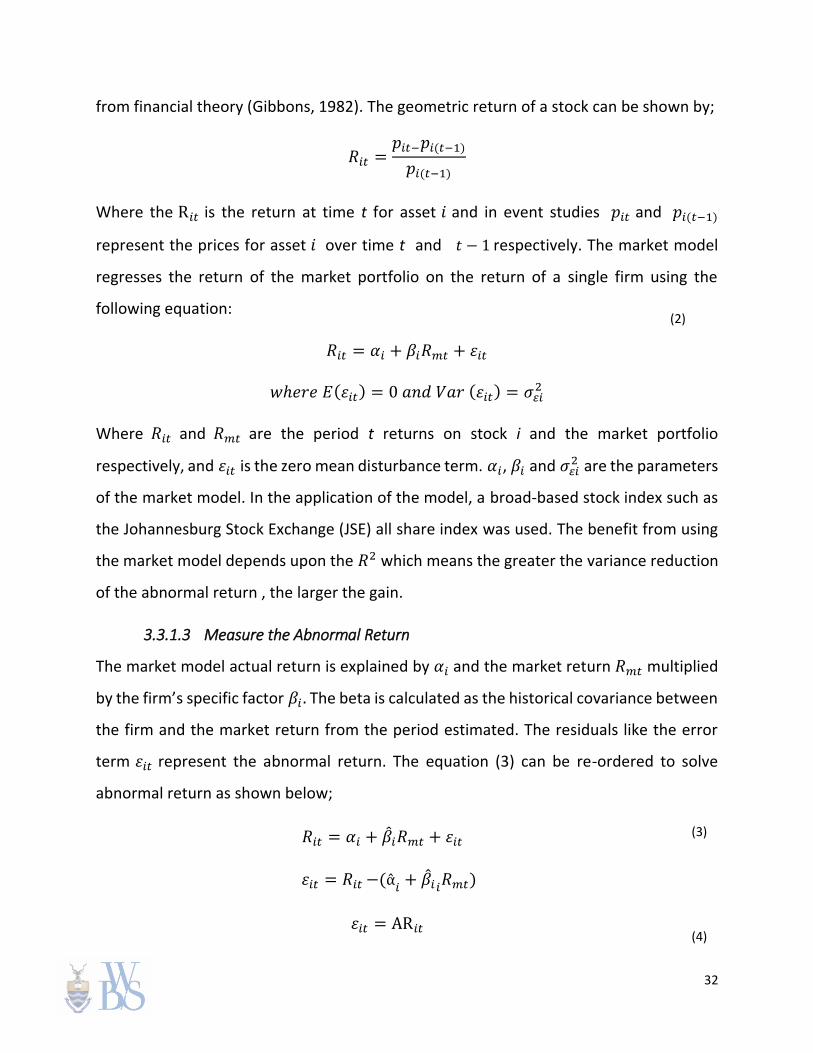
from financial theory (Gibbons, 1982). The geometric return of a stock can be shown by;
𝑅𝑖𝑡 =𝑝𝑖𝑡−𝑝𝑖(𝑡−1)
𝑝𝑖(𝑡−1)
Where the R𝑖𝑡 is the return at time t for asset 𝑖 and in event studies 𝑝𝑖𝑡 and 𝑝𝑖(𝑡−1)
represent the prices for asset 𝑖 over time t and 𝑡 − 1 respectively. The market model
regresses the return of the market portfolio on the return of a single firm using the
following equation:
𝑅𝑖𝑡 = 𝛼𝑖 + 𝛽𝑖𝑅𝑚𝑡 + 𝜀𝑖𝑡
𝑤ℎ𝑒𝑟𝑒 𝐸(𝜀𝑖𝑡) = 0 𝑎𝑛𝑑 𝑉𝑎𝑟 (𝜀𝑖𝑡) = 𝜎𝜀𝑖2
Where 𝑅𝑖𝑡 and 𝑅𝑚𝑡 are the period t returns on stock i and the market portfolio
respectively, and 𝜀𝑖𝑡 is the zero mean disturbance term. 𝛼𝑖, 𝛽𝑖 and 𝜎𝜀𝑖2 are the parameters
of the market model. In the application of the model, a broad-based stock index such as
the Johannesburg Stock Exchange (JSE) all share index was used. The benefit from using
the market model depends upon the 𝑅2 which means the greater the variance reduction
of the abnormal return , the larger the gain.
3.3.1.3 Measure the Abnormal Return
The market model actual return is explained by 𝛼𝑖 and the market return 𝑅𝑚𝑡 multiplied
by the firm’s specific factor 𝛽𝑖 . The beta is calculated as the historical covariance between
the firm and the market return from the period estimated. The residuals like the error
term 𝜀𝑖𝑡 represent the abnormal return. The equation (3) can be re-ordered to solve
abnormal return as shown below;
𝑅𝑖𝑡 = 𝛼𝑖 + �̂�𝑖𝑅𝑚𝑡 + 𝜀𝑖𝑡
𝜀𝑖𝑡 = 𝑅𝑖𝑡 −(α̂𝑖
+ �̂�𝑖𝑖𝑅𝑚𝑡)
𝜀𝑖𝑡 = AR𝑖𝑡
(2)
(3)
(4)

33
𝜀𝑖𝑡 = 𝑅𝑖𝑡 −(𝛼̂𝑖
+ �̂�𝑖𝑅𝑚𝑡)
Where AR𝑖𝑡 represent the abnormal return for a single firm at one point in time and 𝑅𝑖𝑡 is
the actual return.
3.3.1.4 Accumulate the Abnormal Return
Once the average return of each stock included in the sample was calculated, the average
returns for the specific window was added to finalise the cumulative Abnormal Return
known as CAR for each stock which can be represented as below;
𝐶𝐴𝑅𝑖(𝑡1 + 1, 𝑡2) = ∑ 𝐴𝑅𝑖𝑡
𝑡2
𝑡=𝑡1+1
Adding the average returns across companies at one point in time and dividing it with the
number of observations (N) is how the Average Abnormal Return (AAR) is obtained at a
specific point in time;
𝐴𝐴𝑅𝑡 =1
𝑁∑ 𝐴𝑅𝑖𝑡
𝑁
𝑖=1
When adding all the Average Abnormal Returns (AAR) in the event window, we are able
to find the Cumulative Average Abnormal Return (CAAR) for all companies included in the
sample across the event window;
𝐶𝐴𝐴𝑅(𝑡1 + 1, 𝑡2) = ∑ 𝐴𝐴𝑅𝑡
𝑡2
𝑡=𝑡1+1
3.3.1.5 Analyse and statistically test the return
When performing an event study, several factors might disrupt the credibility of the
results, such as the event clustering and non-normal distributions, and if not treated for,
(5)
(6)
(7)
34
might result in the tampering of the results in the event study. The event clustering occurs
when there are other events in the sample occurring at the same time with the date of
the event study which then creates cross-sectional correlation across samples. Peterson
(1989) highlight the events that create clusters to be relating to tax law changes,
accounting method changes, and government regulation. Non-normal distribution occurs
if there are any significant outliers in the event window and the cumulative abnormal
returns are seen as not normally distributed.
The returns from an event study can be tested using parametric tests or non-parametric
tests but most scholars normally use a non-parametric test in event studies. The most
common parametric tests are the t tests and ANOVA and the most common non-
parametric test is the Mann-Whitney U test and the Kruskal-Wallis Test (Johnson &
Karunakaran, 2014). Parametric tests are statistical tests that make assumptions on the
defining properties, such as the data follows normal distribution, the sample size is large
enough for central limit theorem to lead to normality of average, and also that the data
is not normal but can be transformed. In situations where the data does not follow normal
distribution, this will result in the outcome becoming an ordinal variable, the presence of
definite outliers and outcome will have clear limits of demarcation. The non-parametric
test is unlike the parametric test in that it is based on fewer assumptions. The advantages
of using the non-parametric test is that it is suitable for when data does not follow normal
distribution, when the average is better represented by median, sample size is small,
when there is the presence of outliers and also it is relatively simple to conduct.
For this study, a t test as a form of parametric test was selected to test the cumulated
abnormal returns in the event window to check if the abnormal returns are significantly
different from zero. Brown and Warner (1985); Berry, Gallinger, & Henderson (1990)
recommend a student t when using daily returns compared to using a non-parametric
alternative after considering its error characteristics and sampling distribution of a non-
35
parametric test. For the student t-test, the null hypothesis (𝐻0) to be tested was as
follows;
𝐻0=There is no abnormal return in the event window
𝐻1= There is abnormal return in the event window
By rejecting the null hypothesis at different critical levels, this enables the abnormal
returns to be detected in the event window. The t-statistic is calculated by taking the
estimate of interest which, in this case, is the different types of returns and dividing them
with the estimated standard deviation (Kritzman, 1994), which will result in the following;
For average abnormal return (AAR) 𝑡 =𝐴𝐴𝑅𝑡
√𝜎𝑖2(𝐴𝐴𝑅𝑡)
For cumulative average return (CAR) 𝑡 =𝐶𝐴𝑅𝑖(𝑡1+1,𝑡2)
√𝜎𝑖2(𝑡1+1,𝑡2)
For cumulative average abnormal return (CAAR) 𝑡 =𝐶𝐴𝐴𝑅𝑡(𝑡1+1,𝑡2)
√𝜎𝑖2𝐶𝐴𝐴𝑅𝑡(𝑡1+1,𝑡2)
If the event is unanticipated and the results of the t-statistic is significant on the event
date, but it is not significant on the days following the event, then it is reasonable to
conclude the event affected stock returns and that it does not contradict the efficient
market hypothesis (Kritzman, 1994).
Chapter Summary
The chapter explained the detailed research methodology proposed to address the
research objectives identified in the first chapter of the study. In the context of corporate
mergers and acquisitions, event studies were used for focusing on announcement effects
for a short-horizon around an event to provide evidence relevant in understanding
corporate policy decisions (Kothari & Warner, 2006). The extent of abnormal returns,
(7)
(9)
(8)
36
losses or no effect in shareholder’s wealth can be shown in a model and quantified using
this common methodology for researchers on mergers and acquisitions. The short-
horizon tests are able to represent the best evidence currently available on market
efficiency (Fama, 1991) which means that if there is rationality in the market, the effects
from the event will reflect in the asset prices immediately. With several factors identified
in various researches that might disrupt the credibility of the results, a parametric test
was selected to assist in determining whether the event significantly affected the returns.
37
CHAPTER 4: Presentation of Results
4.1 Introduction
The purpose of this chapter is to present the results. The chapter is structured as follows:
Section 4.2 present the acquirers and target samples descriptive statistics which show
descriptive coefficients that summarise the given data. Section 4.3 presents the findings
from the event study for both acquirers and targets. Section 4.4 summarises the findings
from the sample used in 4.2 and 4.3 to observe whether certain industries yield higher
CARs than others in the context of South Africa and concludes with a chapter summary.
4.2 Sample Descriptive Statistics
4.2.1 Distribution of Total Sample Transactions by Year
Table 4 presents the M&A deals by year. The study consisted of 83 mergers and
acquisitions completed between 1997 and 2017 of which the acquirers represent 49 M&A
activities which represents 93% of all M&A completed between 1997 and 2017 by deal
value and 26% by deal count for JSE listed companies, target activities consisted of 34
targets which represents 99% of all targets completed between 1997 and 2017 by deal
value and 51% by deal count for JSE listed companies after applying the selection criteria.
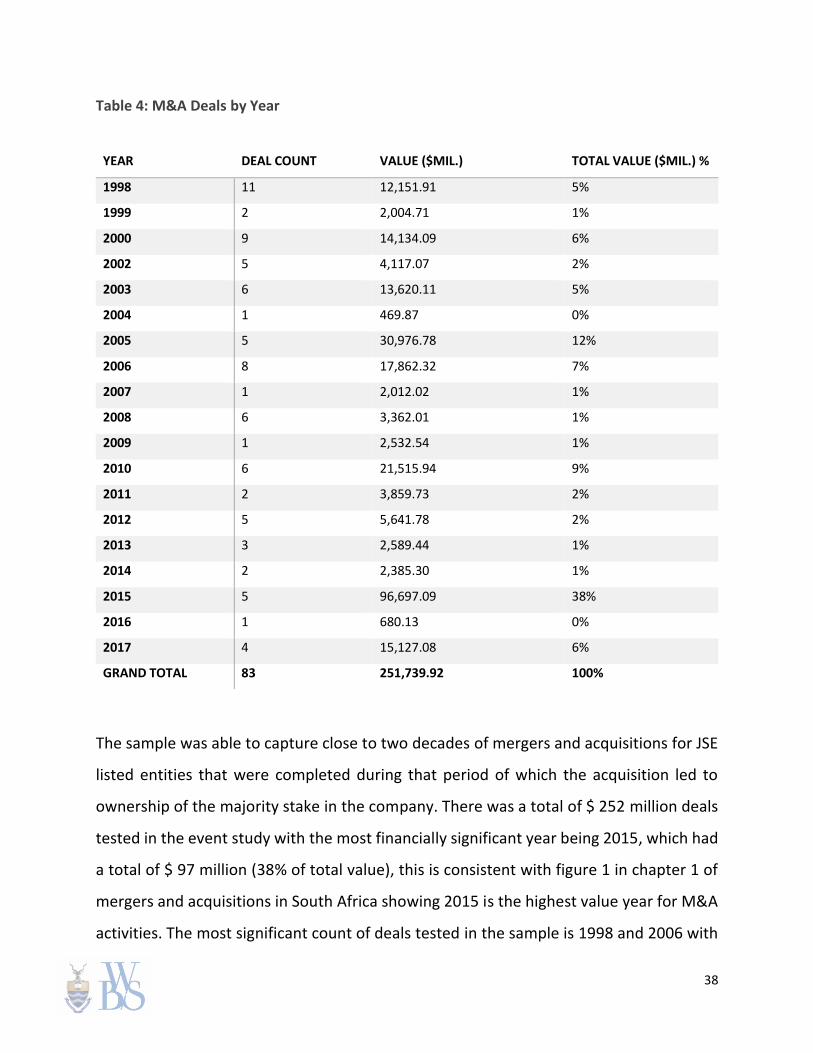
38
Table 4: M&A Deals by Year
The sample was able to capture close to two decades of mergers and acquisitions for JSE
listed entities that were completed during that period of which the acquisition led to
ownership of the majority stake in the company. There was a total of $ 252 million deals
tested in the event study with the most financially significant year being 2015, which had
a total of $ 97 million (38% of total value), this is consistent with figure 1 in chapter 1 of
mergers and acquisitions in South Africa showing 2015 is the highest value year for M&A
activities. The most significant count of deals tested in the sample is 1998 and 2006 with
YEAR DEAL COUNT VALUE ($MIL.) TOTAL VALUE ($MIL.) %
1998 11 12,151.91 5%
1999 2 2,004.71 1%
2000 9 14,134.09 6%
2002 5 4,117.07 2%
2003 6 13,620.11 5%
2004 1 469.87 0%
2005 5 30,976.78 12%
2006 8 17,862.32 7%
2007 1 2,012.02 1%
2008 6 3,362.01 1%
2009 1 2,532.54 1%
2010 6 21,515.94 9%
2011 2 3,859.73 2%
2012 5 5,641.78 2%
2013 3 2,589.44 1%
2014 2 2,385.30 1%
2015 5 96,697.09 38%
2016 1 680.13 0%
2017 4 15,127.08 6%
GRAND TOTAL 83 251,739.92 100%
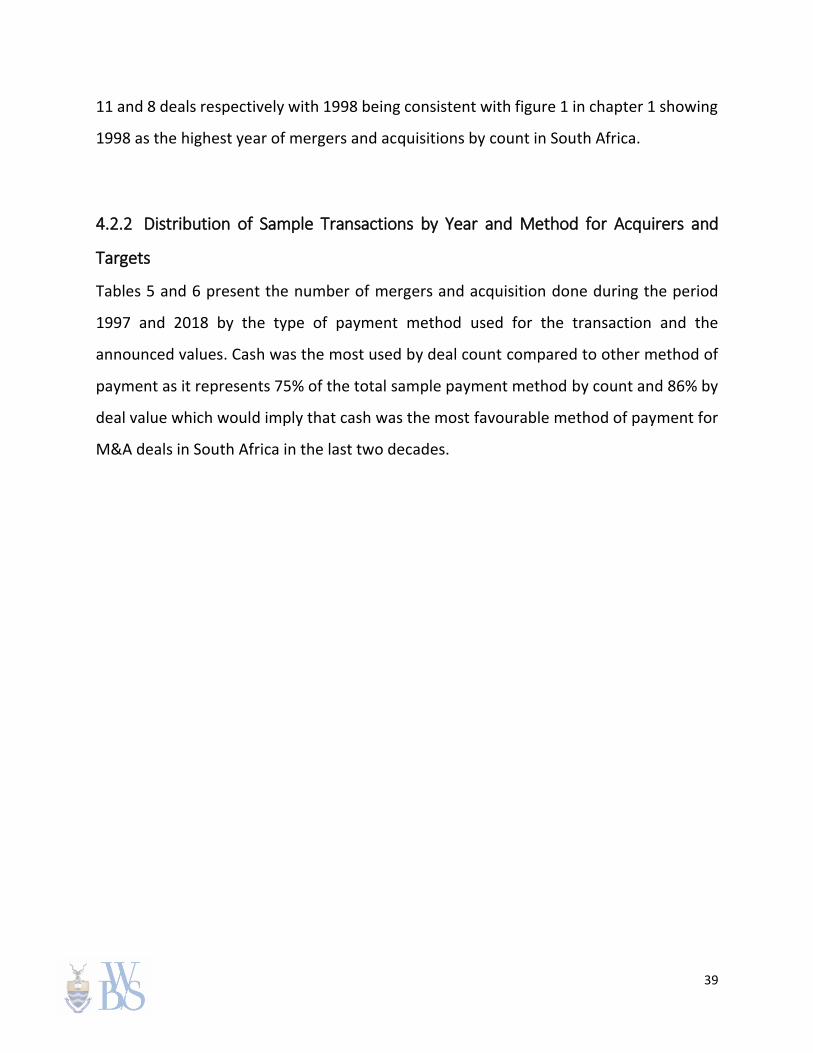
39
11 and 8 deals respectively with 1998 being consistent with figure 1 in chapter 1 showing
1998 as the highest year of mergers and acquisitions by count in South Africa.
4.2.2 Distribution of Sample Transactions by Year and Method for Acquirers and
Targets
Tables 5 and 6 present the number of mergers and acquisition done during the period
1997 and 2018 by the type of payment method used for the transaction and the
announced values. Cash was the most used by deal count compared to other method of
payment as it represents 75% of the total sample payment method by count and 86% by
deal value which would imply that cash was the most favourable method of payment for
M&A deals in South Africa in the last two decades.
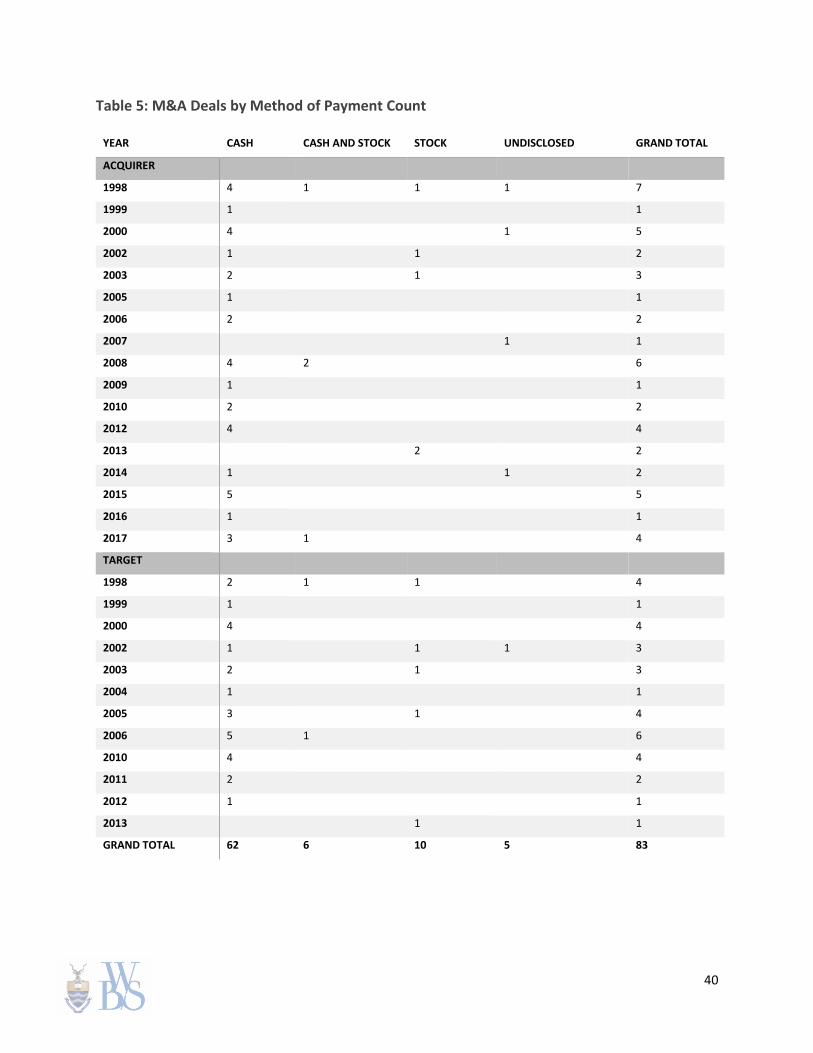
40
Table 5: M&A Deals by Method of Payment Count
YEAR CASH CASH AND STOCK STOCK UNDISCLOSED GRAND TOTAL
ACQUIRER
1998 4 1 1 1 7
1999 1
1
2000 4
1 5
2002 1
1
2
2003 2
1
3
2005 1
1
2006 2
2
2007
1 1
2008 4 2
6
2009 1
1
2010 2
2
2012 4
4
2013
2
2
2014 1
1 2
2015 5
5
2016 1
1
2017 3 1
4
TARGET
1998 2 1 1
4
1999 1
1
2000 4
4
2002 1
1 1 3
2003 2
1
3
2004 1
1
2005 3
1
4
2006 5 1
6
2010 4
4
2011 2
2
2012 1
1
2013
1
1
GRAND TOTAL 62 6 10 5 83
41
Table 6: M&A Deals by Method of Payment Values
YEAR CASH CASH AND STOCK STOCK UNDISCLOSED GRAND TOTAL
ACQUIRER
1998 4,928 450 480 788 6,646
1999 612
612
2000 8,062
500 8,562
2002 911
959
1,870
2003 1,070
3,078
4,147
2005 404
404
2006 3,991
3,991
2007
2,012 2,012
2008 2,501 861
3,362
2009 2,533
2,533
2010 4,804
4,804
2012 3,552
3,552
2013
1,513
1,513
2014 645
1,740 2,385
2015 96,697
96,697
2016 680
680
2017 3,180 11,947
15,127
TARGET
1998 4,532 494 480
5,506
1999 1,393
1,393
2000 5,573
5,573
2002 293
959 994 2,247
2003 6,395
3,078
9,473
2004 470
470
2005 30,055
518
30,573
2006 11,191 2,681
13,872
2010 16,712
16,712
2011 3,860
3,860
2012 2,090
2,090
2013
1,076
1,076
GRAND TOTAL 217,131 16,434 12,142 6,034 251,740

42
4.2.3 Sample Statistics
Table 7 shows the basic descriptive statistics for the data used in the window of 21 days
for acquirers and targets, the statistics further show the split by industry for both
acquirers and targets. Overall, the sample mean which measures the average of the
sample is 2% and 2.9% respectively, for acquirer and target data which implies the
average value in the sample presents over 2% of the total value. The minimum and
maximum differs by 20.55% for acquirers and 31.57% for targets which would imply that
there are values in the sample that are significantly higher than lowest values. The
standard deviation of the sample was 0.040% and 5.82% which would mean that the data
was not significantly spread out from the average.
Table 7: M&A Sample Statistics for Acquirers and Targets
COUNT TOTAL
VALUE
MEAN MEDIAN STANDARD
DEVIATION
MINIMUM MAXIMUM
ACQUIRERS 49 158,896 2.04% 0.60% 0.04% 0.25% 20.81%
TARGETS 34 92,844 2.94% 1.27% 5.82% 0.28% 31.74%
INDUSTRIES-ACQUIRERS
BASIC MATERIALS 5 8,919 20.0% 10.2% 16.7% 5.0% 41.5%
FINANCIAL 13 90,746 7.7% 1.3% 13.0% 0.5% 36.4%
INDUSTRIAL 2 3,561 50.0% 50.0% 46.9% 16.8% 83.2%
CONSUMER, CYCLICAL 7 4,996 14.3% 10.9% 94.0% 8.1% 22.2%
DIVERSIFIED 3 1,870 33.3% 34.5% 9.4% 23.4% 42.1%
COMMUNICATIONS 13 42,882 7.7% 3.6% 11.6% 1.1% 38.2%
CONSUMER,NON-CYCLICAL 5 5,515 20.0% 18.6% 7.8% 10.3% 31.6%
INDUSTRIES-TARGETS
BASIC MATERIALS 8 18,965 12.5% 10.4% 8.6% 2.5% 30.8%
COMMUNICATIONS 3 3,262 33.3% 15.1% 37.0% 9.0% 75.9%
CONSUMER, CYCLICAL 3 19,492 14.3% 4.9% 26.8% 2.5% 74.9%
CONSUMER,NON-CYCLICAL 3 6,865 33.3% 22.7% 36.9% 2.9% 74.4%
ENERGY 4 9,798 25.0% 25.1% 11.1% 12.4% 37.4%
FINANCIAL 6 33,706 16.7% 3.2% 34.7% 0.5% 87.4%
INDUSTRIAL 2 351 50.0% 50.0% 1.2% 49.1% 50.9%
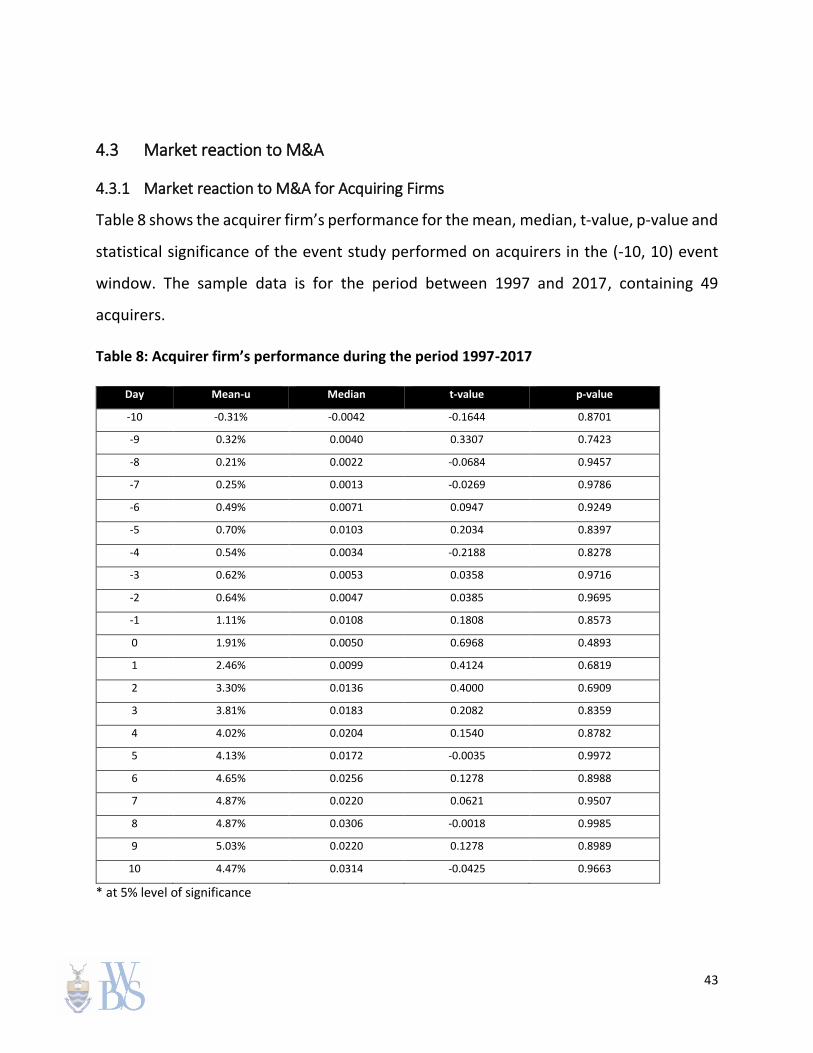
43
4.3 Market reaction to M&A
4.3.1 Market reaction to M&A for Acquiring Firms
Table 8 shows the acquirer firm’s performance for the mean, median, t-value, p-value and
statistical significance of the event study performed on acquirers in the (-10, 10) event
window. The sample data is for the period between 1997 and 2017, containing 49
acquirers.
Table 8: Acquirer firm’s performance during the period 1997-2017
Day Mean-u Median t-value p-value
-10 -0.31% -0.0042 -0.1644 0.8701
-9 0.32% 0.0040 0.3307 0.7423
-8 0.21% 0.0022 -0.0684 0.9457
-7 0.25% 0.0013 -0.0269 0.9786
-6 0.49% 0.0071 0.0947 0.9249
-5 0.70% 0.0103 0.2034 0.8397
-4 0.54% 0.0034 -0.2188 0.8278
-3 0.62% 0.0053 0.0358 0.9716
-2 0.64% 0.0047 0.0385 0.9695
-1 1.11% 0.0108 0.1808 0.8573
0 1.91% 0.0050 0.6968 0.4893
1 2.46% 0.0099 0.4124 0.6819
2 3.30% 0.0136 0.4000 0.6909
3 3.81% 0.0183 0.2082 0.8359
4 4.02% 0.0204 0.1540 0.8782
5 4.13% 0.0172 -0.0035 0.9972
6 4.65% 0.0256 0.1278 0.8988
7 4.87% 0.0220 0.0621 0.9507
8 4.87% 0.0306 -0.0018 0.9985
9 5.03% 0.0220 0.1278 0.8989
10 4.47% 0.0314 -0.0425 0.9663
* at 5% level of significance
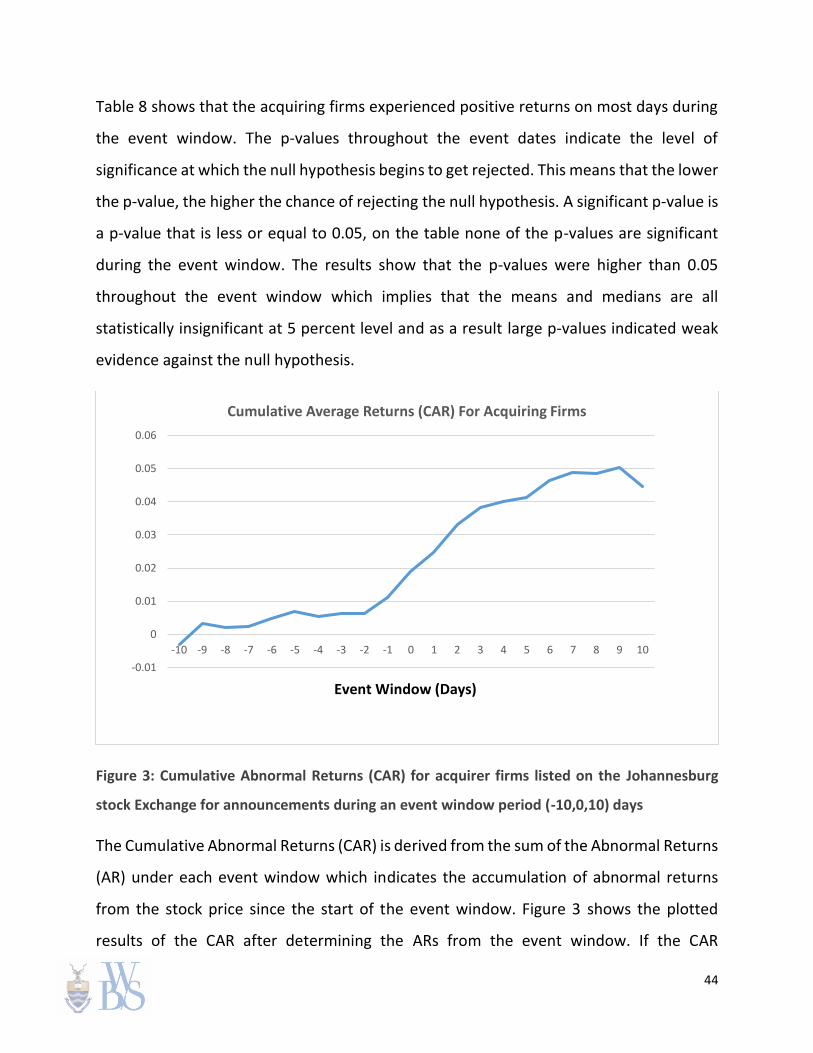
44
Table 8 shows that the acquiring firms experienced positive returns on most days during
the event window. The p-values throughout the event dates indicate the level of
significance at which the null hypothesis begins to get rejected. This means that the lower
the p-value, the higher the chance of rejecting the null hypothesis. A significant p-value is
a p-value that is less or equal to 0.05, on the table none of the p-values are significant
during the event window. The results show that the p-values were higher than 0.05
throughout the event window which implies that the means and medians are all
statistically insignificant at 5 percent level and as a result large p-values indicated weak
evidence against the null hypothesis.
Figure 3: Cumulative Abnormal Returns (CAR) for acquirer firms listed on the Johannesburg
stock Exchange for announcements during an event window period (-10,0,10) days
The Cumulative Abnormal Returns (CAR) is derived from the sum of the Abnormal Returns
(AR) under each event window which indicates the accumulation of abnormal returns
from the stock price since the start of the event window. Figure 3 shows the plotted
results of the CAR after determining the ARs from the event window. If the CAR
-0.01
0
0.01
0.02
0.03
0.04
0.05
0.06
-10 -9 -8 -7 -6 -5 -4 -3 -2 -1 0 1 2 3 4 5 6 7 8 9 10
Cumulative Average Returns (CAR) For Acquiring Firms
Event Window (Days)

45
percentage is a positive value, then this shows value creation for shareholders and If the
CAR percentage is negative, it shows a decrease in value for shareholders.
The CAR was -0.3% during -10 day in the event window and showed positive returns
leading to the day of the event. CAR was positive on the event day with returns of 1.9%
and remained positive throughout the event window which would mean that the
shareholder’s value creation was long lived due to a continuous increase in CAR in the
event window before it declined to 4.5% in +10 day. The longer the event window for the
acquirer shows the more increase in CAR for most days during the event.
Based on the results of the event study for the acquirer, I therefore fail to reject the null
hypothesis that the acquiring firm’s stocks are negative or have no effect on the stock
price upon the announcement of the acquisitions.
4.3.2 Market Reaction to M&A for Target Firms
Table 9 shows median, t-value, p-value and statistical significance of the event study
performed on targets in the (-10, 10) event window. The sample data is for the period
between 1997 and 2017, containing 34 targets.
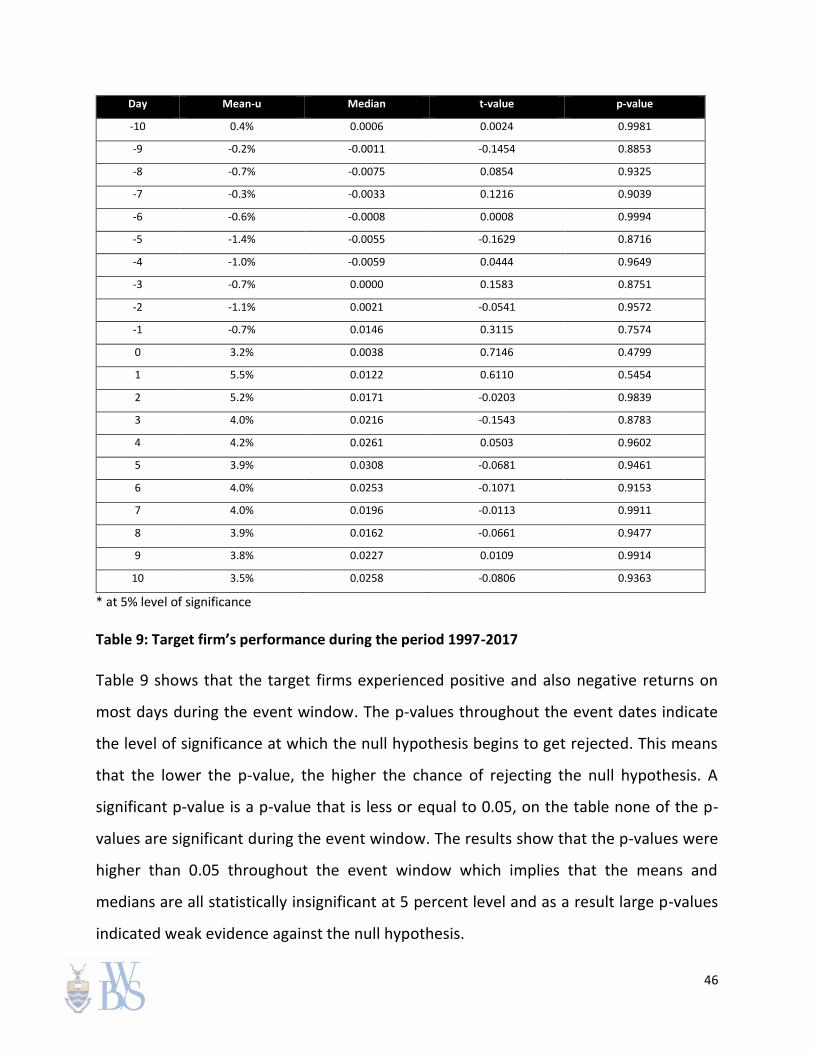
46
Day Mean-u Median t-value p-value
-10 0.4% 0.0006 0.0024 0.9981
-9 -0.2% -0.0011 -0.1454 0.8853
-8 -0.7% -0.0075 0.0854 0.9325
-7 -0.3% -0.0033 0.1216 0.9039
-6 -0.6% -0.0008 0.0008 0.9994
-5 -1.4% -0.0055 -0.1629 0.8716
-4 -1.0% -0.0059 0.0444 0.9649
-3 -0.7% 0.0000 0.1583 0.8751
-2 -1.1% 0.0021 -0.0541 0.9572
-1 -0.7% 0.0146 0.3115 0.7574
0 3.2% 0.0038 0.7146 0.4799
1 5.5% 0.0122 0.6110 0.5454
2 5.2% 0.0171 -0.0203 0.9839
3 4.0% 0.0216 -0.1543 0.8783
4 4.2% 0.0261 0.0503 0.9602
5 3.9% 0.0308 -0.0681 0.9461
6 4.0% 0.0253 -0.1071 0.9153
7 4.0% 0.0196 -0.0113 0.9911
8 3.9% 0.0162 -0.0661 0.9477
9 3.8% 0.0227 0.0109 0.9914
10 3.5% 0.0258 -0.0806 0.9363
* at 5% level of significance
Table 9: Target firm’s performance during the period 1997-2017
Table 9 shows that the target firms experienced positive and also negative returns on
most days during the event window. The p-values throughout the event dates indicate
the level of significance at which the null hypothesis begins to get rejected. This means
that the lower the p-value, the higher the chance of rejecting the null hypothesis. A
significant p-value is a p-value that is less or equal to 0.05, on the table none of the p-
values are significant during the event window. The results show that the p-values were
higher than 0.05 throughout the event window which implies that the means and
medians are all statistically insignificant at 5 percent level and as a result large p-values
indicated weak evidence against the null hypothesis.
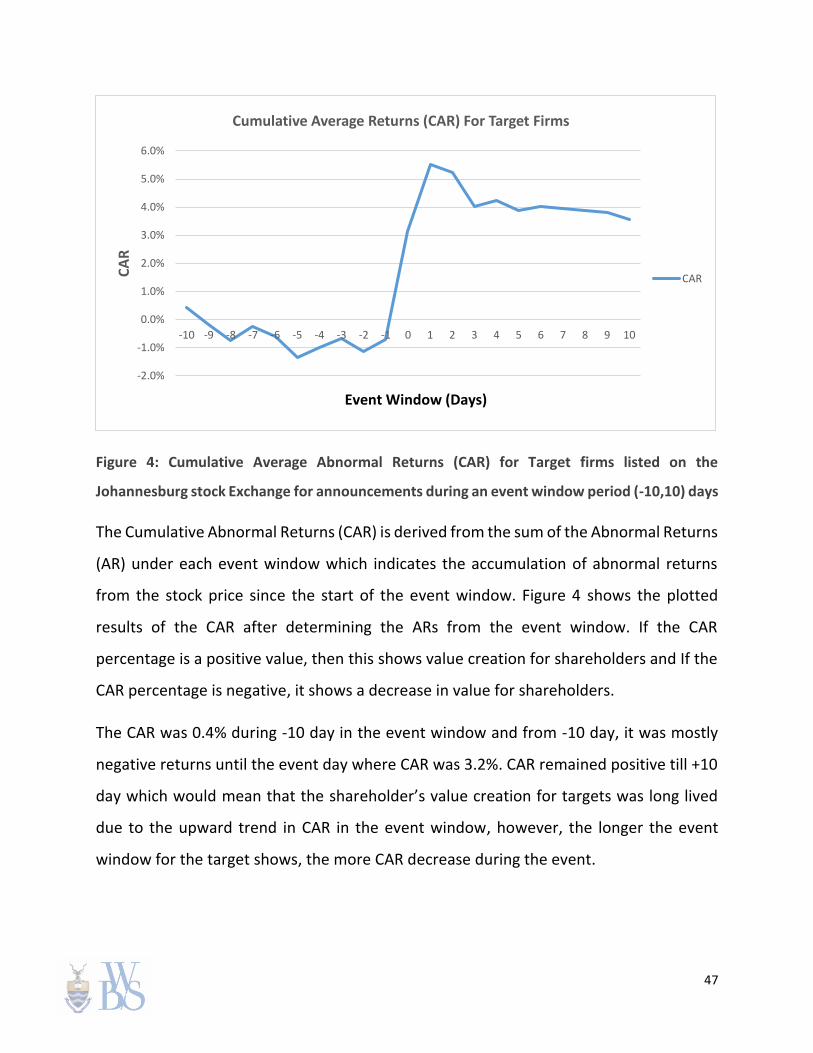
47
Figure 4: Cumulative Average Abnormal Returns (CAR) for Target firms listed on the
Johannesburg stock Exchange for announcements during an event window period (-10,10) days
The Cumulative Abnormal Returns (CAR) is derived from the sum of the Abnormal Returns
(AR) under each event window which indicates the accumulation of abnormal returns
from the stock price since the start of the event window. Figure 4 shows the plotted
results of the CAR after determining the ARs from the event window. If the CAR
percentage is a positive value, then this shows value creation for shareholders and If the
CAR percentage is negative, it shows a decrease in value for shareholders.
The CAR was 0.4% during -10 day in the event window and from -10 day, it was mostly
negative returns until the event day where CAR was 3.2%. CAR remained positive till +10
day which would mean that the shareholder’s value creation for targets was long lived
due to the upward trend in CAR in the event window, however, the longer the event
window for the target shows, the more CAR decrease during the event.
-2.0%
-1.0%
0.0%
1.0%
2.0%
3.0%
4.0%
5.0%
6.0%
-10 -9 -8 -7 -6 -5 -4 -3 -2 -1 0 1 2 3 4 5 6 7 8 9 10
CA
RCumulative Average Returns (CAR) For Target Firms
CAR
Event Window (Days)
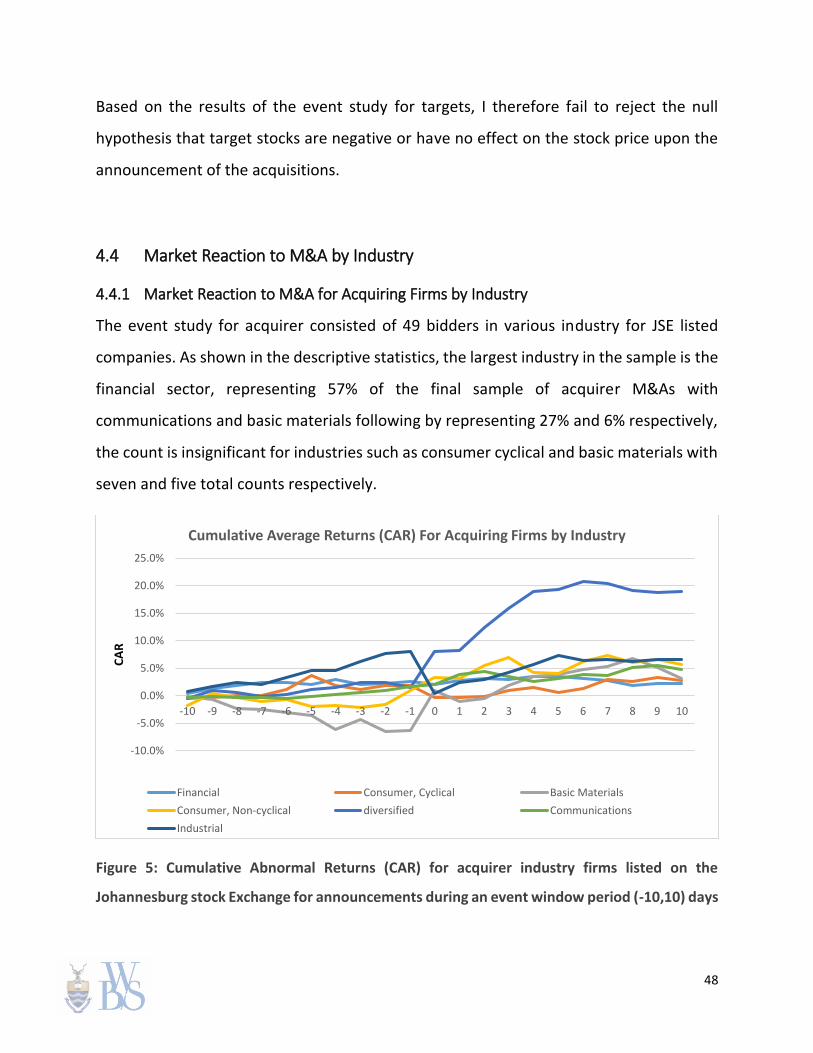
48
Based on the results of the event study for targets, I therefore fail to reject the null
hypothesis that target stocks are negative or have no effect on the stock price upon the
announcement of the acquisitions.
4.4 Market Reaction to M&A by Industry
4.4.1 Market Reaction to M&A for Acquiring Firms by Industry
The event study for acquirer consisted of 49 bidders in various industry for JSE listed
companies. As shown in the descriptive statistics, the largest industry in the sample is the
financial sector, representing 57% of the final sample of acquirer M&As with
communications and basic materials following by representing 27% and 6% respectively,
the count is insignificant for industries such as consumer cyclical and basic materials with
seven and five total counts respectively.
Figure 5: Cumulative Abnormal Returns (CAR) for acquirer industry firms listed on the
Johannesburg stock Exchange for announcements during an event window period (-10,10) days
-10.0%
-5.0%
0.0%
5.0%
10.0%
15.0%
20.0%
25.0%
-10 -9 -8 -7 -6 -5 -4 -3 -2 -1 0 1 2 3 4 5 6 7 8 9 10
CA
R
Cumulative Average Returns (CAR) For Acquiring Firms by Industry
Financial Consumer, Cyclical Basic Materials
Consumer, Non-cyclical diversified Communications
Industrial
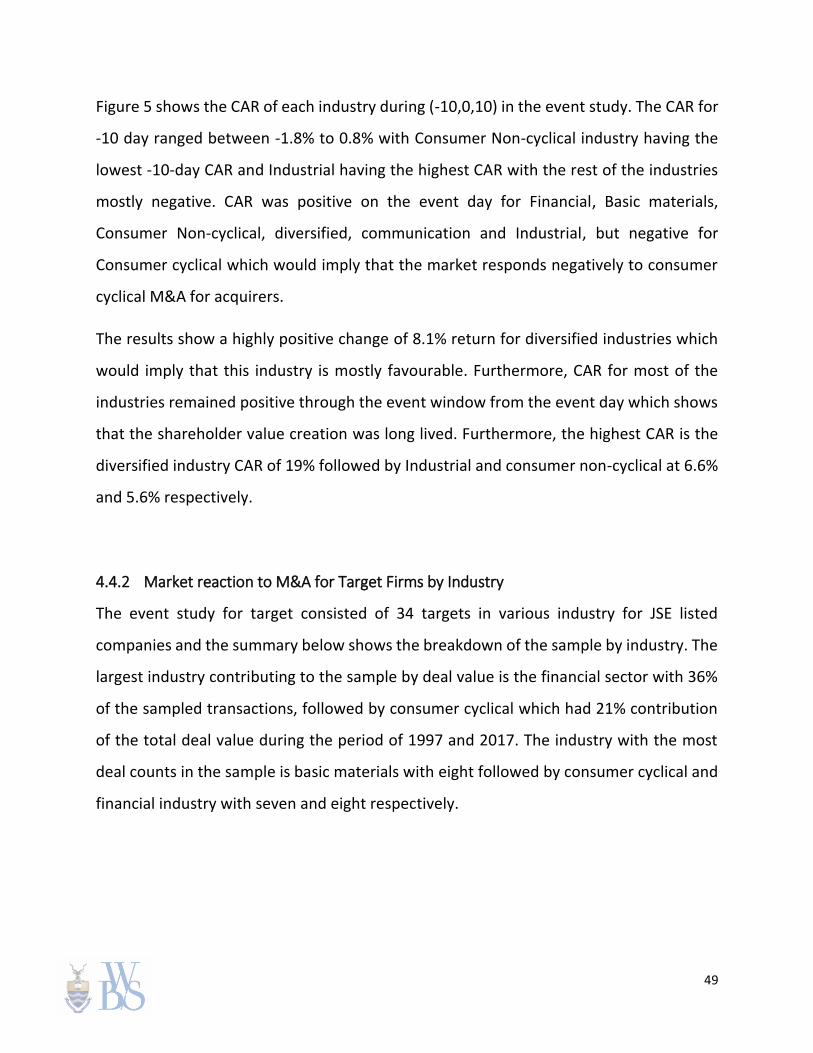
49
Figure 5 shows the CAR of each industry during (-10,0,10) in the event study. The CAR for
-10 day ranged between -1.8% to 0.8% with Consumer Non-cyclical industry having the
lowest -10-day CAR and Industrial having the highest CAR with the rest of the industries
mostly negative. CAR was positive on the event day for Financial, Basic materials,
Consumer Non-cyclical, diversified, communication and Industrial, but negative for
Consumer cyclical which would imply that the market responds negatively to consumer
cyclical M&A for acquirers.
The results show a highly positive change of 8.1% return for diversified industries which
would imply that this industry is mostly favourable. Furthermore, CAR for most of the
industries remained positive through the event window from the event day which shows
that the shareholder value creation was long lived. Furthermore, the highest CAR is the
diversified industry CAR of 19% followed by Industrial and consumer non-cyclical at 6.6%
and 5.6% respectively.
4.4.2 Market reaction to M&A for Target Firms by Industry
The event study for target consisted of 34 targets in various industry for JSE listed
companies and the summary below shows the breakdown of the sample by industry. The
largest industry contributing to the sample by deal value is the financial sector with 36%
of the sampled transactions, followed by consumer cyclical which had 21% contribution
of the total deal value during the period of 1997 and 2017. The industry with the most
deal counts in the sample is basic materials with eight followed by consumer cyclical and
financial industry with seven and eight respectively.
50
Figure 6: Cumulative Abnormal Returns (CAR) for target industry firms listed on the
Johannesburg stock Exchange for announcements during an event window period (-10,10) days
Figure 6 shows the CAR of each industry during (-10,0,10) in the event study. The CAR for
-10 day ranged between -2.1% to 0.6% with the communications industry having the
lowest -10-day CAR and consumer cyclical having the highest CAR. CAR was positive on
the event day for all the industries except basic materials which would imply that the
market responds negatively to basic materials M&A for targets. The results show a high
positive result of 8.5% for consumer non-cyclical followed by communications and
consumer cyclical with 7.9% and 5.1% respectively, which implies that these industries
are mostly favourable compared to the other industries captured in the event study.
Chapter summary
The chapter presents the distribution of acquirer and target M&A deals from JSE listed
companies for the period 1997-2017. The results and key findings of the event study are
presented for acquirer and target samples derived from M&A activities carried out by JSE
-15.0%
-10.0%
-5.0%
0.0%
5.0%
10.0%
15.0%
20.0%
-10 -9 -8 -7 -6 -5 -4 -3 -2 -1 0 1 2 3 4 5 6 7 8 9 10
CA
RCummulative Average Returns (CAR) For Target Firms by Industry
Basic Materials Communications Consumer, Cyclical
Consumer, Non-cyclical Energy Financial
Industrial
51
listed companies over the past two decades. Lastly, the chapter summarises the results
by industry to show which industries in South Africa had the most favourable reaction by
the market and which ones had the least.
The study showed that shareholders for acquirers and targets do not earn statistically
significant positive abnormal returns around the announcement. When analysing the
event study results by industry for acquirers, diversified industry M&As yield the most
favourable results, followed by consumer non-cyclical and communications industry and
for targets, the consumer non-cyclical is most favourable, followed by communications
and consumer cyclical respectively, when comparing CARs.
52
CHAPTER 5: Discussion and Conclusion
5.1 Introduction
This chapter concludes the thesis by outlining the discussion, based on the findings from
the research. The chapter is structured as follows; Section 5.2 covers the discussion of the
findings. Section 5.3 concludes the discussions from the study and provides insights into
further studies.
5.2 Discussion
The current study used an event study methodology to determine the value creation of
mergers and acquisitions that occurred in South Africa over the past two decades.
Furthermore, the study investigated the value creation by industry to identify which
industry created more value when comparing CARs. About 49 acquirer and 34 target
companies were included in the analysis.
The results show that there were statistically insignificant returns for shareholders in
mergers and acquisitions in South Africa for bidding and target firms in the short term
during the event announcement dates. The results support the research from Eckbo and
Thorburn (2000) for Canada, Sorheim and Lerkerod (2015) focusing on Nordic countries,
Franks et al. (1988) for the UK, Bhabra and Huang (2013) for China, but differs from Campa
and Hernando (2004) who reported zero CAR for European acquirers and Hazelkorn,
Zenner, &Shivdasani (2005) who showed insignificant negative returns for US bidding
companies. Alexandris, Petmezas, &Travlos (2010) studied M&A using global data and
concluded that public acquisitions at best yield zero abnormal returns around the deal
announcement and mean acquirer abnormal returns are at least non-negative within the
rest of Europe, Japan, rest of Asia, South Africa and South America.
53
The statistical significance was run at 5% significance level and shows that CAR for
acquirers was not statistically significant in any of the event windows which is consistent
with the results of Ndlovu (2014), Mushidzhi and Ward (2004) and the study of Smit and
Ward (2007) who did similar studies for South Africa. The results show that in the event
day, acquirers earn less abnormal returns in M&A than targets which means target firms
benefited the most from mergers and acquisition. This finding is consistent with the
results of Ndadza (2014) and Kaufeler (2012). Uhlenbruck et al. (2017) explained that
acquiring companies create little value due to failure to create synergy, too high
premiums, selection of wrong targets, ineffective processes of integration, amongst
others.
The industry results for acquirers shows that diversified industry M&As yield the most
favourable results compared to focused industries. This finding is similar to Sorheim and
Lerkerod (2015). The results for acquirers are followed by consumer non-cyclical and
communications industry and the results for communications differs from Kiymaz and
Baker (2008) who found negative abnormal returns in the US communications industry.
For targets, the consumer non-cyclical is most favourable, followed by communications
and consumer cyclical respectively. Similar to Kiymaz and Baker (2008), targets generally
earn positive short term returns but the magnitude of the returns differs substantially by
industry.
5.3 Conclusion
The conclusion of the study is that both acquiring and target firms do not create statistical
significant returns overall, some industries have high positive cumulative average returns,
and some do not have positive cumulative average returns which implies that can be
positive, negative or indifferent from zero, depending on the industry type when
analysing the cumulative abnormal returns.

54
Overall, the results both support and contradict evidence from other markets which
suggests that stock markets are not similar across the world but could also be due to the
sample not matching the sample population and size of other research, however, this
supports the need for further research which is discussed in the next section.
5.4 Further Research
The study consisted of 83 acquirers and targets for JSE listed companies which might be
a small population and does not represent a wider pool of M&A and was not able to
capture all industries in South Africa. Increasing the sample size and capturing all the
industries in South Africa can be considered, and also the addition of other countries
similar to South Africa. The study focused on the short-term effects of value created from
M&A, further studies can consider the long-term value creation for the largest deals
completed in South Africa to test whether they did create long term value for
shareholders and if they had a positive economic value when the economy is not
stagnant.
The study focused on JSE listed companies with significantly high announced transaction
values; by relaxing some of the criteria applied to extend the research to non-listed
acquisitions with various announced deal values would add to the body of mergers and
acquisitions in South Africa. Furthermore, extending the research to cross border mergers
and acquisitions to see if the Industry results for high abnormal returns still hold should
be undertaken.
55
References
Agrawal, A. and Jaffe, J. (2000). The post-merger performance puzzle, Advances in Mergers and
Acquisitions.1, 119-156)
Alexandrisdis, G. Petmezas, D. & Travlos, N.G. (2010). Gains from Mergers and Acquisitions
Around the World: New Evidence. Retrieved from
http://citeseerx.ist.psu.edu/viewdoc/download?doi=10.1.1.460.2340&rep=rep1&type=pdf.
Barney, J.B. (1988). Returns to bidding firms in mergers and acquisitions: reconsidering the
relatedness hypothesis. Strategic Management Journal,9, 71.
Berry, M., Gallinger, G., & Henderson, G. (1990). Using Daily Stock Returns in Event Studies and
the Choice of Parametric versus Nonparametric Test Statistics. Quarterly Journal of Business
and Economics, 29(1), 70-85. Retrieved from http://www.jstor.org/stable/40472983.
Bhabra, H.S. & Huang, J. (2013). An empirical investigation of mergers and acquisitions by
Chinese listed companies, 1997–2007. Journal of Multinational Financial Management
23(3), 186-207.
Blinder, J.J. (1998). The event study methodology since 1969. Review of Quantitative Finance
and Accounting, 11, 111–137.
Brodbeck, L. (2015). The 15 Biggest Mergers of All Time. Retrieved from
https://finance.yahoo.com/news/15-biggest-mergers-time-175152979.html?guccounter=1
Brown, S. & Warner, J. (1985). Using stock returns: The case of event studies, Journal of
Financial Economics, pg., 3-31.
56
Business Tech. (2014). Biggest SA tech deals and mergers. Retrieved from
https://businesstech.co.za/news/telecommunications/75838/biggest-sa-tech-deals-and-
mergers/
Carr, F. (2015). Do mergers and acquisitions create sustainable shareholder value? MBA in
finance thesis. Dublin: Dublin Business School.
Cartwright, S. & C. L. Cooper (1996). Managing Mergers, Acquisitions and Strategic
Alliances: Integrating People and Cultures. Oxford: Butterworth-Heinemann.
Cartwright, S. & C. L. Cooper (2001). HR Know How in Mergers and Acquisitions. London: CIPD.
Cartwright, S. & Schoenberg, R. (2006). 30 Years of Mergers and Acquisitions Research: Recent
advances and future opportunities. British Journal of Management. 17(S1). S1-S5.
Conn, C., Cosh, A., Guest, P. & Hughes, A. (2001). Long Run Share Performance of UK firms
engaging in cross-border acquisitions. Cambridge: The University of Cambridge. Centre for
Business Related Research. Working Paper No. 214.
Copeland, T & J.F. Weston. (1983) Financial Theory and Corporate Policy. Reading, MA. Addison-
Wesley.
Cordeiro, M. (2014). The seventh M&A wave. Retrieved from https://camayapartners.com/wp-
content/uploads/2016/06/The-seventh-MA-wave.pdf
Cuypers, I.R., Cuypers, Y. and Martin, X., 2017. When the target may know better: Effects of
experience and information asymmetries on value from mergers and acquisitions. Strategic
Management Journal, 38(3), pp.609-625.
57
Eckbo, B. E., & Thorburn, K. S. (2000). Gains to Bidder Firms Revisited: Domestic and Foreign
Acquisitions in Canada. The Journal of Financial and Quantitative Analysis, 35(1), 1–25.
doi:10.2307/2676236
Economy watch. (2010) Retrieved from http://www.economywatch.com/mergers-
acquisitions/type/conglomerate.html
Ellis, K.M. Lamont, B.T. Reus, T.H & Faifman, L. (2015). Mergers and Acquisitions in Africa: A
Review and an Emerging Research Agenda. Africa Journal of Management, 1(2), 137-171.
Fama, E.F. Fisher, L. Jensen, M.C. & Roll, R. (1969). The Adjustment of Stock Prices to New
Information. International Economic Review, 10(1), 1-21.
Fama, E.F. (1991). Efficient capital markets: II. Journal of Finance 46, 1575-1617.
Franks, J. R., Harris, R. S., & Mayer, C. (1988). Means of Payment in Takeovers: Results for the
The United Kingdom and the United States. Corporate Takeovers: Causes and Consequences
(Vol. I). UMI.
Gaughan, P.A. Mergers, Acquisitions, and Corporate Restructurings, 5th ed. Hoboken, NJ: Wiley,
2011 Retrieved from http://www.questia.com/read/123785279/mergers-acquisitions-and-
corporate-restructurings.
Gonzalez, P. Vasconcellos, G.M. Kish, R.J. (1998). Cross-border mergers and acquisitions: The
undervaluation hypothesis. Quarterly Review of Economics and Finance. 38(1), 25-45.Retrieved
from https://www.sciencedirect.com/science/article/abs/pii/S1062976999801021
58
Goold, M.& Campbell, A. (1998). Desperately Seeking Synergy. Retrieved from
https://hbr.org/1998/09/desperately-seeking-synergy
Hapeslagh, P. & D. Jemison (1991). Managing Acquisitions. New York: Free Press.
Hazelkorn, T. Zenner, M. & Shivdasani, A. (2005). Creating value with mergers and acquisitions.
Wiley Online Library. Retrieved from https://onlinelibrary.wiley.com/doi/pdf/10.1111/j.1745-
6622.2004.tb00540.x
Hitt, M. A. Hoskisson, R. E. & Irelund R, D. (1999). Theory and Research in Strategic
Management: Swings of a Pendulum. Strategic Management Journal, 11, 29-47.
Johnson, L.R & Karunakaran, U.D. (2014). How to perform data analysis using the free software
EZR. Part 1: single continuous dependent variable. Annals of community health, 4(2), 25.
Kaufler, M. (2012). Stock price dynamics around merger and acquisitions events: Empirical
contributions to the corporate takeover market. Copenhagen business school.
King, D. Dalton, C. Daily & J. Covin (2004). ‘Meta-analyses of post-acquisition
performance indications of unidentified moderators. Strategic Management Journal, 25,
187-200.
Kiymaz, H. & Baker, H. K. (2008). Short-Term Performance, Industry Effects, and Motives:
Evidence from Large M&As, Quarterly Journal of Finance & Accounting, 47(2), 17–44. Retrieved
from:
https://search.ebscohost.com/login.aspx?direct=true&db=plh&AN=33186428&site=ehost-
live&scope=site (Accessed: 10 February 2019)
Kitching, J. (1974). Winning and Losing with European Acquisitions. Harvard Business
59
Review, 52, 124-136.
Kothari, S.P & Warner, J.B. (2006). The econometrics of event studies. in B. Espen Eckbo (ed.).
Handbook of Corporate Finance: Empirical Corporate Finance. Volume A (Handbooks in Finance
Series, Elsevier/North-Holland). Lisse: Elsevier.
Kritzman, M.P. (1994). What Practitioners Need to Know about Event Studies. Financial
Analysts Journal, 50(6), 17-20. Retrieved from http://www.jstor.org/stable/4479785.
Kyaw, S. (2003). FDI in Developing Countries in the Globalised World. Paper presented at the
DSA Conference. University of Strathclyde, Glasgow.
Lang, D.W. (2003). The Future of Merger, What Do We Want Mergers to Do: Efficiency or
Diversity? The Canadian Journal of Higher Education. 33(,3), 19-70.
Mauboussin, M. (2018). To Buy or Not to Buy: A Checklist for Assessing Mergers & Acquisitions.
Retrieved from https://www.valuewalk.com/2017/03/mauboussin-buy-not-buy-checklist-
assessing-mergers-acquisitions/
Mitchell, M. & Mulherin J. H. (1996). The Impact of Industry Shocks on Takeover and
Restructuring Activity. Journal of Financial Economics. (p. 193–229)
Morrissette, S.G. (2013). A framework for validating an M&A Deal thesis. Journal of Accounting
and Finance 13(2).
Mohapi, D.S. (2017). The Effects of Mergers and Acquisitions on Investment Returns– Cases of
Massmart and SABMiller. Johannesburg: Wits Business School. The University of the
Witwatersrand.
60
Mulherin, J. H., & Boone, A. L. (2000). Comparing acquisitions and divestitures. Journal of
Corporate Finance, 6(2), 117–139. doi:10.1016/S0929-1199(00)00010-9.
Ndadza, T.E. (2014). Beneficiaries of Mergers & Acquisitions in South Africa. Johannesburg: Wits
Business School. The University of the Witwatersrand.
Ndlovu, M. (2016). The Impact of Mergers and Acquisitions Announcements on the Share Price
Performance of Acquiring Companies: South African Listed Companies. Johannesburg: Wits
Business School. The University of the Witwatersrand.
Nead, N. (n.d.). Merge or die: How competitors become allies and how recessions consolidate
industry power. Retrieved from https://investmentbank.com/merge-or-die/
Nouwen, T.J.A. (2011). M&A waves and its evolution throughout history. Retrieved from
http://arno.uvt.nl/show.cgi?fid=129395
Osae, W. K, Fauconnier, C. J, & Webber-Youngman, R.C.W. (2011). A value assessment of
mergers and acquisitions in the South African mining industry–the Harmony ARM gold example.
The Journal of the Southern African Institute of Mining and Metallurgy. 111.
Peavler, R. (2018). What Are Horizontal and Vertical Mergers? Retrieved from
https://www.thebalancesmb.com/horizontal-and-vertical-mergers-explained-392846
Peterson, P.P. (1989). Quarterly Journal of Business and Economics 28(3), 36-66. Retrieved from
https://www.jstor.org/stable/40472954.
QuickBooks. (2017). Organic vs. Inorganic Growth for Your Business. Retrieved from
https://quickbooks.intuit.com/r/growing-your-business/organic-vs-inorganic-growth-for-your-
business/
61
Reddy, S.G. (2017). The BRICS and a Changing World. Retrieved from
https://developingeconomics.org/2017/09/27/the-brics-and-a-changing-world/
Rostand, A. (1994). Optimizing managerial decisions during the acquisition integration
process. Paper presented to the 14th Annual Strategic Management Society International
Conference, Paris.
Ross, S.A, Westerfield R.W, & Bradford, J.D. (2002). Fundamentals of Corporate Finance, 6th ed.
New York: McGraw-Hill.
Saikevicius.D. (2013). Mergers and Acquisitions: Revisiting the Issue of Value Creation
in the New Member States of European Union. Faculty of Economics, Vilnius University,
Lithuania.
Samuel, S. (2009) Can foreign direct investment (FDI) help to promote growth in Africa? African
Journal of Business Management 3(5), 178-183.
Schoenberg, R. (in press). Measuring the performance of corporate acquisitions: An Empirical
Comparison of Alternative Metrics, British Journal of Management.
Scott, D.L. (2003). Wall Street Words: An A to Z Guide to Investment Terms for Today's Investor.
Boston, New York: Houghton Mifflin Company
Seth, A. Song, K., & Pettit, R. (2000). Synergy, materialism or hubris? An empirical examination
of motives for foreign acquisitions of US firms, Journal of International. Business Studies, 31,
387-405.
Sherman, A.J. (2011). The Basics of Mergers and Acquisitions. Mergers & Acquisitions from A to
Z. Edition: 3rd .(p. 2-3).Retrieved from https://www.questia.com/read/120956831/mergers-
acquisitions-from-a-to-z
Smit C, J.B. & Ward, M.J.D. (2007). The impact of large acquisitions on the share price and

62
operating financial performance of acquiring companies listed on the JSE. Investment Analysts
Journal – No. 65.
Stowell, D.P. Investment Banks, Hedge Funds, and Private Equity. 2nd ed. Boston: Academic
Press (p 69-72). Retrieved from http://kadamaee.ir/payesh/books-tank/16/Stowell%20-
%20Investment%20Banks,%20Hedge%20Funds,%20and%20Private%20Equity,%202e%20(2013)
Sudarsanam, S. (2003). Creating Value from Mergers and Acquisitions, the Challenges. London:
Prentice Hall.
Thomson Reuters. (2017). M&A Today: A Quick Pre-Financial Crisis Comparison. Retrieved from
https://financial.thomsonreuters.com/content/dam/openweb/documents/pdf/financial/pre-
financial-crisis-comparison.pdf
Uhlenbruck, K. Hughes-Morgan, M. Hitt, M.A. Ferrier, W.J. & Brymer, R. (2017). Rivals’ reactions
to mergers and acquisitions. Strategic Organization, 15(1), 40-66.
Vaidya, D. (2018). Synergy in M&A | Types of Synergies in Mergers and Acquisitions. Retrieved
from https://www.wallstreetmojo.com/types-of-synergies/
Weinberg, M. (2007). The price effects of horizontal mergers. Journal of Competition Law &
Economics, 4(2), 433–447.
Wimberley, T. & Negash, M. (2004). The value creation effects of mergers and acquisitions:
Evidence from the JSE Securities Exchange South Africa. Investment Analysts Journal, 33(59),
pp.31-40.
Recommended


![Mergers, Acquisitions and Wealth Creation - [email protected] Dubai](https://img.pdfslide.us/doc/110x75/6207516f49d709492c303bb8/mergers-acquisitions-and-wealth-creation-emailprotected-dubai.jpg)