Instrument Science Report WFC3 2021-14
UVIS Pixel Stability:
Updates to The UVIS Bad Pixel Table Pipeline
J. V. Medina
September 8, 2021
ABSTRACT
The pipeline used to generate and deliver the UVIS bad pixel tables is re-evaluated following
the implementation of a 20 electron post-flash on the dark calibration images that led to
an anomalous jump to ≈3.0% in the unstable pixel population. We find that the rise in
unstable pixels is due to a mis-classification of the hot and cold pixel populations, which led
to an inaccurate calculation of the stability threshold. Rather than classifying hot pixels using
the ≥13.5 electron hot pixel threshold for a 900s exposure, the updated pipeline now uses a
formula to determine the hot pixel threshold that is based off the post-flash amount and dark
current on the detector. The new hot pixel threshold is calculated to be 22.7 electrons for the
20 electron post-flashed darks, and results from the updated pipeline show that the anomalous
unstable pixel population is brought down from 3.28% (3.07%) to 1.11% (1.16%) for chip
1 (2) for the November 2020 anneal cycle, and from 3.31% (3.08%) to 1.05% (1.08%) for
chip 1 (2) for the December 2020 anneal cycle, consistent with previous cycles, before the 20
electron post-flash was implemented. This new method of determining the hot pixel threshold
will ensure an accurate measurement of the unstable pixel population, independent of future
modifications to post-flash intensity.
Copyright c© 2008 The Association of Universities for Research in Astronomy, Inc. All Rights Reserved.

– 2 –
Contents
1 Introduction: How and Why We Define Pixel Stability 3
2 The Problem: An Anomalous Jump in Unstable Pixels 4
3 The Solution: Re-evaluating the Existing Hot Pixel Threshold 8
3.1 The October 28, 2020 Anneal . . . . . . . . . . . . . . . . . . . . . . . . . . 12
4 Conclusions 15
5 Acknowledgements 15

– 3 –
1. Introduction: How and Why We Define Pixel Stability
A novel procedure for locating and flagging unstable pixels on the Wide Field Camera 3
(WFC3) UVIS instrument was implemented in 2018 with the goal of generating and deliver-
ing UVIS bad pixel tables containing these unstable pixels for every anneal cycle (Bourque
et al., 2018). By definition, an anneal cycle is the period of time between the start of two
consecutive anneals and usually spans across ≈30 days. Each row in a bad pixel table lists
an unstable pixel using a flag of 32. These bad pixel tables also identify hot pixels with a
flag of 16, and so a hot and unstable pixel will have a flag of 32 + 16 = 48. Hot pixels are
pixels with an anomalously strong signal defined as ≥ 13.5 e− for a 900 second exposure.
Making the hot pixels distinguishable by stability allow for the hot and stable pixels to be
calibrated and preserved due to their low variance and predictable uncertainties.
An unstable pixel is a pixel whose signal varies significantly compared to the expected
amount, and is therefore unreliable. The stability of a pixel for a given anneal cycle is
determined using a metric called the stability ratio, expressed in Equation 1. A larger
stability ratio reflects a higher level of instability, while a lower stability ratio reflects lower
instability. Each pixel is assigned a stability ratio for every anneal cycle, and is calculated
using pixel values of the corresponding pixel across all dark observations in which the pixel
was not contaminated by a cosmic ray, collected over the course of the anneal cycle.
Stability Ratio =V ariance(SCI) −Mean(ERR2)
Mean(SCI)+ 1 (1)
Figure 1 is an example of the UVIS science pixel stability ratios for the April 16, 2020
anneal cycle. Pixels with higher stability ratios are deemed more unstable than pixels with
lower stability ratios. Some structure in the image can be seen with higher stability ratios
being found near the UVIS chip gap which is likely due to Charge Transfer Efficiency (CTE)
trails that are more commonly found farther from the readout amplifiers for both chips. CTE
trails are a consequence of CTE loss due to charge traps that form as a result of the gradual
degradation of the UVIS camera’s crystal silicon lattice (Kuhn et al., 2021). These traps
form in random locations on the camera, but CTE trails are more commonly found in pixels
farther away from their corresponding amplifier. This is due to the increased likelihood of
charge running into a trap as it goes through more transfers to get to the readout amp
(Bourque et al., 2016). As a result, the random occurrence of these CTE trails contributes
to a higher variance of the affected pixel even though the variance is not intrinsically part
of the pixel, but rather a byproduct of charge transfer inefficiency.

– 4 –
Fig. 1.—The stability ratio “map” of all UVIS science pixels for the April 16, 2020 anneal
cycle. Pixels with a lower stability ratio are considered more stable than pixels with higher
stability ratios.
2. The Problem: An Anomalous Jump in Unstable Pixels
On November 12, 2020 a new procedure was implemented on UVIS that involves in-
creasing the post-flash levels from 12 to 20 electrons prior to image readout. This post-flash
procedure is in place for two reasons: 1. A study shows that post-flashing the camera with
at least 12 electrons prior to image readout leads to a ∼>50% increase in hot pixel detec-
tion compared to using no post-flash (Medina et al., 2019), and 2. A uniform 12 electron
post-flash has been shown to mitigate CTE losses by filling in charge traps that contribute
to CTE trails across the detector (Bourque et al., 2016). However, a recent study revisited

– 5 –
the efficacy of different flash levels on the detector and found that a level of 20 electrons
preserves 75% of the charge as opposed to 50% for 12 electrons (Anderson et al., 2020).
According to Bourque et al., 2018, approximately 1% of the UVIS pixel population
qualifies as unstable, and a vast majority (≈95%) of the hot pixel population is stable.
However, a change in the unstable pixel population was noted after implementation of the
20 electron post-flash procedure. In Figure 2 we see that the unstable pixel population
hovers around 1% of each detector chip with a gradual monthly increase of about 0.01%.
However, we see an anomalous jump to about 3% in the anneal cycle immediately following
the implementation of the 20 electron post-flash.
2020-01 2020-03 2020-05 2020-07 2020-09 2020-11 2021-01USEAFTER
1.0
1.5
2.0
2.5
3.0
Unst
able
Pix
el F
lags
(% o
f chi
p)
Unstable Pixel Population vs. Timechip2chip120 electron flash start
Fig. 2.—The unstable pixel evolution across all 2020 anneal cycles. A gradual increase in
population of about 0.01% per anneal cycle can be seen in both chips, with an anomalous
jump to about 3.0% in the anneal cycle following the implementation of the 20 electron
post-flash in November 12, 2020.

– 6 –
The following is a brief outline of the algorithm used to determine and flag the unstable
pixels on UVIS1 and 2. A more in-depth explanation of each step within this algorithm can
be found in WFC3 ISR 2018-15:
1. Trim the RAW images of their overscan regions, and implement bias correction
2. Flag cosmic rays that will not be used for analysis
3. Cosmic ray growth (3×) to ensure that no pixels contaminated by cosmic rays contribute
to the stability threshold
4. Calculate the stability ratio for each pixel using the individual dark observations col-
lected during the current anneal cycle
5. Calculate the stability threshold of the entire anneal cycle
The stability threshold is defined as the stability ratio at which the % of cold and stable
pixels varies by less than 0.5%. This is done by measuring the cold and stable population at
different stability ratios ranging from 1.0 to 5.0, iterating in steps of 0.1, until the cold and
stable population plateaus with < 0.5% change from the previous iteration. The stability
ratio at this point is defined as the stability threshold for that anneal cycle, and all pixels
with stability ratios at or greater than this threshold are deemed unstable, while pixels below
this threshold are deemed stable.
Figure 3 illustrates how the population sizes vary as a function of stability ratio and
helps explain how the stability threshold is calculated using the cold and stable population
plateau. The algorithm iterates through stability ratios in steps of 0.1 and determines the
population size of the four different pixel classifications. For the April 16, 2020 anneal cycle,
the stability threshold was set to 3.2; therefore all pixels with stability ratios equal to or
greater than 3.2 are flagged as unstable for that cycle.
– 7 –
Fig. 3.—The population size of the four different pixel classifications (Y) at a certain stability
ratio (X). The vertical line denotes the stability threshold, i.e. the stability ratio at which
the cold and stable population size does not vary by more than 0.5%.
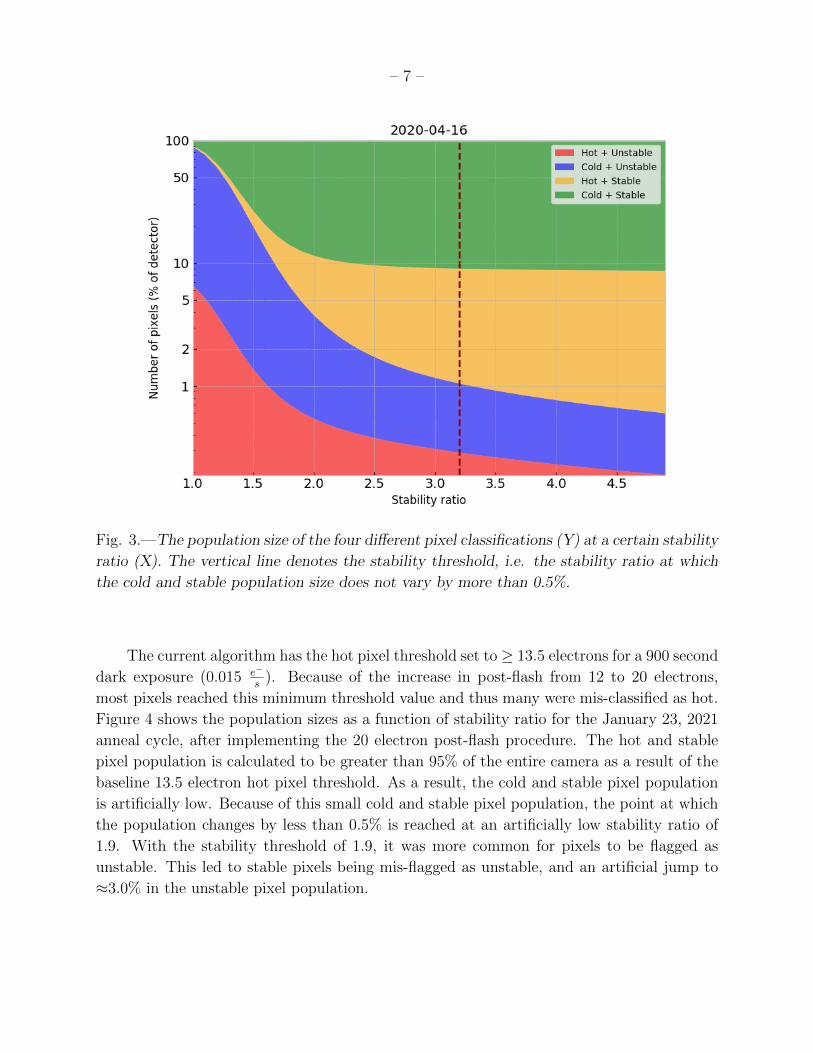
The current algorithm has the hot pixel threshold set to ≥ 13.5 electrons for a 900 second
dark exposure (0.015 e−
s). Because of the increase in post-flash from 12 to 20 electrons,
most pixels reached this minimum threshold value and thus many were mis-classified as hot.
Figure 4 shows the population sizes as a function of stability ratio for the January 23, 2021
anneal cycle, after implementing the 20 electron post-flash procedure. The hot and stable
pixel population is calculated to be greater than 95% of the entire camera as a result of the
baseline 13.5 electron hot pixel threshold. As a result, the cold and stable pixel population
is artificially low. Because of this small cold and stable pixel population, the point at which
the population changes by less than 0.5% is reached at an artificially low stability ratio of
1.9. With the stability threshold of 1.9, it was more common for pixels to be flagged as
unstable. This led to stable pixels being mis-flagged as unstable, and an artificial jump to
≈3.0% in the unstable pixel population.

– 8 –
Fig. 4.—The population sizes of the four different pixel classifications as a function of
stability ratio with a 13.5 e− hot pixel threshold. The vertical line denotes the stability
threshold set to 1.9 due to the small cold and stable pixel population.
3. The Solution: Re-evaluating the Existing Hot Pixel Threshold
To correct for this error, the hot pixel threshold is re-calculated based on the current
post-flash amount of 20.0 electrons. Rather than hard-coding a hot pixel threshold into the
algorithm, a formula has been implemented in order to account for any change in post-flash
amount in the future. This will improve the accuracy of the hot pixel threshold used for
classifying hot pixels in future deliveries. The following formula is the expression for the
UVIS hot pixel threshold for both chips:
Hot P ixel Threshold = Postflash Amt. + (Dark Current Rate× Exp. T ime) (2)

– 9 –
With a post-flash amount of 20 e−, a dark current rate of 0.003 e−
s, and an exposure
time of 900s, using Equation 2 above, the new hot pixel threshold is determined to be 22.7
e−. We re-run the algorithm with this new threshold which yields the following results shown
in Table 1 for the Jan 23, 2021 anneal cycle compared to the previous run with the original
hot pixel threshold.
As seen in Figures 5 and 6, the cold and stable population comprises over 90% of
the detector, while the hot and stable population drops down to less than 5%. This is in
agreement with the current hot pixel population calculated from the WFC3 Quicklook dark
reference file monitor. As a result, we have a new stability threshold of 2.9 which leads to
a new unstable pixel population of about 1.07% which trends with previous anneal cycles
before the 20 electron post-flash procedure.
Classification Type Population Size
13.5 e− threshold 22.7 e− threshold
1. Hot and Unstable 2.58% 0.18%
2. Hot and Stable 87.53% 3.84%
3. Cold and Unstable 0.06% 0.89%
4. Cold and Stable 7.83% 93.09%
Table 1: Comparison of population sizes for the four different pixel classification types on
the UVIS camera, using 13.5 and then 22.7 as the hot pixel threshold.

– 10 –
Fig. 5.—The population size of the four different pixel classifications after implementing the
new 22.7 e− hot pixel threshold. The stability threshold now lands on 2.9, in agreement with
previous 12 electron post-flash cycles.

– 11 –
Fig. 6.—An intensity map showing the distribution of pixels on the UVIS detector as a
function of stability ratio and mean SCI value (in electrons). Pixels in the top right quadrant
are hot and unstable pixels, while pixels on the bottom left quadrant are cold and stable
pixels.
Finally, the results from Figure 2 are revisited and the November and December 2020
anneal cycles are re-processed with the updated pipeline to output the results shown in
Figure 7. The unstable pixel population for these two anneal cycles is brought down from
3.28% (3.07%) to 1.11% (1.16%) for chip 1 (2) for the November 2020 anneal cycle, and from
3.31% (3.08%) to 1.05% (1.08%) for chip 1 (2) for the December 2020 anneal cycle, providing
further evidence of Equation 2’s efficacy in improving unstable pixel population accuracy.

– 12 –
2020-01 2020-03 2020-05 2020-07 2020-09 2020-11 2021-01USEAFTER
1.0
1.5
2.0
2.5
3.0
Unst
able
Pix
el F
lags
(% o
f chi
p)
Unstable Pixel Population vs. Timechip2 - 13.5 threshchip1 - 13.5 threshchip2 - 22.7 threshchip1 - 22.7 thresh20 electron flash start
Fig. 7.—New results for the November and December 2020 anneal cycles after being pro-
cessed through the updated UVIS bad pixel table pipeline.
3.1. The October 28, 2020 Anneal
The lowest datapoints in Figures 2 and 7 correspond to the Oct 28, 2020 anneal cycle,
in which the new 20 electron post-flash started partway. Because the 20 electron post-flash
began halfway into the anneal cycle on Nov 12, 2020, the pixels had a value of about 12
electrons for half of the anneal, and 20 electrons for the other half. This large variance led
to an artificially high stability threshold that is a consequence of the sudden change in post-
flash amount. Figure 8 is the stability ratio map of the Oct 28, 2020 anneal cycle compared
with April 16, 2020 anneal cycle. The stability ratio for each of the pixels is artificially high

– 13 –
in the October anneal cycle, which leads to a large stability threshold as a result. This large
stability threshold causes an under-flagging of unstable pixels because the threshold value is
more difficult to reach. As a consequence of this, about 0.5% of the UVIS pixel population
are incorrectly flagged as stable. To correct for this, 2 UVIS bad pixel tables are generated
for the Oct 28, 2020 anneal cycle: One for the first half of the cycle, one for the latter half.
This is to ensure the variance remains consistent with previous anneals.

–14
–
Fig. 8.—The stability ratio map for the Oct 28, 2020 anneal cycle compared to that of April 16, 2020. Due to the increase
in post-flash intensity from 12 to 20 electrons midway into the anneal cycle, the algorithm calculated anomalously high
stability ratios in the Oct 28, 2020 anneal cycle.

– 15 –
4. Conclusions
An anomalous jump in unstable pixel population was first observed in the November
2020 anneal cycle during the UVIS bad pixel table delivery process. An investigation was
led using the January 2021 anneal cycle and it was found that the apparent rise in instability
came after the new implementation of the procedure that involves flashing the UVIS detector
with a 20 electron post-flash prior to image readout. This new 20 electron post-flash led a
majority of the UVIS pixels to be labeled as hot, which resulted in an anomalously low cold
and stable pixel population. Because the stability threshold is a function of two components:
the cold and stable population, and the stability ratios of all the UVIS pixels for a given
anneal cycle, this small cold and stable population reached a plateau in population change
at a stability ratio of 1.9 for the January 2021 anneal cycle. This false stability threshold led
to more pixels being mis-classified as unstable, which contributed to the jump in unstable
pixel population. The solution to this was to correct the hot pixel threshold by developing
a formula for determining the value instead of using the hard-coded 13.5 electron threshold
originally in place. This formula is now a modifiable parameter in the algorithm that will
change based on the post-flash intensity and dark current for a given epoch, making it
future-proof.
The new hot pixel threshold for this epoch is determined to be 22.7 electrons, using
Equation 2 for the calculation. Following the implementation of this new hot pixel thresh-
old, the January 2021 anneal cycle is reprocessed and the cold and stable pixel population
returned to 93.09%, consistent with the results from the 12 e− post-flash anneal cycles. The
stability threshold also increased from 1.9 to 2.9, which led to a reduction in the unstable
pixel population from 2.64% to 1.07% for the entire UVIS detector. Moreover, the Novem-
ber and December 2020 anneal cycles are reprocessed and show consistent results with that
of January 2021, with the unstable pixel population brought down from 3.28% (3.07%) to
1.11% (1.16%) for chip 1 (2) for the November 2020 anneal cycle, and from 3.31% (3.08%)
to 1.05% (1.08%) for chip 1 (2) for the December 2020 anneal cycle
5. Acknowledgements
I would like to thank Matthew Bourque for the design and documentation of the UVIS
bad pixel table pipeline. I would also like to thank Mariarosa Marinelli, Benjamin Kuhn,
and Joel Green for their reviews of this ISR.

– 16 –
References
Anderson, J., WFC3 Instrument Science Report 2020-08 (Baltimore: STScI)
https://www.stsci.edu/files/live/sites/www/files/home/hst/instrumentation/
wfc3/documentation/instrument-science-reports-isrs/_documents/2020/ISR_2020-08.
Bourque, M., et al., WFC3 Instrument Science Report 2018-15 (Baltimore: STScI)
https://www.stsci.edu/files/live/sites/www/files/home/hst/instrumentation/
wfc3/documentation/instrument-science-reports-isrs/_documents/2018/WFC3-2018-15.
Bourque, M. & Baggett, S., WFC3 Instrument Science Report 2016-08 (Baltimore: STScI)
https://www.stsci.edu/files/live/sites/www/files/home/hst/instrumentation/
wfc3/documentation/instrument-science-reports-isrs/_documents/2016/WFC3-2016-08.
Dressel, L., 2021. Wide Field Camera 3 Instrument Handbook, Version 13.0 (Baltimore:
STScI)
https://hst-docs.stsci.edu/wfc3ihb
Kuhn, B., & Anderson, J., 2021. WFC3 Instrument Science Report 2021-06 (Baltimore:
STScI)
https://www.stsci.edu/files/live/sites/www/files/home/hst/instrumentation/
wfc3/documentation/instrument-science-reports-isrs/_documents/2021/wfc3-isr-2021-06.
Medina, J. V., Bourque, M., Baggett, S., 2019. WFC3 Instrument Science Report 2019-10
(Baltimore: STScI)
https://www.stsci.edu/files/live/sites/www/files/home/hst/instrumentation/
wfc3/documentation/instrument-science-reports-isrs/_documents/2019/WFC3-2019-10.
Recommended