United Technologies Corporation Annual Report 2008 Financial and Corporate Responsibility Performance
More with less.

Shareowner Letter 2Our Commitments 3Financials At-a-glance 4Company Overview 5Performance 6Efficiency 10Integration 14Customers 18Discipline 22Corporate Responsibility 24
Overview 24At-a-glance 262008 Progress and Challenges 282009 Objectives 29Focus Areas 30Recognition 31
Operations Review and Corporate ResponsibilityProgress and Challenges by business unit 32
Financials 39Cautionary note concerning factors that mayaffect future results 62
Board of Directors 92Permanent Committees 92Leadership 93Shareowner Information 94
On the cover: The Shanghai World Financial Center.In 2008, this building opened with 64 Otis elevators andescalators, including four Gen2 elevators, and threeenergy efficient, non-ozone depleting Carrier chillers.
China set an ambitious goal for the 2008 Beijing Gamesto be the greenest Games in history. UTC partnered withChina’s Ministries of Housing and Urban-Rural Developmentand Environmental Protection to promote non-ozonedepleting and energy efficient products. Carrier won69 percent of the heating, ventilation and air-conditioningcontracts awarded, including the Olympic Village andthe “Water Cube” National Aquatics Center, where morethan half of the exhaust heat was used to warm theswimming pool. Otis provided the aquatics center with10 environmentally sound Gen2 elevators.
Table of Contents

CHALLENGE2008 Annual Report 1
Every day at UTC, we challenge ourselves to be better, to redefine what is possible and to do more withless through increased efficiency and effectiveness. To accomplish this, we rely on the fundamentals thathave consistently delivered results: productivity and cost, innovation and global presence combining formarket leadership.

2 United Technologies Corporation
Dear ShareownerUTC delivered strong results in 2008 despite the economic challenges which accelerated across
the world’s economies as the year progressed. As in years past, this reflected the competitive-
ness of the Corporation’s businesses in markets worldwide and the maturity of its operating
disciplines and management team. We believe we are well positioned to continue to outper-
form peers in 2009.
The board increased the dividend by just over 20 percent in October. In the decade ending
2008, dividends increased more than 300 percent and paralleled earnings increases over the
same period. Free cash flow again exceeded net income and liquidity remains high. We early
retired $500 million of long term debt maturing in 2009 following a $1.25 billion issuance in
December on attractive terms.
Revenues reached $58.7 billion, 7 percent above the prior year. Earnings grew 15 percent to
$4.90 per share. Notwithstanding these exceptional results, UTC’s stock price contracted along
with virtually all others in 2008. However, we outperformed peers and market averages as we
have so often in the past. We anticipate continued outperformance and took advantage of
price weakness to accelerate share repurchase to $3.2 billion for the year, a record for UTC.
We look ahead to 2009 with confidence despite market and economic uncertainties. Preparing
for contracting markets while continuing to invest in long term product development were
management’s focus throughout 2008. Restructuring costs totaled $357 million for the year
and were well in excess of one time gains. Company funded research and development
increased $100 million to $1.8 billion. We see unusual opportunities to field new products
and believe these will vindicate management’s and investors’ confidence in building on UTC’s
already leading market franchises worldwide.
Notable developments in 2008 included completion of flight test at Airbus of Pratt &Whitney’s
new Geared Turbofan engine. This next generation engine promises 12 percent lower fuel
consumption and more than half reductions in both nitrogen oxides and noise over engines
currently in flight. Sikorsky’s X2 Technology demonstrator flew first in August and is confirming
expectations of flight at speeds exceeding 250 knots while preserving a helicopter’s traditional
advantages of hover and vertical flight. Both products reflect decades of development and
offer exceptional promise.George David, Chairman, and Louis Chênevert, President and Chief Executive Officer

2008 Annual Report 3
Our CommitmentsCost reduction and productivity are embedded disciplines at UTC. We manage these through
our Achieving Competitive Excellence (ACE) operating system which has been deployed across
UTC worldwide for more than a decade. Each of 859 management sites is assessed against
standards and expectations and rated accordingly. Forty-nine percent of sites achieved Gold
and Silver status in 2008, and we remain on track to achieve our 70 percent goal by the end
of 2009. Over and over again we confirm that these ACE disciplines add materially to
productivity, quality, delivery and balance sheet metrics for UTC. They are a principal reason
for the Corporation’s outperformance over extended periods.
We affirm our traditional commitments to the highest standards of corporate responsibility,
including compliance with laws and regulations and UTC’s Code of Ethics, environmental
performance, and a safe and healthy place to work. For the first time, this Annual Report
combines business and financial results with those on corporate responsibility. Notable
accomplishments in 2008 were continued and significant improvements in lost workday inci-
dence and resource use generally. The former decreased to 0.26, 16 percent improved over
2007. UTC’s carbon footprint decreased 6 percent in 2008 and exceeded the 2 percent average
improvement rate over the last decade. Our current carbon footprint reduction goal is 3 per-
cent annually through 2010. Water consumption decreased 7 percent in 2008 and cumulatively
is 53 percent lower than a decade ago. These reductions are absolute and are exceptional on
business volumes more than twice those 10 years ago.
The binding theme in these business and corporate responsibility results for UTC is doing
more with less. It is the core operating commitment and value at this Corporation. Looking
back at more than a decade’s performance, we affirm that startling gains are possible and,
indeed, at rates we would not have thought possible at the outset. It’s the reason we should all
be confident in a long term and bright future for the world’s economies and resource con-
sumption rates even in times of uncertainty and anxiety generally.
The results reported throughout this Annual Report reflect the dedication and commitment
of UTC’s more than 220,000 employees worldwide. On behalf of shareowners, we thank every
single one for exceptional contributions. This is a truly amazing company and employees
make it so.
George David, Chairman Louis Chênevert, President and Chief Executive Officer
Our Commitments define who we are and how we work. They focus our businesses and move us forward.
Performance. Our customers have a choice, and how we perform determines whether they
choose us. We aim high, set ambitious goals and deliver results, and we use customer feedback
to recalibrate when necessary. We move quickly and make timely, well-reasoned decisions
because our future depends on them. We invest authority where it needs to be, in the hands
of the people closest to the customer and the work.
Innovation. We are a company of ideas that are nurtured by a commitment to research and
development. The achievements of our founders inspire us to reach always for the next
innovative and powerful and marketable idea. We seek and share ideas openly and encourage
diversity of experience and opinion.
Opportunity. Our employees’ ideas and inspiration create opportunities constantly, andwithout limits. We improve continuously everything we do, as a company and as individuals.
We support and pursue lifelong learning to expand our knowledge and capabilities and to
engage with the world outside UTC. Confidence spurs us to take risks, to experiment, to
cooperate with each other and, always, to learn from the consequences of our actions.
Responsibility. Successful businesses improve the human condition. We maintain the highest
ethical, environmental and safety standards everywhere, and we encourage and celebrate our
employees’ active roles in their communities.
Results. We are a preferred investment because we meet aggressive targets whatever the
economic environment. We communicate honestly and forthrightly to investors, and deliver
consistently what we promise. We are a company of realists and optimists, and we project
these values in everything we do.

Revenues by geography as percent oftotal revenues
Revenues by business type as percent oftotal revenues
RevenuesDollars in billions
17%
62% 21%
At-a-glance
Commercial& Industrial
CommercialAerospace
MilitaryAerospace &Space
60%40%
OriginalEquipmentManufacturing
Aftermarket
16%
36%United States
Other
Asia Pacific
04
37.4
05
42.7
06
47.8
07
54.8
08
58.7
04
2.64
05
3.12(1)
06
3.71
07
4.27
08
4.90
04
3.6
05
4.3
06
4.8
07
5.3
08
6.2
04
2.9
05
2.8
06
3.2
07
3.6
08
3.8
04
0.70
05
0.88
06
1.02
07
1.17
08
1.35
04
28
05
33
06
31
07
30
08
42(3)
Diluted earnings per common shareDollars per share
Cash flow from operationsDollars in billions
Debt to capitalPercent
Dividends paid per common shareDollars per share
Research and development (2)
Dollars in billions
United Technologies Corporation provides high technology products and services to the building systems and aerospace industries worldwide
through our industry-leading businesses. In 2008, UTC revenues increased 7 percent to $58.7 billion. Cash flow from operations less capital
expenditures exceeded net income. Strength in long cycle businesses and early restructuring actions offset the adverse impact of a stronger
U.S. dollar and deteriorating global economy in the second half of 2008. Earnings per share grew 15 percent to $4.90 per share.
Businesses in balance UTC’s balanced
portfolio of businesses spans geographies,
markets and customer relationships.
Financials
17%
31%
4 United Technologies Corporation
Europe
(1) 2005 amount is diluted income per share before the $0.09 cumulative effect of a change in an accounting principle related to the adoption of Financial Accounting Standards Board Interpretation No. 47, “Accounting for Conditional Asset RetirementObligations,” which resulted in a non-cash after tax cumulative impact on the fourth quarter 2005 results of $95 million or $0.09 per share.
(2) Amounts include company- and customer-funded research and development.(3) The increase in the 2008 debt to capitalization ratio includes net unrealized losses of approximately $4.2 billion due to the effect of market conditions on our pension plans.

Company OverviewCarrierEmployees: 40,651
Revenues: $14.9 billion
Operating Profit: $1.3 billion
Heating, ventilation, air-conditioning and
refrigeration (HVACR) systems, controls,
services and sustainable building solutions
for residential, commercial, industrial, food
service and transportation applications.
Hamilton SundstrandEmployees: 18,311
Revenues: $6.2 billion
Operating Profit: $1.1 billion
Electrical power generation and distribu-
tion systems, engine accessories and
control systems, flight control systems
and pilot controls, propulsion systems,
environmental control systems, auxiliary
power units, LED lighting, and fire
protection products for aircraft and
military ground vehicles; prime contractor
of NASA’s space suit/life support system,
electric power system and various other
systems for international space programs,
including fuel cells for the U.S. space shuttle
program; industrial products, including
portable and stationary air compressors,
high pressure pumps, gas compressors, and
metering pumps and systems.
OtisEmployees: 64,324
Revenues: $12.9 billion
Operating Profit: $2.5 billion
Design, manufacture, installation, service
and upgrade of elevators, escalators and
moving walkways for all buildings, includ-
ing commercial, residential, multipurpose
malls, educational institutions and urban
transportation systems.
Pratt & WhitneyEmployees: 37,987
Revenues: $13.0 billion
Operating Profit: $2.1 billion
Turbofan engines for large commercial and
military aircraft; turbofan and turboprop
engines for regional, business, light jet,
utility and military aircraft; turboshaft
engines for military and commercial
helicopters; land-based gas turbine and
geothermal power solutions for the indus-
trial and utility markets; maintenance,
repair and overhaul services, including
the sale of spare parts, as well as fleet man-
agement services; liquid space propulsion
systems for military and commercial
applications, including NASA’s space
shuttle and Vision for Space Exploration.
SikorskyEmployees: 16,937
Revenues: $5.4 billion
Operating Profit: $478 million
Military and commercial helicopters;
fixed-wing aircraft; spare parts and
maintenance, repair and overhaul
services for helicopters and fixed-wing
aircraft; civil helicopter operations.
UTC Fire & SecurityEmployees: 42,523
Revenues: $6.5 billion
Operating Profit: $542 million
Electronic security and fire safety systems,
software and services; design, integration,
installation and servicing of access control,
intruder alarm, video surveillance, and
fire detection and suppression systems;
monitoring, response and security personnel
services.
UTC PowerEmployees: 893
UTC Power does not report financial
information as a separate segment.
Fuel cell systems for onsite power
applications and transportation.
2008 Annual Report 5

Pratt & Whitney’s F135 propulsion system powers theF-35 Lightning II flight test program. The program achievedsupersonic flight and assembled 10 flight test engines in2008. Other milestones include successfully completingmore than 10,000 test hours and engine restart flight testing.
6 United Technologies Corporation

PERFORMANCE
Customers have a choice and how we perform determines this. Our products are everywhere and ourequipment long lived, so we set goals to exceed industry performance. Whether reducing jet enginenoise or generating electricity geothermally, UTC’s products bring energy efficiency and conservationto the building systems and aerospace industries. We know everything we do today can be done bettertomorrow, resulting in greater value for customers and shareowners.
2008 Annual Report 7

8 United Technologies Corporation
More ideas.
At UTC, ideas accelerate progress, from improving design efficiencies to delivering tomorrow’s technology today. Sikorsky reached a milestone in 2008 with the first flight of the X2 Technology
demonstrator. The flight was the culmination of a prototyping process to rapidly and affordably design, build and test integrated technologies. The X2 Technology demonstrator is expected to
fly approximately twice as fast as conventional helicopters while expanding high altitude performance, improving maneuverability and reducing noise. United Technologies Research Center(UTRC) supports UTC businesses by developing technologies that provide real-world solutions. UTRC is a leader in modeling and simulation of multiphase flow, and uses advanced, proprietary
computational tools to understand and predict the behavior of sprays. The results can include fuels that are consumed more efficiently, therefore producing fewer emissions, and environmentally
friendly fire suppression methods. Whether pioneering hypersonic flight or advancing integrated building systems, UTRC is where intellectual energy accelerates progress.

2008 Annual Report 9
Less conventional.
Pratt &Whitney Rocketdyne has provided the Space Shuttle Main Engines (SSMEs) since the first U.S. shuttle mission in 1981. In 2008, SSMEs powered four shuttle missions, including the launch
of the Space Shuttle Endeavour in November 2008. During this mission, the crew tested an advanced recycling system that makes wastewater usable. Hamilton Sundstrand designed and built the
system, which may eliminate the need to bring fresh water from Earth on extended space missions. Once testing is complete, the water can be used for drinking and bathing and to produce oxygen
for breathing. In its first year, Carrier’s PrimeLINE digital scroll container refrigeration unit received orders for more than 20,000 units from customers worldwide. PrimeLINE is designed to reduce
environmental impact and is the most energy efficient container refrigeration unit ever offered in the industry. Its efficiency and power consumption are best in class and lifecycle costs are as much
as 30 percent lower than competitive units. When you start with the premise that everything done today can be done better tomorrow, the results are often unconventional.
Opposite page: The X2 Technology demonstrator during a Sikorsky testflight in Horseheads, N.Y. (left). Engineers analyzing sprays at UTRC inEast Hartford, Conn. (right).
This page: The launch of the Space Shuttle Atlantis, powered by threePratt & Whitney Rocketdyne SSMEs in February 2008. Hamilton SundstrandAuxiliary Power Units provided the rocket boosters’ and main engines’ thrustvectoring, which helped guide the shuttle’s direction (left). Maersk Line,the world’s largest shipping company, has awarded Carrier significantorders for the PrimeLINE digital scroll container refrigeration unit (right).

10 United Technologies Corporation
Continuous improvement requires constant monitoringagainst goals and objectives to deliver on our promises tocustomers. At UTC locations around the world, such asHamilton Sundstrand’s Energy, Space & Defense unit inWindsor Locks, Conn. (pictured), we track progress on adaily basis and adjust to changing business conditions.

EFFICIENCY
Our world has limited resources. Materials, time and energy are scarce and increasingly expensive.To streamline processes and improve product efficiency, UTC applies our Achieving Competitive Excellence(ACE) operating system, carried out by each employee, every day. We call it an operating system becauseit’s not a program with a beginning or end, but rather a way of thinking and performing. From design tomanufacture to customer support, our processes and products do more with less.
2008 Annual Report 11

12 United Technologies Corporation
More power.
Our philosophy is doing more with less, without sacrificing performance. Carrier’s Vector 1800MT transport refrigeration unit is 20 percent more fuel efficient and emits 20 percent fewer particulates
in the fuel burning process compared with its previous product line. The unit does not require a diesel motor to run during loading and unloading, and its components are 94 percent recyclable.
UTC Power’s PureCell system is a clean, efficient, reliable hydrogen fuel cell power plant whose only by-product is water. UTC Power has more than 8 million operating hours, and in 2008, its next-
generation fuel cell was selected to supply power for the Freedom Tower and three other towers under construction at the World Trade Center site in New York City.

2008 Annual Report 13
Less energy.
UTC supports sustainable development in existing cities and eco-cities built from the ground up to have minimal effect on the environment. One example is Songdo International Business District
in South Korea. UTC is collaborating with Gale International and POSCO E&C, the city’s co-developers, to install a broad range of energy efficient equipment. UTC’s sustainable technologies, such
as Gen2 elevators, high-speed elevators with regenerative drives, water-cooled HVAC systems, security and control systems, and fuel cell powered electrical systems, can substantially reduce energy
use. Supported by 20 years of research and development, Pratt &Whitney’s PurePower PW1000G engine with Geared Turbofan technology is expected to deliver significant savings, including more
than 12 percent reduction in fuel burn, 55 percent reduction in nitrogen oxide emissions and 50 percent reduction in engine noise. The engine will power two new jets, the Mitsubishi Regional Jet
and the Bombardier CSeries, both scheduled to enter service in 2013.
Opposite page: A Paradise Island Foods truck equipped with Carrier’sVector 1800MT multi-temperature trailer refrigeration unit (left). UTCPower fuel cells power a Cabela’s store in East Hartford, Conn. (right).
This page: An aerial view of Songdo International Business District inSouth Korea (left). Pratt & Whitney’s PurePower PW1000G demonstratorengine on an Airbus A340-600 aircraft (right).

14 United Technologies Corporation
Hamilton Sundstrand provides key components of the fly-by-wiretechnology system for the Sikorsky UH-60M Upgrade BLACK HAWK,Canadian Maritime, CH-53K and X2 Technology demonstratorhelicopters. This technology replaces mechanical flight controlswith electronic systems that significantly enhance control andmaneuverability. This also increases safety and reduces the pilot’sworkload, aircraft weight and maintenance costs.

INTEGRATION
We grow by engineering new possibilities. At UTC, integration means people, processes and technologiescoming together to multiply the effects of innovation. It’s taking the thinking of more than 220,000 employeesin 4,000 locations around the world and harnessing it to deliver value to customers everywhere. Sometimeswe find solutions in unexpected places, such as applying knowledge gained from modeling the surface physicsof advanced materials in jet engine components to improve elevator brake system designs.
2008 Annual Report 15

16 United Technologies Corporation
More content.
In 2004, Boeing selected Hamilton Sundstrand to supply nine systems on the new 787 Dreamliner, including the electrical, air thermal management and auxiliary power systems. Hamilton
Sundstrand supports this new aircraft’s development at its Airplane Power System Integration Facility (APSIF) in Rockford, Ill. Through high-speed data links, engineers thousands of miles
apart have the ability to test and verify systems in a real-time, collaborative environment. More than 14,000 hours of integration testing have taken place at this facility. UTC Power has been a
world leader in fuel cell technology for more than 50 years. In 2008, the U.S. Department of Energy selected UTC Power to lead a team to develop solid oxide fuel cells, which use ceramic cell
technology that can be powered by a range of fuels. United Technologies Research Center (UTRC) provided initial research for this new generation of fuel cells that can convert chemical
energy to electricity with lower greenhouse gas emissions.

2008 Annual Report 17
Less weight.
Otis’ Gen2 elevators replace conventional steel ropes with a flexible coated steel belt, resulting in a compact elevator system that does not require a machine room. The belts are stronger than tradi-
tional cables and last up to three times longer. The Gen2 system reduces energy use by up to 50 percent compared with conventional systems and up to 75 percent when combined with Otis ReGen
drives, which feed energy generated by descending elevators back into the building, lowering overall building costs. More than 150,000 units have been sold worldwide. The Beijing South Railway
Station, one of the largest in Asia, is equipped with 116 Otis elevators and escalators, including 36 Gen2 elevators.
Opposite page: Engineers at Hamilton Sundstrand’s APSIF laboratory inRockford, Ill., testing the performance of critical systems for Boeing’srevolutionary 787 Dreamliner (left). Solid oxide fuel cell technology indevelopment at UTRC in East Hartford, Conn. (right).
This page: The Beijing South Railway Station, Beijing. Otis was selectedfor this infrastructure project to provide its energy efficient and environ-mentally sound products, such as the Gen2 elevator.

18 United Technologies Corporation
Aftermarket services are essential to UTC’s sustainedperformance and represent 40 percent of revenues. Otis,Carrier and UTC Fire & Security, including its Sicli business,have service technicians in locations around the world,such as Paris (pictured). Our aerospace businesses alsooffer cost-effective services to customers globally.

what customers want.
DELIVERING
Customers around the world rely on UTC’s products and services to make cities more efficient, people moresecure and travel more comfortable every single day. We deliver quality and reliability, always striving toreach new levels of customer satisfaction and shareholder value. We use customer feedback continually torecalibrate requirements and improve performance.
2008 Annual Report 19

20 United Technologies Corporation
More service.
Rapid growth has transformed the skylines of major cities worldwide, such as Shanghai, where many buildings depend on UTC’s integrated products and maintenance services. UTC’s aftermarket
services complement our core capabilities and provide cost-effective services to these customers. From hotels to cruise ships to landmark buildings,UTC Fire & Security’s HI-FOG water mist fire
protection system uses micro-droplets of water that efficiently cool a fire to the point of extinguishing it. The system requires up to 90 percent less water than conventional sprinklers, which results
in less damage for customers.
2008 Annual Report 21
Less wait.
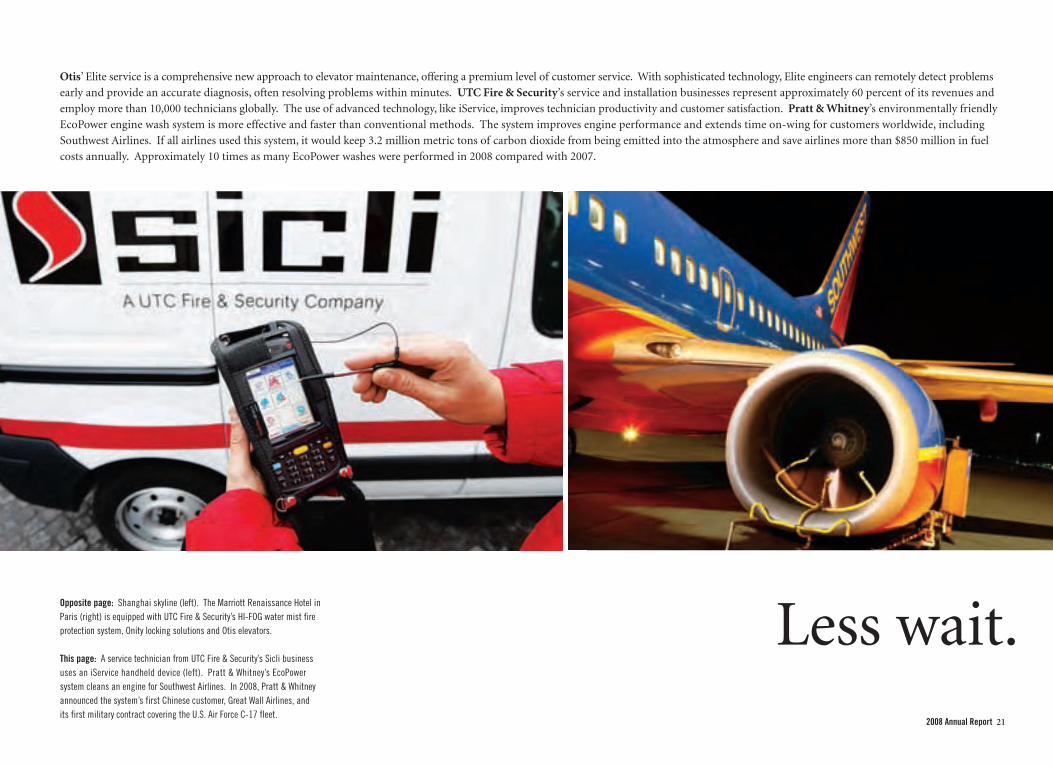
Otis’ Elite service is a comprehensive new approach to elevator maintenance, offering a premium level of customer service. With sophisticated technology, Elite engineers can remotely detect problems
early and provide an accurate diagnosis, often resolving problems within minutes. UTC Fire & Security’s service and installation businesses represent approximately 60 percent of its revenues and
employ more than 10,000 technicians globally. The use of advanced technology, like iService, improves technician productivity and customer satisfaction. Pratt & Whitney’s environmentally friendly
EcoPower engine wash system is more effective and faster than conventional methods. The system improves engine performance and extends time on-wing for customers worldwide, including
Southwest Airlines. If all airlines used this system, it would keep 3.2 million metric tons of carbon dioxide from being emitted into the atmosphere and save airlines more than $850 million in fuel
costs annually. Approximately 10 times as many EcoPower washes were performed in 2008 compared with 2007.
Opposite page: Shanghai skyline (left). The Marriott Renaissance Hotel inParis (right) is equipped with UTC Fire & Security’s HI-FOG water mist fireprotection system, Onity locking solutions and Otis elevators.
This page: A service technician from UTC Fire & Security’s Sicli businessuses an iService handheld device (left). Pratt & Whitney’s EcoPowersystem cleans an engine for Southwest Airlines. In 2008, Pratt & Whitneyannounced the system’s first Chinese customer, Great Wall Airlines, andits first military contract covering the U.S. Air Force C-17 fleet.

22 United Technologies Corporation
Our products make modern life possible and,in some cases, save lives. Over the past fiveyears, Sikorsky helicopters have helped save50,826 lives. Pictured: A Sikorsky Searchand Rescue S-92 helicopter during a Maritimeand Coastguard Agency training exercise inStornoway, Scotland.

DISCIPLINE
Successful businesses improve the human condition. At UTC, profitability and responsibility go hand inhand, and we measure success through financial, operational, ethical, and environment and safety metrics.We believe the profitability and responsibility elements are equally important, and our record sustains this.As a global company we have global impacts, and we want these always to be net positive and increasingly so.
2008 Annual Report 23

24 United Technologies Corporation
More progress.
At UTC, corporate responsibility combines financial performance with commitments to employees, the environment and communities. We don’t choose between these priorities and have robust
metrics in place to measure performance. UTC has more than 16,000 employees in China, so when the earthquake hit China’s Sichuan province in May, UTC along with our employees donated
$1.5 million in cash and in-kind goods and services to support victims. Through our relationship with Conservation International, we also are supporting reforestation of damaged land in
Xiaozhaizigou Nature Reserve in this province. This is just one example of UTC’s commitment to communities around the world where our employees live and work. UTC’s innovations make
modern life possible while using energy more efficiently. Our products are diverse, but they all convert energy into useful work, from air conditioners and elevators to jet engines and helicopters.
Our PureCycle geothermal power system uses hot water, a clean, renewable energy resource, to provide constant power.
Corporate Responsibility
2008 Annual Report 25
Less consumption.
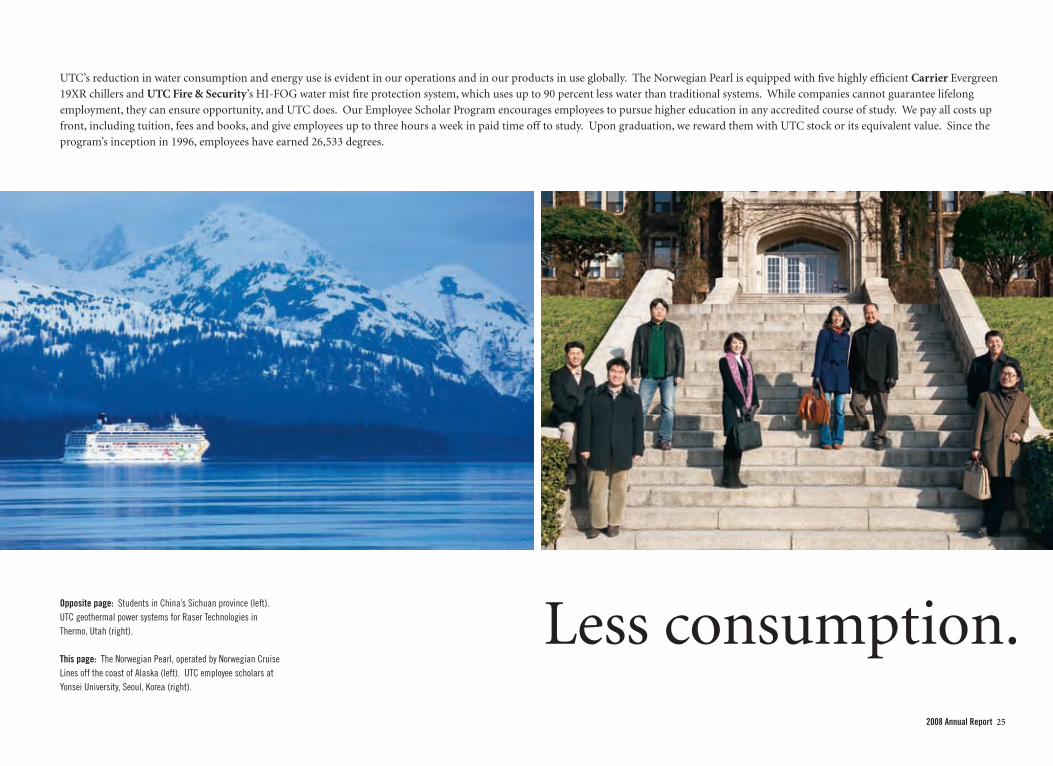
UTC’s reduction in water consumption and energy use is evident in our operations and in our products in use globally. The Norwegian Pearl is equipped with five highly efficient Carrier Evergreen
19XR chillers and UTC Fire & Security’s HI-FOG water mist fire protection system, which uses up to 90 percent less water than traditional systems. While companies cannot guarantee lifelong
employment, they can ensure opportunity, and UTC does. Our Employee Scholar Program encourages employees to pursue higher education in any accredited course of study. We pay all costs up
front, including tuition, fees and books, and give employees up to three hours a week in paid time off to study. Upon graduation, we reward them with UTC stock or its equivalent value. Since the
program’s inception in 1996, employees have earned 26,533 degrees.
Opposite page: Students in China’s Sichuan province (left).UTC geothermal power systems for Raser Technologies inThermo, Utah (right).
This page: The Norwegian Pearl, operated by Norwegian CruiseLines off the coast of Alaska (left). UTC employee scholars atYonsei University, Seoul, Korea (right).

At-a-glance
Governance In 2008, UTC increased its Dow Jones Sustainability Indexes rating by 3 points
and again was named one of the Global 100 Most Sustainable Corporations in the World at
the World Economic Forum in Davos, Switzerland. We also received a positive assessment
from RiskMetrics’ ranking of the S&P 500, an AAA rating from Innovest Strategic Value
Advisors and were rated 9.5 out of 10 by GovernanceMetrics International.
Environment UTC has continuously reported Environment, Health & Safety (EH&S) perform-
ance since 1992. In 1997, we committed to 10-year goals to reduce energy and water use, which
resulted in a 19 percent reduction in energy use and a 49 percent reduction in water use by the
end of 2006. With 2006 as our baseline, we then set even more aggressive goals for improved
performance by the end of 2010. These goals include reducing greenhouse gas emissions by
3 percent annually and water consumption by 2.5 percent annually. Since the beginning of
2007, we have achieved reductions of 11 percent on both metrics. UTC environmental report-
ing standards encourage the ongoing analysis and correction of data as applicable following the
close of a reporting period. Previously reported annual environmental metric results may change
between annual reporting periods, and UTC will include any prior year data revisions in
current reporting. Additional information on UTC’s environmental reporting standards, our
EH&S goals and objectives, and our progress to date is posted at www.utc.com/responsibility.
Customers and Suppliers Since January 1, 2007, 1,124 key suppliers, representing approximately
40 percent of UTC’s product spend, completed self-assessments against baseline EH&S
expectations. All but 2 percent have met those requirements. We aim to have 100 percent
meeting expectations and onsite reviews conducted at 10 percent of the suppliers by the end
of 2010.
Corporate Responsibility
Dow Jones Sustainability IndexesTotal score
04
9.5
05
10
06
10
07
9.5
08
9.5
04
81.4
05
95.3
06
95.1
07
82.1
08
79.5
GovernanceMetrics InternationalAccountability RatingCompared to S&P 500 companiesbased on prior year data
RiskMetrics CorporateGovernance QuotientCompared to S&P 500 companiesas of Feb. 1, 2009
Greenhouse gasesMillion metric tons CO2e
Industrial process wasteMillion lbs
Worldwide water consumptionMillion gals
04
57
05
70
06
62
07
69
08
72
From greenhouse gas emissions to employee education, UTC measures corporate responsibility progress using key performance indicators (KPIs). Additional KPIs are available on our Web site at www.utc.com/responsibility.
26 United Technologies Corporation
04E 05E 06
390
07 08
311
297
93
338
257
81
recycled non-recycled
236
75
328
280
48
351
290
61
04E 05E 06
2,165
07
2,060
08
1,924
2,5242,156
04E 05E 06
2.44
07
2.31
08
2.172.02 2.03

Products In 2001, we began voluntarily eliminating materials of concern (heavy metals).
Our products are technically complex and require the highest quality and standards to
ensure safety. Finding safe, effective substitutes that also are acceptable to our customers has
proved challenging. While we will continue to eliminate materials of concern in legacy prod-
ucts and processes, our primary goal is to eliminate them in new products by the end of 2010.
In 2008, we achieved 53 percent elimination in new products. We have an additional goal to
increase product energy efficiency and reduce packaging, each by 10 percent, or achieve best-
in-class performance, by the end of 2010. Since the beginning of 2007, we have met the effi-
ciency goal in 68 percent and the packaging goal in 100 percent of new products launched.
People UTC continues to work on improving our health and safety record. Our worldwide
lost workday incident rate fell to .26 and our worldwide recordable incident rate fell to .97.
Regrettably, four UTC employees lost their lives while at work and 35 were seriously injured in
2008. There is no higher priority than employee safety and we continuously apply measures
to achieve hazard-free workplaces. Open access to education is an important benefit for all
UTC employees. In 2008, 15,197 employees in 54 countries furthered their education through
our unique Employee Scholar Program (ESP). Additional information on UTC’s ESP is
found on page 25 of this report and on our Web site.
Communities UTC maintained an above-average score in the social dimension of the Dow
Jones Sustainability Indexes and we use this as our social responsibility benchmark. Our 2008
contributions to non-profit organizations were $25.5 million. The increased dollars from
2007 were primarily cash and in-kind donations to universities around the world to advance
technological education. UTC employees in the United States volunteered more than 70,000
hours in their communities.
04
.34
05
.30
06
.49*
07
.31
08
.26
04
16.3
05
19.0
06
21.4
07
23.8
08
26.5
Elimination of materialsof concernNew products
Lost workday incident rateCases/100 employees
UTC contributionsDollars in millions
04
16.7
05
17.9
06
20.9
07
20.4
08
25.5
04
48
05
60
06
60
07
60
08
62
06
38%
07
44%
08
53%
Met goal Did not meet
32%
68%
Energy efficiencyNew products launched in 2007 and 2008
ESP cumulative degreesIn thousands
Dow Jones Sustainability IndexesSocial dimension
2008 Annual Report 27
*Re-baselined in 2006 to include Chubb,Kidde and Rocketdyne acquisitions.
28 United Technologies Corporation
2008 Progress and ChallengesCorporate Responsibility
Governance
Objectives and ProgressWork with the Ethics Resource Center (ERC) to benchmark UTC’s ethics programs against those ofcomparable companies. In 2008, UTC participated in the ERC’s Defense Industry Benchmark
survey. Overall results showed UTC’s score improved by 9 percentage points over 2005, and the
comparable survey average improved by 7 percentage points. UTC’s 2008 score was equivalent
to the 2008 survey average. The survey results confirmed that UTC is improving our ethical
culture and identified opportunities for improvement.
Improve by 3 percentage points responses to the 2009 biennial employee survey question that askswhether or not, “My managers comply with the UTC Code of Ethics.” In 2008, UTC focused on
strengthening ethics awareness and our compliance systems. We developed and provided a
toolkit for managers worldwide to help them communicate about ethics on a daily basis.
Employees took 606,000 ethics classes online. Accountability remains a priority and
357 employees lost their jobs for ethics violations, an increase of 68 over 2007.
ChallengesUTC continues to focus on export controls and implement more robust processes and audits.
When violations have occurred, UTC filed voluntary disclosures.
As previously reported, in 1999 the U.S. Department of Justice brought a lawsuit against
Pratt & Whitney, alleging that the company violated contract provisions and the civil False
Claims Act in pricing a contract awarded by the U.S. Air Force in 1984. The contract was
awarded competitively on the basis of price and other factors. At trial, the court found no
liability for contract or common law claims and no damages for any false claims. However, the
court awarded statutory penalties of $7.1 million. UTC is appealing the court’s decision and
believes the company is not liable.
In late 2008, Otis discovered misstatements of inventory and other accounting irregularities
at its subsidiary in Brazil and launched a full investigation into the accounting practices.
Otis took appropriate disciplinary action, including dismissals of those involved in the
misrepresentations, and arranged for an independent audit that is expected to be concluded
in 2009. Otis and UTC have a zero tolerance policy for ethical misconduct and continuously
work to strengthen governance activities and internal controls.
Environment
Objectives and ProgressReduce greenhouse gas emissions 3 percent annually and water consumption 2.5 percent annuallyfrom 2007 through 2010. In 2008, we reduced greenhouse gas emissions by 6 percent and water
consumption by 7 percent. We have met our 2010 water reduction goal and will continue to
aggressively identify and implement further reductions.
Invest $100 million from 2007 through 2010 in energy conservation projects, including co-generationsystems. Since the beginning of 2007, we have identified more than 900 projects valued at
$167 million and funded $96 million, half of which supports co-generation systems.
Ensure compliance with environmental permits. In 2008, UTC conducted 98 independent
compliance audits of our facilities worldwide. Actions to address risks were identified and
systematically tracked to closure. UTC operations that were not scheduled for independent
audits in 2008 conducted detailed permit reviews to validate compliance.
ChallengesUTC’s operations are subject to environmental regulation by federal, state and local authorities.
In 1991, we established a global EH&S policy and related environmental standards of
performance. These apply either where no local regulation exists or where local regulation
is less stringent.
Products
Objectives and ProgressImprove energy efficiency and reduce packaging of new products placed in service between 2007and 2010, each by 10 percent. Our current EH&S goals target all new products for improved
environmental performance. Since the beginning of 2007, we have met the efficiency goal
in 68 percent and the packaging goal in 100 percent of new products launched.

2008 Annual Report 29
2009 ObjectivesContinue to eliminate materials of concern in all new products and develop long-term plans toovercome technical, customer specification or financial barriers. New products launched
in 2008 eliminated 53 percent of the materials of concern used in previous versions.
Many alternatives replaced cadmium and hexavalent chromium surface treatments and
coatings, notably in components for the Boeing 787 Dreamliner.
Customers and Suppliers
Objectives and ProgressContinue to roll out supplier EH&S program and have all meet UTC’s EH&S expectations by 2010.In 2008, 98 percent of key suppliers participating in the supplier EH&S program met the
five minimum EH&S expectations, up from 81 percent in 2007.
People
Objectives and ProgressIncrease overall favorable responses to the 2009 biennial employee survey by 3 percentage points.To respond to survey results, UTC forms employee action teams to address concerns and
recommend workplace improvements. We use spot surveys in interim years to provide
directional results and ensure action teams are implementing meaningful changes. The 2008
spot survey results showed improving favorability.
Continue actions to eliminate work-related fatalities and serious injuries. Tragically, four employees
lost their lives in 2008 and 35 were seriously injured. Nothing is more important than
employee safety. We deploy the highest possible standards globally and maintain a culture
that strives for the safest working conditions. We continue to put corrective actions in place
to eliminate both work-related fatalities and serious injuries, and we will not tolerate standards
and performance other than zero.
Reduce global lost workday incident rate from .49 to .17 and recordable incidents from 1.42 to .64from 2007 through 2010. At the end of 2008, our lost workday incident rate was .26 and our
recordable incident rate was .97, both measured globally.
GovernanceImprove by 3 percentage points responses to the 2009 biennial employee survey question that askswhether or not, “My managers comply with the UTC Code of Ethics”
EnvironmentReduce greenhouse gas emissions 3 percent annually and water consumption 2.5 percent annuallyfrom 2007 through 2010
Invest $100 million from 2007 through 2010 in energy conservation projects, including co-generationsystems
Ensure compliance with environmental permits
Develop 2011 through 2015 sustainability goals with a focus on suppliers and products in use
ProductsImprove energy efficiency and reduce packaging of new products placed in service between2007 and 2010 by 10 percent
Continue to eliminate materials of concern in all new products
Customers and SuppliersContinue to roll out supplier EH&S program with all key suppliers meeting UTC’s EH&S expectationsby 2010
PeopleIncrease overall favorable responses to the 2009 biennial employee survey by 3 percentage points
Ensure zero tolerance for work-related fatalities and serious injuries
Reduce global lost workday incident rate from .49 to .17 and recordable incidents from 1.42to .64 from 2007 through 2010

30 United Technologies Corporation
Focus AreasCorporate Responsibility
GovernanceThe aim of governance at UTC is an ethical culture in which 100 percent compliance with
laws and regulations is standard. During 2008, our 13 member Board of Directors included 11
independent members. Each board committee included independent directors and four com-
mittees were fully independent. UTC’s Code of Ethics, created in 1990 and relaunched in 2006,
is the foundation of our culture. In 2008, the Code was amended by UTC’s Board of Directors
to include a policy on citizenship and human rights to reaffirm UTC’s commitment to corporate
responsibility. Implemented in 1986, UTC’s Ombudsman/DIALOG program allows employees
to raise questions and concerns confidentially. Since then, 85,342 inquiries have been sub-
mitted and reviewed. Over the past five years, approximately 80 percent of inquiries requested
change, and about half have resulted in change. Additional information on UTC’s Board of
Directors, including committees and members, UTC’s political action committee and our
Code of Ethics is available on our Web site.
EnvironmentUTC believes climate change is a critical concern. We focus on our operations, the perform-
ance of our suppliers and our products in use. Internally, we have set aggressive goals for
reduced CO2 equivalent emissions and water use, and have achieved reductions of 11 percent
on both metrics from a 2006 baseline. Longer term, we have reduced base energy use by 22
percent and water use by 50 percent since 1997. In 2008, we initiated a third party assessment
of our EH&S data collection and reporting program. With a worldwide real estate portfolio of
more than 100 million square feet, we are committed to designing and building new facilities
with the smallest possible footprint. As of year-end 2008, UTC has one facility certified by the
U.S. Green Building Council’s Leadership in Energy and Environmental Design (LEED) rating
system. Another 18 registered projects are in the planning, construction or completion phase,
including four in final certification review. More information on UTC’s commitment to the
environment is available on our Web site.
ProductsUTC’s products bring energy efficiency and conservation to the building systems and aerospace
industries. Our fuel cells have been in use for 50 years and today power buses, industrial and
retail facilities, and skyscrapers around the world. UTC also manufactures combined heat and
power technology and geothermal systems, which tap previously unusable geothermal reserves
for renewable and continuously available power. Carrier was chosen in 2008 as a preferred
supplier of the Clinton Climate Initiative (CCI), becoming the first heating, ventilation
and air-conditioning company to sign a Memorandum of Understanding with the CCI for
energy efficient products. Based on more than 20 years of research and development,
Pratt & Whitney’s PurePower PW1000G engine with Geared Turbofan technology is expected to
reduce noise by 50 percent, fuel consumption by more than 12 percent and achieve a double-digit
reduction in emissions and operating costs. More information on energy efficient products made
by UTC companies and our work to reduce materials of concern is available on our Web site.
Customers and SuppliersUTC serves customers primarily in two global industries: aerospace and building systems.
Our aerospace customers include governments, aircraft manufacturers and airlines. We
serve military and civil government customers in dozens of countries. In the United States,
this includes all branches of the military, NASA and the Department of Homeland Security.
Seventeen percent of UTC’s business comes from government contracts and we only sell
military equipment as allowed by goverment authorities. Our building systems customers
include building owners and managers, contractors and property developers. UTC’s supply
chain includes more than 50,000 companies, and in 2008, we spent more than $30 billion on
procurement. UTC actively seeks competitive and innovative small and diverse businesses. In
2008, UTC spent more than $950 million with diverse suppliers, up from $770 million in 2007.
More information on UTC’s commitment to customer satisfaction, our supply chain, supplier
diversity and our supplier EH&S expectations is available on our Web site.
PeopleUTC is committed to treating employees fairly, respecting their interests and providing
safe working conditions and open communications. Our Code of Ethics is our guide to
delivering on these commitments; it outlines expectations and holds every employee
accountable. An injury-free workplace is our goal; however, inherent risk in our industrial
settings continues to present challenges. We investigate each serious injury and occupational

2008 Annual Report 31
fatality for root cause, take corrective actions and design safer working conditions. At its
Connecticut facilities, Pratt & Whitney launched programs to reduce noise and has reduced the
number of employees required to complete hearing tests due to high noise levels by half. At
UTC, talent is critical for global business growth and a diverse workforce makes us stronger
and more competitive. UTC supports INROADS, a non-profit organization providing career
training and internships for minority youth. UTC’s 20-year partnership with INROADS has
provided more than 2,000 internships and more than 200 interns have become UTC employees.
Challenging economic times require difficult actions and this was true in 2008. While compa-
nies cannot guarantee employment, they can ensure opportunity and UTC does through our
Employee Scholar Program. When business conditions necessitate a workforce reduction, we
offer our unique employee education program to separated employees for at least one year
following separation. More information on UTC’s Employee Scholar Program, dependent
scholarships and our commitment to diversity is available on our Web site.
CommunitiesSuccessful businesses improve the human condition. In 2008, UTC contributed $25.5 million
to non-profit organizations in 39 countries. With UTC’s support, Junior Achievement
relaunched its fifth grade curriculum to include science, technology, engineering and math
skills, which will reach 600,000 students annually. In 2008, the National Trust for Historic
Preservation opened Lincoln’s Cottage in Washington, D.C., its first LEED-certified property,
also with UTC’s support. As a Fortune 50 company, UTC is uniquely positioned to match
employee expertise to the needs of non-profit organizations we support financially. In 2008,
we launched Building Community Excellence, a program in which employees in the Hartford,
Conn., area helped non-profits manage information technology needs or real estate invest-
ments, conduct energy audits, and measure and reduce their environmental footprint.
More information on the organizations UTC supports, including the United Way and FIRST
Robotics, and our work in the community is available on our Web site.
AwardsAlliance to Save Energy presented UTC with the 2008 Galaxy Star Award for energy conservation
National Energy Resources Organization presented UTC with its Innovation Award for the
PureCycle geothermal power system
DiversityBusiness.com ranked UTC 18th on the list of “Top 50 Organizations for Multicultural
Business Opportunities” for its supplier diversity efforts
India’s Ministry of Power awarded Carrier India First Prize for the National Energy
Conservation Awards 2008 in the Consumer Goods Manufacturing Sector
INROADS recognized UTC as its top corporate partner in 2008 for providing internships
to 293 students
Pratt & Whitney’s PurePower engine family received the 2008 Breakthrough Award from the
China Aviation Association and the AVIC Science and Technology Department
Third party validationFor four years, UTC has sought independent feedback on our corporate responsibility
reporting. In 2008, we asked stakeholders in London and Washington, D.C., to provide
analysis and commentary. They commended our efforts, but asked for more context
and details on our supply chain and our progress reducing the use of materials of concern
in products.
We measure our reputation and collect feedback on our community, environmental and
corporate responsibility performance. In 2008, UTC again surveyed business and community
leaders in the greater Hartford, Conn., region where we have the largest single employee concen-
tration and significant community involvement. UTC was the first among peers with the
highest average corporate responsibility score. We improved our environmental performance
as well as the perception of UTC as a good place to work. UTC conducts similar surveys of
business leaders and investors nationally.
Recognition
Additional data and in-depth studies are available at www.utc.com/responsibility. Explore the Web site or go to the online report and click on the links within the text.

32 United Technologies Corporation
CarrierOperations Review: In 2008, homeowners,
building owners, international transporta-
tion companies and food retail outlets
relied more than ever on Carrier to provide
innovative, environmentally responsible,
high-performance heating, ventilation,
air-conditioning and refrigeration solutions.
Customer wins included Del Monte, Maersk
Line, Carrefour, Holland America Lines,
Edeka and Red Bull. Carrier also was
chosen by Delhi International Airport to
supply eight Evergreen 19XRD centrifugal
chillers with non-ozone depleting refriger-
ant. Carrier delivered the largest carbon
dioxide (natural refrigerant) turnkey refrig-
eration solution to wholesaler Metro Cash
& Carry, providing design, installation and
service expertise.
The AvantAC All-Electric bus system is
the first of its kind in North America to
provide constant passenger cooling regard-
less of vehicle engine speed. Carrier’s
new AquaForce 30XW water-cooled chiller
is up to 20 percent more efficient than
its predecessors and meets strict energy
efficiency regulations.
Carrier expanded its service capabilities
with the acquisitions of NORESCO, a lead-
ing energy services company, and Environ-
mental Market Solutions, Inc., a green
building consulting company that helped
the Beijing Olympic Village become the first
project in China to achieve LEED Neighbor-
hood Development certification.
Also in China, Carrier formed a joint
venture with Midea to produce duct-free
air-conditioning systems exclusively for
Carrier for the global market.
Corporate Responsibility Progress andChallenges: In 2008, Carrier was appointed
as a formal international advisor to the
China Green Building Council and spon-
sored the Moscow 2008 Green Buildings
Conference. The company also signed
Memorandums of Understanding with
the Clinton Climate Initiative to provide
energy efficient, non-ozone depleting
water-cooled chillers to the C40 Large
Cities Climate Leadership Group and with
the Chinese Ministry of Environmental
Protection to provide training and support.
Carrier’s Montluel facility is the first indus-
trial site in France to use 100 percent green
electricity from renewable sources, such as
hydroelectric and wind turbine.
Tadiran Appliances in Israel initiated a vol-
untary retrofit campaign related to some of
its high wall air conditioners that could pose
a risk of fire under certain circumstances.
Carrier delivered a customized energy efficient building solution for the Tour Granite office tower in Paris. The iconic building isequipped with chillers, air handlers, fan coils and a building management system. These products meet precise fresh air flowrequirements and provide a high level of comfort and air quality for building occupants.

2008 Annual Report 33
Hamilton SundstrandOperations Review: Hamilton Sundstrand’s
revenues grew 10 percent in 2008, due
to new system integration wins, best-in-
class aftermarket services and industrial
market growth.
Boeing 787 Dreamliner systems testing
continued at Hamilton Sundstrand’s Air-
plane Power System Integration Facility
(APSIF) in Rockford, Ill. Hamilton
Sundstrand is supplying nine systems on the
787, including the electrical, air thermal
management and auxiliary power systems.
Hamilton Sundstrand is expanding its
market presence by developing systems
for Airbus’ new A350XWB. The content
includes main electrical power generation,
secondary power distribution and emer-
gency power Ram Air Turbine. Other sys-
tems include ventilation control; overheat
detection systems; and pilot controls,
including the side sticks and door actuators.
The company’s A350XWB content marks
a 55 percent increase in per shipset content
value compared with the A330 it will replace.
Hamilton Sundstrand’s industrial busi-
nesses, Milton Roy, Sundyne and Sullair,
continued to experience strong revenue
growth in 2008. The company acquired
Marelli Pumps, a leading heavy duty
centrifugal pump designer and manufac-
turer. Based in Spain, Marelli supplies
a wide range of centrifugal pumps for oil,
petrochemical, chemical, industrial process,
water and firefighting industry customers.
The acquisition expands Marelli’s product
offerings to Hamilton Sundstrand’s
customers.
Corporate Responsibility Progress andChallenges: Hamilton Sundstrand work-
places are among the world’s safest. Part-
nering with the U.S. Occupational Safety
and Health Administration, 12 Hamilton
Sundstrand facilities have been recognized
with Voluntary Protection Program (VPP)
star status for high safety standards. Inter-
national sites also are working toward
OHSAS (Occupational Health and Safety
Assessment System) 18001 safety certifica-
tion, which has been attained by eight
locations in Europe and Asia. Hamilton
Sundstrand’s goal is to have all sites attain
their respective certification by 2010. To
meet 2010 environmental goals, Hamilton
Sundstrand continues to implement cost-
effective projects, including high efficiency
lighting and HVAC upgrades, in addition
to activities to conserve water and eliminate
waste. In 2008, Hamilton Sundstrand was
recognized by Aviation Week as a leader
among aerospace and defense companies
in employee learning and professional
development, thanks in part to UTC’s
Employee Scholar Program.
Kidde Aerospace & Defense automatic fire suppressionsystems protect our troops against fires resulting frommines and roadside bombs on more than 5,000 MineResistant, Ambush Protected (MRAP) vehicles. Thesesystems use optical infrared fire sensors and solenoidvalve-operated extinguishers to detect and suppressexplosive fires in about 100 milliseconds – the time ittakes to blink your eye. Kidde Aerospace & Defensesystems are battlefield-proven on MRAPs, more than50,000 High Mobility Multipurpose Wheeled Vehicles,and 10,000 heavily armored vehicles, such as M1 Abrams,Stryker and the Bradley Fighting Vehicle.
Hamilton Sundstrand’s Ram Air Turbine (RAT) providesemergency power in the unlikely event of a dual enginefailure. The RAT uses a generator and a propeller, deployedinto the air stream from the aircraft’s underside, allowing thepilot to have electrical and hydraulic power in an emergencysituation. Additionally, Hamilton Sundstrand has reducedthe use of materials of concern in the production process.

34 United Technologies Corporation
OtisOperations Review: Otis achieved solid
growth in 2008 largely due to strong global
market penetration in the low- to mid-rise
segment, including sales of the Gen2 elevator
in Europe and the expansion of the Gen2
product line into markets throughout Asia,
India and the United States. Today, Otis
maintains more than 1.6 million elevators
and escalators worldwide.
Otis supplied more than 1,400 units totaling
more than $100 million for the 2008 Beijing
Games. Twenty percent of the units were
Gen2 machine-roomless elevators. Otis
installed and is servicing units in Beijing
and surrounding cities at 30 sports venues
and infrastructure built to support the
Games. Other notable contracts include
the 60-story Trump International Hotel
& Tower in Toronto, and the Guangzhou
International Financial Center in China, an
office and hotel building that will be among
the world’s tallest.
Otis is reinventing the industry it founded
more than 150 years ago. To meet the
ever-changing needs of today’s building
industry, Otis provides comprehensive
service offerings. Otis’ new offering, Elite
service, provides an unprecedented level of
customer service. It has been introduced in
the United Kingdom, Korea and Spain with
pilots in a number of other countries as Otis
continues to expand Elite service offerings
around the world.
Corporate Responsibility Progress andChallenges: In 2008, an Otis supplier in
France delivered a shipment of elevator
buttons, which were found to contain
trace amounts of radioactive material.
The contamination originated from a
scrap metal supplier in India. Nuclear
testing authorities concluded that the
contaminated buttons did not present
a safety hazard to the public or Otis
employees. At Otis, safety of the riding
public and its employees is of paramount
importance. Therefore, Otis decided to
replace the affected buttons in factories
and customer locations.
Otis continues its commitment to the
environment with the opening of its green
manufacturing center in Madrid. The
center’s key product is the environmentally
friendly and energy-saving Gen2 elevator.
The building was designed with energy
efficient materials, including photovoltaic
roof panels, producing 60 percent of
the building’s electricity; solar panels,
producing 70 percent of its hot water;
and a lighting system, reducing electricity
consumption by 45 percent.
ECE awarded Otis a contract to install elevators, escalators and moving walkways for 19 shopping centers throughout Europe.This is Otis’ largest contract in Europe. The majority of the units will consist of escalators and Gen2 machine-roomless elevatorsystems with belt technology. In 2004, ECE awarded Otis contracts for eight new shopping malls in Eastern Europe, includingGalleria Vankovka in Brunn, Czech Republic (pictured above), and these installations have been completed.

2008 Annual Report 35
Pratt & WhitneyOperations Review: Pratt & Whitney is a
world leader in the design, manufacture and
service of commercial and military aircraft
engines, industrial gas turbines and space
propulsion systems.
Pratt & Whitney is the only producer of
fifth-generation fighter aircraft engines
for the F-22 and F-35. The F100-PW-229
military engine was selected by the Royal
Moroccan Air Force to power a new fleet
of F-16 aircraft, and the Republic of Korea
Air Force has chosen to return to Pratt &
Whitney to provide power for its new
F-15Ks.
Pratt & Whitney’s PurePower PW1000G
Geared Turbofan demonstrator engine
achieved more than 350 hours and 400
cycles of ground and flight testing this year.
Versions of the PurePower PW1000G engine
are currently under development for the
Mitsubishi Regional Jet and the Bombardier
CSeries aircraft.
A world-class aerospace center will be
established at Montreal-Mirabel Interna-
tional Airport for the final assembly and
test of the PW1524G engine selected for
the Bombardier CSeries aircraft and the
PW810C engine selected by Cessna Aircraft
Company to power its new Citation
Columbus business aircraft.
Pratt & Whitney Power Systems increased
sales by approximately 50 percent in its
industrial gas turbine aftermarket business
and continues to maintain a strong backlog.
Pratt & Whitney Rocketdyne is the nation’s
premier supplier of liquid rocket engine
propulsion systems. In 2008, the company
powered four space shuttle missions and
began development of engines that will
propel the next manned missions to the
moon and beyond.
Corporate Responsibility Progress andChallenges: For the sixth consecutive year,
Pratt & Whitney’s Christchurch Engine
Center received the highest health and
safety rating from the New Zealand Safety
Management Practices Program, making it
one of only 20 companies to continuously
maintain this level for this length of time.
In response to concerns of brain cancer
among some workers at Pratt & Whitney’s
North Haven, Conn., facility, the company
is funding an independent study led by
leading researchers. The results of the
first phase of the study, released in 2008,
showed no clear, consistent relationship
between the Pratt & Whitney workplace
and brain cancer. The comprehensive study
includes three phases and is expected to be
completed in 2010.
Powering all of the U.S. Air Force’s F-15 Eagles and the majority of the world fleet of F-16 Fighting Falcons, Pratt & Whitney’sfamily of F100 engines has been selected by 23 air forces around the world. With more than 7,000 engines produced and morethan 20 million flight hours, the F100 fighter engine has a remarkable record of safety, maintenance cost and reliability.The F100 engine has benefited from the continued infusion of new technology since its introduction and continues to meetthe demands of the fighter aircraft mission in a world of ever-changing threats.

36 United Technologies Corporation
SikorskyOperations Review: With busy production
lines and first flights for six programs in
2008, Sikorsky continues to chart a path
for future growth after doubling revenues
over the last four years. Margin expansion,
excellence in execution, technological
leadership and globalization contribute to
continued success.
The X2 Technology demonstrator achieved
first flight in August 2008. The prototype
integrates technologies to advance the
state-of-the-art helicopter, which is
expected to demonstrate that a helicopter
can cruise comfortably at 250 knots while
retaining excellent low-speed handling, and
efficient hovering and safety, with seamless
transition to high speed.
Launched in 2008, Sikorsky Aerospace
Services is a unique organization offering
original equipment manufacturing expertise
to meet customers’ aviation service needs.
It combines decades of experience in
aerospace engineering, material support,
integrated logistics, servicing, maintenance,
overhaul and training to maximize aircraft
readiness with low operational costs.
Modernization projects continue at the PZL
Mielec facility in Poland. The S-70i BLACK
HAWK helicopter will be assembled there
and deliveries are expected to begin in 2011.
In China, S-76 helicopter airframes are
now being built under a contract between
Shanghai Sikorsky and Aviation Industries
of China (AVIC II). Sikorsky’s supply base
in Turkey continues to grow, and plans to
develop regional aviation centers are pro-
gressing in the Middle East.
Corporate Responsibility Progress andChallenges: Sikorsky continues to make
progress on eliminating materials of concern.
In 2008, after years of researching alterna-
tives, Sikorsky began testing equipment to
replace the use of sulfur hexafluoride with
helium in helicopter blade production,
potentially saving more than 7,500 metric
tons of greenhouse gas emissions annually.
The company also implemented a hexavalent
chrome replacement program for its military
and commercial helicopters and contributed
to the Connecticut National Guard winning
the Secretary of the Army Award.
In 2008, Sikorsky began plans for a combined
heat and power co-generation plant at its
Stratford, Conn., facility. The plant will
supply approximately 84 percent of the site’s
base load electrical power and is expected
to begin operation in 2010. Sikorsky has
executed a power purchase agreement for
the installation of solar panels on the roof
of its Stratford facility. The first phase will
consist of 500 solar panels scheduled to be
operational in 2009.
Sikorsky CH-53Ds aboard the USS Bonhomme Richard. The CH-53D helicopter is designed to transport up to 8,000 pounds, includingpersonnel and supplies, in support of amphibious and shore operations. The U.S. government currently operates 36 aircraft, whichcombined have flown approximately 700,000 hours. The first CH-53D aircraft began operating in 1966. Sikorsky is currentlydeveloping the latest aircraft in the series, the CH-53K heavy-lift helicopter, for the U.S. Marine Corps.
2008 Annual Report 37
UTC Fire & SecurityOperations Review: UTC Fire & Security, in
its fifth year, has developed a leading posi-
tion in two large and fragmented industries:
fire safety and electronic security. Growth
through acquisition and joint venture
investments continued, with 11 transactions
completed in 2008. UTC Fire & Security
continues to expand into emerging markets
and secured a $41 million contract to de-
sign, install and service fire training simula-
tors at one of the world’s largest fire training
facilities, to be located in Qatar.
Large contract wins complemented UTC
Fire & Security’s growing presence in Asia.
In China, the company will supply fire
detection, fire alarm, access control and
monitoring systems for the Shanghai
Metro Line 7. UTC Fire & Security further
strengthened its presence in China’s fire
safety industry by investing in a number
of local companies, including Shengjie
and Nanjing, two leading fire suppression
providers.
UTC Fire & Security launched more than
20 new products in 2008, as a result of focused
research and development planning. A new
toxic gas platform for the petrochemical,
oil and gas segment provides an explosion-
proof solution to detecting multiple, harm-
ful gases. The modular video platform
brings the benefits of high quality surveil-
lance and effortless data retrieval to
customers. This intelligent DVR system
includes embedded video analytics and
remote service capabilities that set it apart
from others.
Corporate Responsibility Progress andChallenges: UTC Fire & Security continued
making excellent progress in its safety
record in 2008. The company reduced its
lost workday incident rate by 42 percent and
total recordable incident rate by 40 percent.
Continuous improvement in employee
safety remains a priority for 2009.
As part of a focus on quality, UTC Fire &
Security is expanding performance initia-
tives to include the global supplier network.
Twenty-three manufacturing sites have
identified approximately 120 key suppliers
to participate in the Supplier Gold program
aimed at improving and recognizing sup-
plier excellence in customer satisfaction,
delivery and quality. This group of key
suppliers accounts for 25 percent of
UTC Fire & Security’s supplier spend.
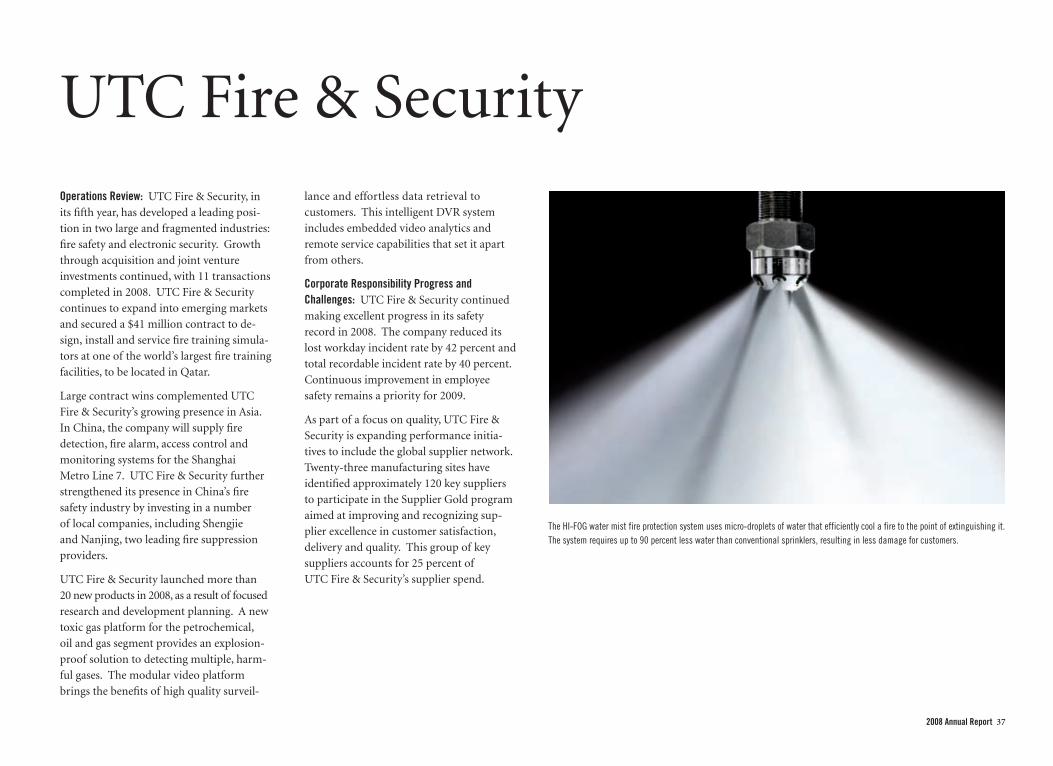
The HI-FOG water mist fire protection system uses micro-droplets of water that efficiently cool a fire to the point of extinguishing it.The system requires up to 90 percent less water than conventional sprinklers, resulting in less damage for customers.

38 United Technologies Corporation
UTC PowerOperations Review: Climate change, rising
energy costs and the environment are major
global concerns. A leader in efficient,
reliable, sustainable energy alternatives,
UTC Power delivers innovative, practical
solutions to customers around the world.
UTC Power launched the PureCell Model
400 fuel cell, a 400-kilowatt system that
doubles the output and life of the PureCell
Model 200, which has led the market in
durability. In 2008, the New York Power
Authority selected UTC Power to supply
12 PureCell Model 400 fuel cells for the
Freedom Tower and three other towers
under construction at the World Trade
Center site in New York City. Samsung
Everland also purchased 12 of the same
fuel cell systems for installation at a
GS Power plant in South Korea.
Corporate Responsibility Progress andChallenges: Rising fuel costs and
urbanization create a growing demand
worldwide for green onsite power and
transit solutions. The PureCell Model 400
power system completed development in
2008 and its first deliveries will take place
in 2009. UTC Power continues its work
developing the PureMotion power plant
for the fleet bus market. In 2008, it received
the largest U.S. order ever for fuel cell
systems to power transit buses from
AC Transit.
In 2008, AC Transit of Oakland, Calif., announced the largest ever procurement in the United States of fuel cell power systems forpublic transport buses. UTC Power will provide 12 PureMotion Model 120 fuel cell systems to AC Transit to power next-generationhybrid-electric, fuel cell buses, scheduled for delivery in 2009 and 2010. In addition to fuel efficiency, the benefits of fuel cellbuses include zero tailpipe emissions and smooth, quiet operation. The clean operation means these buses have an immediate,positive impact on street-level emissions.

Financial Table of Contents
Five-Year Summary 40
Management’s Discussion and Analysis 41
Cautionary Note Concerning Factors That May Affect Future Results 62
Management’s Report on Internal Control Over Financial Reporting 62
Report of Independent Registered Public Accounting Firm 63
Consolidated Statement of Operations 64
Consolidated Balance Sheet 65
Consolidated Statement of Cash Flows 66
Consolidated Statement of Changes in Shareowners’ Equity 67
Notes to Consolidated Financial Statements 68
Board of Directors 92
Permanent Committees 92
Leadership 93
Shareowner Information 94
2008 Annual Report 39
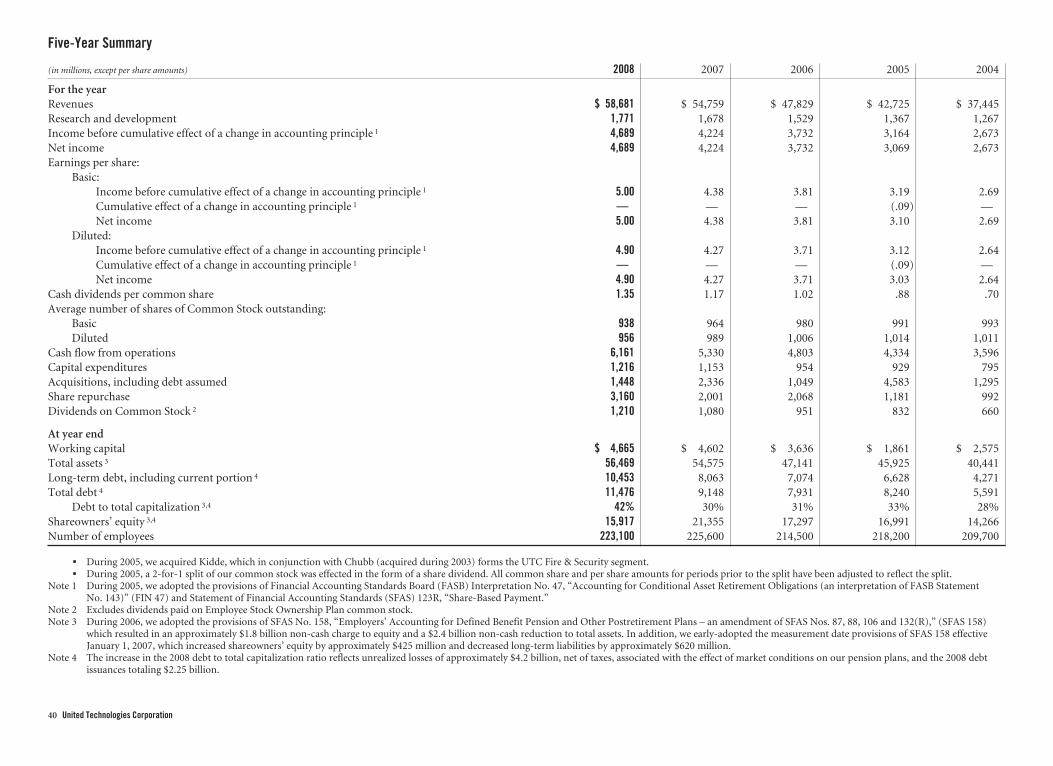
Five-Year Summary
(in millions, except per share amounts) 2008 2007 2006 2005 2004
For the yearRevenues $ 58,681 $ 54,759 $ 47,829 $ 42,725 $ 37,445Research and development 1,771 1,678 1,529 1,367 1,267Income before cumulative effect of a change in accounting principle 1 4,689 4,224 3,732 3,164 2,673Net income 4,689 4,224 3,732 3,069 2,673Earnings per share:
Basic:Income before cumulative effect of a change in accounting principle 1 5.00 4.38 3.81 3.19 2.69Cumulative effect of a change in accounting principle 1 — — — (.09) —Net income 5.00 4.38 3.81 3.10 2.69
Diluted:Income before cumulative effect of a change in accounting principle 1 4.90 4.27 3.71 3.12 2.64Cumulative effect of a change in accounting principle 1 — — — (.09) —Net income 4.90 4.27 3.71 3.03 2.64
Cash dividends per common share 1.35 1.17 1.02 .88 .70Average number of shares of Common Stock outstanding:
Basic 938 964 980 991 993Diluted 956 989 1,006 1,014 1,011
Cash flow from operations 6,161 5,330 4,803 4,334 3,596Capital expenditures 1,216 1,153 954 929 795Acquisitions, including debt assumed 1,448 2,336 1,049 4,583 1,295Share repurchase 3,160 2,001 2,068 1,181 992Dividends on Common Stock 2 1,210 1,080 951 832 660
At year endWorking capital $ 4,665 $ 4,602 $ 3,636 $ 1,861 $ 2,575Total assets 3 56,469 54,575 47,141 45,925 40,441Long-term debt, including current portion 4 10,453 8,063 7,074 6,628 4,271Total debt 4 11,476 9,148 7,931 8,240 5,591
Debt to total capitalization 3,4 42% 30% 31% 33% 28%Shareowners’ equity 3,4 15,917 21,355 17,297 16,991 14,266Number of employees 223,100 225,600 214,500 218,200 209,700
▪ During 2005, we acquired Kidde, which in conjunction with Chubb (acquired during 2003) forms the UTC Fire & Security segment.▪ During 2005, a 2-for-1 split of our common stock was effected in the form of a share dividend. All common share and per share amounts for periods prior to the split have been adjusted to reflect the split.
Note 1 During 2005, we adopted the provisions of Financial Accounting Standards Board (FASB) Interpretation No. 47, “Accounting for Conditional Asset Retirement Obligations (an interpretation of FASB StatementNo. 143)” (FIN 47) and Statement of Financial Accounting Standards (SFAS) 123R, “Share-Based Payment.”
Note 2 Excludes dividends paid on Employee Stock Ownership Plan common stock.Note 3 During 2006, we adopted the provisions of SFAS No. 158, “Employers’ Accounting for Defined Benefit Pension and Other Postretirement Plans – an amendment of SFAS Nos. 87, 88, 106 and 132(R),” (SFAS 158)
which resulted in an approximately $1.8 billion non-cash charge to equity and a $2.4 billion non-cash reduction to total assets. In addition, we early-adopted the measurement date provisions of SFAS 158 effectiveJanuary 1, 2007, which increased shareowners’ equity by approximately $425 million and decreased long-term liabilities by approximately $620 million.
Note 4 The increase in the 2008 debt to total capitalization ratio reflects unrealized losses of approximately $4.2 billion, net of taxes, associated with the effect of market conditions on our pension plans, and the 2008 debtissuances totaling $2.25 billion.
40 United Technologies Corporation

Management’s Discussion and Analysis
Management’s Discussion and Analysis of Financial Condition and Results of Operations
Business OverviewWe are a global provider of high technology products and services to the building systems and
aerospace industries. Our operations are classified into six principal business segments: Otis,
Carrier, UTC Fire & Security, Pratt & Whitney, Hamilton Sundstrand and Sikorsky. Otis,
Carrier and UTC Fire & Security are collectively referred to as the “commercial businesses,”
while Pratt & Whitney, Hamilton Sundstrand and Sikorsky are collectively referred to as the
“aerospace businesses.” The commercial businesses generally serve customers in the worldwide
commercial and residential property industries, although Carrier also serves customers in the
commercial and transport refrigeration industries. The aerospace businesses serve commercial
and government aerospace customers in both the original equipment and aftermarket parts
and services markets. In addition, a portion of these businesses serve customers in certain
industrial markets. Our consolidated revenues were derived from the commercial and
aerospace businesses as follows (revenues from Hamilton Sundstrand’s and Pratt & Whitney’s
industrial markets are included in “commercial and industrial”):
2008 2007 2006
Commercial and industrial 62% 63% 63%
Military aerospace and space 17% 16% 16%
Commercial aerospace 21% 21% 21%
100% 100% 100%
In both 2008 and 2007, approximately 60% of our consolidated sales were original equipment
and 40% were aftermarket parts and services, while in 2006 the amounts were 59% and 41%,
respectively.
Our strategy has been, and continues to be, the maintenance of balance across our businesses
in order to limit the impact of any one industry or the economy of any single country on our
consolidated operating results. This balance is managed, in part, through the commercial and
aerospace revenue, and original equipment and aftermarket parts and services splits noted
above, and the combination of shorter cycles in our commercial businesses, particularly
Carrier, and longer cycles in our aerospace businesses, as well as through the geographic
diversity that has evolved with the continued globalization of world economies. The
composition of total revenues from outside the United States, including U.S. export sales, in
dollars and as a percentage of total segment revenues, has been as follows:
(in millions of dollars) 2008 2007 2006 2008 2007 2006
Europe $15,819 $14,341 $12,069 27% 26% 25%
Asia Pacific 8,212 7,991 7,056 14% 15% 15%
Other Non-U.S. 6,416 5,605 4,809 11% 10% 10%
U.S. Exports 7,035 6,228 4,848 12% 11% 10%
International segment revenues $37,482 $34,165 $28,782 64% 62% 60%
As part of our growth strategy, we invest in businesses in certain countries that carry high levels
of currency, political and/or economic risk, such as Argentina, Brazil, China, India, Russia and
South Africa. At December 31, 2008, our investment in any one of these countries did not
exceed 4% of consolidated shareowners’ equity.
Despite an increasingly difficult economic environment in 2008, total revenues increased 7%
year-over-year, as compared with 2007. Extreme volatility and financial market disruption in
the United States, Europe and Asia, continuing airline financial distress, moderating
commercial construction activity and depressed conditions in the domestic and certain
international housing markets all contributed to weakening worldwide economic conditions.
As discussed further below, some of these factors have adversely impacted aspects of our
underlying businesses and are continuing to present operational challenges. Conversely, other
market factors remained generally strong throughout 2008, and our businesses have continued
to improve upon their operational performance.
Weakness in the U.S. residential market, as well as a second half slowdown in both global
non-residential construction activity and the commercial aerospace market, created
challenging business conditions in 2008 that are expected to continue through 2009. As a result
of the current economic conditions, organic revenue growth was 5% in 2008 compared with
the 9% realized in both 2007 and 2006. Although lower than in 2007, the growth rate in 2008
was still well in excess of general economic growth levels reflecting the global infrastructure
investments that have benefited our commercial businesses, and the strong opening order
backlogs entering 2008. However, as the second half of 2008 progressed, we experienced a
decline in order rates in the commercial businesses, predominately at the end of the year.
2008 Annual Report 41

On a global basis, Otis’ new equipment orders were up 8% and Carrier’s commercial heating,
ventilating, and air conditioning (HVAC) new equipment orders grew approximately 9% in
2008, as compared with 2007. These growth rates reflect increases for most of the year partially
offset by declines in the fourth quarter. Although commercial HVAC revenue grew in 2008,
commercial refrigeration revenues declined as a result of the current economic conditions. As
with the prior year, the weakness in the U.S. residential market continued to affect Carrier’s
North American residential business where unit shipments declined 7%, however the broader
market declined further. UTC Fire & Security experienced 3% organic revenue growth in 2008
with strength in the fire safety businesses being partially offset by the adverse impact of the U.S.
and international banking industry downturn on its electronic security businesses. The growth
in the fire safety businesses resulted largely from increased activity in the oil & gas and marine
industries as well as growth in Asia.
Although the price of oil has retreated significantly from record prices experienced early in
2008, the commercial aerospace industry continues to engage in capacity reductions and airline
carrier consolidations to help offset the significant decline in passenger and cargo traffic levels
experienced across the industry in 2008. Worldwide revenue passenger miles (RPMs) were
essentially flat in 2008 as compared to 2007, and lower than initially expected as a result of the
worldwide economic slowdown. Consistent with expectations, we saw a leveling off of Pratt &
Whitney’s commercial aerospace aftermarket business in 2008 compared to 2007, which
reflected sales growth in the first half of the year offset by declines in the second half of 2008.
However, also consistent with expectations, we experienced growth in the commercial
aerospace original equipment manufacturer (OEM) markets at both Pratt & Whitney and
Hamilton Sundstrand, as well as continued strong demand for military helicopters at Sikorsky.
With the increasingly tough economic environment, we expect revenues to decline in 2009 to
approximately $57 billion reflecting lower organic growth levels and a significant unfavorable
impact from foreign currency translation due to the recent strengthening of the U.S. dollar as
compared with currencies such as the Euro. Although the disruption in the financial markets
did not have a significant impact on our results in 2008, it continues to present a risk as we
enter 2009. In addition to managing any potential impact to our financial results, we continue
to monitor and address the potential impact to our customers and suppliers, which to date has
been limited.
The increase in revenue in 2008 was accompanied by improvements in operational efficiencies,
including savings from previously initiated restructuring actions, the benefit of cost
containment efforts and the favorable impact of foreign currency translation. These operating
profit improvements were partially offset by the adverse impact of higher restructuring
charges, research and development spending and commodity costs, to generate a net 8%
increase in operating profit in 2008, as compared with 2007. Although commodity prices
declined in the second half of 2008, we still experienced overall cost increases for the year, in
part due to certain existing long-term supplier agreements. After partial recovery through
pricing, the net adverse impact to earnings of higher commodity costs in 2008 was
approximately $115 million. As a result of the recent declines in commodity pricing, we are
now expecting the lower costs to provide a benefit to operating results in 2009 of about $150
million.
To help generate future margin growth, and in anticipation of a difficult economic
environment in 2009, we invested $357 million in restructuring actions across our businesses
in 2008. While restructuring efforts have been undertaken across the company, the majority of
the charges were incurred at Carrier and Pratt & Whitney as we focus on lowering our overall
cost structure.
In 2008, operating profit benefited from various gains related to business divestiture activity
during the year ($129 million), the sale of marketable securities ($38 million) and a favorable
pre-tax interest adjustment ($12 million) as discussed below in “Results of Operations.”
Operating profit for 2007 was adversely impacted by a civil fine, net of existing reserves, of
$216 million levied against Otis. The European Commission’s Competition Directorate
assessed a civil fine of approximately $300 million (EU Fine) against Otis, its relevant local
entities and UTC, as a result of certain Otis subsidiaries in Europe violating European Union
competition rules. Gains from the sale of marketable securities and certain non-core assets and
lower restructuring charges in 2007 helped to offset the adverse impact of this fine, as discussed
further in “Results of Operations.”
In addition to the earnings generated from organic revenue growth, including the growth from
new product development and product improvements, our earnings growth strategy also
contemplates investments in acquisitions. We invested $1.4 billion and $2.3 billion, including
debt assumed of $196 million and $300 million, in the acquisition of businesses across all of
our operations in 2008 and 2007, respectively. Acquisitions in 2008 consisted principally of a
number of small acquisitions in our commercial businesses. Acquisitions in 2007 consisted
principally of investments in the UTC Fire & Security segment including the acquisitions of
Initial Electronic Security Group (IESG) for approximately $1.2 billion and Marioff
Corporation, Oy (Marioff) for approximately $348 million. The remaining investments in
2007 included a number of smaller acquisitions across our businesses.
For additional discussion of acquisitions and restructuring, see “Liquidity and Financing
Commitments,” “Restructuring and Other Costs” and Notes 2 and 11 to the Consolidated
Financial Statements.
42 United Technologies Corporation

Results of Operations
Revenues
(in millions of dollars) 2008 2007 2006
Sales $58,043 $53,919 $47,118Other income, net 638 840 711
Total revenues $58,681 $54,759 $47,829
All segments, except for Carrier, experienced organic revenue growth in 2008. Organic growthwas led by the aerospace businesses which benefited from the general strength of thecommercial aerospace OEM, regional and business jet markets, and demand for militaryhelicopters. Commercial aerospace aftermarket growth rates have moderated due to declines inlarge commercial spares orders resulting from the airlines’ consolidation and continuedreductions of capacity in response to market conditions. Commercial OEM growth reflectedstrong production levels at the airframe manufacturers, while military OEM revenue growthwas driven largely by government demand for military helicopters. In the commercialbusinesses, revenue growth at Otis reflected increases in Europe and North America, led bynew equipment sales generated from the strong backlog entering the year. At Carrier,significantly lower unit shipments of U.S. residential product due to the continued weakness inthe North American residential market, and lower customer demand for commercialrefrigeration products as a result of weak economic conditions contributed to a decline inorganic revenues. UTC Fire & Security revenues increased largely on the strength of fire safetysales in the oil & gas and marine industries as well as growth in Asia. The consolidated revenueincrease of $3.9 billion or 7% in 2008 also included growth from net acquisitions of 1% and thefavorable impact of foreign currency translation of 1% resulting from the weakness of the U.S.dollar relative to other currencies, particularly the Euro, experienced for most of 2008.
The consolidated revenue increase of 14% in 2007 reflected organic growth of 9%, acquisitiongrowth of 2% and the favorable impact of foreign currency translation of 3% resulting fromthe weakness of the U.S. dollar relative to other currencies including the Euro and the PoundSterling. All segments experienced organic sales growth in 2007, led by the aerospacebusinesses, which benefited from the general strength of the commercial aerospace markets,overall helicopter demand, and the absence of the impact of the 2006 Sikorsky strike.Commercial aerospace aftermarket growth rates were significantly in excess of general industrygrowth levels while military OEM revenue growth was driven by government demand formilitary helicopters. The commercial businesses benefited from generally favorable worldwideeconomic conditions throughout most of 2007. Otis’ growth included increases in allgeographic regions, led by new equipment sales as a result of the strong backlog entering theyear and continued order strength throughout 2007. Carrier’s revenues increased as a result of
generally strong international residential and commercial HVAC markets, partially offset bysignificantly lower unit shipments of U.S. residential product due to the weakness in the NorthAmerican residential market.
The decrease in other income in 2008, as compared with 2007, is largely related to the absenceof certain gains reflected in 2007 as further described below. Other income in 2008 includesgains generated during the year from business divestiture activity, including a $67 million gainat Carrier from the contribution of a business into a new venture operating in the Middle Eastand the Commonwealth of Independent States, an approximately $37 million non-cash gainrecognized on the sale of a partial investment at Pratt & Whitney and a gain of approximately$25 million related to a disposal of a business at Hamilton Sundstrand. Also, other income in2008 reflects a $38 million gain from the sale of marketable securities and an approximately$12 million favorable pre-tax interest adjustment related to the settlement of disputedadjustments from the 2000 through 2003 examination with the Appeals Division of theInternal Revenue Service (IRS). These gains were partially offset by the adverse impact ofincreased hedging costs on our cash management activities of approximately $80 million. Thebalance of other income is comprised of interest and joint venture income, royalties, and othermiscellaneous operating activities.
Other income for 2007 included approximately $150 million in gains resulting from the sale ofmarketable securities, an approximately $80 million gain recognized on the sale of land byOtis, gains of approximately $83 million on the disposal of certain non-core businesses, andapproximately $28 million in pre-tax interest income relating to a re-evaluation of our taxliabilities and contingencies based on global tax examination activity during 2007, includingcompletion of our review of the 2000 through 2003 IRS audit report and our related protestfiling. Remaining activity includes interest and joint venture income, royalties and othermiscellaneous operating activities.
Gross Margin
(in millions of dollars) 2008 2007 2006
Gross margin $15,482 $13,997 $12,378Percentage of sales 26.7% 26.0% 26.3%
The improvement in gross margin (product and service sales less the cost of product andservices sold) of 70 basis points in 2008, as a percentage of sales, is due largely to the benefitfrom higher volumes, savings from previously initiated restructuring actions and netoperational efficiencies (approximately 60 basis points combined). The absence of the 2007 EUFine, net of reserves (approximately 40 basis points) was partially offset by the adverse impact
2008 Annual Report 43

of higher commodity costs, net of pricing (approximately 20 basis points) and increasedrestructuring costs (approximately 10 basis points) contributing to the remainder of the year-over-year change.
In 2007, the gross margin decline as a percentage of sales compared with 2006, was primarily
the result of the adverse impact of the EU Fine, net of existing reserves, of approximately $216
million (approximately 40 basis points), the absence of an approximately $80 million benefit
(approximately 20 basis points) from a reserve reversal associated with the 2006 settlement of a
Department of Defense collaboration accounting claim against Pratt & Whitney, and higher
commodity costs in 2007. After partial recovery through pricing, the net adverse impact to
earnings of higher commodity costs in 2007 was approximately $290 million (approximately
50 basis points). All of these adverse impacts were partially offset by lower restructuring
charges in 2007 (approximately 20 basis points), higher volumes, the impact of acquisitions,
savings from previously initiated restructuring actions, net operational efficiencies and the
favorability of foreign exchange translation.
Research and Development
(in millions of dollars) 2008 2007 2006
Company-funded $1,771 $1,678 $1,529
Percentage of sales 3.1% 3.1% 3.2%
Customer-funded $2,008 $1,872 $1,621
Percentage of sales 3.5% 3.5% 3.4%
The increase in company-funded research and development in 2008, compared with 2007, was
led by continued investments in Pratt & Whitney’s next generation product family including
the PurePower™PW1000G (PurePower) engine, which features Geared Turbofan (GTF)
technology. General increases across the businesses comprised the remainder of the year-over-
year increase. The approximately 10% increase in company-funded research and development
in 2007, as compared with 2006, was driven largely by continued efforts on the Boeing 787
program at Hamilton Sundstrand (4%) and Pratt & Whitney’s next generation product family
(3%). Increases in company-funded research and development costs at Hamilton Sundstrand
on the Boeing 787 program in 2007 were primarily the result of 787 aircraft program delays.
Company-funded research and development spending is subject to the variable nature of
program development schedules.
The increase in customer-funded research and development spending in 2008, as compared
with 2007, relates largely to increased engineering effort in the J-2X propulsion program at
Pratt & Whitney Rocketdyne as well as various space programs at Hamilton Sundstrand, while
development spending on the Joint Strike Fighter program across the company decreased.
The 2007 increase in customer-funded research and development, as compared with 2006, is
primarily attributable to increased spending at Sikorsky on the CH-53K program.
Company-funded research and development spending for 2009 is expected to be consistent
with 2008 spending levels.
Selling, General and Administrative
(in millions of dollars) 2008 2007 2006
Selling, general and administrative $ 6,724 $ 6,109 $ 5,462
Percentage of sales 11.6% 11.3% 11.6%
Increases in selling, general and administrative expenses in both 2008 and 2007 were due
primarily to general increases across the businesses in support of higher volumes and the
adverse impact of foreign currency translation. The increase in 2008 was further impacted by
the effect of increased restructuring charges undertaken in anticipation of a tougher economic
climate in 2009, resulting in a 30 basis point increase in selling, general and administrative
expenses as a percentage of sales from 2007 to 2008. Strong control of spending in 2007,
coupled with the significant growth in revenues, led to a 30 basis point reduction in selling,
general and administrative expenses as a percentage of sales from 2006 to 2007.
Interest Expense
(in millions of dollars) 2008 2007 2006
Interest expense $ 689 $ 666 $ 606
Average interest rate during the year
Short-term borrowings 5.6% 6.2% 6.2%
Total debt 5.9% 6.2% 6.4%
Interest expense increased in 2008, as compared with 2007, primarily as a result of the
issuances of $1.0 billion of long-term debt in December 2007, bearing interest at 5.375%, and
$1.0 billion of long-term debt in May 2008, bearing interest at 6.125%. This increase was
partially offset by lower interest charges related to our deferred compensation plan and lower
interest accrued on unrecognized tax benefits. The issuance of $1.25 billion of long-term debt
in December 2008 bearing interest at 6.125% did not have a significant impact to interest
expense in 2008. Interest expense increased in 2007 primarily as a result of the full year impact
of the issuance of $1.1 billion of long-term debt in May 2006, an increase in short-term
borrowings to fund acquisition activity, and interest accrued on unrecognized tax benefits.
44 United Technologies Corporation

The issuance of $1.0 billion of long-term debt in December 2007 did not have a significant
impact to interest expense in 2007.
The average interest rate for commercial paper decreased in 2008 as compared to 2007
generating the decrease in the average short-term borrowing rate. The overall average interest
rate declined as the long-term debt issuances noted above were at interest rates lower than
existing outstanding obligations. The weighted-average interest rate applicable to debt
outstanding at December 31, 2008 was 5.3% for short-term borrowings and 5.9% for total debt
as compared to 7.2% and 6.2%, respectively, at December 31, 2007. The decrease in the average
interest rate on total debt in 2007, as compared to 2006, corresponded to the full year impact
of the May 2006 long-term debt issuances which bear interest at 6.05% and LIBOR + .07%.
The three month LIBOR rate as of December 31, 2008, 2007 and 2006 was 1.4%, 4.7% and
5.4%, respectively.
Income Taxes2008 2007 2006
Effective income tax rate 27.1% 28.8% 27.2%
The effective tax rates for 2008, 2007 and 2006 reflect tax benefits associated with lower tax
rates on international earnings, which we intend to permanently reinvest outside the United
States. The 2008 effective tax rate decreased as compared to 2007 due to the absence of certain
discrete items which had a net adverse impact in 2007. The 2008 effective tax rate reflects
approximately $62 million of tax expense reductions, principally relating to re-evaluation of
our liabilities and contingencies based upon resolution of disputed tax matters with the
Appeals Division of the IRS for tax years 2000 through 2003.
The 2007 effective tax rate reflects approximately $80 million of tax expense reductions,
principally relating to re-evaluation of our liabilities and contingencies based upon global
examination activity, including the IRS’s completion of 2000 through 2003 examination
fieldwork and our related protest filing, and development of claims for research and
development tax credits. Principal adverse tax impacts to the 2007 effective tax rate related to
the previously disclosed EU Fine and enacted tax law changes outside the United States.
In 2006, a residual disputed issue related to the 1999 disposition of a business segment was
settled with the Appeals Division of the IRS and was reviewed by the U.S. Congress Joint
Committee on Taxation. The settlement resulted in an approximately $35 million reduction in
tax expense in 2006.
We expect our effective income tax rate in 2009 to be approximately 28%, before the impacts
of any discrete events.
For additional discussion of income taxes, see “Critical Accounting Estimates—Income Taxes”
and Note 9 to the Consolidated Financial Statements.
Net Income and Earnings Per Share
(in millions of dollars, except per share amounts) 2008 2007 2006
Net income $4,689 $4,224 $3,732
Diluted earnings per share $ 4.90 $ 4.27 $ 3.71
The general weakness of the U.S. dollar against certain currencies, such as the Euro, for the
majority of the year, generated a beneficial year-over-year foreign currency impact of $.06 per
share in 2008. This year-over-year impact is net of the adverse impacts of both foreign
currency translation and hedging at Pratt & Whitney Canada (P&WC) of a combined $.05 per
share. At P&WC, the strength of the U.S. dollar in the fourth quarter of 2008 partially offset
the adverse foreign currency translation impact experienced earlier in the year from a weaker
U.S. dollar as the majority of P&WC’s revenues are denominated in U.S. dollars, while a
significant portion of its costs are incurred in local currencies. To help mitigate the volatility of
foreign currency exchange rates on our operating results, we maintain foreign currency
hedging programs, the majority of which are entered into by P&WC. Due to the significant
revenue growth at P&WC, as well as the dramatic increase in the strength of the Canadian
dollar to the U.S. dollar in 2007 and early 2008, the hedges previously entered into generated
an adverse foreign exchange impact as the U.S. dollar strengthened. As a result of hedging
programs currently in place, P&WC’s 2009 operating results will include the adverse impact of
foreign currency translation, net of hedging, of approximately $100 million. In 2007 and 2006,
foreign currency translation had a favorable impact of $.09 and $.01 per share, respectively. For
additional discussion of foreign currency exposure, see “Market Risk and Risk Management—
Foreign Currency Exposures.” Diluted earnings per share for 2008 were also favorably
impacted by approximately $.11 per share as a result of the shares repurchased since January 1,
2008 under our share repurchase program.
2008 Annual Report 45

Restructuring and Other Costs
We recorded net pre-tax restructuring and related charges/(credits) totaling $357 million in
2008 and $166 million in 2007 for new and ongoing restructuring actions. We recorded these
charges in the segments as follows:
(in millions of dollars) 2008 2007
Otis $ 21 $ 21
Carrier 140 33
UTC Fire & Security 63 39
Pratt & Whitney 116 53
Hamilton Sundstrand 16 23
Sikorsky — (3)
Eliminations & Other 1 —
The 2008 charges include $148 million in cost of sales, $205 million in selling, general and
administrative expenses and $4 million in other income. The 2007 charges include $110
million in cost of sales, $55 million in selling, general and administrative expenses and
$1 million in other income. These charges relate principally to actions initiated during 2008
and, to a lesser extent, residual trailing costs related to certain 2007 and 2006 actions.
Restructuring actions are an essential component of our operating margin improvement
efforts and relate to both existing operations and those recently acquired. We have acquired
certain businesses at beneficial values, such as Linde, Chubb, Kidde and IESG, with the
expectation of restructuring the underlying cost structure in order to bring operating margins
up to expected levels. Restructuring actions focus on streamlining costs through workforce
reductions, the consolidation of manufacturing, sales and service facilities, and the transfer of
work to more cost-effective locations. For acquisitions prior to January 1, 2009, the costs of
restructuring actions at the acquired company contemplated at the date of acquisition are
recorded under purchase accounting and actions initiated subsequently are recorded through
operating results. However, upon the January 1, 2009 adoption of SFAS No. 141 (revised
2007), “Business Combinations” (SFAS 141(R)), restructuring costs associated with a business
combination will be expensed as incurred. We expect to initiate restructuring actions during
2009 across the businesses due to our continuing cost reduction efforts. Excluding the impact
of SFAS 141(R), we expect to incur approximately $150 million of restructuring costs in the
first quarter of 2009. Although no specific plans for other significant actions have been
finalized at this time, we continue to closely monitor the economic environment and may
undertake further restructuring actions to keep our cost structure aligned with the demands of
the prevailing market conditions.
2008 Actions. During 2008, we initiated restructuring actions relating to ongoing cost
reduction efforts, including selling, general and administrative reductions and the
consolidation of manufacturing facilities. We recorded net pre-tax restructuring and related
charges in the business segments totaling $327 million as follows: Otis $21 million, Carrier
$141 million, UTC Fire & Security $58 million, Pratt & Whitney $93 million, Hamilton
Sundstrand $13 million and Eliminations & Other $1 million. The charges included $119
million in cost of sales, $204 million in selling, general and administrative expenses and $4
million in other income. Those costs included $277 million for severance and related employee
termination costs, $24 million for asset write-downs and $26 million for facility exit and lease
termination costs.
We expect the 2008 actions to result in net workforce reductions of approximately 6,300
hourly and salaried employees, the exiting of approximately 1.2 million net square feet of
facilities and the disposal of assets associated with the exited facilities. As of December 31,
2008, we have completed net workforce reductions of approximately 3,900 employees. We are
targeting the majority of the remaining workforce and all facility related cost reduction actions
for completion during 2009 and 2010. Approximately 80% of the total pre-tax charge will
require cash payments, which we will fund with cash generated from operations. During 2008,
we had cash outflows of approximately $130 million related to the 2008 actions. We expect to
incur additional restructuring and related charges of $60 million to complete these actions. We
expect recurring pre-tax savings to increase over the two-year period subsequent to initiating
the actions to approximately $370 million annually, of which $108 million was realized in 2008.
2007 Actions. During 2008, we recorded net pre-tax restructuring and related charges in the
business segments totaling $10 million for restructuring actions initiated in 2007. The 2007
actions relate to ongoing cost reduction efforts, including workforce reductions and the
consolidation of manufacturing facilities. We recorded the charges in 2008 in our segments as
follows: UTC Fire & Security $5 million, Pratt & Whitney $2 million and Hamilton Sundstrand
$3 million. The charges included $9 million in cost of sales and $1 million in selling, general
and administrative expenses. Those costs included $7 million for facility exit and lease
termination costs, $2 million for asset write-downs and $1 million for severance.
We expect the 2007 actions to result in net workforce reductions of approximately 1,800
hourly and salaried employees, the exiting of approximately 500,000 net square feet of facilities
and the disposal of assets associated with the exited facilities. As of December 31, 2008, we have
completed net workforce reductions of approximately 1,700 employees and exited 200,000 net
square feet of facilities. We are targeting the majority of the remaining workforce and facility
related cost reduction actions for completion during 2009. Approximately 70% of the total
pre-tax charge will require cash payments, which we will fund with cash generated from
46 United Technologies Corporation
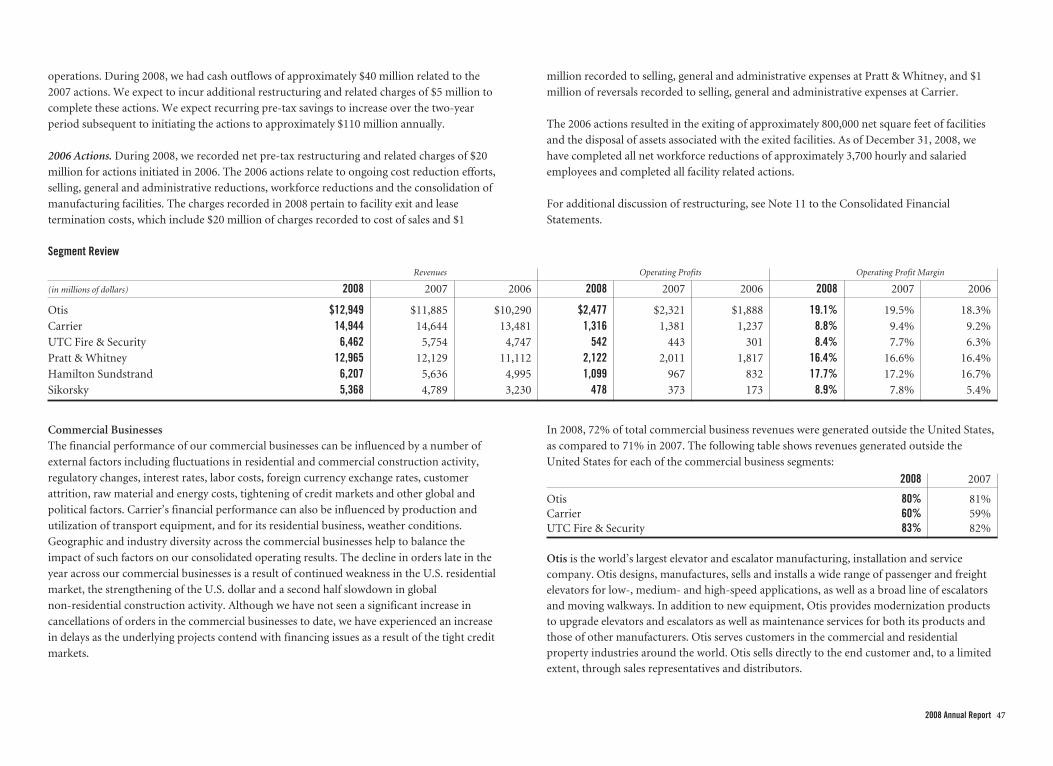
operations. During 2008, we had cash outflows of approximately $40 million related to the
2007 actions. We expect to incur additional restructuring and related charges of $5 million to
complete these actions. We expect recurring pre-tax savings to increase over the two-year
period subsequent to initiating the actions to approximately $110 million annually.
2006 Actions. During 2008, we recorded net pre-tax restructuring and related charges of $20
million for actions initiated in 2006. The 2006 actions relate to ongoing cost reduction efforts,
selling, general and administrative reductions, workforce reductions and the consolidation of
manufacturing facilities. The charges recorded in 2008 pertain to facility exit and lease
termination costs, which include $20 million of charges recorded to cost of sales and $1
million recorded to selling, general and administrative expenses at Pratt & Whitney, and $1
million of reversals recorded to selling, general and administrative expenses at Carrier.
The 2006 actions resulted in the exiting of approximately 800,000 net square feet of facilities
and the disposal of assets associated with the exited facilities. As of December 31, 2008, we
have completed all net workforce reductions of approximately 3,700 hourly and salaried
employees and completed all facility related actions.
For additional discussion of restructuring, see Note 11 to the Consolidated Financial
Statements.
Segment Review
Revenues Operating Profits Operating Profit Margin
(in millions of dollars) 2008 2007 2006 2008 2007 2006 2008 2007 2006
Otis $12,949 $11,885 $10,290 $2,477 $2,321 $1,888 19.1% 19.5% 18.3%
Carrier 14,944 14,644 13,481 1,316 1,381 1,237 8.8% 9.4% 9.2%
UTC Fire & Security 6,462 5,754 4,747 542 443 301 8.4% 7.7% 6.3%
Pratt & Whitney 12,965 12,129 11,112 2,122 2,011 1,817 16.4% 16.6% 16.4%
Hamilton Sundstrand 6,207 5,636 4,995 1,099 967 832 17.7% 17.2% 16.7%
Sikorsky 5,368 4,789 3,230 478 373 173 8.9% 7.8% 5.4%
Commercial BusinessesThe financial performance of our commercial businesses can be influenced by a number of
external factors including fluctuations in residential and commercial construction activity,
regulatory changes, interest rates, labor costs, foreign currency exchange rates, customer
attrition, raw material and energy costs, tightening of credit markets and other global and
political factors. Carrier’s financial performance can also be influenced by production and
utilization of transport equipment, and for its residential business, weather conditions.
Geographic and industry diversity across the commercial businesses help to balance the
impact of such factors on our consolidated operating results. The decline in orders late in the
year across our commercial businesses is a result of continued weakness in the U.S. residential
market, the strengthening of the U.S. dollar and a second half slowdown in global
non-residential construction activity. Although we have not seen a significant increase in
cancellations of orders in the commercial businesses to date, we have experienced an increase
in delays as the underlying projects contend with financing issues as a result of the tight credit
markets.
In 2008, 72% of total commercial business revenues were generated outside the United States,
as compared to 71% in 2007. The following table shows revenues generated outside the
United States for each of the commercial business segments:
2008 2007
Otis 80% 81%Carrier 60% 59%UTC Fire & Security 83% 82%
Otis is the world’s largest elevator and escalator manufacturing, installation and servicecompany. Otis designs, manufactures, sells and installs a wide range of passenger and freightelevators for low-, medium- and high-speed applications, as well as a broad line of escalatorsand moving walkways. In addition to new equipment, Otis provides modernization productsto upgrade elevators and escalators as well as maintenance services for both its products andthose of other manufacturers. Otis serves customers in the commercial and residentialproperty industries around the world. Otis sells directly to the end customer and, to a limitedextent, through sales representatives and distributors.
2008 Annual Report 47

Organic revenue growth of 7% in 2008 was generated by a strong opening new equipment
backlog with revenue increases in Europe and North America. Revenues in Asia were flat as
growth in China was offset by a decline in Korea. New equipment orders rose 8% and new
equipment backlog at the end of the year was up 9%, led by China. Deteriorating economic
conditions have begun to adversely impact many commercial construction markets around the
world, resulting in declining new equipment order rates in the fourth quarter of 2008 and
delays in some previously awarded projects. Global economic conditions are expected to
adversely impact new equipment sales, orders, and pricing in 2009.
In 2008, Otis revenues increased $1,064 million (9%) compared with 2007, reflecting organic
growth (7%) and the favorable impact of foreign currency translation (3%), partially offset by
the absence of gains on the sale of land and a non-core business (combined 1%) recorded in
2007. Revenue growth reflected increased new equipment and service volume, aided by the
strong new equipment backlog entering the year, as well as higher modernization and repair
sales in North America and Europe, the latter benefiting from changes to elevator safety laws in
France and Spain. The 2007 increase of $1,595 million (16%) reflected organic growth (8%),
the favorable impact of foreign currency translation (6%) and gains on the sale of land and a
non-core business (combined 1%). Organic growth reflected increases in all geographic
regions, led by new equipment sales.
Otis operating profits increased $156 million (7%) in 2008 compared with 2007. Profit
improvement resulted from higher volumes, product cost reductions and improved field
installation efficiencies as partially offset by higher commodity and labor costs (net combined
9%), and the favorable impact of foreign currency translation (5%). These improvements were
reduced by the absence in 2008 of gains realized on the sale of land and a non-core business in
2007 (combined 5%) and by provisions for inventory shortages and other accounting
irregularities (2%) discovered at a subsidiary in Brazil in late 2008. Otis expects to conclude its
investigation into the Brazilian matter in 2009.
Operating profits increased $433 million (23%) in 2007 compared with 2006 as a result of
higher revenues and cost containment actions partially offset by escalating commodity and
labor costs (net 9%), the favorable impact of foreign currency translation (7%), gains realized
on the sale of land and a non-core business (combined 6%), and lower restructuring charges
(1%). Operating margins expanded despite the continued shift in sales mix towards new
equipment, which has lower contribution margins than services.
Carrier is the world’s largest manufacturer and distributor of HVAC and refrigeration systems.
It also produces food service equipment and HVAC and refrigeration-related controls for
residential, commercial, industrial and transportation applications. Carrier also provides
installation, retrofit and aftermarket services and components for the products it sells and
those of other manufacturers in the HVAC and refrigeration industries. Sales are made both
directly to the end customer and through manufacturers’ representatives, distributors,
wholesalers, dealers and retail outlets. Certain of Carrier’s HVAC businesses are seasonal and
can be impacted by weather. Carrier customarily offers its customers incentives to purchase
products to ensure adequate supply of our products in the distribution channel.
The slowing global economy has had an immediate impact on Carrier’s short cycle businesses,
leading to a decline in organic revenue of 1% in 2008. Weak end markets have adversely
impacted the Refrigeration business and continued weakness in the U.S. housing market
unfavorably impacted the North American residential businesses. Higher costs on cross border
transactions, as a result of significant currency shifts worldwide, have also negatively impacted
2008 operating margin. Our current expectation is that the U.S. housing market deterioration
will continue throughout 2009. Moderating commercial HVAC order rates and significant
declines in transport refrigeration orders late in the year are expected to create challenging
business conditions in 2009. These challenges as well as weak global economic conditions are
expected to contribute to a further overall decline in organic revenue in 2009. In response to
the current economic environment and expected slower worldwide growth, Carrier continues
to focus on implementing restructuring and other cost reduction initiatives.
Although commodity prices declined in the second half of 2008, Carrier still experienced
overall cost increases for the year, in part due to certain existing long-term supplier
agreements. As a result of commodity cost increases in 2008 and 2007, Carrier implemented
price increases on many of its products. Although this helped to partially mitigate the impact,
commodity cost increases still had a net adverse impact to operating profit in 2008 and 2007 of
$71 million and $79 million, respectively.
Carrier’s revenues increased $300 million (2%) in 2008 compared with 2007, reflecting the
favorable impact of both foreign currency translation (2%) and the net impact of recent
acquisitions (1%). Organic revenue declined (1%) for the year due to weak end markets in the
Refrigeration business and a decline in the Residential and Light Commercial Systems business
in North America attributable to the continued weakness in the U.S. housing market. These
decreases more than offset growth in the Building Systems and Services business while the
Residential and Light Commercial International business was essentially flat. The year-over-
year impact from a gain generated on the contribution of a business into a new venture
operating in the Middle East and the Commonwealth of Independent States was essentially
offset by the absence of a gain in 2007 on the disposition of Carrier’s Fincoil-teollisuus Oy
(Fincoil) heat exchanger business.
48 United Technologies Corporation

Carrier’s revenues increased $1,163 million (9%) in 2007 compared with 2006. Revenue
growth was led by Building Systems and Services (3%), Refrigeration (2%), and Residential
and Light Commercial International HVAC (2%), partially offset by a decline in the
Residential and Light Commercial Systems business in North America (2%) as a result of the
weakness in the U.S. housing market. The year-over-year impact from a gain on the
disposition of Fincoil in 2007 was offset by the impact of a gain in 2006 on Carrier’s sale of its
interest in a compressor manufacturing joint venture. The favorable impact of foreign
currency translation (4%) comprised the majority of the remaining revenue increase in 2007.
Carrier’s operating profits decreased $65 million (5%) in 2008 compared with 2007. Higher
restructuring costs (8%) and the adverse impact of higher commodity costs, net of pricing
(5%), were partially offset by the favorable impact of foreign currency translation (4%), the
absence of the adverse impact of a 2007 settlement of a gas furnace litigation matter (3%) and
the net benefit from recent acquisitions (1%). A gain generated in 2008 from the contribution
of a business to a new venture (5%) was mostly offset by the absence of a gain (4%) recorded
in 2007 on the disposition of Fincoil. Profit growth in Building Systems and Services, product
cost reductions, and benefits from prior restructuring actions, were more than offset by lower
earnings in the Refrigeration and Residential and Light Commercial Systems International
businesses and the adverse impact of higher costs on cross border transactions (4%), as a result
of significant currency shifts experienced during the year, to contribute to the remainder of the
year-over-year decrease in operating profit.
Carrier’s operating profits increased $144 million (12%) in 2007 compared with 2006.
Earnings growth in Building Systems and Services, Residential and Light Commercial
International HVAC, and Refrigeration more than offset declining earnings in Residential and
Light Commercial Systems North America to generate a combined increase in operating
profits (14%). Lower restructuring charges (3%), the absence of manufacturing inefficiencies
associated with the ramp up of the 13 SEER production in 2006, and the favorable impact of
foreign currency translation (4%) were partially offset by the adverse impact of higher
commodity costs, net of price realization (6%). The adverse impact of the settlement of a
furnace litigation matter ($36 million) was more than offset by a gain generated on the
disposition of Fincoil, to generate the majority of the remaining year-over-year change.
UTC Fire & Security is a global provider of security and fire safety products and services. The
UTC Fire & Security segment was created in the second quarter of 2005 upon acquiring Kidde
and adding the Kidde industrial, retail and commercial fire safety businesses to the former
Chubb segment. In the electronic security industry, UTC Fire & Security provides system
integration, installation and service of intruder alarms, access control systems and video
surveillance systems under several brand names including Chubb. In the fire safety industry,
UTC Fire & Security designs, manufactures, integrates, installs, sells and services a wide range
of specialty hazard detection and fixed suppression products and systems and manufactures,
sells and services portable fire extinguishers and other fire fighting equipment under several
brand names including Kidde. UTC Fire & Security also provides monitoring, response and
security personnel services, including cash-in-transit security, to complement its electronic
security and fire safety businesses. UTC Fire & Security sells directly to the customer as well as
through manufacturers’ representatives, distributors, dealers and U.S. retail distribution.
UTC Fire & Security’s revenues increased $708 million (12%) in 2008, as compared with 2007,
due principally to net acquisitions (9%). Organic revenue growth of 3% was primarily
contributed by the North American and European Fire Safety businesses (2%) due to strength
in the oil & gas and marine industries and in Asia. UTC Fire & Security’s revenues increased
$1,007 million (21%) in 2007, as compared with 2006, due to acquisitions (12%), the favorable
impact of foreign currency translation (7%) and organic growth (2%).
UTC Fire & Security’s operating profits increased $99 million (22%) in 2008, as compared
with 2007, due principally to increased sales volume, the benefits of net cost reductions from
previous restructuring and integration and continuing productivity initiatives (combined
18%) and net acquisitions (11%). These improvements were partially offset by the adverse
impact of higher restructuring costs (5%) and the unfavorable impact of foreign currency
translation (1%) to reflect the majority of the remaining year-over-year operating profit
change. Operating profits increased $142 million (47%) in 2007 as compared with 2006. The
majority of the increase in operating profits was generated from increased volume, net cost
reductions from previous restructuring actions (combined 19%), net acquisitions (19%), lower
restructuring costs (2%) and the favorable impact of foreign currency translation (9%). These
improvements were partially offset by the net adverse impact of higher commodity costs (3%).
Aerospace BusinessesThe financial performance of Pratt & Whitney, Hamilton Sundstrand and Sikorsky is directly
tied to the economic conditions of the commercial aerospace and defense industries. In
particular, Pratt & Whitney experiences intense competition for new commercial airframe/
engine combinations. Engine suppliers may offer substantial discounts and other financial
incentives, performance and operating cost guarantees, participation in financing
arrangements and maintenance agreements. At times, the aerospace businesses also enter into
firm fixed-price development contracts, which may require the company to bear cost overruns
related to unforeseen technical and design challenges that arise during the development stage
of the program. Customer selections of engines and components can also have a significant
2008 Annual Report 49

impact on later sales of parts and service. Predicted traffic levels, load factors, worldwide airline
profits, general economic activity and global defense spending have been reliable indicators for
new aircraft and aftermarket orders within the aerospace industry. Spare part sales and
aftermarket service trends are affected by many factors, including usage, technological
improvements, pricing, regulatory changes and the retirement of older aircraft. Performance in
the general aviation sector is closely tied to the overall health of the economy and is positively
correlated to corporate profits.
The volatility of fuel prices throughout much of 2008 adversely impacted the commercial
aerospace industry leading many airline carriers to consolidate or reduce capacity by idling
some aircraft and retiring other older and less fuel efficient aircraft. Several smaller carriers
have either declared bankruptcy or shut down altogether. Although fuel prices had declined
substantially by the end of 2008, the deterioration in the worldwide economic environment has
led to a significant decline in passenger and cargo traffic. RPM growth was essentially flat in
2008 compared to the 5% growth reflected in 2007. We expect worldwide RPMs to be down
approximately 3% in 2009 as a result of expected further air traffic declines. While the service
and capacity reductions did not have a significant impact on our 2008 full year results, we did
begin to see a decline in Pratt & Whitney’s year-over-year large commercial spares orders and
we expect a further decline in 2009 based upon the current economic conditions. As a result of
lower business jet utilization, P&WC experienced a decline in spares volume in the second half
of 2008, and expect further declines in 2009. Total commercial aerospace aftermarket revenues
increased 2% in 2008 compared with 2007, reflecting increases at both Hamilton Sundstrand
and Sikorsky, while Pratt & Whitney was essentially flat year-over-year. Pratt & Whitney’s
commercial aerospace aftermarket revenue performance reflects the growth experienced in the
first half of 2008 offset by declines in the second half of the year. Hamilton Sundstrand’s
aftermarket revenues increased in the year due to provisioning by the airlines and as it supplies
product content on a broad spectrum of aircraft.
Despite the airline industry adversity, the strong production levels at the airframe
manufacturers generated commercial aerospace OEM growth in 2008, as compared with 2007,
as airframe manufacturers continued delivering on their strong backlogs. Given the current
tight credit markets facing both the airlines and the business jet market, there is a possibility
that some commercial aircraft delivery dates scheduled for 2009 are at risk of being deferred.
Projected global traffic declines, a weakening business jet market, and the possible deferral of
commercial aircraft deliveries by airlines to counter the weakening travel demand are all
expected to result in a moderation of growth rates in the commercial aerospace markets. The
machinist strike at Boeing during the year did not have a significant adverse impact to our
2008 full year results.
Continued government military spending is driving helicopter demand and, as a result,
Sikorsky’s military backlog remains very strong. While the U.S. Defense Department budgets
are largely in place for 2009, spending beyond 2009 will reflect policies of a new administration
and Congress. Across all segments, military OEM volume increased 13% in 2008 compared
with 2007, led by Sikorsky. As a result of the strong military helicopter demand and our
existing backlogs, we expect further growth in helicopter deliveries in 2009. Total sales to the
U.S. government of $7.7 billion, $7.3 billion, and $6.4 billion in 2008, 2007, and 2006,
respectively, were 13% of total UTC sales in 2008 and 14% in both 2007 and 2006. The defense
portion of our aerospace business is affected by changes in market demand and the global
political environment. Our participation in long-term production and development programs
for the U.S. government has contributed positively to our results in 2008 and is expected to
continue to benefit results in 2009.
Pratt & Whitney is among the world’s leading suppliers of aircraft engines for the commercial,
military, business jet and general aviation markets. Pratt & Whitney’s Global Services
organization provides maintenance, repair and overhaul services, including the sale of spare
parts, as well as fleet management services for large commercial engines. Pratt & Whitney
produces families of engines for wide and narrow body aircraft in the commercial and military
markets. Pratt & Whitney also sells engines for industrial applications and space propulsion
systems. P&WC is a world leader in the production of engines powering business, regional,
light jet, utility and military aircraft and helicopters. Pratt & Whitney Rocketdyne (PWR) is a
leader in the design, development and manufacture of sophisticated aerospace propulsion
systems for military and commercial applications, including the U.S. space shuttle. Pratt &
Whitney’s products are sold principally to aircraft manufacturers, airlines and other aircraft
operators, aircraft leasing companies, space launch vehicle providers and U.S. and foreign
governments. Pratt & Whitney’s products and services must adhere to strict regulatory and
market driven safety and performance standards. The frequently changing nature of these
standards, along with the long duration of aircraft engine programs, create uncertainty
regarding engine program profitability. The vast majority of sales are made directly to the end
customer and, to a limited extent, through independent distributors and foreign sales
representatives.
During 2007, both Mitsubishi Heavy Industries Ltd. (MHI) and Bombardier selected Pratt &
Whitney’s PurePower engine to power their planned new aircraft. Both aircraft are scheduled
to enter service in 2013. The PurePower engine, featuring GTF technology, is the exclusive
power plant for the new Mitsubishi Regional Jet and the proposed Bombardier C Series family
of passenger aircraft. This engine targets a significant reduction in fuel burn and noise levels
with lower environmental emissions and operating costs than current production engines. In
50 United Technologies Corporation

2008, the PurePower demonstrator engine successfully completed flight testing. The success of
these aircraft and the PurePower engine is dependent upon many factors including
technological challenges, aircraft demand, and regulatory approval. Based on these factors,
additional investment in the PurePower and the GTF program will be required, with potential
additional investment in the underlying aircraft programs being dependent on successful
launch by the air-framers and other conditions.
In view of the risks and costs associated with developing new engines, Pratt & Whitney has
entered into collaboration agreements in which revenues, costs and risks are shared. At
December 31, 2008, the interests of participants in new and existing Pratt & Whitney-directed
jet engine production programs ranged from 14% to 29%. In addition, Pratt & Whitney has
interests in other engine programs, including a 33% interest in the International Aero Engines
(IAE) collaboration that sells and supports V2500® engines for the Airbus A320 family of
aircraft. At December 31, 2008, a portion of Pratt & Whitney’s interest in IAE (equivalent to
4% of the overall IAE collaboration) was held by Pratt & Whitney sub-partners. Pratt &
Whitney also has a 50% interest in the Engine Alliance (EA), a joint venture with GE Aviation,
undertaken to develop, market and manufacture the GP7000® engine for the Airbus A380
aircraft. At December 31, 2008, 40% of Pratt & Whitney’s 50% interest in the EA was held by
other participants. During 2008, we also entered into collaboration arrangements for the above
mentioned PurePower engine programs. Effective January 1, 2009, we have adopted EITF Issue
No. 07-1, “Accounting for Collaborative Arrangements,” which requires that revenues and
costs from collaborative arrangements be reported on a gross basis in the appropriate line item
in our financial statement. For additional discussion of this EITF Issue, see “New Accounting
Pronouncements.”
Pratt & Whitney’s revenues increased $836 million (7%) in 2008 as compared with 2007. This
increase is primarily attributable to higher engine deliveries at P&WC (4%), increased
commercial engine revenue and aftermarket services volume, partially offset by commercial
spares (net combined 1%), and increased volume at Pratt & Whitney Power Systems (1%).
Increased volume at PWR (1%) was offset by lower military engine volumes. Revenues
increased $1,017 million (9%) in 2007 as compared with 2006. This increase was primarily
attributable to higher engine deliveries at P&WC (4%), higher commercial aftermarket volume
(3%), and higher volumes at Pratt & Whitney Power Systems (3%).
Pratt & Whitney’s operating profits increased $111 million (6%) in 2008 as compared with
2007. This increase is primarily attributable to the profit contributions from higher engine
deliveries and favorable engine mix at P&WC (7%) and increased volume at PWR (2%).
Operating profit growth also reflects a gain from the sale of a partial investment (2%) and the
favorable impact of commercial engine mix, a commercial engine program adjustment, and
lower net commodity costs (combined 3%). These profit contributions were partially offset by
the absence of the favorable impact of a contract termination in 2007 (3%), higher year-over-
year restructuring costs (3%) and the adverse impact of foreign currency movement (3%) on
both foreign currency translation and hedging activity.
Pratt & Whitney’s operating profits increased $194 million (11%) in 2007 as compared with
2006. This increase was primarily attributable to the profit contribution from higher volumes
in commercial markets and aftermarket services (12%), higher volumes and aftermarket
performance at P&WC (6%), and an improved engine mix in military markets (5%). These
increases to operating profit were partially offset by the impact of higher year-over-year
commodity costs (7%), and the absence of the favorable impact of a 2006 settlement of a
government litigation matter (5%).
Hamilton Sundstrand is among the world’s leading suppliers of technologically advanced
aerospace and industrial products and aftermarket services for diversified industries
worldwide. Hamilton Sundstrand’s aerospace products, such as power generation,
management and distribution systems, flight systems, engine control systems, environmental
control systems, fire protection and detection systems, auxiliary power units and propeller
systems, serve commercial, military, regional, business and general aviation, as well as space
and undersea applications. Aftermarket services include spare parts, overhaul and repair,
engineering and technical support and fleet maintenance programs. Hamilton Sundstrand sells
aerospace products to airframe manufacturers, the U.S. and foreign governments, aircraft
operators and independent distributors. Hamilton Sundstrand’s principal industrial products,
such as air compressors, metering pumps and fluid handling equipment, serve industries
involved with raw material processing, bulk material handling, construction, hydrocarbon and
chemical processing, and water and wastewater treatment. These products are sold under the
Sullair, Sundyne, Milton Roy and other brand names directly to end-users and through
manufacturers’ representatives and distributors.
Hamilton Sundstrand’s revenues increased $571 million (10%) in 2008 as compared with
2007, due principally to organic volume growth in both the aerospace (7%) and industrial
(2%) businesses, and the favorable impact of foreign currency translation (1%). The increase
within aerospace was primarily attributable to OEM volume growth. Revenues increased $641
million (13%) in 2007 as compared with 2006 due principally to organic volume growth in
both the aerospace (7%) and industrial (2%) businesses, and the favorable impact of foreign
currency translation (2%). Within aerospace, both commercial aftermarket (5%) and
commercial OEM (2%) contributed to the volume increase.
2008 Annual Report 51

Hamilton Sundstrand’s operating profits increased $132 million (14%) in 2008 as compared
with 2007, primarily due to growth in the aerospace (6%) and industrial businesses (2%). The
favorable impact of gains related to divestiture activity (3%), the favorable impact of foreign
currency translation (1%), and lower year-over-year restructuring costs (1%) contributed the
majority of the remaining year-over-year operating profit growth. Operating profits increased
$135 million (16%) in 2007 as compared with 2006 due principally to volume growth in both
the commercial aftermarket (13%) and industrial businesses (2%) and the favorable impact of
foreign currency translation (2%). Operating profits from commercial OEM revenue growth
(8%) and the impact of lower restructuring costs (2%) were mostly offset by increased
company funded research and development costs (9%), principally related to the Boeing 787
program.
Sikorsky is one of the world’s largest manufacturers of military and commercial helicopters
and also provides aftermarket helicopter and aircraft parts and services. Current major
production programs at Sikorsky include the UH-60M Black Hawk medium-transport
helicopters and HH-60M Medevac helicopters for the U.S. and foreign governments, the S-70
Black Hawk for foreign governments, the MH-60S and MH-60R helicopters for the U.S. Navy,
the International Naval Hawk for multiple naval missions, and the S-76 and the S-92
helicopters for commercial operations. The UH-60M helicopter is the latest and most modern
in a series of Black Hawk variants that Sikorsky has been delivering to the U.S. Army since 1978
and requires significant additional assembly hours relative to the previous variants. In
December 2007, the U.S. government and Sikorsky signed a five-year, multi-service contract
for 537 H-60 helicopters to be delivered to the U.S. Army and U.S. Navy, which include the
UH-60M, HH-60M, MH-60S and MH-60R aircraft. The contract value for expected deliveries
over the five year term is approximately $7.4 billion and includes options for an additional 263
aircraft, spares, and kits, with the total contract value potentially reaching $11.6 billion making
it the largest contract in UTC and Sikorsky history. Actual production quantities will be
determined year by year over the life of the program based on funding allocations set by
Congress and Pentagon acquisition priorities. The deliveries of the aircraft are scheduled to be
made through 2012. Sikorsky also is developing the CH-53K next generation heavy lift
helicopter for the U.S. Marine Corps and the CH-148, a derivative of the H-92, a military
variant of the S-92, for the Canadian government. The latter is being developed under an
approximately $3 billion firm, fixed-price contract that provides for the development,
production, and 20-year logistical support of 28 helicopters. This is the largest and most
expansive fixed-price development contract in Sikorsky’s history. In December 2008, Sikorsky
and the Canadian government executed amendments to the contract that revised the delivery
schedule and contract specifications. The first test flight was successfully conducted in
November 2008 and delivery of the first helicopter is scheduled for the fourth quarter of 2010.
Sikorsky’s aftermarket business includes spare parts sales, overhaul and repair services,
maintenance contracts, and logistics support programs for helicopters and other aircraft. Sales
are made directly by Sikorsky and by its subsidiaries and joint ventures. Sikorsky is increasingly
engaging in logistics support programs and partnering with its government and commercial
customers to manage and provide maintenance and repair services.
Sikorsky’s revenues increased $579 million (12%) in 2008, as compared with 2007, due to the
higher volume of military aircraft deliveries and a favorable aircraft mix between military and
commercial programs. Revenues increased $1,559 million (48%) in 2007, as compared with
2006, due to higher business volume and full production in 2007 as compared to 2006, which
was adversely impacted by the six week strike of Sikorsky’s union workforce. Increases in
military aircraft deliveries and program support (22%), commercial aircraft revenues
(13%) and aftermarket operations (13%) comprised the majority of the year-over-year
revenue increase.
Sikorsky’s operating profits increased $105 million (28%) in 2008 as compared with 2007. This
improvement was primarily attributable to increased military aircraft deliveries and favorable
aircraft mix for both military and commercial programs (combined 42%). These
improvements were partially offset by increased selling, general, and administrative expenses
(7%) and research and development (6%). Sikorsky’s operating profits increased $200 million
(116%) in 2007 as compared with 2006. A 58% increase in the number of large aircraft
deliveries as a result of strong commercial and military demand and the absence of the strike
related impact in 2006 generated the majority of the increase in operating profit in 2007. Lower
year-over-year restructuring charges (14%), partially offset by the absence of recoveries from
the Comanche program termination (7%), contributed to the remaining operating profit
increase.
Liquidity and Financing Commitments
(in millions of dollars) 2008 2007
Cash and cash equivalents $ 4,327 $ 2,904
Total debt 11,476 9,148
Net debt (total debt less cash and cash equivalents) 7,149 6,244
Shareowners’ equity 15,917 21,355
Total capitalization (debt plus equity) 27,393 30,503
Net capitalization (debt plus equity less cash and
cash equivalents) 23,066 27,599
Debt to total capitalization 42% 30%
Net debt to net capitalization 31% 23%
52 United Technologies Corporation

We assess our liquidity in terms of our ability to generate cash to fund our operating, investing
and financing activities. Our principal source of liquidity is operating cash flows, which, after
netting out capital expenditures, we target to equal or exceed net income. In addition to
operating cash flows, other significant factors that affect our overall management of liquidity
include: capital expenditures, customer financing requirements, investments in businesses,
dividends, common stock repurchases, pension funding, access to the commercial paper
markets, adequacy of available bank lines of credit, and the ability to attract long-term capital
at satisfactory terms.
Recent distress in the financial markets has had an adverse impact on financial market
activities including, among other things, extreme volatility in security prices, severely
diminished liquidity and credit availability, rating downgrades of certain investments and
declining valuations of others. We have assessed the implications of these factors on our
current business, are closely monitoring the impact on our customers and suppliers, and have
determined that there has not been a significant impact on our financial position, results of
operations or liquidity during 2008. Our pension plans have not experienced any significant
impact on liquidity or counterparty exposure due to the volatility in the credit markets.
However, as a result of losses experienced in the global equity markets, our domestic pension
funds experienced a negative return on assets of approximately 27% in 2008. This negative
return on our domestic plan in 2008, combined with a change in discount rate will increase
pension costs by approximately $225 million in 2009 as compared to 2008. The negative return
on assets also had a significant adverse impact on shareowners’ equity in 2008. Combined with
the changes attributable to foreign currency translation, the unrealized pension losses
contributed a combined increase of seven percentage points to the debt to equity ratio.
Approximately 85% of our domestic pension plans are invested in readily-liquid investments,
including equity, fixed income, asset backed receivables and structured products. Less than 1%
of these investments are senior tranches of several structured investment vehicles that have
been absorbed onto the balance sheets of the sponsoring banks. The balance of our domestic
pension plans (14%) is invested in less-liquid but market-valued investments, including real
estate and private equity.
As discussed further below, our strong debt ratings and financial position enabled us to issue
$1.0 billion of long-term debt in May 2008 and $1.25 billion of long-term debt in December
2008 at favorable market rates. While market volatility cannot be predicted, we do not
currently expect a significant impact to our liquidity, financial position or results of operations
in 2009.
Our ability to obtain debt financing at comparable risk-based interest rates is partly a function
of our existing debt to capitalization levels as well as our current credit standing. In December
2008, we used the net proceeds from our December 2008 issuance of $1.25 billion in long-term
debt to repay a portion of our outstanding commercial paper borrowings at that time, as well
as a portion of our outstanding borrowings from our multicurrency revolving credit facility.
Our credit ratings are reviewed regularly by major debt rating agencies such as Standard and
Poor’s and Moody’s Investors Service. In November 2008, Standard and Poor’s affirmed our
short-term debt rating as A-1, and in December 2008, affirmed our long-term debt rating as A.
Similarly, in November 2008, Moody’s Investors Service also affirmed its corporate rating on
our long-term and short-term debt as A2 and P-1, respectively. We continue to have access to
the commercial paper markets and our existing credit facilities, and expect to continue to
generate strong operating cash flows. While the impact of continued market volatility cannot
be predicted, we believe we have sufficient operating flexibility, cash reserves and funding
sources to maintain adequate amounts of liquidity and to meet our future operating cash
needs.
Most of our cash is denominated in foreign currencies. We manage our worldwide cash
requirements by considering available funds among the many subsidiaries through which we
conduct our business and the cost effectiveness with which those funds can be accessed. The
repatriation of cash balances from certain of our subsidiaries could have adverse tax
consequences; however, those balances are generally available without legal restrictions to fund
ordinary business operations. We will continue to transfer cash from those subsidiaries to UTC
and to other international subsidiaries when it is cost effective to do so.
We believe our future operating cash flows will be sufficient to meet our future operating cash
needs. Further, our ability to obtain debt or equity financing, as well as the availability under
committed credit lines, provides additional potential sources of liquidity should they be
required.
Cash Flow from Operating Activities
Year Ended December 31,
(in millions of dollars) 2008 2007
Net cash flows provided by operating activities $6,161 $5,330
In both 2008 and 2007, the majority of cash flows provided by operating activities were
generated by the income from the strong operational performance in both years. For 2008, the
net income contribution was partially offset by a growth in working capital of $230 million and
2008 Annual Report 53

an increase in other net operating assets of approximately $240 million. The approximately
$560 million growth in inventory was significantly lower than the $1.1 billion growth in 2007
and largely reflected the increased production levels at Sikorsky. However, the overall growth
in inventories was more than offset by accounts payable and customer advances reflected in the
approximately $790 million increase in accounts payable and accrued liabilities. The increase
in accounts receivable is reflective of the overall growth in revenues.
For 2007, revenue and production growth generated a combined increase in inventory and
accounts receivable of approximately $1.6 billion. However, this amount was completely
funded by accounts payable and customer advances as reflected in the approximately $1.6
billion increase in accounts payable and accrued liabilities. Changes in other net operating
assets consumed approximately $680 million due largely to the payment of the previously
noted EU Fine and to the payment of Canadian taxes in connection with ongoing tax planning
activities.
The funded status of our pension plans is dependent upon many factors, including returns on
invested assets and the level of market interest rates. We can contribute cash or company stock
to our plans at our discretion, subject to applicable regulations. Total cash contributions to
pension plans during 2008 and 2007 were $242 million and $181 million, respectively. We also
contributed $250 million and $150 million in UTC common stock to these plans during 2008
and 2007, respectively. As of December 31, 2008, the total investment by the defined benefit
pension plans in our securities is approximately 4% of total plan assets. We expect to make
contributions of approximately $600 million to our pension plans in 2009, including
approximately $400 million to our domestic plans. Expected contributions to our defined
pension plans in 2009 will meet or exceed the current funding requirements.
Cash Flow from Investing Activities
Year Ended December 31,
(in millions of dollars) 2008 2007
Net cash flows used in investing activities $(2,336) $(3,182)
The 2008 activity primarily reflects a net investment in businesses of $915 million and capital
expenditures of $1,216 million. This compares with a net investment in businesses in 2007 of
$1,739 million and capital expenditures of $1,153 million. Cash investment in businesses
across all of our operations in 2008 was $1,252 million and primarily consisted of a number of
small acquisitions in our commercial businesses. Acquisitions in 2007 consisted principally of
the UTC Fire & Security acquisition of IESG for $952 million and Marioff for $348 million, as
well as a number of smaller acquisitions across the businesses. Dispositions in both 2008 and
2007 consisted primarily of the sale of certain non-core businesses including Carrier’s Fincoil
in 2007. We expect total investments in businesses in 2009 to approximate $2 billion; however,
actual acquisition spending may vary depending upon the timing, availability and appropriate
value of acquisition opportunities.
The $63 million increase in capital expenditures in 2008 as compared with 2007 is related
largely to restructuring and facility changes across the businesses. In preparation for the
challenging economic climate expected in 2009, we have tightened capital expenditure
spending substantially across the company and as a result expect a reduction of spending in
2009.
Customer financing activities were a net cash use of $147 million in 2008, compared to a net
cash use of $139 million in 2007. While we expect that customer financing will be a net use of
cash in 2009, actual funding is subject to usage under existing customer financing
arrangements. At December 31, 2008, we had financing and rental commitments of $1,142
million related to commercial aircraft, of which as much as $407 million may be required to be
disbursed in 2009. We may also arrange for third-party investors to assume a portion of our
commitments. Refer to Note 4 to the Consolidated Financial Statements for additional
discussion of our commercial aerospace industry assets and commitments.
Cash Flow from Financing Activities
Year Ended December 31,
(in millions of dollars) 2008 2007
Net cash flows used in financing activities $(2,238) $(1,955)
In both 2008 and 2007, cash was primarily used to return value to shareowners through
dividends and share repurchases. In December 2008, May 2008 and December 2007, we
issued $1.25 billion, $1.0 billion and $1.0 billion, respectively, of long-term debt. The
proceeds of the May 2008 issuance were primarily used for general corporate purposes,
including financing acquisitions and repurchases of our stock. The proceeds of the December
2008 and 2007 issuances were primarily used to repay commercial paper borrowings and
to repay outstanding borrowings under our multicurrency revolving credit facility
described below.
The timing and levels of certain cash flow activities, such as acquisitions and repurchases of our
stock, have resulted in the issuance of both long-term and short-term debt. Commercial paper
54 United Technologies Corporation

borrowings and revolving credit facilities provide short-term liquidity to supplement operating
cash flows and are used for general corporate purposes, including the funding of potential
acquisitions and repurchases of our stock. At December 31, 2008, we had two committed
credit agreements from banks permitting aggregate borrowings of up to $2.5 billion. One
credit commitment is a $1.5 billion revolving credit agreement. As of December 31, 2008 there
were no borrowings under this revolving credit agreement, which expires in October 2011. We
also have a $1.0 billion multicurrency revolving credit agreement that is available for general
funding purposes, including acquisitions. As of December 31, 2008, approximately $460
million had been borrowed under this revolving credit agreement. This agreement expires in
November 2011. As of December 31, 2008, the undrawn portions of both the $1.5 billion
revolving credit agreement and $1.0 billion multicurrency revolving credit agreement were
available to serve as backup facilities for the issuance of commercial paper. In December 2008,
we increased our maximum commercial paper borrowing authority from $1.5 billion to $2.5
billion. In addition, at December 31, 2008, approximately $2.0 billion was available under
short-term lines of credit with local banks at our various domestic and international
subsidiaries. We had approximately $150 million of commercial paper outstanding at
December 31, 2008, all of which was scheduled to mature within one month. In February 2009,
we redeemed the entire $500 million outstanding principal amount of Floating Rate Notes that
were due in June 2009.
In July 2007, we filed a universal shelf registration statement with the SEC for an indeterminate
amount of securities for future issuance, subject to our internal limitations on the amount of
debt to be issued under this shelf registration statement.
Financing cash outflows for 2008 and 2007 included the repurchase of 50.4 million and
28.3 million shares of our common stock for $3,160 million and $2,001 million, respectively,
under a share repurchase program. On June 11, 2008, the Board of Directors authorized a new
60 million common share repurchase program that replaced the previous program, approved
in December 2006, which was nearing completion. Of the approximately 50 million shares
which were repurchased in 2008, 19 million shares were repurchased under the previous
program and 31 million shares were repurchased under the new program. In addition to
management’s view that the repurchase of our common stock is a beneficial investment, we
also repurchase to offset the dilutive effect of the issuance of stock and options under the
stock-based employee benefit programs. At December 31, 2008, we had remaining authority to
repurchase approximately 29 million shares under the current program. We expect total share
repurchases in 2009 to approximate $2.0 billion; however, total repurchases may vary
depending upon various factors including the level of other investing activities.
We paid dividends of $.32 per share in the first quarter of 2008 for a total of $293 million, $.32
per share in the second quarter for a total of $290 million, $.32 per share in the third quarter
for a total of $286 million, and $.385 per share in the fourth quarter for a total of $341 million.
During 2007, $1,080 million of cash dividends were paid to shareowners.
Critical Accounting Estimates
Preparation of our financial statements requires management to make estimates and
assumptions that affect the reported amounts of assets, liabilities, revenues and expenses. Note
1 to the Consolidated Financial Statements describes the significant accounting policies used in
preparation of the Consolidated Financial Statements. Management believes the most complex
and sensitive judgments, because of their significance to the Consolidated Financial
Statements, result primarily from the need to make estimates about the effects of matters that
are inherently uncertain. The most significant areas involving management judgments and
estimates are described below. Actual results in these areas could differ from management’s
estimates.
Long-Term Contract Accounting. We utilize percentage of completion accounting on certain of
our long-term contracts. The percentage of completion method requires estimates of future
revenues and costs over the full term of product delivery. We also utilize the completed-
contract method of accounting on certain lesser value commercial contracts. Under the
completed-contract method, sales and cost of sales are recognized when a contract is
completed.
Losses, if any, on long-term contracts are provided for when anticipated. We recognize loss
provisions on original equipment contracts to the extent that estimated inventoriable
manufacturing, engineering, product warranty and product performance guarantee costs
exceed the projected revenue from the products contemplated under the contractual
arrangement. For new commitments, we generally record loss provisions at the earlier of
contract announcement or contract signing. For existing commitments, anticipated losses on
contracts are recognized in the period in which losses become evident. Products contemplated
under the contractual arrangement include products purchased under the contract and, in the
large commercial engine business, future highly probable sales of replacement parts required
by regulation that are expected to be purchased subsequently for incorporation into the
original equipment. Revenue projections used in determining contract loss provisions are
based upon estimates of the quantity, pricing and timing of future product deliveries. We
recognize losses on shipment to the extent that inventoriable manufacturing costs, estimated
warranty costs and product performance guarantee costs exceed revenue realized. We measure
2008 Annual Report 55

the extent of progress toward completion on our long-term commercial aerospace equipmentand helicopter contracts using units of delivery. In addition, we use the cost-to-cost methodfor development contracts in the aerospace businesses and for elevator and escalator sales,installation and modernization contracts in the commercial businesses. For long-termaftermarket contracts, we recognize revenue over the contract period in proportion to the costsexpected to be incurred in performing services under the contract. Contract accounting alsorequires estimates of future costs over the performance period of the contract as well as anestimate of award fees and other sources of revenue.
Contract costs are incurred over a period of time, which can be several years, and theestimation of these costs requires management’s judgment. The long-term nature of thesecontracts, the complexity of the products, and the strict safety and performance standardsunder which they are regulated can affect our ability to estimate costs precisely. As a result, wereview and update our cost estimates on significant contracts on a quarterly basis, and no lessfrequently than annually for all others, or when circumstances change and warrant amodification to a previous estimate. We record adjustments to contract loss provisions inearnings when identified.
Income Taxes. The future tax benefit arising from net deductible temporary differences and taxcarryforwards is $5.2 billion at December 31, 2008 and $2.4 billion at December 31, 2007.Management believes that our earnings during the periods when the temporary differencesbecome deductible will be sufficient to realize the related future income tax benefits. For thosejurisdictions where the expiration date of tax carryforwards or the projected operating resultsindicate that realization is not likely, a valuation allowance is provided.
In assessing the need for a valuation allowance, we estimate future taxable income, consideringthe feasibility of ongoing tax planning strategies and the realizability of tax loss carryforwards.Valuation allowances related to deferred tax assets can be affected by changes to tax laws,changes to statutory tax rates and future taxable income levels. In the event we were todetermine that we would not be able to realize all or a portion of our deferred tax assets in thefuture, we would reduce such amounts through a charge to income in the period in which thatdetermination is made or when tax law changes are enacted. Conversely, if we were todetermine that we would be able to realize our deferred tax assets in the future in excess of thenet carrying amounts, we would decrease the recorded valuation allowance through anincrease to income in the period in which that determination is made. Subsequentlyrecognized tax benefits associated with valuation allowances recorded in a businesscombination have been recorded as an adjustment to goodwill. However, upon the January 1,2009 adoption of SFAS 141(R), changes in deferred tax asset valuation allowances and incometax uncertainties after the acquisition date generally will affect income tax expense as furtherdescribed in “New Accounting Pronouncements.”
In the ordinary course of business there is inherent uncertainty in quantifying our income tax
positions. We assess our income tax positions and record tax benefits for all years subject to
examination based upon management’s evaluation of the facts, circumstances and information
available at the reporting date. For those tax positions where it is more likely than not that a tax
benefit will be sustained, we have recorded the largest amount of tax benefit with a greater than
50% likelihood of being realized upon ultimate settlement with a taxing authority that has full
knowledge of all relevant information. For those income tax positions where it is not more
likely than not that a tax benefit will be sustained, no tax benefit has been recognized in the
financial statements. See Notes 1 and 9 to the Consolidated Financial Statements for further
discussion.
Goodwill and Intangible Assets. Our net investments in businesses in 2008 totaled $1.4 billion,
including approximately $196 million of debt assumed. The assets and liabilities of acquired
businesses are recorded under the purchase method of accounting at their estimated fair values
at the dates of acquisition. Goodwill represents costs in excess of fair values assigned to the
underlying net assets of acquired businesses.
Goodwill and intangible assets deemed to have indefinite lives are not amortized, but are
subject to annual impairment testing. The identification and measurement of goodwill
impairment involves the estimation of the fair value of reporting units. The estimates of fair
value of reporting units are based on the best information available as of the date of the
assessment, which primarily incorporates management assumptions about expected future
cash flows and contemplates other valuation techniques. Future cash flows can be affected by
changes in industry or market conditions or the rate and extent to which anticipated synergies
or cost savings are realized with newly acquired entities. We completed our assessment of
goodwill as of July 1, 2008 and determined that no impairment existed at that date. Although
no significant goodwill impairment has been recorded to date, there can be no assurances that
future goodwill impairments will not occur. However, a 10% decrease in the estimated fair
value of any of our reporting units at the date of our 2008 assessment would not have resulted
in a goodwill impairment charge. See Note 2 to the Consolidated Financial Statements for
further discussion.
Product Performance. We extend performance and operating cost guarantees beyond our
normal service and warranty policies for extended periods on some of our products,
particularly commercial aircraft engines. Liability under such guarantees is based upon future
product performance and durability. In addition, we incur discretionary costs to service our
products in connection with product performance issues. We accrue for such costs that are
probable and can be reasonably estimated. The costs associated with these product
performance and operating cost guarantees require estimates over the full terms of the
56 United Technologies Corporation

agreements, and require management to consider factors such as the extent of future
maintenance requirements and the future cost of material and labor to perform the services.
These cost estimates are largely based upon historical experience. See Note 13 to the
Consolidated Financial Statements for further discussion.
Contracting with the U.S. Government. Our contracts with the U.S. government are subject to
government oversight and audit. Like many defense contractors, we have received audit
reports, which recommend that certain contract prices should be reduced to comply with
various government regulations. Some of these audit reports have involved substantial
amounts. We have made voluntary refunds in those cases we believe appropriate. In addition,
we accrue for liabilities associated with those government contracting matters that are
probable and can be reasonably estimated. The inherent uncertainty related to the outcome of
these matters can result in amounts materially different from any provisions made with respect
to their resolution. See Note 15 to the Consolidated Financial Statements for further
discussion. We recorded sales to the U.S. government of $7.7 billion, $7.3 billion, and $6.4
billion in 2008, 2007, and 2006, respectively.
Employee Benefit Plans. We sponsor domestic and foreign defined benefit pension and other
postretirement plans. Major assumptions used in the accounting for these employee benefit
plans include the discount rate, expected return on plan assets, rate of increase in employee
compensation levels, and health care cost increase projections. Assumptions are determined
based on company data and appropriate market indicators, and are evaluated each year at
December 31. A change in any of these assumptions would have an effect on net periodic
pension and postretirement benefit costs reported in the Consolidated Financial Statements.
In the following table, we show the sensitivity of our pension and other postretirement benefit
plan liabilities and net periodic cost to a 25 basis point change in the discount rate as of
December 31, 2008.
(in millions of dollars)
Change inDiscount Rate
Increase in 25 bps
Change inDiscount Rate
Decrease in 25 bps
Pension plans
Projected benefit obligation $(625) $647
Net periodic pension cost (67) 66
Other postretirement benefit plans
Accumulated postretirement benefit
obligation (14) 14
Net periodic postretirement benefit cost — —
Pension expense is also sensitive to changes in the expected long-term rate of asset return. An
increase or decrease of 25 basis points in the expected long-term rate of asset return would
have decreased or increased 2008 pension expense by approximately $48 million.
The weighted-average discount rate used to measure pension liabilities and costs is set by
reference to UTC specific analysis using each plan’s specific cash flows and compared to high-
quality bond indices for reasonableness. Global market interest rates have increased in 2008 as
compared with 2007 and, as a result, the weighted-average discount rate used to measure
pension liabilities increased from 6.0% in 2007 to 6.1% in 2008. Pension expense in 2009 is
expected to increase approximately $225 million primarily as a result of negative asset return
incurred in 2008 that resulted from the deterioration in the global equity markets. See Note 10
to the Consolidated Financial Statements for further discussion.
Inventory Valuation Reserves. Inventory valuation reserves are established in order to report
inventories at the lower of cost or market value on our Consolidated Balance Sheet. The
determination of inventory valuation reserves requires management to make estimates and
judgments on the future salability of inventories. Valuation reserves for excess, obsolete, and
slow-moving inventory are estimated by comparing the inventory levels of individual parts to
both future sales forecasts or production requirements and historical usage rates in order to
identify inventory where the resale value or replacement value is less than inventoriable cost.
Other factors that management considers in determining these reserves include whether
individual inventory parts meet current specifications and cannot be substituted for a part
currently being sold or used as a service part, overall market conditions, and other inventory
management initiatives.
As of December 31, 2008, and 2007 we had $497 million and $471 million, respectively, of
inventory valuation reserves recorded. Although management believes these reserves are
adequate, any abrupt changes in market conditions may require us to record additional
inventory valuation reserves.
Off-Balance Sheet Arrangements and Contractual Obligations
We extend a variety of financial guarantees to third parties in support of unconsolidated
affiliates and for potential financing requirements of commercial aerospace customers. We also
have obligations arising from sales of certain businesses and assets, including representations
and warranties and related indemnities for environmental, health and safety, tax and
employment matters. Circumstances that could cause the contingent obligations and liabilities
arising from these arrangements to come to fruition are changes in an underlying transaction
(e.g., hazardous waste discoveries, etc.), nonperformance under a contract, customer requests
for financing, or deterioration in the financial condition of the guaranteed party.
2008 Annual Report 57

A summary of our consolidated contractual obligations and commitments as of December 31,
2008 is as follows:
Payments Due by Period
(in millions of dollars) TotalLess than
1 Year1-3
Years3-5
YearsMore than
5 Years
Long-term debt * $10,453 $ 1,116 $1,672 $ 506 $ 7,159
Operating leases 1,650 453 636 302 259
Purchase obligations 14,102 8,340 4,284 1,081 397
Other long-term liabilities 16,548 1,906 3,326 3,136 8,180
Total contractual obligations $42,753 $11,815 $9,918 $5,025 $15,995
* Principal only; excludes associated interest payments
Purchase obligations include amounts committed under legally enforceable contracts or
purchase orders for goods and services with defined terms as to price, quantity, delivery and
termination liability. Approximately 35% of the purchase obligations disclosed above represent
purchase orders for products to be delivered under firm contracts with the U.S. government
for which we have full recourse under normal contract termination clauses.
Other long-term liabilities primarily include those amounts on our December 31, 2008 balance
sheet representing obligations under product service and warranty policies, performance and
operating cost guarantees, estimated environmental remediation costs and payments under
employee benefit programs. Due to the impact of current market conditions on our overall
pension plans, our pension plans shifted from a net asset position in 2007 to a net liability
position in 2008, requiring a gross obligation of approximately $14 billion to be reflected in the
above table. The timing of expected cash flows associated with these obligations is based upon
management’s estimates over the terms of these agreements and is largely based upon
historical experience.
The above table does not reflect unrecognized tax benefits of $773 million, the timing of which
is uncertain, except for approximately $50 million that may become payable during 2009. Refer
to Note 9 to the Consolidated Financial Statements for additional discussion on unrecognized
tax benefits. In addition, the above table does not include approximately $600 million of
expected contributions to our global pension plans in 2009, including approximately $400
million to our domestic plans.
Commercial Commitments
Amount of Commitment Expiration per Period
(in millions of dollars) CommittedLess than
1 Year1-3
Years3-5
YearsMore than
5 Years
Commercial aerospace financing and
rental commitments $1,142 $ 407 $146 $ 12 $577
IAE financing arrangements 1,420 396 603 259 162
Unconsolidated subsidiary
debt guarantees 208 133 12 — 63
Commercial aerospace financing
arrangements 137 4 5 9 119
Commercial customer
financing arrangements 209 209 — — —
Performance guarantees 40 33 7 — —
Total commercial commitments $3,156 $1,182 $773 $280 $921
Refer to Notes 4, 13 and 15 to the Consolidated Financial Statements for additional discussion
on contractual and commercial commitments.
Market Risk and Risk Management
We are exposed to fluctuations in foreign currency exchange rates, interest rates and
commodity prices. To manage certain of those exposures, we use derivative instruments,
including swaps, forward contracts and options. Derivative instruments utilized by us in our
hedging activities are viewed as risk management tools, involve little complexity and are not
used for trading or speculative purposes. We diversify the counterparties used and monitor the
concentration of risk to limit our counterparty exposure.
We have evaluated our exposure to changes in foreign currency exchange rates, interest rates
and commodity prices in our market risk sensitive instruments, which are primarily cash, debt
and derivative instruments, using a value at risk analysis. Based on a 95% confidence level and
a one-day holding period, at December 31, 2008, the potential loss in fair value on our market
risk sensitive instruments was not material in relation to our financial position, results of
operations or cash flows. Our calculated value at risk exposure represents an estimate of
reasonably possible net losses based on volatilities and correlations and is not necessarily
indicative of actual results. Refer to Notes 1, 8 and 12 to the Consolidated Financial Statements
for additional discussion of foreign currency exchange, interest rates and financial instruments.
58 United Technologies Corporation

Foreign Currency Exposures. We have a large volume of foreign currency exposures that result
from our international sales, purchases, investments, borrowings and other international
transactions. International segment revenues, including U.S. export sales, averaged
approximately $33 billion over the last three years. We actively manage foreign currency
exposures that are associated with committed foreign currency purchases and sales and other
assets and liabilities created in the normal course of business at the operating unit level. More
than insignificant exposures that cannot be naturally offset within an operating unit are hedged
with foreign currency derivatives. We also have a significant amount of foreign currency net
asset exposures. Currently, we do not hold any derivative contracts that hedge our foreign
currency net asset exposures but may consider such strategies in the future.
Within aerospace, our revenues are typically denominated in U.S. dollars under accepted
industry convention. However, for our non-U.S. based entities, such as P&WC, a substantial
portion of their costs are incurred in local currencies. Consequently, there is a foreign currency
exchange impact and risk to operational results as U.S. dollars must be converted to local
currencies such as the Canadian dollar in order to meet local currency cost obligations. In
order to minimize the exposure that exists from changes in the exchange rate of the U.S. dollar
against these other currencies, we hedge a certain portion of revenues to secure the rates at
which U.S. dollars will be converted. The majority of this hedging activity occurs at P&WC. At
P&WC, firm and forecasted sales for both engines and spare parts are hedged at varying
amounts up to 24 months on the U.S. dollar revenue exposure as represented by the excess of
U.S. dollar revenues over U.S. dollar denominated purchases. Hedging gains and losses
resulting from movements in foreign currency exchange rates are partially offset by the foreign
currency translation impacts that are generated on the translation of local currency operating
results into U.S. dollars for reporting purposes. While the objective of the hedging program is
to minimize the foreign currency exchange impact on operating results, there are typically
variances between the hedging gains or losses and the translational impact due to the length of
hedging contracts, changes in the revenue profile, volatility in the exchange rates and other
such operational considerations.
Interest Rate Exposures. Our long-term debt portfolio consists mostly of fixed-rate
instruments. From time to time, we may hedge to floating rates using interest rate swaps. The
hedges are designated as fair value hedges and the gains and losses on the swaps are reported in
interest expense, reflecting that portion of interest expense at a variable rate. We issue
commercial paper, which exposes us to changes in interest rates. Currently, we do not hold any
derivative contracts that hedge our interest exposures, but may consider such strategies in the
future.
Commodity Price Exposures. We are exposed to volatility in the prices of raw materials used in
some of our products and from time to time we may use forward contracts in limited
circumstances to manage some of those exposures. In the future, if hedges are used, gains and
losses may affect earnings. There were no significant outstanding commodity hedges as of
December 31, 2008.
Environmental Matters
Our operations are subject to environmental regulation by federal, state and local authorities in
the United States and regulatory authorities with jurisdiction over our foreign operations. As a
result, we have established, and continually update, policies relating to environmental
standards of performance for our operations worldwide. We believe that expenditures
necessary to comply with the present regulations governing environmental protection will not
have a material effect upon our competitive position, results of operations, cash flows or
financial condition.
We have identified 579 locations, mostly in the United States, at which we may have some
liability for remediating contamination. We have resolved our liability at 228 of these locations.
We do not believe that any individual location’s exposure will have a material effect on our
results of operations. Sites in the investigation, remediation or operation and maintenance
stage represent approximately 92% of our accrued environmental liability.
We have been identified as a potentially responsible party under the Comprehensive
Environmental Response Compensation and Liability Act (CERCLA or Superfund) at 107
sites. The number of Superfund sites, in and of itself, does not represent a relevant measure of
liability because the nature and extent of environmental concerns vary from site to site and our
share of responsibility varies from sole responsibility to very little responsibility. In estimating
our liability for remediation, we consider our likely proportionate share of the anticipated
remediation expense and the ability of other potentially responsible parties to fulfill their
obligations. Accrued environmental liabilities are not reduced by potential insurance
reimbursements.
At December 31, 2008, we had $553 million reserved for environmental remediation. Cash
outflows for environmental remediation were $46 million in both 2008 and 2007, and $79
million in 2006. We estimate that ongoing environmental remediation expenditures in each of
the next two years will not exceed $70 million.
Government Matters
As described in the “Critical Accounting Estimates – Contracting with the U.S. government,”
our contracts with the U.S. government are subject to audits. Such audits may recommend that
certain contract prices should be reduced to comply with various government regulations. We
are also the subject of one or more investigations and legal proceedings initiated by the U.S.
government with respect to government contract matters.
2008 Annual Report 59

As previously disclosed, the Department of Justice (DOJ) sued us in 1999 in the U.S. District
Court for the Southern District of Ohio, claiming that Pratt & Whitney violated the civil False
Claims Act and common law. This lawsuit relates to the “Fighter Engine Competition”
between Pratt & Whitney’s F100 engine and General Electric’s F110 engine. The DOJ alleges
that the government overpaid for F100 engines under contracts awarded by the U.S. Air Force
in fiscal years 1985 through 1990 because Pratt & Whitney inflated its estimated costs for some
purchased parts and withheld data that would have revealed the overstatements. At trial of this
matter, completed in December 2004, the government claimed Pratt & Whitney’s liability to be
$624 million. On August 1, 2008, the trial court judge held that the Air Force had not suffered
any actual damages because Pratt & Whitney had made significant price concessions. However,
the trial court judge found that Pratt & Whitney violated the False Claims Act due to
inaccurate statements contained in the 1983 offer. In the absence of actual damages, the trial
court judge awarded the DOJ the maximum civil penalty of $7.09 million, or $10,000 for each
of the 709 invoices Pratt & Whitney submitted in 1989 and later under the contracts. Both the
DOJ and UTC have appealed the decision. Should the government ultimately prevail, the
outcome of this matter could result in a material effect on our results of operations in the
period in which a liability would be recognized or cash flows for the period in which damages
would be paid.
In December 2008, the Department of Defense (DOD) issued a contract claim against Sikorsky
to recover overpayments the DOD alleges it has incurred since January 2003 in connection
with cost accounting changes approved by the DOD and implemented by Sikorsky in 1999 and
2006. These changes relate to the calculation of material overhead rates in government
contracts. The DOD claimed that Sikorsky’s liability is approximately $80 million (including
interest). We believe this claim is without merit and intend to appeal.
Except as otherwise noted above, we do not believe that resolution of any of these matters will
have a material adverse effect upon our competitive position, results of operations, cash flows
or financial condition.
Other Matters
Additional discussion of our environmental, U.S. government contract matters, product
performance and other contingent liabilities is included in “Critical Accounting Estimates” and
Notes 1, 13 and 15 to the Consolidated Financial Statements. For additional discussion of our
legal proceedings, see Item 3, “Legal Proceedings,” in our Annual Report on Form 10-K for
2008 (2008 Form 10-K).
New Accounting Pronouncements
In December 2007, the FASB issued SFAS 141(R), which replaces SFAS No. 141, “Business
Combinations” (SFAS 141). SFAS 141(R) retains the underlying concepts of SFAS 141 in that
all business combinations are still required to be accounted for at fair value under the
acquisition method of accounting but SFAS 141(R) changed the method of applying the
acquisition method in a number of significant aspects. Acquisition costs will generally be
expensed as incurred; noncontrolling interests will be valued at fair value at the acquisition
date; in-process research and development will be recorded at fair value as an indefinite-lived
intangible asset at the acquisition date, until either abandoned or completed, at which point
the useful lives will be determined; restructuring costs associated with a business combination
will generally be expensed subsequent to the acquisition date; and changes in deferred tax asset
valuation allowances and income tax uncertainties after the acquisition date generally will
affect income tax expense. SFAS 141(R) is effective on a prospective basis for all business
combinations for which the acquisition date is on or after the beginning of the first annual
period subsequent to December 15, 2008, with the exception of the accounting for valuation
allowances on deferred taxes and acquired tax contingencies. SFAS 141(R) amends SFAS
No. 109, “Accounting for Income Taxes” (SFAS 109) such that adjustments made to valuation
allowances on deferred taxes and acquired tax contingencies associated with acquisitions that
closed prior to the effective date of SFAS 141(R) would also apply the provisions of SFAS
141(R). Early adoption was not permitted. Upon adoption, SFAS 141(R) will not have a
significant impact on our financial position and results of operations; however, any business
combination entered into after the adoption may significantly impact our financial position
and results of operations when compared to acquisitions accounted for under existing U.S.
Generally Accepted Accounting Principles (GAAP) and result in more earnings volatility and
generally lower earnings due to the expensing of deal costs and restructuring costs of acquired
companies. Also, since we have significant acquired deferred tax assets for which full valuation
allowances were recorded at the acquisition date, SFAS 141(R) could significantly affect the
results of operations if changes in the valuation allowances occur subsequent to adoption. As
of December 31, 2008, such deferred tax valuation allowances amounted to $278 million. For
additional discussion on deferred tax valuation allowances, refer to Note 9 to the Consolidated
Financial Statements in the 2008 Form 10-K.
In December 2007, the FASB issued SFAS No. 160, “Noncontrolling Interests in Consolidated
Financial Statements—an amendment of ARB No. 51” (SFAS 160). This statement is effective
for fiscal years, and interim periods within those fiscal years, beginning on or after
December 15, 2008, with earlier adoption prohibited. This statement requires the recognition of
a noncontrolling interest (minority interest) as equity in the consolidated financial statements
and separate from the parent’s equity. The amount of net income attributable to the
60 United Technologies Corporation

noncontrolling interest will be included in consolidated net income on the face of the income
statement. It also amends certain of ARB No. 51’s consolidation procedures for consistency
with the requirements of SFAS 141(R). This statement also includes expanded disclosure
requirements regarding the interests of the parent and its noncontrolling interest. We have
evaluated this new statement and have determined that the statement will not have a significant
impact on the reporting of our financial position and results of operations.
In December 2007, the EITF issued Issue No. 07-1, “Accounting for Collaborative
Arrangements.” This Issue is effective for financial statements issued for fiscal years beginning
after December 15, 2008, and interim periods within those fiscal years, and shall be applied
retrospectively to all prior periods presented for all collaborative arrangements existing as of
the effective date. This Issue requires that transactions with third parties (i.e., revenue
generated and costs incurred by the partners) should be reported in the appropriate line item
in each company’s financial statement pursuant to the guidance in EITF Issue No. 99-19,
“Reporting Revenue Gross as a Principal versus Net as an Agent.” This Issue also includes
enhanced disclosure requirements regarding the nature and purpose of the arrangement, rights
and obligations under the arrangement, accounting policy, amount and income statement
classification of collaboration transactions between the parties. The collaborator share of
revenue was approximately $1.1 billion, $.9 billion and $.8 billion for 2008, 2007 and 2006,
respectively. Costs associated with engine programs under collaboration agreements are
expensed as incurred. Under this Issue, revenues would be increased by these amounts with an
offsetting increase to cost of sales in order to reflect the impact of the collaboration
arrangements on a gross basis.
In February 2008, the FASB issued FSP FAS 157-2, “Effective Date of FASB Statement No. 157,”
which delays the effective date of SFAS No. 157, “Fair Value Measurements,” (SFAS 157) for all
nonfinancial assets and nonfinancial liabilities, except those that are recognized or disclosed at
fair value in the financial statements on a recurring basis, with the exception of the application
of the statement to non-recurring nonfinancial assets and nonfinancial liabilities. This FSP
defers the effective date of SFAS 157 to fiscal years beginning after November 15, 2008 and
interim periods within those fiscal years for items within the scope of this FSP. Refer to Note 14
to the Consolidated Financial Statements for additional discussion on fair value measurements.
We have evaluated this new FSP and have determined that it will not have a significant impact
on the determination or reporting of our financial results.
In March 2008, the FASB issued SFAS No. 161, “Disclosures about Derivative Instruments and
Hedging Activities, an amendment of FASB Statement No. 133” (SFAS 161). This statement is
intended to improve transparency in financial reporting by requiring enhanced disclosures of
an entity’s derivative instruments and hedging activities and their effects on the entity’s
financial position, financial performance, and cash flows. SFAS 161 applies to all derivative
instruments within the scope of SFAS 133, “Accounting for Derivative Instruments and
Hedging Activities” (SFAS 133) as well as related hedged items, bifurcated derivatives, and
nonderivative instruments that are designated and qualify as hedging instruments. Entities
with instruments subject to SFAS 161 must provide more robust qualitative disclosures and
expanded quantitative disclosures. SFAS 161 is effective prospectively for financial statements
issued for fiscal years and interim periods beginning after November 15, 2008, with early
application permitted. We are currently evaluating the disclosure implications of this
statement; however, the new statement will not have an impact on the determination of our
financial results.
In April 2008, the FASB issued FSP No. FAS 142-3, “Determination of the Useful Life of
Intangible Assets.” This FSP amends the factors that should be considered in developing
renewal or extension assumptions used to determine the useful life of a recognized intangible
asset under SFAS No. 142, “Goodwill and Other Intangible Assets” (SFAS 142). The objective
of this FSP is to improve the consistency between the useful life of a recognized intangible asset
under SFAS 142 and the period of expected cash flows used to measure the fair value of the
asset under SFAS 141(R), and other principles of GAAP. This FSP applies to all intangible
assets, whether acquired in a business combination or otherwise, and shall be effective for
financial statements issued for fiscal years beginning after December 15, 2008, and interim
periods within those fiscal years and applied prospectively to intangible assets acquired after
the effective date. Early adoption is prohibited. We have evaluated this new FSP and have
determined that it will not have a significant impact on the determination or reporting of our
financial results.
In November 2008, the EITF issued Issue No. 08-6, “Equity Method Investment Accounting
Considerations.” This Issue is effective on a prospective basis in fiscal years beginning on or
after December 15, 2008, and interim periods within those fiscal years, consistent with the
effective dates of SFAS 141(R) and SFAS 160. Earlier application by an entity that has
previously adopted an alternative accounting policy is not permitted. This Issue addresses the
impact that SFAS 141(R) and SFAS 160 might have on the accounting for equity method
investments, including how the initial carrying value of an equity method investment should
be determined, how it should be tested for impairment, and how changes in classification from
equity method to cost method should be treated. We are currently evaluating this new Issue
and anticipate that it will not have a significant impact on the reporting of our results of
operations.
In December 2008, the FASB issued FSP FAS 132(R)-1, “Employers’ Disclosures about
Postretirement Benefit Plan Assets.” This FSP amends SFAS No. 132 (revised 2003),
“Employers’ Disclosures about Pensions and Other Postretirement Benefits,” to provide
guidance on an employer’s disclosures about plan assets of a defined benefit pension or other
2008 Annual Report 61

postretirement plan on investment policies and strategies, major categories of plan assets,
inputs and valuation techniques used to measure the fair value of plan assets and significant
concentrations of risk within plan assets. This FSP shall be effective for fiscal years ending after
December 15, 2009, with earlier application permitted. Upon initial application, the provisions
of this FSP are not required for earlier periods that are presented for comparative purposes.
We are currently evaluating the disclosure requirements of this new FSP.
Cautionary Note Concerning Factors That May Affect Future ResultsThis annual report contains statements which, to the extent they are not statements of
historical or present fact, constitute “forward-looking statements” under the securities laws.
From time to time, oral or written forward-looking statements may also be included in other
materials released to the public. These forward-looking statements are intended to provide
management’s current expectations or plans for our future operating and financial
performance, based on assumptions currently believed to be valid. Forward-looking statements
can be identified by the use of words such as “believe,” “expect,” “plans,” “strategy,”
“prospects,” “estimate,” “project,” “target,” “anticipate,” “guidance” and other words of
similar meaning in connection with a discussion of future operating or financial performance.
These include, among others, statements relating to:
• future revenues, earnings, cash flow, uses of cash and other measures of financial
performance;
• the effect of economic conditions in the United States and globally, including the financial
condition of our customers and suppliers;
• new business opportunities;
• restructuring costs and savings;
• the scope, nature or impact of acquisition activity and integration into our businesses;
• the development, production and support of advanced technologies and new products and
services;
• the anticipated benefits of diversification and balance of operations across product lines,
regions and industries;
• the impact of the negotiation of collective bargaining agreements;
• the outcome of contingencies;
• future repurchases of common stock;
• future levels of indebtedness and capital spending; and
• pension plan assumptions and future contributions.
All forward-looking statements involve risks and uncertainties that may cause actual results to
differ materially from those expressed or implied in the forward-looking statements. Our
Annual Report on Form 10-K for 2008 includes important information as to these factors that
may cause actual results to vary materially from those stated in the forward-looking statements
in the “Business” section under the headings “General,” “Description of Business by Segment”
and “Other Matters Relating to our Business as a Whole” and in the “Risk Factors” and “Legal
Proceedings” sections. For additional information identifying factors that may cause actual
results to vary materially from those stated in the forward-looking statements, see our reports
on Forms 10-K, 10-Q and 8-K filed with the Securities and Exchange Commission from time
to time.
Management’s Report on Internal Control over Financial Reporting
The management of UTC is responsible for establishing and maintaining adequate internal
control over financial reporting. Internal control over financial reporting is a process designed
to provide reasonable assurance regarding the reliability of financial reporting and the
preparation of financial statements for external reporting purposes in accordance with
accounting principles generally accepted in the United States of America. Because of its
inherent limitations, internal control over financial reporting may not prevent or detect
misstatements. Management has assessed the effectiveness of UTC’s internal control over
financial reporting as of December 31, 2008. In making its assessment, management has
utilized the criteria set forth by the Committee of Sponsoring Organizations of the Treadway
Commission in Internal Control – Integrated Framework. Management concluded that based
on its assessment, UTC’s internal control over financial reporting was effective as of
December 31, 2008. The effectiveness of UTC’s internal control over financial reporting, as of
December 31, 2008, has been audited by PricewaterhouseCoopers LLP, an independent
registered public accounting firm, as stated in their report which is included herein.
Louis R. ChênevertPresident and Chief Executive Officer
/s/ Gregory J. Hayes
Gregory J. HayesSenior Vice President and Chief Financial Officer
Margaret M. SmythVice President, Controller
62 United Technologies Corporation

Report of Independent Registered Public Accounting Firm
To the Board of Directors and Shareowners of United Technologies Corporation:
In our opinion, the accompanying consolidated balance sheets and the related consolidated
statements of operations, of cash flows and of changes in shareowners’ equity present fairly, in
all material respects, the financial position of United Technologies Corporation and its
subsidiaries at December 31, 2008 and December 31, 2007, and the results of their operations
and their cash flows for each of the three years in the period ended December 31, 2008 in
conformity with accounting principles generally accepted in the United States of America. Also
in our opinion, the Corporation maintained, in all material respects, effective internal control
over financial reporting as of December 31, 2008, based on criteria established in Internal
Control—Integrated Framework issued by the Committee of Sponsoring Organizations of the
Treadway Commission (COSO). The Corporation’s management is responsible for these
financial statements, for maintaining effective internal control over financial reporting and for
its assessment of the effectiveness of internal control over financial reporting included in
accompanying Management’s Report on Internal Control Over Financial Reporting. Our
responsibility is to express opinions on these financial statements and on the Corporation’s
internal control over financial reporting based on our integrated audits. We conducted our
audits in accordance with the standards of the Public Company Accounting Oversight Board
(United States). Those standards require that we plan and perform the audits to obtain
reasonable assurance about whether the financial statements are free of material misstatement
and whether effective internal control over financial reporting was maintained in all material
respects. Our audits of the financial statements included examining, on a test basis, evidence
supporting the amounts and disclosures in the financial statements, assessing the accounting
principles used and significant estimates made by management, and evaluating the overall
financial statement presentation. Our audit of internal control over financial reporting
included obtaining an understanding of internal control over financial reporting, assessing the
risk that a material weakness exists, and testing and evaluating the design and operating
effectiveness of internal control based on the assessed risk. Our audits also included
performing such other procedures as we considered necessary in the circumstances. We believe
that our audits provide a reasonable basis for our opinions.
As discussed in Note 1 to the consolidated financial statements, the Corporation changed the
manner in which it accounts for defined benefit pension and other postretirement plans in
2006 and 2007 and the manner in which it accounts for uncertain tax positions in 2007. As
discussed in Note 14 to the consolidated financial statements, the Corporation adopted FASB
Statement No. 157, Fair Value Measurements, as of January 1, 2008.
A corporation’s internal control over financial reporting is a process designed to provide
reasonable assurance regarding the reliability of financial reporting and the preparation of
financial statements for external purposes in accordance with generally accepted accounting
principles. A corporation’s internal control over financial reporting includes those policies and
procedures that (i) pertain to the maintenance of records that, in reasonable detail, accurately
and fairly reflect the transactions and dispositions of the assets of the corporation; (ii) provide
reasonable assurance that transactions are recorded as necessary to permit preparation of
financial statements in accordance with generally accepted accounting principles, and that
receipts and expenditures of the corporation are being made only in accordance with
authorizations of management and directors of the corporation; and (iii) provide reasonable
assurance regarding prevention or timely detection of unauthorized acquisition, use, or
disposition of the corporation’s assets that could have a material effect on the financial
statements.
Because of its inherent limitations, internal control over financial reporting may not prevent or
detect misstatements. Also, projections of any evaluation of effectiveness to future periods are
subject to the risk that controls may become inadequate because of changes in conditions, or
that the degree of compliance with the policies or procedures may deteriorate.
Hartford, Connecticut
February 11, 2009
2008 Annual Report 63

CONSOLIDATED STATEMENT OF OPERATIONS
(in millions of dollars, except per share amounts) 2008 2007 2006
RevenuesProduct sales $42,175 $39,240 $34,271
Service sales 15,868 14,679 12,847
Other income, net 638 840 711
58,681 54,759 47,829
Costs and ExpensesCost of products sold 31,774 29,927 26,089
Cost of services sold 10,787 9,995 8,651
Research and development 1,771 1,678 1,529
Selling, general and administrative 6,724 6,109 5,462
Operating profit 7,625 7,050 6,098
Interest 689 666 606
Income before income taxes and minority interests 6,936 6,384 5,492
Income taxes 1,883 1,836 1,494
Minority interests in subsidiaries’ earnings 364 324 266
Net Income $ 4,689 $ 4,224 $ 3,732
Earnings per Share of Common StockBasic $ 5.00 $ 4.38 $ 3.81
Diluted $ 4.90 $ 4.27 $ 3.71
See accompanying Notes to Consolidated Financial Statements
64 United Technologies Corporation

CONSOLIDATED BALANCE SHEET
(in millions of dollars, except per share amounts—shares in thousands) 2008 2007
AssetsCash and cash equivalents $ 4,327 $ 2,904Accounts receivable (net of allowance for doubtful accounts of $332 and $298) 9,112 8,844Inventories and contracts in progress 8,340 8,101Future income tax benefits 1,551 1,267Other current assets 769 955
Total Current Assets 24,099 22,071Customer financing assets 1,002 963Future income tax benefits 3,633 1,126Fixed assets 6,348 6,296Goodwill 15,363 16,120Intangible assets 3,443 3,757Other assets 2,581 4,242
Total Assets $ 56,469 $ 54,575
Liabilities and Shareowners’ EquityShort-term borrowings $ 1,023 $ 1,085Accounts payable 5,226 5,059Accrued liabilities 12,069 11,277Long-term debt currently due 1,116 48
Total Current Liabilities 19,434 17,469Long-term debt 9,337 8,015Future pension and postretirement benefit obligations 6,574 2,562Other long-term liabilities 4,198 4,262
Total Liabilities 39,543 32,308
Commitments and Contingent Liabilities (Notes 4 and 15)Minority interests in subsidiary companies 1,009 912Shareowners’ Equity:
Capital Stock:Preferred Stock, $1 par value; Authorized—250,000 shares; None issued or outstanding — —Common Stock, $1 par value; Authorized—4,000,000 shares; Issued 1,370,054 and 1,364,791 shares 11,179 10,572
Treasury Stock—426,113 and 381,244 common shares at cost (14,316) (11,338)Retained earnings 25,159 21,751Unearned ESOP shares (200) (214)Accumulated other non-shareowners’ changes in equity:
Foreign currency translation (612) 1,355Other (5,293) (771)
Total Accumulated Other Non-Shareowners’ Changes in Equity (5,905) 584
Total Shareowners’ Equity 15,917 21,355
Total Liabilities and Shareowners’ Equity $ 56,469 $ 54,575
See accompanying Notes to Consolidated Financial Statements
2008 Annual Report 65

CONSOLIDATED STATEMENT OF CASH FLOWS(in millions of dollars) 2008 2007 2006
Operating ActivitiesNet income $ 4,689 $ 4,224 $ 3,732Adjustments to reconcile net income to net cash flows provided by operating activities:
Depreciation and amortization 1,321 1,173 1,033Deferred income tax provision (benefit) 45 58 (214)Minority interests in subsidiaries’ earnings 364 324 266Stock compensation cost 211 198 180Change in:
Accounts receivable (491) (462) (35)Inventories and contracts in progress (562) (1,111) (789)Other current assets 35 44 25Accounts payable and accrued liabilities 788 1,561 990
Other, net (239) (679) (385)
Net Cash Provided by Operating Activities 6,161 5,330 4,803
Investing ActivitiesCapital expenditures (1,216) (1,153) (954)Increase in customer financing assets (285) (411) (314)Decrease in customer financing assets 138 272 382Investments in businesses (1,252) (2,037) (911)Dispositions of businesses 337 298 451Other, net (58) (151) 85
Net Cash Used in Investing Activities (2,336) (3,182) (1,261)
Financing ActivitiesIssuance of long-term debt 2,248 1,032 1,109Repayment of long-term debt (48) (330) (825)Increase (decrease) in short-term borrowings 91 191 (817)Common Stock issued under employee stock plans 163 415 346Dividends paid on Common Stock (1,210) (1,080) (951)Repurchase of Common Stock (3,160) (2,001) (2,068)Dividends to minority interests and other (322) (182) (136)
Net Cash Used in Financing Activities (2,238) (1,955) (3,342)
Effect of foreign exchange rate changes on Cash and cash equivalents (164) 165 99
Net increase in Cash and cash equivalents 1,423 358 299
Cash and cash equivalents, beginning of year 2,904 2,546 2,247
Cash and cash equivalents, end of year $ 4,327 $ 2,904 $ 2,546
Supplemental Disclosure of Cash Flow Information:Interest paid, net of amounts capitalized $ 659 $ 629 $ 575Income taxes paid, net of refunds $ 1,912 $ 1,818 $ 1,347
Non-cash investing and financing activities include:Contributions of UTC common stock of $250 during 2008 and $150 each in 2007 and 2006 to domestic defined benefit pension plans
See accompanying Notes to Consolidated Financial Statements
66 United Technologies Corporation

CONSOLIDATED STATEMENT OF CHANGES IN SHAREOWNERS’ EQUITY
(in millions of dollars, except per share amounts)Common
StockTreasury
StockRetainedEarnings
UnearnedESOP
Shares
Accumulated OtherNon-Shareowners’Changes in Equity
Non-Shareowners’Changes in Equity
for the Period
December 31, 2005 $ 8,793 $ (7,418) $16,051 $(241) $ (194) $ 4,027
Common Stock issued under employee plans (12.6 million shares), including tax benefit of $101 738 14 (34) 14Common Stock contributed to defined benefit pension plans (2.5 million shares) 91 59Common Stock repurchased (33.3 million shares) (2,068)Dividends on Common Stock ($1.02 per share) (951)Dividends on ESOP Common Stock ($1.02 per share) (44)Adjustments to initially apply SFAS No. 158, including tax benefit of $1,145 (1,831)Non-Shareowners’ Changes in Equity:
Net income 3,732 3,732Foreign currency translation adjustments 613 613Minimum pension liability adjustments, net of income taxes of $8 20 20Unrealized holding gain on marketable equity securities, net of income taxes of $4 6 6Unrealized cash flow hedging loss, including tax benefit of $28 (53) (53)
December 31, 2006 $ 9,622 $ (9,413) $18,754 $(227) $(1,439) $ 4,318
Effect of changing pension plan measurement date pursuant to SFAS No. 158, net of taxes of $193 (45) 470Adoption of FASB Interpretation No. 48 (19)
Opening balance at January 1, 2007, as adjusted $ 9,622 $ (9,413) $18,690 $(227) $ (969) $ 4,318Common Stock issued under employee plans (13.8 million shares), including tax benefit of $130 863 13 (36) 13Common Stock contributed to defined benefit pension plans (2.3 million shares) 87 63Common Stock repurchased (28.3 million shares) (2,001)Dividends on Common Stock ($1.17 per share) (1,080)Dividends on ESOP Common Stock ($1.17 per share) (47)Non-Shareowners’ Changes in Equity:
Net income 4,224 4,224Foreign currency translation adjustments 722 722Change in pension and post-retirement benefit plans, net of income taxes of $419 776 776Adjustment for sale of securities, including tax benefit of $50 (84) (84)Unrealized cash flow hedging gain, net of income taxes of $58 139 139
December 31, 2007 $10,572 $(11,338) $21,751 $(214) $ 584 $ 5,777
Common Stock issued under employee plans (5.7 million shares), including tax benefit of $32 525 14 (19) 14Common Stock contributed to defined benefit pension plans (5.0 million shares) 82 168Common Stock repurchased (50.4 million shares) (3,160)Dividends on Common Stock ($1.35 per share) (1,210)Dividends on ESOP Common Stock ($1.35 per share) (52)Non-Shareowners’ Changes in Equity:
Net income 4,689 4,689Foreign currency translation adjustments (1,967) (1,967)Change in pension and post-retirement benefit plans, including tax benefit of $2,512 (4,153) (4,153)Adjustment for sale of securities, including tax benefit of $41 (59) (59)Unrealized cash flow hedging loss, including tax benefit of $127 (310) (310)
December 31, 2008 $ 11,179 $ (14,316) $ 25,159 $ (200) $ (5,905) $(1,800)
See accompanying Notes to Consolidated Financial Statements
2008 Annual Report 67

Notes to Consolidated Financial Statements
Note 1. Summary of Accounting Principles
The preparation of financial statements requires management to make estimates and
assumptions that affect the reported amounts of assets, liabilities, revenues and expenses.
Actual results could differ from those estimates.
Consolidation. The Consolidated Financial Statements include the accounts of UTC and our
controlled subsidiaries. Intercompany transactions have been eliminated.
Cash and Cash Equivalents. Cash and cash equivalents includes cash on hand, demand
deposits and short-term cash investments that are highly liquid in nature and have original
maturities of three months or less.
On occasion, we are required to maintain cash deposits with certain banks in respect to
contractual obligations related to acquisitions or divestitures or other legal obligations. As of
December 31, 2008, the amount of restricted cash was approximately $310 million, of which
approximately $35 million is included in current assets and $275 million is included in long-
term assets. Restricted cash as of December 31, 2007 was not significant.
Accounts Receivable. Current and long-term accounts receivable include retainage of $154
million and $121 million in 2008 and 2007, respectively, and unbilled receivables of $852
million and $643 million in 2008 and 2007, respectively.
Retainage represents amounts that, pursuant to the applicable contract, are not due until
project completion and acceptance by the customer. Unbilled receivables represent revenues
that are not currently billable to the customer under the terms of the contract. These items are
expected to be collected in the normal course of business. Long-term accounts receivable are
included in other assets in the Consolidated Balance Sheet.
Marketable Equity Securities. Equity securities that have a readily determinable fair value and
that we do not intend to trade are classified as available for sale and carried at fair value.
Unrealized holding gains and losses are recorded as a separate component of shareowners’
equity, net of deferred income taxes.
Inventories and Contracts In Progress. Inventories and contracts in progress are stated at the
lower of cost or estimated realizable value and are primarily based on first-in, first-out (FIFO)
or average cost methods; however, certain subsidiaries use the last-in, first-out (LIFO) method.
If inventories that were valued using the LIFO method had been valued under the FIFO
method, they would have been higher by $176 million and $173 million at December 31, 2008
and 2007, respectively.
Costs accumulated against specific contracts or orders are at actual cost. Inventory in excess of
requirements for contracts and current or anticipated orders have been reserved as
appropriate. Manufacturing costs are allocated to current production and firm contracts.
Fixed Assets. Fixed assets are stated at cost. Depreciation is computed over the assets’ useful
lives using the straight-line method, except for aerospace assets acquired prior to January 1,
1999, which are depreciated using accelerated methods.
Goodwill and Other Intangible Assets. Goodwill represents costs in excess of fair values
assigned to the underlying net assets of acquired businesses. Goodwill and intangible assets
deemed to have indefinite lives are not amortized. Goodwill and indefinite-lived intangible
assets are subject to annual impairment testing using the guidance and criteria described in
Statement of Financial Accounting Standard (SFAS) No. 142, “Goodwill and Other Intangible
Assets.” This testing compares carrying values to fair values and, when appropriate, the
carrying value of these assets is reduced to fair value. During 2008, we were not required to
record any impairment on goodwill or indefinite-lived intangibles.
Intangible assets other than goodwill consist of service portfolios, patents and trademarks,
customer relationships and other intangible assets. Useful lives of finite lived intangible assets
are estimated based upon the nature of the intangible asset and the industry in which the
intangible asset is used. Estimated useful lives of service portfolios generally range from 5 to 30
years. Estimated useful lives of patents and finite-lived trademarks range from 3 to 40 years.
Estimated useful lives of customer relationships and other assets range from 2 to 32 years.
These intangible assets are amortized based on the pattern in which the economic benefits of
the intangible assets are consumed. If a pattern of economic benefit cannot be reliably
determined, a straight-line amortization method is used.
Other Long-Lived Assets. We evaluate the potential impairment of other long-lived assets when
appropriate. If the carrying value of assets exceeds the sum of the undiscounted expected
future cash flows, the carrying value of the asset is written down to fair value.
Income Taxes. In the ordinary course of business there is inherent uncertainty in quantifying
our income tax positions. We assess our income tax positions and record tax benefits for all
years subject to examination based upon management’s evaluation of the facts, circumstances,
and information available at the reporting date. For those tax positions where it is more-likely-
than-not that a tax benefit will be sustained, we have recorded the largest amount of tax benefit
with a greater than 50% likelihood of being realized upon ultimate settlement with a taxing
authority that has full knowledge of all relevant information. For those income tax positions
where it is not more-likely-than-not that a tax benefit will be sustained, no tax benefit has been
recognized in the financial statements. Where applicable, associated interest has also been
recognized.
68 United Technologies Corporation
We adopted the provisions of Financial Accounting Standards Board (FASB) Interpretation
No. 48, “Accounting for Uncertainty in Income Taxes,” (FIN 48) on January 1, 2007. As a
result of this adoption, we recognized a charge of approximately $19 million to the January 1,
2007 retained earnings balance. We recognize interest accrued related to unrecognized tax
benefits in interest expense. Penalties, if incurred, would be recognized as a component of
income tax expense.
Revenue Recognition. Sales under government and commercial fixed-price contracts and
government fixed-price-incentive contracts are recorded at the time deliveries are made or, in
some cases, on a percentage-of-completion basis. Sales under cost-reimbursement contracts
are recorded as work is performed.
Sales under elevator and escalator sales, installation and modernization contracts are
accounted for under the percentage-of-completion method.
Losses, if any, on contracts are provided for when anticipated. Loss provisions on original
equipment contracts are recognized to the extent that estimated inventoriable manufacturing,
engineering, product warranty and product performance guarantee costs exceed the projected
revenue from the products contemplated under the contractual arrangement. For new
commitments, we generally record loss provisions at the earlier of contract announcement or
contract signing. For existing commitments, anticipated losses on contracts are recognized in
the period in which losses become evident. Products contemplated under contractual
arrangement include products purchased under contract and, in the large commercial engine
business, future highly probable sales of replacement parts required by regulation that are
expected to be purchased subsequently for incorporation into the original equipment. Revenue
projections used in determining contract loss provisions are based upon estimates of the
quantity, pricing and timing of future product deliveries. Losses are recognized on shipment to
the extent that inventoriable manufacturing costs, estimated warranty costs and product
performance guarantee costs exceed revenue realized. Contract accounting requires estimates
of future costs over the performance period of the contract as well as estimates of award fees
and other sources of revenue. These estimates are subject to change and result in adjustments
to margins on contracts in progress. The extent of progress toward completion on our long-
term commercial aerospace equipment and helicopter contracts is measured using units of
delivery. In addition, we use the cost-to-cost method for development contracts in the
aerospace businesses and for elevator and escalator sales, installation and modernization
contracts in the commercial businesses. For long-term aftermarket contracts, revenue is
recognized over the contract period in proportion to the costs expected to be incurred in
performing services under the contract. We review our cost estimates on significant contracts
on a quarterly basis, and for others, no less frequently than annually or when circumstances
change and warrant a modification to a previous estimate. Adjustments to contract loss
provisions are recorded in earnings upon identification.
Service sales, representing aftermarket repair and maintenance activities, are recognized over
the contractual period or as services are performed. In the commercial businesses, revenue is
generally recognized on a straight line basis. In the aerospace businesses, revenue is generally
recognized in proportion to cost.
Revenues from engine programs under collaboration agreements are recorded as earned and
the collaborator share of revenue is recorded as a reduction of revenue at that time. The
collaborator share of revenues under Pratt & Whitney’s engine programs was approximately
$1.1 billion, $.9 billion and $.8 billion for 2008, 2007 and 2006, respectively. Costs associated
with engine programs under collaboration agreements are expensed as incurred. The
collaborator share of program costs is recorded as a reduction of the related expense item at
that time.
Research and Development. Research and development costs not specifically covered by
contracts and those related to the company sponsored share of research and development
activity in connection with cost-sharing arrangements are charged to expense as incurred.
Government research and development support, not associated with specific contracts, is
recorded as a reduction to research and development expense in the period earned.
Repayment, if any, is in the form of future royalties and is conditioned upon the achievement
of certain financial targets.
Research and development costs incurred under contracts with customers are expensed as
incurred and are reported as a component of cost of products sold. Revenue from such
contracts is recognized as product sales when earned.
Foreign Exchange and Hedging Activity. We conduct business in many different currencies
and, accordingly, are subject to the inherent risks associated with foreign exchange rate
movements. The financial position and results of operations of substantially all of our foreign
subsidiaries are measured using the local currency as the functional currency. Foreign currency
denominated assets and liabilities are translated into U.S. dollars at the exchange rates existing
at the respective balance sheet dates, and income and expense items are translated at the
average exchange rates during the respective periods. The aggregate effects of translating the
balance sheets of these subsidiaries are deferred as a separate component of Shareowners’
Equity.
2008 Annual Report 69

We have used derivative instruments, including swaps, forward contracts and options, to
manage certain foreign currency, interest rate and commodity price exposures. Derivative
instruments are viewed as risk management tools by us and are not used for trading or
speculative purposes. Derivatives used for hedging purposes may be designated and effective as
a hedge of the identified risk exposure at the inception of the contract.
All derivative instruments are recorded on the balance sheet at fair value. Derivatives used to
hedge foreign-currency-denominated balance sheet items are reported directly in earnings
along with offsetting transaction gains and losses on the items being hedged. Derivatives used
to hedge forecasted cash flows associated with foreign currency commitments or forecasted
commodity purchases may be accounted for as cash flow hedges, as deemed appropriate. Gains
and losses on derivatives designated as cash flow hedges are recorded in other comprehensive
income and reclassified to earnings in a manner that matches the timing of the earnings impact
of the hedged transactions. The ineffective portion of all hedges, if any, is recognized currently
in earnings.
Environmental. Environmental investigatory, remediation, operating and maintenance costs
are accrued when it is probable that a liability has been incurred and the amount can be
reasonably estimated. The most likely cost to be incurred is accrued based on an evaluation of
currently available facts with respect to each individual site, including existing technology,
current laws and regulations and prior remediation experience. Where no amount within a
range of estimates is more likely, the minimum is accrued. For sites with multiple responsible
parties, we consider our likely proportionate share of the anticipated remediation costs and the
ability of the other parties to fulfill their obligations in establishing a provision for those costs.
Liabilities with fixed or reliably determinable future cash payments are discounted. Accrued
environmental liabilities are not reduced by potential insurance reimbursements.
Asset Retirement Obligations. We record the fair value of legal obligations associated with the
retirement of tangible long-lived assets in the period in which it is determined to exist, if a
reasonable estimate of fair value can be made. Upon initial recognition of a liability, we
capitalize the cost of the asset retirement obligation by increasing the carrying amount of the
related long-lived asset. Over time, the liability is increased for changes in its present value and
the capitalized cost is depreciated over the useful life of the related asset. We have determined
that conditional legal obligations exist for certain of our worldwide owned and leased facilities
related primarily to building materials. As of December 31, 2008 and 2007, the outstanding
liability for asset retirement obligations was $163 million and $171 million, respectively.
Pension and Postretirement Obligations. In September 2006, the FASB issued SFAS No. 158,
“Employers’ Accounting for Defined Benefit Pension and Other Postretirement Plans—an
amendment of FASB Statement Nos. 87, 88, 106 and 132(R)” (SFAS 158). This statement
requires balance sheet recognition of the overfunded or underfunded status of pension and
postretirement benefit plans. Under SFAS 158, actuarial gains and losses, prior service costs or
credits, and any remaining transition assets or obligations that have not been recognized under
previous accounting standards must be recognized in Accumulated Other Non-Shareowners’
Changes in Equity, net of tax effects, until they are amortized as a component of net periodic
benefit cost. SFAS 158 was effective for publicly-held companies for fiscal years ending after
December 15, 2006, except for the measurement date provisions, which were effective for fiscal
years ending after December 15, 2008. Based on the funded status of our plans as of
December 31, 2006, the adoption of SFAS 158 decreased total assets by approximately $2.4
billion, decreased total liabilities by approximately $549 million and reduced total
shareowners’ equity by approximately $1.8 billion, net of taxes. SFAS 158 also requires the
measurement date (the date at which plan assets and the benefit obligation are measured) to be
the company’s fiscal year end. We early-adopted the measurement date provisions of SFAS 158
effective January 1, 2007. The majority of our pension and postretirement plans previously
used a November 30 measurement date. All plans are now measured as of December 31,
consistent with our company’s fiscal year end. The non-cash effect of the adoption of the
measurement date provisions of SFAS 158 increased shareowners’ equity by approximately
$425 million and decreased long-term liabilities by approximately $620 million in 2007. The
adoption of SFAS 158 did not affect our results of operations.
Note 2. Business Acquisitions, Goodwill and Intangible Assets
Business Acquisitions. Our investments in businesses in 2008, 2007 and 2006 totaled $1.4
billion, $2.3 billion and $1.0 billion, including debt assumed of $196 million, $300 million and
$138 million, respectively.
The 2008 investments consisted primarily of a number of small acquisitions in our commercial
businesses. The 2007 investments consisted principally of the acquisition of Initial Electronic
Security Group (IESG), a division of Rentokil Initial, plc, and Marioff Corporation, Oy
(Marioff) both now part of the UTC Fire & Security segment, and a number of small
acquisitions in both the commercial and aerospace businesses.
On July 2, 2007, we completed the acquisition of IESG with the exception of the French
operations, the acquisition of which was completed on December 27, 2007 after receiving
regulatory approval. The total purchase price was approximately $1.2 billion including
approximately $250 million of debt assumed. We recorded approximately $1.0 billion of
goodwill and approximately $300 million of identified intangible assets in connection with this
acquisition. The acquisition of IESG enhances UTC Fire & Security’s scale and capability in the
electronic security business in key markets where we have a significant presence. IESG sells
70 United Technologies Corporation

integrated security systems, intrusion detection, closed circuit television, access control and
security software. It is headquartered in the United Kingdom, with operations in the United
Kingdom, the Netherlands, the United States and France.
On August 30, 2007, we completed the acquisition of Marioff, a global provider of water mist
fire suppression systems for land and marine applications, for approximately $348 million. We
recorded approximately $250 million of goodwill and approximately $70 million of identified
intangibles in connection with this acquisition. The acquisition increases UTC Fire &
Security’s presence in environmentally friendly water-based suppression systems and will
expand the company’s product and service offerings.
The 2006 investments in businesses consisted principally of a number of smaller acquisitions
including Red Hawk Industries by UTC Fire & Security, Page Group Ltd. by Hamilton
Sundstrand and Longville Group Ltd. and Sensitech, Inc. by Carrier.
The assets and liabilities of the acquired businesses are accounted for under the purchase
method of accounting and recorded at their fair values at the dates of acquisition. The excess of
the purchase price over the estimated fair values of the net assets acquired was recorded as an
increase in goodwill of $825 million in 2008, $1.8 billion in 2007, and $646 million in 2006.
The results of operations of acquired businesses have been included in the Consolidated
Statement of Operations beginning as of the effective date of acquisition. The final purchase
price allocation for acquisitions is subject to the finalization of the valuation of certain assets
and liabilities, plans for consolidation of facilities and relocation of employees and other
integration activities. As a result, preliminary amounts assigned to assets and liabilities will be
subject to revision in future periods.
Goodwill. The changes in the carrying amount of goodwill, by segment, are as follows:
(in millions of dollars)
Balanceas of
January 1,2008
Goodwillresulting from
businesscombinations
Foreigncurrency
translationand other
Balanceas of
December 31,2008
Otis $ 1,341 $ 36 $ (184) $ 1,193Carrier 2,916 454 (100) 3,270UTC Fire & Security 5,922 277 (1,125) 5,074Pratt & Whitney 1,027 10 — 1,037Hamilton Sundstrand 4,579 16 (172) 4,423Sikorsky 235 19 (5) 249
Total Segments 16,020 812 (1,586) 15,246Eliminations & Other 100 13 4 117
Total $16,120 $825 $(1,582) $15,363
Intangible Assets. Identifiable intangible assets are comprised of the following:
2008 2007
(in millions of dollars)Gross
AmountAccumulatedAmortization
GrossAmount
AccumulatedAmortization
Amortized:
Service portfolios $1,625 $ (700) $1,559 $ (633)
Patents and trademarks 333 (103) 378 (97)
Other, principally customer
relationships 2,460 (825) 2,445 (654)
$4,418 $(1,628) $4,382 $(1,384)
Unamortized:
Trademarks and other $ 653 $ — $ 759 $ —
Amortization of intangible assets for the years ended December 31, 2008 and 2007 was $363
million and $325 million, respectively. Amortization of these intangible assets for 2009 through
2013 is expected to approximate $280 million per year.
Note 3. Earnings Per Share
(in millions, except per share amounts) 2008 2007 2006
Net income $4,689 $4,224 $ 3,732
Basic weighted average shares outstanding 937.8 963.9 980.0
Stock awards 18.6 24.9 25.7
Diluted weighted average shares outstanding 956.4 988.8 1,005.7
Earnings per share
Basic $ 5.00 $ 4.38 $ 3.81
Diluted 4.90 4.27 3.71
The computation of diluted earnings per share excludes the effect of the potential exercise of
stock awards, including stock appreciation rights (SARs) and stock options when the average
market price of the common stock is lower than the exercise price of the related SARs and
options during the period. These outstanding stock awards are not included in the
computation of diluted earnings per share because the effect would have been antidilutive. For
the year ended December 31, 2008, the number of stock awards excluded from the
computation was 8.9 million. There were no antidilutive stock awards outstanding for the
years ended December 31, 2007 and 2006.
2008 Annual Report 71
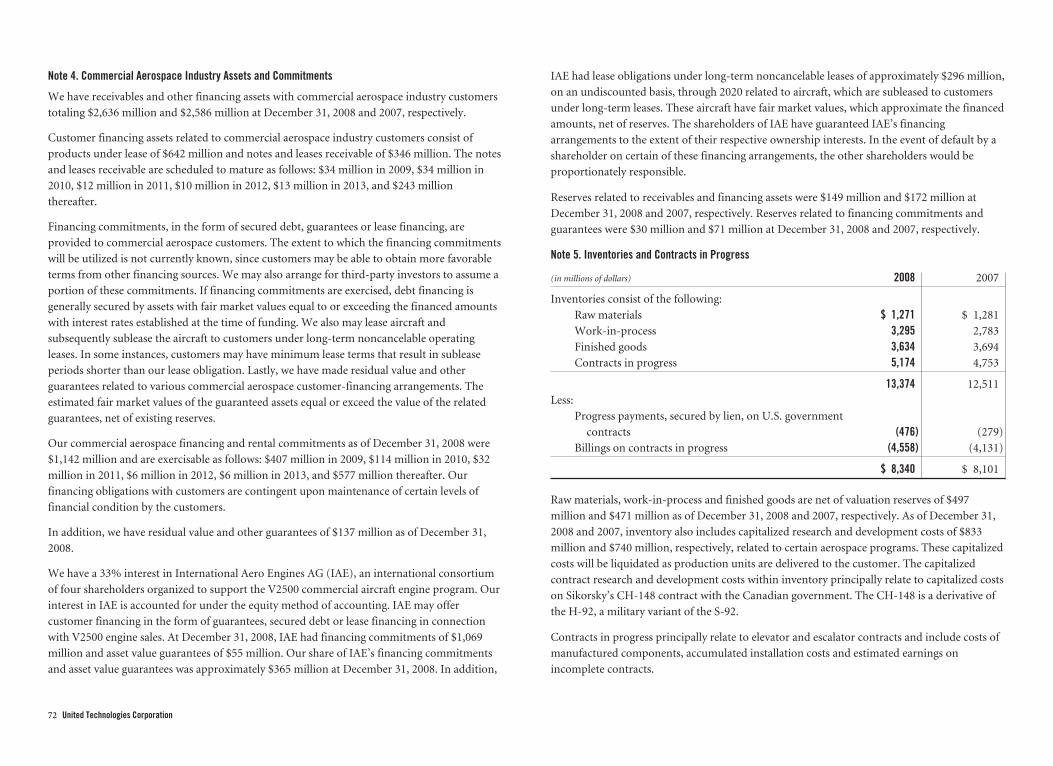
Note 4. Commercial Aerospace Industry Assets and Commitments
We have receivables and other financing assets with commercial aerospace industry customers
totaling $2,636 million and $2,586 million at December 31, 2008 and 2007, respectively.
Customer financing assets related to commercial aerospace industry customers consist of
products under lease of $642 million and notes and leases receivable of $346 million. The notes
and leases receivable are scheduled to mature as follows: $34 million in 2009, $34 million in
2010, $12 million in 2011, $10 million in 2012, $13 million in 2013, and $243 million
thereafter.
Financing commitments, in the form of secured debt, guarantees or lease financing, are
provided to commercial aerospace customers. The extent to which the financing commitments
will be utilized is not currently known, since customers may be able to obtain more favorable
terms from other financing sources. We may also arrange for third-party investors to assume a
portion of these commitments. If financing commitments are exercised, debt financing is
generally secured by assets with fair market values equal to or exceeding the financed amounts
with interest rates established at the time of funding. We also may lease aircraft and
subsequently sublease the aircraft to customers under long-term noncancelable operating
leases. In some instances, customers may have minimum lease terms that result in sublease
periods shorter than our lease obligation. Lastly, we have made residual value and other
guarantees related to various commercial aerospace customer-financing arrangements. The
estimated fair market values of the guaranteed assets equal or exceed the value of the related
guarantees, net of existing reserves.
Our commercial aerospace financing and rental commitments as of December 31, 2008 were
$1,142 million and are exercisable as follows: $407 million in 2009, $114 million in 2010, $32
million in 2011, $6 million in 2012, $6 million in 2013, and $577 million thereafter. Our
financing obligations with customers are contingent upon maintenance of certain levels of
financial condition by the customers.
In addition, we have residual value and other guarantees of $137 million as of December 31,
2008.
We have a 33% interest in International Aero Engines AG (IAE), an international consortium
of four shareholders organized to support the V2500 commercial aircraft engine program. Our
interest in IAE is accounted for under the equity method of accounting. IAE may offer
customer financing in the form of guarantees, secured debt or lease financing in connection
with V2500 engine sales. At December 31, 2008, IAE had financing commitments of $1,069
million and asset value guarantees of $55 million. Our share of IAE’s financing commitments
and asset value guarantees was approximately $365 million at December 31, 2008. In addition,
IAE had lease obligations under long-term noncancelable leases of approximately $296 million,
on an undiscounted basis, through 2020 related to aircraft, which are subleased to customers
under long-term leases. These aircraft have fair market values, which approximate the financed
amounts, net of reserves. The shareholders of IAE have guaranteed IAE’s financing
arrangements to the extent of their respective ownership interests. In the event of default by a
shareholder on certain of these financing arrangements, the other shareholders would be
proportionately responsible.
Reserves related to receivables and financing assets were $149 million and $172 million at
December 31, 2008 and 2007, respectively. Reserves related to financing commitments and
guarantees were $30 million and $71 million at December 31, 2008 and 2007, respectively.
Note 5. Inventories and Contracts in Progress
(in millions of dollars) 2008 2007
Inventories consist of the following:
Raw materials $ 1,271 $ 1,281
Work-in-process 3,295 2,783
Finished goods 3,634 3,694
Contracts in progress 5,174 4,753
13,374 12,511
Less:
Progress payments, secured by lien, on U.S. government
contracts (476) (279)
Billings on contracts in progress (4,558) (4,131)
$ 8,340 $ 8,101
Raw materials, work-in-process and finished goods are net of valuation reserves of $497
million and $471 million as of December 31, 2008 and 2007, respectively. As of December 31,
2008 and 2007, inventory also includes capitalized research and development costs of $833
million and $740 million, respectively, related to certain aerospace programs. These capitalized
costs will be liquidated as production units are delivered to the customer. The capitalized
contract research and development costs within inventory principally relate to capitalized costs
on Sikorsky’s CH-148 contract with the Canadian government. The CH-148 is a derivative of
the H-92, a military variant of the S-92.
Contracts in progress principally relate to elevator and escalator contracts and include costs of
manufactured components, accumulated installation costs and estimated earnings on
incomplete contracts.
72 United Technologies Corporation

Our sales contracts in many cases are long-term contracts expected to be performed over
periods exceeding twelve months. At December 31, 2008 and 2007, approximately 66% and
63%, respectively, of total inventories and contracts in progress have been acquired or
manufactured under such long-term contracts, a portion of which is not scheduled for delivery
within the next twelve months.
Note 6. Fixed Assets
(in millions of dollars)Estimated
Useful Lives 2008 2007
Land $ 334 $ 351
Buildings and improvements 20-40 years 4,681 4,561
Machinery, tools and equipment 3-20 years 9,486 9,394
Other, including under construction 605 571
15,106 14,877
Accumulated depreciation (8,758) (8,581)
$ 6,348 $ 6,296
Depreciation expense was $865 million in 2008, $770 million in 2007 and $724 million in 2006.
Note 7. Accrued Liabilities
(in millions of dollars) 2008 2007
Advances on sales contracts and service billings $ 5,248 $ 4,934
Accrued salaries, wages and employee benefits 1,877 1,858
Litigation and contract matters 436 538
Service and warranty 526 573
Income taxes payable 307 450
Interest payable 296 265
Accrued property, sales and use taxes 207 209
Accrued restructuring costs 213 88
Accrued workers compensation 177 168
Other 2,782 2,194
$12,069 $11,277
Note 8. Borrowings and Lines of Credit
Short-term borrowings consist of the following:
(in millions of dollars) 2008 2007
Domestic borrowings $ 1 $ 1
Foreign bank borrowings 872 1,084
Commercial paper 150 —
$1,023 $1,085
The weighted-average interest rates applicable to short-term borrowings outstanding at
December 31, 2008 and 2007 were 5.3% and 7.2%, respectively. At December 31, 2008,
approximately $2.0 billion was available under short-term lines of credit with local banks at
our various domestic and international subsidiaries.
At December 31, 2008, we had two committed credit agreements from banks permitting
aggregate borrowings of up to $2.5 billion. One credit commitment is a $1.5 billion revolving
credit agreement. As of December 31, 2008, there were no borrowings under this revolving
credit agreement, which expires in October 2011. We also have a $1.0 billion multicurrency
revolving credit agreement that is available for general funding purposes, including
acquisitions. As of December 31, 2008, approximately $460 million had been borrowed under
this revolving credit agreement. This agreement expires in November 2011. As of
December 31, 2008, the undrawn portions of both the $1.5 billion revolving credit agreement
and $1.0 billion multicurrency revolving credit agreement were available to serve as backup
facilities for the issuance of commercial paper. In December 2008, we increased our maximum
commercial paper borrowing authority from $1.5 billion to $2.5 billion. We generally use our
commercial paper borrowings for general corporate purposes, including the funding of
potential acquisitions and repurchases of our stock.
In December 2008, we issued $1.25 billion of long-term debt, the proceeds of which were used
primarily to repay commercial paper borrowings maturing between December 15, 2008 and
January 21, 2009. A portion of the net proceeds from the offering was also used to repay
approximately $180 million of the outstanding borrowings under our multicurrency revolving
credit facility. The remainder of the net proceeds will be used for general corporate purposes.
Pending use, we have invested the remaining available net proceeds in short-term interest
bearing obligations. The terms of the long-term debt issued in December 2008 were as follows:
Principal (in millions of dollars) Rate Maturity
$1,250 6.125% February 1, 2019
2008 Annual Report 73

We may redeem the notes, in whole or in part, at our option at any time at a redemption price
in U.S. dollars equal to the greater of 100% of the principal amount of the notes to be
redeemed or the sum of the present values of the remaining scheduled payments of principal
and interest on the notes to be redeemed, discounted to the redemption date on a semiannual
basis at the adjusted treasury rate plus 50 basis points. The redemption price will also include
interest accrued to the date of redemption on the principal balance of the notes being
redeemed.
In May 2008, we issued $1.0 billion of long-term debt, the proceeds of which were primarily
used for general corporate purposes, including financing acquisitions and repurchases of our
stock. The terms of the long-term debt issued in May 2008 were as follows:
Principal (in millions of dollars) Rate Maturity
$1,000 6.125% July 15, 2038
We may redeem the notes, in whole or in part, at our option at any time at a redemption price
in U.S. dollars equal to the greater of 100% of the principal amount of the notes to be
redeemed or the sum of the present values of the remaining scheduled payments of principal
and interest on the notes to be redeemed, discounted to the redemption date on a semiannual
basis at the adjusted treasury rate plus 25 basis points. The redemption price will also include
interest accrued to the date of redemption on the principal balance of the notes being
redeemed.
In December 2007, we issued $1.0 billion of long-term debt, the proceeds of which were
primarily used to repay commercial paper borrowings. The terms of the long-term debt issued
in December 2007 were as follows:
Principal (in millions of dollars) Rate Maturity
$1,000 5.375% December 15, 2017
We may redeem the notes, in whole or in part, at our option at any time at a redemption price
in U.S. dollars equal to the greater of 100% of the principal amount of the notes to be
redeemed or the sum of the present values of the remaining scheduled payments of principal
and interest on the notes to be redeemed, discounted to the redemption date on a semiannual
basis at the adjusted treasury rate plus 25 basis points. The redemption price will also include
interest accrued to the date of redemption on the principal balance of the notes being
redeemed.
In May 2006, we issued $1.1 billion of long-term debt, the proceeds of which were used to
repay commercial paper borrowings. The long-term debt issued in May 2006 is comprised of
two series of notes as follows:
Principal (in millions of dollars) Rate Maturity
$600 6.05% June 1, 2036
$500 LIBOR + .07% June 1, 2009
In February 2009, we redeemed all of the outstanding $500 million in notes due in 2009 at a
redemption price in U.S. dollars equal to 100% of the principal amount, plus interest accrued.
We may redeem the notes due in 2036, in whole or in part, at our option at any time, at a
redemption price in U.S. dollars equal to the greater of 100% of the principal amount of the
notes to be redeemed or the sum of the present values of the remaining scheduled payments of
principal and interest on the notes to be redeemed, discounted to the redemption date on a
semiannual basis at the adjusted treasury rate plus 15 basis points. The redemption price will
also include interest accrued to the date of redemption on the principal balance of the notes
being redeemed. The three month LIBOR rate as of December 31, 2008 and 2007 was
approximately 1.4%, and 4.7%, respectively.
In April 2005, we issued $2.4 billion of long-term debt, the proceeds of which were used
primarily to support the funding of the Kidde acquisition. The long-term debt is comprised of
three series of notes as follows:
Principal (in millions of dollars) Rate Maturity
$600 4.375% May 1, 2010
$1,200 4.875% May 1, 2015
$600 5.400% May 1, 2035
We may redeem the notes of any series, in whole or in part, at our option at any time, at a
redemption price in U.S. dollars equal to the greater of 100% of the principal amount of the
notes of the series to be redeemed or the sum of the present values of the remaining scheduled
payments of principal and interest on the notes of the series to be redeemed as described
below, discounted to the redemption date on a semiannual basis, at the adjusted treasury rate
described below plus 10 basis points for the 4.375% notes, 15 basis points for the 4.875% notes
and 15 basis points for the 5.400% notes. In each case, the redemption price will also include
interest accrued to the date of redemption on the principal balance of the notes being
redeemed.
74 United Technologies Corporation

Total long-term debt consists of the following:
(in millions of dollars)
Weighted-Average
Interest Rate Maturity 2008 2007
Notes and other debt
denominated in:
U.S. dollars 6.0% 2009-2038 $10,377 $7,942
Foreign currency 5.6% 2009-2027 43 56
ESOP debt 7.7% 2009 33 65
10,453 8,063
Less: Long-term debt currently due 1,116 48
$ 9,337 $8,015
Included within the U.S. dollar denominated debt reflected above are project financing
obligations in the amount of $193 million associated with the sale of rights to unbilled
revenues related to the ongoing activity of an entity recently acquired by Carrier. Principal
payments required on long-term debt for the next five years are: $1,116 million in 2009, $1,133
million in 2010, $539 million in 2011, $503 million in 2012, and $3 million in 2013. The
percentage of total debt at floating interest rates was 15% and 18% at December 31, 2008 and
2007, respectively.
In July 2007, we filed a universal shelf registration statement with the SEC for an indeterminate
amount of securities for future issuance, subject to our internal limitations on the amount of
debt to be issued under this shelf registration statement.
Note 9. Taxes on Income
(in millions of dollars) 2008 2007 2006
Current:
United States:
Federal $ 576 $ 490 $ 667
State 51 82 11
Foreign 1,211 1,206 1,030
1,838 1,778 1,708
Future:
United States:
Federal $ 142 $ 220 $ (82)
State (52) (60) 38
Foreign (45) (102) (170)
45 58 (214)
Income tax expense $1,883 $1,836 $1,494
Attributable to items credited (charged) to equity
and goodwill $2,818 $ (493) $1,287
Future income taxes represent the tax effects of transactions, which are reported in different
periods for tax and financial reporting purposes. These amounts consist of the tax effects of
temporary differences between the tax and financial reporting balance sheets and tax
carryforwards. Pursuant to SFAS 109, “Accounting for Income Taxes,” current and
non-current future income tax benefits and payables within the same tax jurisdiction are
generally offset for presentation in the Consolidated Balance Sheet.
2008 Annual Report 75

The tax effects of net temporary differences and tax carryforwards which gave rise to future
income tax benefits and payables at December 31, 2008 and 2007 are as follows:
(in millions of dollars) 2008 2007
Future income tax benefits:
Insurance and employee benefits $3,200 $ 755
Other asset basis differences (397) (332)
Other liability basis differences 1,271 1,266
Tax loss carryforwards 683 549
Tax credit carryforwards 1,125 700
Valuation allowance (698) (545)
$5,184 $2,393
Future income taxes payable:
Fixed assets $ 523 $ 630
Other items, net 290 192
$ 813 $ 822
Valuation allowances have been established primarily for tax credit, tax loss carryforwards, and
certain foreign temporary differences to reduce the future income tax benefits to expected
realizable amounts. Of the total valuation allowance amount of $698 million, $278 million was
established in purchase accounting, relating primarily to the purchase of Chubb. Upon the
January 1, 2009 adoption of SFAS 141(R), changes in deferred tax asset valuation allowances
and income tax uncertainties after the acquisition date generally will affect income tax expense
including those associated with acquisitions that closed prior to the effective date of
SFAS 141(R).
The sources of income from continuing operations before income taxes and minority
interests are:
(in millions of dollars) 2008 2007 2006
United States $2,899 $2,786 $2,410
Foreign 4,037 3,598 3,082
$6,936 $6,384 $5,492
U.S. income taxes have not been provided on undistributed earnings of international
subsidiaries. It is not practicable to estimate the amount of tax that might be payable. Our
intention is to reinvest these earnings permanently or to repatriate the earnings only when it is
tax effective to do so. Accordingly, we believe that U.S. tax on any earnings that might be
repatriated would be substantially offset by U.S. foreign tax credits.
Differences between effective income tax rates and the statutory U.S. federal income tax rates
are as follows:2008 2007 2006
Statutory U.S. federal income tax rate 35.0% 35.0% 35.0%
Tax on international activities (6.9)% (5.2)% (7.8)%
Tax audit settlements (0.8)% (0.6)% (0.6)%
Other (0.2)% (0.4)% 0.6%
Effective income tax rate 27.1% 28.8% 27.2%
The effective tax rates for 2008, 2007 and 2006 reflect the tax benefits associated with lower tax
rates on international earnings, which we intend to permanently reinvest outside the United
States. The 2008 effective tax rate reflects $62 million of tax expense reductions, principally
related to the resolution of disputes with the Appeals Division of the IRS for tax years 2000
through 2003.
The 2007 effective tax rate reflects approximately $80 million of tax expense reductions,
principally relating to re-evaluation of our liabilities and contingencies based upon global
examination activity including IRS completion of 2000 through 2003 examination fieldwork
and related protest filing, and development of claims for research and development tax credits.
Principal adverse tax impacts to the 2007 effective tax rate related to the EU Fine and enacted
tax law changes outside the United States.
In 2006, a residual disputed issue related to the 1999 disposition of a business segment was
settled with the Appeals Division of the IRS and was reviewed by the U.S. Congress Joint
Committee on Taxation. The settlement resulted in an approximately $35 million reduction in
tax expense.
In the normal course of business, various tax authorities examine us, including the IRS. The
IRS examination of tax years 2004 and 2005 is ongoing. Although the outcome of these matters
cannot be currently determined, we believe adequate provision has been made for any
potential unfavorable financial statement impact.
At December 31, 2008, tax credit carryforwards, principally state and federal, were $1,125
million, of which $541 million expire as follows: $23 million expire from 2009–2013, $403
million from 2014–2018, and $115 million from 2019–2028.
At December 31, 2008, tax loss carryforwards, principally state and foreign, were $2,726
million, of which $843 million expire as follows: $452 million from 2009-2013, $151 million
from 2014-2018, and $240 million from 2019-2028.
76 United Technologies Corporation

As disclosed in Note 1, we adopted the provisions of FIN 48 as of January 1, 2007. At
December 31, 2008, we had gross tax-effected unrecognized tax benefits of $773 million of
which $710 million, if recognized, would impact the effective tax rate. During the years ended
December 31, 2008, 2007, and 2006, we recorded interest expense related to unrecognized tax
benefits of approximately $39 million, $56 million, and $38 million, respectively. Total accrued
interest at December 31, 2008 and 2007 was approximately $161 million and $174 million,
respectively. A reconciliation of the beginning and ending amounts of unrecognized tax
benefits for the years ended December 31, 2008 and 2007 are as follows:
(in millions of dollars) 2008 2007
Balance at January 1 $ 798 $ 815Additions for tax positions related to the current year 112 78Additions for tax positions of prior years 66 93Reductions for tax positions of prior years (85) (48)Settlements (118) (140)
Balance at December 31 $ 773 $ 798
Included in the balances at December 31, 2008 and 2007, are $63 million of tax positions
whose tax characterization is highly certain but for which there is uncertainty about the timing
of tax return inclusion. Because of the impact of deferred tax accounting, other than interest
and penalties, the timing would not impact the annual effective tax rate but could accelerate
the payment of cash to the taxing authority to an earlier period.
We conduct business globally and, as a result, UTC or one or more of our subsidiaries file
income tax returns in the U.S. federal jurisdiction and various state and foreign jurisdictions.
In the normal course of business, we are subject to examination by taxing authorities
throughout the world, including such major jurisdictions as Australia, Canada, China, France,
Germany, Hong Kong, Italy, Japan, South Korea, Singapore, Spain, the United Kingdom and
the United States. With few exceptions, we are no longer subject to U.S. federal, state and local,
or non-U.S. income tax examinations for years before 1998.
It is reasonably possible that over the next twelve months the amount of unrecognized tax
benefits may change within a range of a net decrease of $175 million to a net increase of $50
million resulting from additional worldwide uncertain tax positions, from the re-evaluation of
current uncertain tax positions arising from developments in examinations, in appeals, or in
the courts, or from the closure of tax statutes. Not included in the range is $266 million of tax
benefits that we have claimed related to a 1998 German reorganization. These tax benefits are
currently being reviewed by the German Tax Office in the course of an audit of tax years 1999
to 2000. In 2008 the German Federal Tax Court denied benefits to another taxpayer in a case
involving a German tax law relevant to our reorganization. The determination of the German
Federal Tax Court on this other matter has been appealed to the European Court of Justice
(ECJ) to determine if the underlying German tax law is violative of European Union (EU)
principles. It is our position that it is more likely than not that the relevant German tax law is
violative of EU principles and we have not accrued tax expense for this matter. As
developments in the pending ECJ case warrant, it may become necessary for us to accrue for
this matter, and related interest.
Note 10. Employee Benefit Plans
We sponsor numerous domestic and foreign employee benefit plans, which are discussed
below.
As disclosed in Note 1, we adopted the recognition provisions of SFAS 158 in 2006. In
addition, we early-adopted the measurement date provisions of SFAS 158 effective January 1,
2007. Accordingly, we use a December 31 measurement date for our pension and
postretirement plans. Prior to 2007, we used a November 30 measurement date for a majority
of our pension and postretirement plans.
Employee Savings Plans. We sponsor various employee savings plans. Our contributions to
employer sponsored defined contribution plans were $212 million, $200 million and $205
million for 2008, 2007 and 2006, respectively.
Our non-union domestic employee savings plan uses an Employee Stock Ownership Plan
(ESOP) for employer contributions. External borrowings, guaranteed by us and reported as
debt in the Consolidated Balance Sheet, were used by the ESOP to fund a portion of its
purchase of ESOP Convertible Preferred Stock (ESOP Preferred Stock) from us. On
November 6, 2003, the Trustee and we effected the conversion of all 10.6 million outstanding
shares of ESOP Preferred Stock into 85 million shares of common stock. At the time of the
conversion, each share of ESOP Preferred Stock was convertible into four shares of common
stock, had a guaranteed minimum value of $65, a $4.80 annual dividend and was redeemable
by us at any time for $65 per share. Because of its guaranteed value, the ESOP Preferred Stock
was classified outside of Shareowners’ Equity. Beginning with the December 31, 2003 balance
sheet, common stock held by the ESOP and committed to employees is classified as permanent
equity because it no longer has a guaranteed value. Common stock held by the ESOP is
included in the average number of common shares outstanding for both basic and diluted
earnings per share.
Shares of common stock are allocated to employees’ ESOP accounts at fair value on the date
earned. Cash dividends on common stock held by the ESOP are used for debt service
payments. Participants receive additional shares in lieu of cash dividends. As ESOP debt service
payments are made, common stock is released from an unreleased shares account. ESOP debt
2008 Annual Report 77

may be prepaid or re-amortized to either increase or decrease the number of shares released so
that the value of released shares equals the value of plan benefit. We may also, at our option,
contribute additional common stock or cash to the ESOP. At December 31, 2008, 38.4 million
common shares had been allocated to employees, leaving 24.6 million unallocated common
shares in the ESOP Trust, with an approximate fair value of $1.3 billion.
Pension Plans. We sponsor both funded and unfunded domestic and foreign defined benefit
pension plans that cover the majority of our employees.
(in millions of dollars) 2008 2007
Change in Benefit Obligation:Beginning balance $ 21,914 $ 21,948Service cost 446 438Interest cost 1,263 1,182Actuarial loss (gain) 111 (565)Total benefits paid (1,121) (1,107)Net settlement and curtailment gain (21) (63)Acquisitions — 38Other (1,081) 43
Ending balance $ 21,511 $ 21,914
Change in Plan Assets:Beginning balance $ 22,650 $ 20,593Actual return on plan assets (5,095) 2,074Employer contributions 492 380Benefits paid from plan assets (1,095) (1,073)Other (1,012) 676
Ending balance $ 15,940 $ 22,650
Funded status:Fair value of plan assets $ 15,940 $ 22,650Benefit obligations (21,511) (21,914)
Funded status of plan $ (5,571) $ 736
Amounts Recognized in the Consolidated Balance SheetConsist of:
Noncurrent assets $ 59 $ 2,187Current liability (47) (57)Noncurrent liability (5,583) (1,394)
Net amount recognized $ (5,571) $ 736
Amounts Recognized in Accumulated Other ComprehensiveIncome Consist of:
Net actuarial loss $ 7,903 $ 1,247Prior service cost 298 348Transition obligation 9 13
Net amount recognized $ 8,210 $ 1,608
The amounts included in Other in the preceding table reflect the impact of the change in
measurement date in 2007, foreign exchange translation, primarily for plans in the United
Kingdom and Canada, and amendments to certain domestic plans.
Qualified domestic pension plan benefits comprise approximately 77% of the projected benefit
obligation. Benefits for union employees are generally based on a stated amount for each year
of service. For non-union employees, benefits are generally based on an employee’s years of
service and compensation near retirement. A cash balance formula was adopted in 2003 for
newly hired non-union employees and for other non-union employees who made a one-time
voluntary election to have future benefit accruals determined under this formula. Certain
foreign plans, which comprise approximately 21% of the projected benefit obligation, are
considered defined benefit plans for accounting purposes. Nonqualified domestic pension
plans provide supplementary retirement benefits to certain employees and are not a material
component of the projected benefit obligation.
We contributed $250 million and $150 million of common stock to our domestic defined
benefit pension plans during 2008 and 2007, respectively.
Information for pension plans with accumulated benefit obligation in excess of plan assets:
(in millions of dollars) 2008 2007
Projected benefit obligation $18,910 $2,412
Accumulated benefit obligation 17,224 1,958
Fair value of plan assets 13,391 1,458
The accumulated benefit obligation for all defined benefit pension plans was $19.6 billion at
both December 31, 2008 and 2007.
The components of the net periodic pension cost are as follows:
(in millions of dollars) 2008 2007 2006
Pension Benefits:Service cost $ 446 $ 438 $ 432
Interest cost 1,263 1,182 1,128
Expected return on plan assets (1,663) (1,546) (1,413)
Amortization of prior service costs 49 37 36
Amortization of unrecognized net
transition obligation 1 1 1
Recognized actuarial net loss 119 253 325
Net settlement and curtailment loss (gain) 1 (1) 10
Net periodic pension cost—employer $ 216 $ 364 $ 519
78 United Technologies Corporation

Other changes in plan assets and benefit obligations recognized in other comprehensive
income in 2008 are as follows:
(in millions of dollars)
Current year actuarial loss $6,869Amortization of actuarial loss (119)Current year prior service cost 13Amortization of prior service costs (49)Amortization of transition obligation (1)Other (111)
Total recognized in other comprehensive income 6,602
Net recognized in net periodic pension cost and other comprehensive income $6,818
The estimated amount that will be amortized from accumulated other comprehensive income
into net periodic pension cost in 2009 is as follows:
(in millions of dollars)
Net actuarial loss $220Prior service cost 53Transition obligation 1
$274
Contributions to multiemployer plans were $163 million, $145 million and $132 million for
2008, 2007 and 2006, respectively.
Major assumptions used in determining the benefit obligation and net cost for pension plans
are presented in the following table as weighted-averages:
Benefit Obligation Net Cost
2008 2007 2008 2007 2006
Discount rate 6.1% 6.0% 6.0% 5.4% 5.5%
Salary scale 4.4% 4.3% 4.4% 4.0% 4.0%
Expected return on plan assets — — 8.3% 8.3% 8.3%
In determining the expected return on plan assets, we consider the relative weighting of plan
assets, the historical performance of total plan assets and individual asset classes and economic
and other indicators of future performance. In addition, we may consult with and consider the
opinions of financial and other professionals in developing appropriate return benchmarks.
The 2007 net cost assumptions reflect the early adoption of the measurement change
provisions of SFAS 158, as discussed in Note 1.
Asset management objectives include maintaining an adequate level of diversification to
reduce interest rate and market risk and to provide adequate liquidity to meet immediate and
future benefit payment requirements.
The allocation of pension plan assets is as follows:
Target Allocation Percentage of Plan Assets
Asset Category 2009 2008 2007
Equity securities 48% – 68% 49% 58%
Debt securities 18% – 30% 34% 27%
Real estate 4% – 8% 6% 6%
Other 7% – 20% 11% 9%
100% 100%
Our common stock represents approximately 4% and 2% of total plan assets at December 31,
2008 and 2007, respectively. We review our assets at least quarterly to ensure we are within the
targeted asset allocation ranges and, if necessary, asset balances are adjusted back within target
allocations.
Estimated Future Contributions and Benefit Payments
We expect to make contributions of approximately $600 million to our pension plans in 2009,
including approximately $400 million to our domestic plans. Contributions do not reflect
benefits to be paid directly from corporate assets.
Benefit payments, including amounts to be paid from corporate assets, and reflecting expected
future service, as appropriate, are expected to be paid as follows: $1,174 million in 2009, $1,257
million in 2010, $1,257 million in 2011, $1,302 million in 2012, $1,341 million in 2013, and
$7,461 million from 2014 through 2018.
2008 Annual Report 79

Postretirement Benefit Plans. We sponsor a number of postretirement benefit plans that
provide health and life benefits to eligible retirees. Such benefits are provided primarily from
domestic plans, which comprise approximately 90% of the benefit obligation. The
postretirement plans are primarily unfunded. The allocation of assets in funded plans is
approximately 37% equity and 63% fixed income.
(in millions of dollars) 2008 2007
Change in Benefit Obligation:Beginning balance $ 971 $1,074
Service cost 3 5
Interest cost 53 56
Actuarial gain (54) (31)
Total benefits paid (90) (84)
Other (12) (49)
Ending balance $ 871 $ 971
Change in Plan Assets:Beginning balance $ 27 $ 65
Employer contributions 83 76
Benefits paid from plan assets (90) (84)
Other (4) (30)
Ending balance $ 16 $ 27
Funded Status:Fair value of plan assets $ 16 $ 27
Benefit obligations (871) (971)
Funded status of plan $(855) $ (944)
Amounts Recognized in the Consolidated Balance Sheet Consist of:Current liability $ (88) $ (70)
Noncurrent liability (767) (874)
$(855) $ (944)
Amounts Recognized in Accumulated Other ComprehensiveIncome Consist of:
Net actuarial gain $(123) $ (76)
Prior service cost (4) (10)
$(127) $ (86)
The components of net periodic benefit cost are as follows:
(in millions of dollars) 2008 2007 2006
Other Postretirement Benefits:
Service cost $ 3 $ 5 $ 8
Interest cost 53 56 57
Expected return on plan assets (2) (3) (4)
Amortization of prior service cost (6) (8) (26)
Net settlement and curtailment gain — — (1)
Net periodic other postretirement benefit cost $ 48 $ 50 $ 34
Other changes in plan assets and benefit obligations recognized in other comprehensive
income in 2008 are as follows:
(in millions of dollars)
Current year actuarial gain $(47)Amortization of prior service credit 6
Total recognized in other comprehensive income (41)
Net recognized in net periodic benefit cost and other comprehensive income $ 7
The estimated amounts that will be amortized from accumulated other comprehensive income
into net periodic benefit cost in 2009 include net actuarial gains of $3 million and prior service
credits of $2 million.
Major assumptions used in determining the benefit obligation and net cost for postretirement
plans are presented in the following table as weighted-averages:
Benefit Obligation Net Cost
2008 2007 2008 2007 2006
Discount rate 6.0% 5.9% 5.9% 5.5% 5.5%
Expected return on plan assets — — 7.8% 7.3% 6.0%
The 2007 net cost assumptions reflect the early adoption of the measurement change
provisions of SFAS 158, as discussed in Note 1.
80 United Technologies Corporation

Assumed health care cost trend rates are as follows:
2008 2007
Health care cost trend rate assumed for next year 8.5% 9.0%
Rate that the cost trend rate gradually declines to 5.0% 5.0%
Year that the rate reaches the rate it is assumed to remain at 2016 2016
Assumed health care cost trend rates have a significant effect on the amounts reported for the
health care plans. A one-percentage-point change in assumed health care cost trend rates
would have the following effects:
2008One-Percentage-Point
(in millions of dollars) Increase Decrease
Effect on total service and interest cost $ 3 $ (2)Effect on postretirement benefit obligation $43 $(38)
Estimated Future Benefit Payments
Benefit payments, including net amounts to be paid from corporate assets, and reflecting
expected future service, as appropriate, are expected to be paid as follows: $90 million in 2009,
$88 million in 2010, $86 million in 2011, $83 million in 2012, $80 million in 2013, and $336
million from 2014 through 2018.
Stock-based Compensation. We have long-term incentive plans authorizing various types of
market and performance-based incentive awards that may be granted to officers and
employees. Prior to April 13, 2005, our long-term incentive plan provided for the annual grant
of awards in an amount not to exceed 2% of the aggregate number of shares of outstanding
common stock, treasury shares and potential common stock (as determined by us in the
calculation of earnings per share on a diluted basis) for the preceding year. On April 9, 2008,
the shareowners approved an amendment to the 2005 Long Term Incentive Plan (LTIP) which
authorized the delivery of up to an additional 33 million shares of common stock pursuant to
awards under the LTIP. The amendment increased the maximum number of shares of
common stock that may be awarded under the LTIP to 71 million shares. As of December 31,
2008, approximately 43 million shares remain available for awards under the LTIP. The LTIP
does not contain an annual award limit. We expect that the shares awarded on an annual basis
will range from 1% to 1.5% of shares outstanding. The LTIP will expire after all shares have
been awarded or April 30, 2014, whichever is sooner. Following initial approval of the LTIP on
April 13, 2005, we may not grant any new awards under previously existing equity
compensation plans. Under all long-term incentive plans, the exercise price of awards is set on
the grant date and may not be less than the fair market value per share on that date. Generally,
awards have a term of ten years and a minimum three-year vesting schedule. In the event of
retirement, awards held for more than one year shall immediately become vested and
exercisable. In addition, under the LTIP, awards with performance-based vesting will also
generally be subject to a three-year performance measurement period. In the event of
retirement before completion of the three-year performance measurement period, awards may
remain eligible to vest. We have historically repurchased shares in an amount at least equal to
the number of shares issued under our equity compensation arrangements and expect to
continue this policy.
We measure the cost of all share-based payments, including stock options, at fair value on the
grant date and recognize this cost in the statement of operations. For the years ended
December 31, 2008, 2007 and 2006, $211 million, $198 million and $180 million, respectively,
of compensation cost was recognized in operating results. The associated future income tax
benefit recognized was $72 million, $67 million and $58 million for the years ended
December 31, 2008, 2007 and 2006, respectively.
For the years ended December 31, 2008, 2007 and 2006, the amount of cash received from the
exercise of stock options was $163 million, $415 million and $346 million, respectively, with an
associated tax benefit realized of $49 million, $174 million and $137 million, respectively. Also,
in accordance with SFAS No. 123(R), for the years ended December 31, 2008, 2007 and 2006,
$32 million, $130 million and $101 million, respectively, of certain tax benefits have been
reported as operating cash outflows with corresponding cash inflows from financing activities.
At December 31, 2008, there was $151 million of total unrecognized compensation cost related
to non-vested equity awards granted under long-term incentive plans. This cost is expected to
be recognized ratably over a weighted-average period of 1.5 years.
2008 Annual Report 81

A summary of the transactions under all long-term incentive plans for the three years ended December 31, 2008 follows:
Stock Options Stock Appreciation Rights Performance Share Units OtherIncentive
Shares /Units(shares and units in thousands) Shares
AveragePrice* Shares
AveragePrice* Units
AveragePrice**
Outstanding at:
December 31, 2005 85,786 $36.37 — — — — 586
Granted 220 56.46 7,110 $56.78 1,185 $56.53 234
Exercised/earned (13,069) 28.47 — — — — (234)
Cancelled (961) 47.76 (250) 56.78 (44) 56.53 (37)
December 31, 2006 71,976 $37.71 6,860 $56.78 1,141 $56.53 549
Granted 275 64.49 7,578 65.33 1,085 62.81 125
Exercised/earned (14,458) 31.39 (61) 45.16 — — (85)
Cancelled (782) 39.35 (491) 60.22 (69) 59.63 (2)
December 31, 2007 57,011 $39.42 13,886 $61.37 2,157 $59.59 587
Granted 192 74.57 7,221 74.23 948 75.21 174Exercised/earned (6,095) 32.65 (14) 47.34 — — (144)Cancelled (110) 44.75 (798) 66.57 (111) 64.59 (55)
December 31, 2008 50,998 $ 40.35 20,295 $ 65.75 2,994 $ 64.35 562
* weighted-average exercise price** weighted-average grant stock price
The weighted-average grant date fair value of stock options and stock appreciation rights
granted during 2008, 2007 and 2006 was $21.16, $19.10 and $15.84, respectively. The
weighted-average grant date fair value of performance share units, which vest upon achieving
certain performance metrics, granted during 2008, 2007, and 2006 was $84.01, $71.28
and $63.96, respectively. The total fair value of options vested during the years ended
December 31, 2008, 2007 and 2006 was $144 million, $216 million and $121 million,
respectively. The total intrinsic value (which is the amount by which the stock price exceeded
the exercise price of the options on the date of exercise) of options exercised during the years
ended December 31, 2008, 2007 and 2006 was $173 million, $575 million and $443 million,
respectively.
The following table summarizes information about equity awards outstanding that are expected to vest and equity awards outstanding that are exercisable at December 31, 2008:
Equity Awards Outstanding Expected to Vest Equity Awards Outstanding That Are Exercisable
(shares thousands, aggregate intrinsic value in millions) AwardsAverage
Price*
AggregateIntrinsic
ValueRemaining
Term** AwardsAverage
Price*
AggregateIntrinsic
ValueRemaining
Term**
Stock Options/Stock Appreciation Rights 70,879 $47.24 $451 5.1 51,160 $40.24 $683 3.9
Performance Share Units/Restricted Stock 3,166 — $170 1.0
* weighted-average exercise price per share** weighted-average contractual remaining term in years
82 United Technologies Corporation

The fair value of each option award is estimated on the date of grant using a binomial lattice
model. The following table indicates the assumptions used in estimating fair value for the years
ended December 31, 2008, 2007 and 2006. Because lattice-based option models incorporate
ranges of assumptions for inputs, those ranges are as follows:
2008 2007 2006
Expected volatility 23% – 26% 22% – 23% 21%Weighted-average volatility 23% 22% 21%Expected term (in years) 7.9 – 8.7 7.8 – 8.2 7.6 – 7.9Expected dividends 1.6% 1.6% 1.7%Risk-free rate 2.9% – 4.0% 4.6% – 5.0% 4.0% – 4.4%
Expected volatilities are based on the returns of our stock, including implied volatilities from
traded options on our stock for the binomial lattice model. We use historical data to estimate
equity award exercise and employee termination behavior within the valuation model.
Separate employee groups and equity award characteristics are considered separately for
valuation purposes. The expected term represents an estimate of the period of time equity
awards are expected to remain outstanding. The risk-free rate is based on the term structure of
interest rates at the time of equity award grant.
Note 11. Restructuring
During 2008, we recorded net pre-tax restructuring and related charges totaling $357 million
for new and ongoing restructuring actions. We recorded charges in the segments as follows:
Otis $21 million, Carrier $140 million, UTC Fire & Security $63 million, Pratt & Whitney $116
million, Hamilton Sundstrand $16 million and Eliminations & Other $1 million. The charges
include $148 million in cost of sales, $205 million in selling, general and administrative
expenses and $4 million in other income. As described below, these charges relate principally
to actions initiated during 2008 and, to a lesser extent, to certain actions initiated in 2007 and
2006.
2008 Actions. During 2008, we initiated restructuring actions relating to ongoing cost
reduction efforts, including selling, general and administrative reductions, principally at
Carrier, Pratt & Whitney, and UTC Fire & Security, and the consolidation of manufacturing
facilities. We recorded net pre-tax restructuring and related charges totaling $327 million,
including $119 million in cost of sales, $204 million in selling, general and administrative
expenses, and $4 million in other income.
At December 31, 2008, net workforce reductions of approximately 3,900 employees of an
expected 6,300 employees have been completed. The majority of the remaining workforce
reductions and all facility-related cost reduction actions, expected to total 1.2 million net
square feet of facilities, are targeted for completion during 2009 and 2010.
The following table summarizes the accrual balances and utilization by cost type for the 2008
restructuring actions:
(in millions of dollars) SeveranceAsset
Write-Downs
Facility Exitand Lease
TerminationCosts Total
Net pre-tax restructuring charges $ 277 $ 24 $ 26 $ 327
Utilization (125) (24) (19) (168)
Balance at December 31, 2008 $ 152 $— $ 7 $ 159
The following table summarizes expected, incurred and remaining costs for the 2008
restructuring actions by type:
(in millions of dollars) SeveranceAsset
Write-Downs
Facility Exitand Lease
TerminationCosts Total
Expected costs $ 303 $ 24 $ 60 $ 387
Costs incurred during 2008 (277) (24) (26) (327)
Remaining costs at December 31, 2008 $ 26 $— $ 34 $ 60
The following table summarizes expected, incurred and remaining costs for the 2008
restructuring actions by segment:
(in millions of dollars)Expected
CostsCosts Incurred
During 2008
RemainingCosts at
December 31,2008
Otis $ 29 $ (21) $ 8Carrier 164 (141) 23UTC Fire & Security 66 (58) 8Pratt & Whitney 114 (93) 21Hamilton Sundstrand 13 (13) —Eliminations & Other 1 (1) —
Total $387 $(327) $ 60
2007 Actions. During 2008, we recorded net pre-tax restructuring and related charges totaling
$10 million, including $9 million in cost of sales and $1 million in selling, general and
administrative expenses. The 2007 actions relate to ongoing cost reduction efforts including
workforce reductions, and the consolidation of manufacturing facilities.
2008 Annual Report 83

As of December 31, 2008, net workforce reductions of approximately 1,700 employees of an
expected 1,800 employees have been completed, and 200,000 net square feet of facilities of an
expected 500,000 net square feet have been exited. The remaining workforce and facility
reduction actions are targeted for completion during 2009.
The following table summarizes the restructuring accrual balances and utilization by cost type
for the 2007 programs:
(in millions of dollars) SeveranceAsset
Write-Downs
Facility Exitand Lease
TerminationCosts Total
Restructuring accruals at January 1, 2008 $ 31 $— $ 7 $ 38
Net pre-tax restructuring charges 1 2 7 10
Utilization (28) (2) (9) (39)
Balance at December 31, 2008 $ 4 $— $ 5 $ 9
The following table summarizes expected, incurred and remaining costs for the 2007 programs
by type:
(in millions of dollars) SeveranceAsset
Write-Downs
Facility Exitand Lease
TerminationCosts Total
Expected costs $ 68 $ 23 $ 33 $ 124
Costs incurred during 2007 (67) (21) (21) (109)
Costs incurred during 2008 (1) (2) (7) (10)
Remaining costs at December 31, 2008 $— $— $ 5 $ 5
The following table summarizes expected, incurred and remaining costs for the 2007 programs
by segment:
(in millions of dollars)Expected
Costs
CostsIncurred
During2007
CostsIncurred
During2008
RemainingCosts at
December 31,2008
Otis $ 20 $ (20) $— $—Carrier 33 (33) — —UTC Fire & Security 32 (27) (5) —Pratt & Whitney 27 (25) (2) —Hamilton Sundstrand 12 (4) (3) 5
Total $124 $(109) $ (10) $ 5
2006 Actions. During 2008, we recorded net pre-tax restructuring and related charges in the
business segments totaling $20 million in cost of sales for the restructuring actions initiated in
2006. These actions relate to ongoing cost reduction efforts, including selling, general and
administrative reductions, workforce reductions and the consolidation of manufacturing
facilities. As of December 31, 2008, we have completed all net workforce reductions of
approximately 3,700 employees and exited approximately 800,000 net square feet of facilities.
As of December 31, 2008 there were no remaining costs on these actions.
Note 12. Financial Instruments
We operate internationally and, in the normal course of business, are exposed to fluctuations
in interest rates, foreign exchange rates and commodity prices. These fluctuations can increase
the costs of financing, investing and operating the business. We manage our foreign currency
transaction risks and some commodity exposures to acceptable limits through the use of
derivatives designated as hedges as deemed appropriate.
By nature, all financial instruments involve market and credit risks. We enter into derivative
and other financial instruments with major investment grade financial institutions and have
policies to monitor the credit risk of those counterparties. We limit counterparty exposure and
concentration of risk by diversifying counterparties. We do not anticipate non-performance by
any of these counterparties.
The non-shareowner changes in equity associated with hedging activity for the 12 months
ended December 31, 2008 and 2007 were as follows:
(in millions of dollars) 2008 2007
Balance at January 1 $ 139 $ 4
Cash flow hedging (loss) gain, net (149) 164
Net gain reclassified to sales or cost of products sold (161) (29)
Balance at December 31 $(171) $139
Assuming current market conditions continue, of the amount recorded in Shareowners’
Equity, a $202 million pre-tax loss is expected to be reclassified into sales or cost of products
sold to reflect the fixed prices obtained from hedging within the next 12 months. Gains and
losses recognized in earnings related to the discontinuance or the ineffectiveness of cash flow
and fair value hedges were immaterial for the years ended December 31, 2008 and 2007. At
December 31, 2008, all derivative contracts accounted for as cash flow hedges mature by
December 2010.
84 United Technologies Corporation
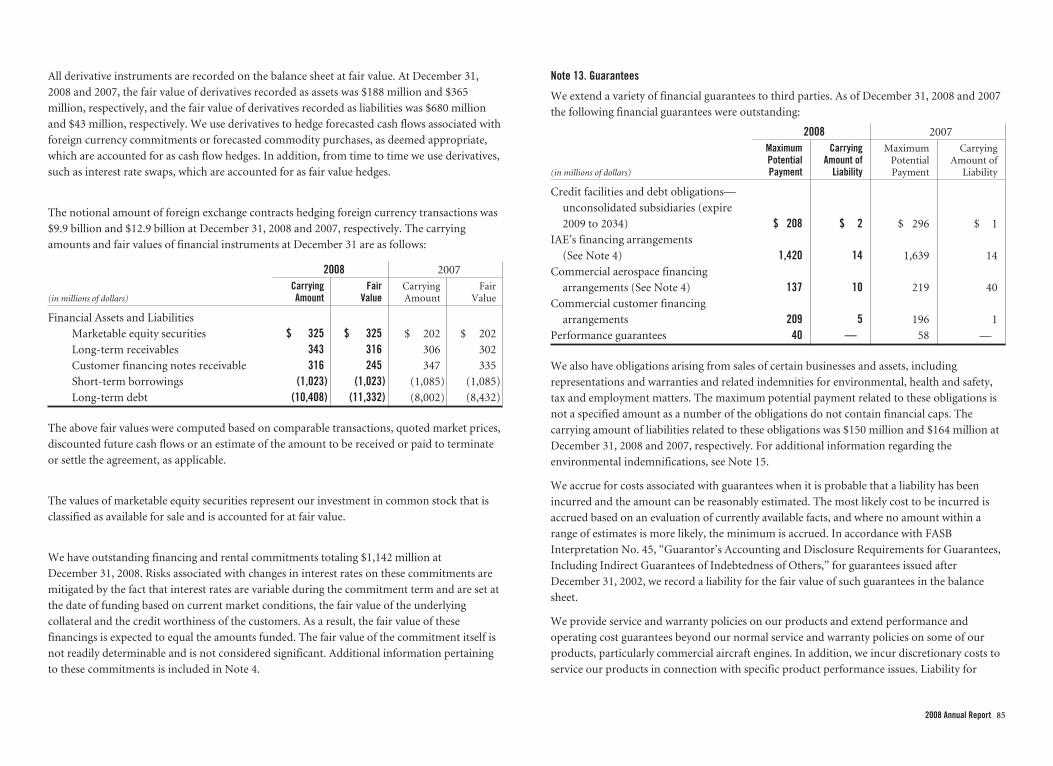
All derivative instruments are recorded on the balance sheet at fair value. At December 31,
2008 and 2007, the fair value of derivatives recorded as assets was $188 million and $365
million, respectively, and the fair value of derivatives recorded as liabilities was $680 million
and $43 million, respectively. We use derivatives to hedge forecasted cash flows associated with
foreign currency commitments or forecasted commodity purchases, as deemed appropriate,
which are accounted for as cash flow hedges. In addition, from time to time we use derivatives,
such as interest rate swaps, which are accounted for as fair value hedges.
The notional amount of foreign exchange contracts hedging foreign currency transactions was
$9.9 billion and $12.9 billion at December 31, 2008 and 2007, respectively. The carrying
amounts and fair values of financial instruments at December 31 are as follows:
2008 2007
(in millions of dollars)CarryingAmount
FairValue
CarryingAmount
FairValue
Financial Assets and Liabilities
Marketable equity securities $ 325 $ 325 $ 202 $ 202
Long-term receivables 343 316 306 302
Customer financing notes receivable 316 245 347 335
Short-term borrowings (1,023) (1,023) (1,085) (1,085)
Long-term debt (10,408) (11,332) (8,002) (8,432)
The above fair values were computed based on comparable transactions, quoted market prices,
discounted future cash flows or an estimate of the amount to be received or paid to terminate
or settle the agreement, as applicable.
The values of marketable equity securities represent our investment in common stock that is
classified as available for sale and is accounted for at fair value.
We have outstanding financing and rental commitments totaling $1,142 million at
December 31, 2008. Risks associated with changes in interest rates on these commitments are
mitigated by the fact that interest rates are variable during the commitment term and are set at
the date of funding based on current market conditions, the fair value of the underlying
collateral and the credit worthiness of the customers. As a result, the fair value of these
financings is expected to equal the amounts funded. The fair value of the commitment itself is
not readily determinable and is not considered significant. Additional information pertaining
to these commitments is included in Note 4.
Note 13. Guarantees
We extend a variety of financial guarantees to third parties. As of December 31, 2008 and 2007
the following financial guarantees were outstanding:
2008 2007
(in millions of dollars)
MaximumPotentialPayment
CarryingAmount of
Liability
MaximumPotentialPayment
CarryingAmount of
Liability
Credit facilities and debt obligations—
unconsolidated subsidiaries (expire
2009 to 2034) $ 208 $ 2 $ 296 $ 1
IAE’s financing arrangements
(See Note 4) 1,420 14 1,639 14
Commercial aerospace financing
arrangements (See Note 4) 137 10 219 40
Commercial customer financing
arrangements 209 5 196 1
Performance guarantees 40 — 58 —
We also have obligations arising from sales of certain businesses and assets, including
representations and warranties and related indemnities for environmental, health and safety,
tax and employment matters. The maximum potential payment related to these obligations is
not a specified amount as a number of the obligations do not contain financial caps. The
carrying amount of liabilities related to these obligations was $150 million and $164 million at
December 31, 2008 and 2007, respectively. For additional information regarding the
environmental indemnifications, see Note 15.
We accrue for costs associated with guarantees when it is probable that a liability has been
incurred and the amount can be reasonably estimated. The most likely cost to be incurred is
accrued based on an evaluation of currently available facts, and where no amount within a
range of estimates is more likely, the minimum is accrued. In accordance with FASB
Interpretation No. 45, “Guarantor’s Accounting and Disclosure Requirements for Guarantees,
Including Indirect Guarantees of Indebtedness of Others,” for guarantees issued after
December 31, 2002, we record a liability for the fair value of such guarantees in the balance
sheet.
We provide service and warranty policies on our products and extend performance and
operating cost guarantees beyond our normal service and warranty policies on some of our
products, particularly commercial aircraft engines. In addition, we incur discretionary costs to
service our products in connection with specific product performance issues. Liability for
2008 Annual Report 85

performance and operating cost guarantees is based upon future product performance and
durability, and is estimated largely based upon historical experience. Adjustments are made to
accruals as claim data and historical experience warrant. The changes in the carrying amount
of service and product warranties and product performance guarantees for the years ended
December 31, 2008 and 2007, are as follows:
(in millions of dollars) 2008 2007
Balance as of January 1 $1,252 $1,321
Warranties and guarantees issued 429 450
Settlements made (551) (531)
Adjustments to provision 6 12
Balance as of December 31 $1,136 $1,252
Note 14. Fair Value Measurement
In September 2006, the FASB issued SFAS No. 157, “Fair Value Measurements” (SFAS 157),
which is effective for fiscal years beginning after November 15, 2007 and for interim periods
within those years. This statement defines fair value, establishes a framework for measuring fair
value and expands the related disclosure requirements. This statement applies under other
accounting pronouncements that require or permit fair value measurements. The statement
indicates, among other things, that a fair value measurement assumes that the transaction to
sell an asset or transfer a liability occurs in the principal market for the asset or liability or, in
the absence of a principal market, the most advantageous market for the asset or liability. SFAS
157 defines fair value based upon an exit price model.
Relative to SFAS 157, the FASB issued FASB Staff Positions (FSP) FAS 157-1, FAS 157-2, and
FAS 157-3. FSP FAS 157-1 amends SFAS 157 to exclude SFAS No. 13, “Accounting for Leases”
(SFAS 13), and its related interpretive accounting pronouncements that address leasing
transactions, while FSP FAS 157-2 delays the effective date of the application of SFAS 157 to
fiscal years beginning after November 15, 2008 for all nonfinancial assets and nonfinancial
liabilities that are recognized or disclosed at fair value in the financial statements on a
non-recurring basis. FSP FAS 157-3 clarifies the application of SFAS 157 as it relates to the
valuation of financial assets in a market that is not active for those financial assets. This FSP is
effective immediately and includes those periods for which financial statements have not been
issued. We currently do not have any financial assets that are valued using inactive markets,
and as such are not impacted by the issuance of this FSP.
We adopted SFAS 157 as of January 1, 2008, with the exception of the application of the
statement to non-recurring nonfinancial assets and nonfinancial liabilities. Non-recurring
nonfinancial assets and nonfinancial liabilities for which we have not applied the provisions of
SFAS 157 include those measured at fair value in goodwill impairment testing, indefinite lived
intangible assets measured at fair value for impairment testing, asset retirement obligations
initially measured at fair value, and those non-recurring nonfinancial assets and nonfinancial
liabilities initially measured at fair value in a business combination.
Valuation Hierarchy. SFAS 157 establishes a valuation hierarchy for disclosure of the inputs to
valuation used to measure fair value. This hierarchy prioritizes the inputs into three broad
levels as follows. Level 1 inputs are quoted prices (unadjusted) in active markets for identical
assets or liabilities. Level 2 inputs are quoted prices for similar assets and liabilities in active
markets, quoted prices for identical or similar assets in markets that are not active, inputs other
than quoted prices that are observable for the asset or liability, including interest rates, yield
curves and credit risks, or inputs that are derived principally from or corroborated by
observable market data through correlation. Level 3 inputs are unobservable inputs based on
our own assumptions used to measure assets and liabilities at fair value. A financial asset or
liability’s classification within the hierarchy is determined based on the lowest level input that
is significant to the fair value measurement.
The following table provides the assets and liabilities carried at fair value measured on a
recurring basis as of December 31, 2008:
Total CarryingValue at
December 31,
Quoted pricesin activemarkets
Significantother
observableinputs
Significantunobservable
inputs(in millions of dollars) 2008 (Level 1) (Level 2) (Level 3)
Available for sale securities $317 $317 $— $—
Derivative assets 188 — 188 —
Derivative liabilities 680 — 680 —
Valuation Techniques. Our available for sale securities include equity investments that are
traded in an active market. They are measured at fair value using closing stock prices from
active markets and are classified within Level 1 of the valuation hierarchy. Our derivative assets
and liabilities include foreign exchange and commodity derivatives that are measured at fair
value using observable market inputs such as forward rates, interest rates, our own credit risk
and our counterparties’ credit risks. Based on these inputs, the derivative assets and liabilities
are classified within Level 2 of the valuation hierarchy. Based on our continued ability to trade
securities and enter into forward contracts, we consider the markets for our fair value
instruments to be active.
86 United Technologies Corporation

As of December 31, 2008, there has not been any significant impact to the fair value of our
derivative liabilities due to our own credit risk. Similarly, there has not been any significant
adverse impact to our derivative assets based on our evaluation of our counterparties’ credit
risks.
In February 2007, the FASB issued SFAS No. 159, “The Fair Value Option for Financial Assets
and Financial Liabilities – Including an amendment of FASB Statement No. 115” (SFAS 159),
which is effective for fiscal years beginning after November 15, 2007. This statement permits
entities to choose to measure many financial instruments and certain other items at fair value.
This statement also establishes presentation and disclosure requirements designed to facilitate
comparisons between entities that choose different measurement attributes for similar types of
assets and liabilities. Unrealized gains and losses on items for which the fair value option is
elected would be reported in earnings. We have adopted SFAS 159 and have elected not to
measure any additional financial instruments and other items at fair value.
Note 15. Commitments and Contingent Liabilities
Leases. We occupy space and use certain equipment under lease arrangements. Rental
commitments of $1,650 million at December 31, 2008 under long-term noncancelable
operating leases are payable as follows: $453 million in 2009, $371 million in 2010, $265
million in 2011, $180 million in 2012, $122 million in 2013 and $259 million thereafter. Rent
expense was $504 million in 2008, $437 million in 2007 and $373 million in 2006.
Additional information pertaining to commercial aerospace rental commitments is included in
Note 4.
Environmental. Our operations are subject to environmental regulation by federal, state and
local authorities in the United States and regulatory authorities with jurisdiction over our
foreign operations. As described in Note 1, we have accrued for the costs of environmental
remediation activities and periodically reassess these amounts. We believe that the likelihood
of incurring losses materially in excess of amounts accrued is remote. At December 31, 2008,
we had $553 million reserved for environmental remediation.
Government. We are now, and believe that in light of the current U.S. government contracting
environment we will continue to be, the subject of one or more U.S. government
investigations. If we or one of our business units were charged with wrongdoing as a result of
any of these investigations or other government investigations (including violations of certain
environmental or export laws) the U.S. government could suspend us from bidding on or
receiving awards of new U.S. government contracts pending the completion of legal
proceedings. If convicted or found liable, the U.S. government could fine and debar us from
new U.S. government contracting for a period generally not to exceed three years. The U.S.
government could void any contracts found to be tainted by fraud.
Our contracts with the U.S. government are also subject to audits. Like many defense
contractors, we have received audit reports, which recommend that certain contract prices
should be reduced to comply with various government regulations. Some of these audit reports
involved substantial amounts. We have made voluntary refunds in those cases we believe
appropriate and continue to litigate certain cases. In addition, we accrue for liabilities
associated with those matters that are probable and can be reasonably estimated. The most
likely settlement amount to be incurred is accrued based upon a range of estimates. Where no
amount within a range of estimates is more likely, then we accrued the minimum amount.
As previously disclosed, the Department of Justice (DOJ) sued us in 1999 in the U.S. District
Court for the Southern District of Ohio, claiming that Pratt & Whitney violated the civil False
Claims Act and common law. This lawsuit relates to the “Fighter Engine Competition”
between Pratt & Whitney’s F100 engine and General Electric’s F110 engine. The DOJ alleges
that the government overpaid for F100 engines under contracts awarded by the U.S. Air Force
in fiscal years 1985 through 1990 because Pratt & Whitney inflated its estimated costs for some
purchased parts and withheld data that would have revealed the overstatements. At trial of this
matter, completed in December 2004, the government claimed Pratt & Whitney’s liability to be
$624 million. On August 1, 2008, the trial court judge held that the Air Force had not suffered
any actual damages because Pratt & Whitney had made significant price concessions. However,
the trial court judge found that Pratt & Whitney violated the False Claims Act due to
inaccurate statements contained in the 1983 offer. In the absence of actual damages, the trial
court judge awarded the DOJ the maximum civil penalty of $7.09 million, or $10,000 for each
of the 709 invoices Pratt & Whitney submitted in 1989 and later under the contracts. Both the
DOJ and UTC have appealed the decision. Should the government ultimately prevail, the
outcome of this matter could result in a material effect on our results of operations in the
period in which a liability would be recognized or cash flows for the period in which damages
would be paid.
In December 2008, the Department of Defense (DOD) issued a contract claim against Sikorsky
to recover overpayments the DOD alleges it has incurred since January 2003 in connection
with cost accounting changes approved by the DOD and implemented by Sikorsky in 1999 and
2006. These changes relate to the calculation of material overhead rates in government
contracts. The DOD claimed that Sikorsky’s liability is approximately $80 million (including
interest). We believe this claim is without merit and intend to appeal.
Except as otherwise noted above, we do not believe that resolution of any of these matters will
have a material adverse effect upon our competitive position, results of operations, cash flows
or financial condition.
2008 Annual Report 87

Other. As described in Note 13, we extend performance and operating cost guarantees beyond
our normal warranty and service policies for extended periods on some of our products. We
have accrued our estimate of the liability that may result under these guarantees and for service
costs, which are probable and can be reasonably estimated.
We have accrued for environmental investigatory, remediation, operating and maintenance
costs, performance guarantees and other litigation and claims based on our estimate of the
probable outcome of these matters. While it is possible that the outcome of these matters may
differ from the recorded liability, we believe the resolution of these matters will not have a
material impact on our competitive position, results of operations, cash flows or financial
condition.
We also have other commitments and contingent liabilities related to legal proceedings, self-
insurance programs and matters arising out of the normal course of business. We accrue
contingencies based upon a range of possible outcomes. If no amount within this range is a
better estimate than any other, then we accrue the minimum amount.
Note 16. Segment Financial Data
Our operations are classified in six principal segments. The segments are generally determined
based on the management of the businesses and on the basis of separate groups of operating
companies, each with general operating autonomy over diversified products and services.
Otis products include elevators, escalators, moving walkways and service sold to customers in
the commercial and residential property industries around the world.
Carrier products include residential, commercial and industrial heating, ventilating, air
conditioning (HVAC) and refrigeration systems and equipment, food service equipment,
building automation and controls, HVAC and refrigeration components and installation,
retrofit and aftermarket services.
UTC Fire & Security products include fire and special hazard and suppression systems and fire
fighting equipment, electronic security, monitoring and rapid response systems and service
and security personnel for a diversified international customer base principally in the
industrial, commercial and residential property sectors.
Pratt & Whitney products include commercial, military, business jet and general aviation
aircraft engines, parts and services, industrial gas turbines and space propulsion sold to a
diversified customer base, including international and domestic commercial airlines and
aircraft leasing companies, aircraft manufacturers, and U.S. and foreign governments. Pratt &
Whitney also provides product support and a full range of overhaul, repair and fleet
management services and produces land-based power generation equipment.
Hamilton Sundstrand provides aerospace and industrial products and aftermarket services for
diversified industries worldwide. Aerospace products include power generation, management
and distribution systems, flight systems, engine control systems, environmental control
systems, fire protection and detection systems, auxiliary power units and propeller systems.
Industrial products include air compressors, metering pumps and fluid handling equipment.
Sikorsky products include military and commercial helicopters, aftermarket helicopter and
aircraft parts and services.
Segment Revenues and Operating Profit. Total revenues by segment include intersegment sales, which are generally made at prices approximating those that the selling entity is able to obtain on
external sales. Segment information for the years ended December 31 is as follows:Total Revenues Operating Profits
(in millions of dollars) 2008 2007 2006 2008 2007 2006
Otis $12,949 $11,885 $10,290 $2,477 $2,321 $1,888Carrier 14,944 14,644 13,481 1,316 1,381 1,237UTC Fire & Security 6,462 5,754 4,747 542 443 301Pratt & Whitney 12,965 12,129 11,112 2,122 2,011 1,817Hamilton Sundstrand 6,207 5,636 4,995 1,099 967 832Sikorsky 5,368 4,789 3,230 478 373 173
Total segment 58,895 54,837 47,855 8,034 7,496 6,248Eliminations & Other (214) (78) (26) (1) (60) 187General corporate expenses — — — (408) (386) (337)
Consolidated $58,681 $54,759 $47,829 $7,625 $7,050 $6,098
88 United Technologies Corporation

Total Assets Capital Expenditures Depreciation & Amortization
(in millions of dollars) 2008 2007 2006 2008 2007 2006 2008 2007 2006
Otis $ 7,731 $ 7,721 $ 6,973 $ 150 $ 136 $ 93 $ 203 $ 186 $ 183Carrier 10,810 10,335 10,127 191 181 148 194 188 157UTC Fire & Security 10,022 11,143 8,518 95 101 106 238 202 176Pratt & Whitney 9,650 9,273 9,828 412 384 335 368 307 280Hamilton Sundstrand 8,648 8,965 9,418 141 160 142 178 163 142Sikorsky 3,985 3,412 3,145 165 128 66 62 52 47
Total segment 50,846 50,849 48,009 1,154 1,090 890 1,243 1,098 985Eliminations & Other1 5,623 3,726 (868) 62 63 64 78 75 48
Consolidated $56,469 $54,575 $47,141 $1,216 $1,153 $954 $1,321 $1,173 $1,033
1 The asset increase from 2007 to 2008 primarily reflects the increase in cash and cash equivalents held at UTC Corporate. The asset increase from 2006 to 2007 reflects management’s decision to transfer domestic pensionasset and liability balances from the segments to UTC Corporate.
Geographic External Revenues and Operating Profit. Geographic external revenues and operating profits are attributed to the geographic regions based on their location of origin. U.S. external
revenues include export sales to commercial customers outside the United States and sales to the U.S. government, commercial and affiliated customers, which are known to be for resale to customers
outside the United States. Long-lived assets are net fixed assets attributed to the specific geographic regions.
External Revenues Operating Profits Long-Lived Assets
(in millions of dollars) 2008 2007 2006 2008 2007 2006 2008 2007 2006
United States Operations $27,965 $26,462 $23,524 $3,945 $3,508 $3,067 $3,198 $3,109 $2,939International Operations
Europe 15,819 14,341 12,069 2,219 2,204 1,731 1,347 1,356 1,130Asia Pacific 8,212 7,991 7,056 1,037 1,041 814 800 762 717Other 6,416 5,605 4,809 833 743 637 671 803 698
Eliminations & Other 269 360 371 (409) (446) (151) 332 266 241
Consolidated $58,681 $54,759 $47,829 $7,625 $7,050 $6,098 $6,348 $6,296 $5,725
Revenues from U.S. operations include export sales as follows:
(in millions of dollars) 2008 2007 2006
Europe $2,118 $1,782 $1,448
Asia Pacific 2,052 2,221 1,629
Other 2,865 2,225 1,771
$7,035 $6,228 $4,848
Major Customers. Revenues include sales under prime contracts and subcontracts to the U.S.
government, primarily related to Pratt & Whitney, Hamilton Sundstrand and Sikorsky
products, as follows:
(in millions of dollars) 2008 2007 2006
Pratt & Whitney $3,547 $3,583 $3,652
Hamilton Sundstrand 1,089 948 934
Sikorsky 3,063 2,774 1,819
Other 35 39 40
$7,734 $7,344 $6,445
2008 Annual Report 89

Selected Quarterly Financial Data (Unaudited)
2008 Quarters 2007 Quarters
(in millions of dollars, except per share amounts) First Second Third Fourth First Second Third Fourth
Sales $13,577 $15,535 $14,702 $14,229 $11,936 $13,766 $13,718 $14,499
Gross margin 3,596 4,176 4,038 3,672 2,940 3,637 3,650 3,770
Net income 1,000 1,275 1,269 1,145 819 1,148 1,197 1,060
Earnings per share of Common Stock:
Basic—net income $ 1.05 $ 1.35 $ 1.36 $ 1.24 $ .85 $ 1.19 $ 1.24 $ 1.11
Diluted—net income $ 1.03 $ 1.32 $ 1.33 $ 1.23 $ .82 $ 1.16 $ 1.21 $ 1.08
Comparative Stock Data (Unaudited)
2008 2007
Common Stock High Low Dividend High Low Dividend
First quarter $77.14 $65.20 $.320 $69.49 $61.85 $.265
Second quarter $75.86 $60.51 $.320 $72.64 $63.65 $.265
Third quarter $67.95 $56.15 $.320 $80.98 $69.00 $.320
Fourth quarter $59.96 $41.76 $.385 $82.50 $72.60 $.320
Our common stock is listed on the New York Stock Exchange. The high and low prices are based on the Composite Tape of the New York Stock Exchange. There were approximately 25,408 registered
shareholders at December 31, 2008.
90 United Technologies Corporation

Performance Graph (Unaudited)
The following graph presents the cumulative total shareholder return for the five years ending December 31, 2008 for our common stock, as compared to the Standard & Poor’s 500 Stock Index and to
the Dow Jones 30 Industrial Average. Our common stock price is a component of both indices. These figures assume that all dividends paid over the five-year period were reinvested, and that the
starting value of each index and the investment in common stock was $100.00 on December 31, 2003.
Dec-03 Dec-04 Dec-05 Dec-06 Dec-07 Dec-08
$0
$50
$100
$200
$150
United Technologies Corporation
COMPARISON OF CUMULATIVE FIVE YEAR TOTAL RETURN
S&P 500 Index Dow Jones Industrials
December
2003 2004 2005 2006 2007 2008
United Technologies Corporation $100.00 $110.73 $121.85 $138.50 $172.35 $123.35S&P 500 Index $100.00 $110.88 $116.33 $134.70 $142.10 $ 89.53Dow Jones Industrial Average $100.00 $105.56 $107.41 $127.84 $139.18 $ 93.93
2008 Annual Report 91

Board of Directors
Louis R. ChênevertPresident and Chief Executive Officer
United Technologies Corporation
(Diversified Manufacturer)
George DavidChairman
United Technologies Corporation
(Diversified Manufacturer)
John V. FaraciChairman and Chief Executive Officer
International Paper
(Paper, Packaging and Distribution)
Jean-Pierre GarnierChief Executive Officer
Pierre Fabre SA
(Pharmaceutical and Cosmetic Products)
Jamie S. GorelickPartner
WilmerHale
(Law Firm)
Former Deputy Attorney General of the
United States
Former General Counsel of the
Department of Defense
Carlos M. Gutierrez (effective March 11, 2009)
Former U.S. Secretary of Commerce
Former Chairman and CEO
Kellogg Company
Edward A. KangasFormer Chairman and CEO
Deloitte Touche Tohmatsu
(Audit and Tax Services)
Charles R. LeeRetired Chairman and
Co-Chief Executive Officer
Verizon Communications
(Telecommunications)
Richard D. McCormickRetired Chairman, President and
Chief Executive Officer
US West, Inc.
(Telecommunications)
Harold McGraw IIIChairman, President and
Chief Executive Officer
The McGraw-Hill Companies
(Global Information Services)
Richard B. MyersGeneral, U.S. Air Force (Ret.)
and former Chairman of the
Joint Chiefs of Staff
H. Patrick SwygertPresident Emeritus
Howard University
(Educational Institution)
André VilleneuveNon-Executive Chairman of LIFFE
(Part of NYSE Euronext Group)
Christine Todd WhitmanPresident
The Whitman Strategy Group
(Management Consulting Firm)
Former EPA Administrator
Former Governor of New Jersey
Permanent Committees
Audit CommitteeJohn V. Faraci, Chair
Edward A. Kangas
Richard D. McCormick
Richard B. Myers
H. Patrick Swygert
André Villeneuve
Committee on Compensation andExecutive DevelopmentJean-Pierre Garnier, Chair
Jamie S. Gorelick
Edward A. Kangas
Charles R. Lee
Richard D. McCormick
Harold McGraw III
H. Patrick Swygert
Executive CommitteeGeorge David, Chair
Louis R. Chênevert
Charles R. Lee
Richard D. McCormick
Finance CommitteeCharles R. Lee, Chair
Louis R. Chênevert
George David
John V. Faraci
Jamie S. Gorelick
Carlos M. Gutierrez (effective March 11, 2009)
Richard B. Myers
André Villeneuve
Christine Todd Whitman
Committee on Nominations and GovernanceRichard D. McCormick, Chair
John V. Faraci
Jean-Pierre Garnier
Carlos M. Gutierrez (effective March 11, 2009)
Charles R. Lee
Harold McGraw III
Christine Todd Whitman
Public Issues Review CommitteeChristine Todd Whitman, Chair
Jean-Pierre Garnier
Jamie S. Gorelick
Harold McGraw III
Richard B. Myers
H. Patrick Swygert
André Villeneuve
92 United Technologies Corporation

Leadership
Paul R. AdamsSenior Vice President,
Engineering, Pratt & Whitney
David AdlerPresident,
Sikorsky Aerospace Services
Alain M. BellemarePresident,
Hamilton Sundstrand
Richard H. Bennett, Jr.Vice President,
Environment, Health & Safety
Anthony C. BlackSenior Vice President,
Operations, UTC Fire & Security
Ari BousbibPresident, Commercial Companies and
Executive Vice President, UTC
J. Thomas Bowler, Jr.Senior Vice President,
Human Resources and Organization
William M. BrownPresident,
UTC Fire & Security
Louis R. ChênevertPresident and
Chief Executive Officer
Peter C. Christman, Jr.President, Pratt & Whitney Power Systems
Geraud DarnisPresident, Carrier
George DavidChairman
Pierre DejouxPresident, South Asia Pacific and Gulf, Otis
John J. DoucetteVice President and
Chief Information Officer
Michael R. DumaisVice President, Operations,
Hamilton Sundstrand
Thomas E. FarmerPresident, Military Engines, Pratt & Whitney
James E. GeislerVice President,
Corporate Strategy and Planning
Charles D. Gill, Jr.Senior Vice President and General Counsel
Bruno GrobPresident, North and East Europe and
Africa, Otis
Lindsay HarveyPresident, United Kingdom and
Central Europe, Otis
Gregory J. HayesSenior Vice President and
Chief Financial Officer
David P. HessPresident, Pratt & Whitney
Kathleen M. HopkoVice President, Secretary and
Associate General Counsel
Todd J. KallmanPresident, Commercial Engines and
Global Services, Pratt & Whitney
Robert F. LeducPresident, Flight Systems and
U.S. Government Classified Programs,
Hamilton Sundstrand
Nancy T. LintnerVice President, Communications
James G. MaserPresident,
Pratt & Whitney Rocketdyne
Robert J. McDonoughPresident, Residential and Light Commercial
North America, Carrier
J. Michael McQuadeSenior Vice President,
Science and Technology
Didier Michaud-DanielPresident, Otis
Raymond J. MonciniSenior Vice President, Operations, Carrier
Michael A. MontsVice President,
Business Practices
Timothy M. MorrisPresident, 787 Programs,
Hamilton Sundstrand
Peter NolanPresident, Residential and Light Commercial
International, Carrier
Stephen G. OswaldPresident, Industrial, Hamilton Sundstrand
David E. ParekhVice President, Research and Director,
United Technologies Research Center
Eric PatryPresident, Strategic Initiatives,
UTC Fire & Security
Jeffrey P. PinoPresident, Sikorsky
Jothi PurushotamanVice President, Operations
Thomas I. RoganVice President, Treasurer
Kelly RomanoPresident, Building Systems and Services,
Carrier
John SaabasPresident, Pratt & Whitney Canada
Pedro Sainz de BarandaPresident, South Europe and Mediterranean,
Otis
Margaret M. SmythVice President, Controller
Scott D. StarrettPresident, Government Programs, Sikorsky
Tobin J. TreichelVice President, Tax
Joseph E. TriompoPresident, Aerospace Power Systems,
Hamilton Sundstrand
Charles VoPresident, North Asia Pacific, Otis
Gregg WardSenior Vice President, Government Affairs
Randal E. WilcoxPresident, North and South America, Otis
2008 Annual Report 93

Shareowner Information
Corporate Office Certifications Additional Information Direct Registration SystemUnited Technologies CorporationUnited Technologies BuildingHartford, Connecticut 06101Telephone: 860.728.7000
This report is made available to shareownersin advance of the annual meeting of share-owners to be held at 11:00 a.m., April 8, 2009,in Jupiter, Florida. The proxy statement willbe made available to shareowners on or aboutFebruary 20, 2009, at which time proxies forthe meeting will be requested.
Information about UTC, including financialinformation, can be found at our Web site:www.utc.com.
Stock ListingNew York Stock Exchange
Ticker SymbolUTX
Transfer Agent and RegistrarComputershare Trust Company, N.A., isthe transfer agent, registrar and dividenddisbursing agent for UTC’s Common Stock.Questions and communications regardingtransfer of stock, replacement of lost certifi-cates, dividends and address changes, andthe Direct Stock Purchase and DividendReinvestment Plan should be directed to:
Computershare Trust Company, N.A.250 Royall StreetCanton, Massachusetts 02021Telephone:
Within the U.S.: 1.800.488.9281Outside the U.S.: 1.781.575.2724
Web site: www.computershare.com/investor
TDD: 1.800.952.9245Telecommunications device for the hearingimpaired.
UTC has included as Exhibit 31 to itsAnnual Report on Form 10-K for fiscal year2008 filed with the Securities and ExchangeCommission certificates of its principalexecutive officers and principal financialofficers certifying, among other things, theinformation contained in the Form 10-K.
Annually UTC submits to the New YorkStock Exchange (NYSE) a certificate ofUTC’s Chief Executive Officer certifyingthat he was not aware of any violation byUTC of NYSE corporate governance listingstandards as of the date of the certification.
DividendsDividends are usually paid on the 10th dayof March, June, September and December.
Electronic AccessRegistered shareowners may sign up at thefollowing Web site for electronic access tofuture annual reports and proxy materials,rather than receiving mailed copies:www.computershare.com/us/ecomms.
Your enrollment is revocable until eachyear’s record date for the annual meeting.Beneficial shareowners may be able to requestelectronic access by contacting their brokeror bank, or Broadridge Financial Solutions at:http://enroll.icsdelivery.com/utc.
Shareowners may obtain a copy of theUTC Annual Report on Form 10-K for 2008filed with the Securities and ExchangeCommission by writing to:
Corporate SecretaryUnited Technologies CorporationUnited Technologies BuildingHartford, Connecticut 06101
For additional information about UTC,please contact Investor Relations at theabove corporate office address, or visitour Web site at: www.utc.com.
Shareowner Information ServicesOur Internet and telephone services giveshareowners fast access to UTC financialresults. The 24-hour-a-day, toll-freetelephone service includes recordedsummaries of UTC’s quarterly earningsinformation and other company news.Callers also may request copies of ourquarterly earnings and news releases, byeither fax or mail, and obtain copies of theUTC Annual Report and Form 10-K.
To access the service, dial 1.800.881.1914from any touchtone phone and follow therecorded instructions.
If your shares are held in street namethrough a broker and you are interested inparticipating in the Direct RegistrationSystem, you may have your broker transferthe shares to Computershare TrustCompany, N.A., electronically throughthe Direct Registration System. Interestedinvestors can request a description of thisbook-entry form of registration by callingShareholder Direct at: 1.800.881.1914.
Environmentally Friendly ReportThis annual report is printed on recycledand recyclable paper.
www.utc.comwww.carrier.comwww.hamiltonsundstrand.comwww.otis.comwww.pw.utc.comwww.sikorsky.comwww.utcfireandsecurity.comwww.utcpower.com
94 United Technologies Corporation

Respond to this reportYour feedback is important to us. Please visitus online to tell us what you think of our finan-cial and corporate responsibility performanceand reporting. A response form is available atwww.utc.com/responsibility.
United Technologies Corporation and itssubsidiaries’ names, abbreviations thereof,logos and product and service designatorsare all either the registered or unregisteredtrademarks or trade names of UnitedTechnologies Corporation and its subsidiaries.
All paper used in this report is certified to theForest Stewardship Council (FSC) standards.The cover and narrative section are printed onMohawk Options paper, which is 100 percentpost-consumer recycled, made with a chlorine-free process and non-polluting, wind-generatedenergy. The financial section is printed onDomtar Donnelley Financial Opaque RecycledFSC utilizing 50 percent mixed sources.
Photo creditsPage 6, courtesy Lockheed MartinPage 9, left, courtesy NASAPage 9, right, courtesy Maersk LinePage 12, left, courtesy Paradise Island Foods, Inc.Page 13, left, courtesy Gale International KoreaPage 13, right, copyright Airbus 2008Page 22, courtesy Maritime and Coastguard AgencyPage 24, right, courtesy Raser TechnologiesPage 33, left, courtesy Navistar, Inc.Page 34, courtesy ECEPage 36, courtesy U.S. Navy

United Technologies BuildingHartford, Connecticut 06101U.S.A.
CarrierHamilton SundstrandOtisPratt & WhitneySikorskyUTC Fire & SecurityUTC Power
002CS17951
Recommended