International Journal of Education and Development using Information and Communication Technology (IJEDICT), 2014, Vol. 10, Issue 3, pp. 75-86
Using the UTAUT model to analyze students’ ICT adoption
Samuel NiiBoi Attuquayefio Methodist University College, Ghana
Hillar Addo
University of Professional Studies, Ghana
ABSTRACT This paper seeks to provide further understanding of issues surrounding acceptance of information and communication technology (ICT) by students of tertiary institutions. The Unified Theory of Acceptance and Use of Technology (UTAUT) model Venkatesh et al (2003) was employed by the researchers to determine the strength of predictors for students’ intention to accept and use ICT for learning and research. Questionnaires were administered to 400 students in the Social Studies and Business Administration Faculties of Methodist University College, Ghana, with 345 returned, a 86% return rate. Analysis of Moments Structures (AMOS) 20 and Statistical Package for the Social Sciences (SPSS) 16 were used to analyze the data collected. The measurement and structure model was appraised using Structural Equation Modeling. Effort Expectancy (EE) (0.4, p <.05) significantly predicted Behavioural Intention(BI) to use ICT, while Social influence (SI) and Performance Expectancy (PE) were statistically insignificant, as was Behavioural Intention (BI) on Use Behaviour (UB). However, Facilitating Conditions (FC) (β=.26, p <.01) significantly influenced UB. We recommend that future studies should include students from other faculties and multiple universities for more reliable results and conclusions Keywords: Effort Expectancy, Performance Expectancy, Social Influence, Facilitating Conditions, Behavioural Intentions, Use Behaviour INTRODUCTION ICT is changing the way businesses are conducted, including education. Most businesses have incorporated ICT into their work with the view of achieving higher efficiency and improving productivity, which in turn leads to higher profitability. For example Loogma et. al. (2012) indicate that the use of ICT may facilitate innovative teaching and learning practices in educational settings. According to (Laudon and Laudon 2010) however, significant investment in ICT does not necessarily guarantee higher returns: the investment must be supported with some necessary complementary assets such as incentives for management innovation, teamwork and collaborative work environment. This study provides further understanding of the issues surrounding acceptance of ICT by students of tertiary Institutions. It investigates behaviour towards technology adoption by examining behavioural intentions towards different technologies in various cultural settings and identifying findings from other studies. Several theoretical models have been perused to seek factors that influence behavioural intentions to use technology to manage user behaviour. Models scanned include the Theory of Reasoned Action (TRA) (Fishbein and Ajzen 1975); the Theory of Planned Behaviour (TPB) (Ajzen 1991), the Technology Acceptance Model (TAM) (Davis 1989);
76 IJEDICT
the Combined-TAM-TPB model (C-TAM-TPB) (Taylor and Todd 1995), the Motivational Model (MM) (Davis et al., 1992), the Innovation Diffusion Theory (IDT) (Rogers 1995) and others. Combinations of the listed models have been applied as theoretical models in some situations while in others, these models have been extended with additional factors. These models explain between thirty to sixty percent of users’ behavioural intention to use technology Venkatesh et al (2003). In 2003, for example, Venkatesh et al. unified eight of these models and arrived at the UTAUT model. The Application of the UTAUT model explains seventy percent of the variation. The principal motivation of this paper is the observed under-utilization of ICTs provided by administrators at Methodist University College Ghana (MUCG) for learning and research by students. The ICTs include a mixture of hardware (computers), software (Microsoft Office Tools) and telecommunication (Wi-Fi, e-mail, cellular phones, and internet). Gulbahar (2007) asserts that, despite huge educational ICT investments in teaching and learning, there is little evidence of their adoption. Jhurree (2005) highlights the significance of proper planning and management involvement in technology integration in educational settings. If this is not heeded, it will either slow down a project or lead to its outright failure. As White et al. (2002) point out, conditions which can facilitate innovative teaching and learning include ensuring that learning goals are achievable using the ICT tools; using ICT tools as one resource among others, which may include provision of professional development and technical support, making equipment available, and working to change teacher negative beliefs about ICT in teaching and learning. Several technology acceptance models and theories have been applied to different phenomena and varying cultural settings in many studies, yielding varying results. Some of the results from these studies are consistent with the original postulations while others contradict them. Eight technology acceptance models were unified by Venkatesh et al. (2003) to formulate the UTAUT model, including the Theory of Reasoned Action (TRA) (Fishbein and Ajzen 1975), the Theory of Planned Behaviour (TPB) (Ajzen 1991), the Technology Acceptance Model (TAM) (Davis 1989), the Combined-TAM-TPB (Taylor and Todd 1995) , Model of PC Utilization (MPCU) (Thompson et al. 1991), Motivational Model (MM) (Davis et al., 1992), Social Cognitive Theory (SCT) (Bandura 1986) and Innovation Diffusion Theory (IDT) (Rogers 1995). Table 1 provides a summary of the source of each UTAUT construct, with a description and the model from which each construct was derived. Besides the constructs stated in Table 1, four other variables - age, gender, experience and voluntariness of use - moderate the relationships suggested. These relationships include Effort Expectancy, Performance Expectancy and Social Influence predicting Behavioural Intention (BI) which, together with Facilitating Conditions, influence Use Behaviour (UB). Results from the UTAUT model explained seventy percent (70%) of the variation in user’s intention to accept technology Venkatesh et al. (2003). Table 1: Description of UTAUT variables and models derived from them
Construct Description of Perception Similar Construct and Corresponding Models Performance Expectancy
The degree to which an individual believes that using the system will help him or her to attain gains in job performance
Perceived usefulness (TAM/TAM2 & C-TAM-TPB); - Extrinsic motivation (MM); - Relative advantage (IDT); - Job-fit (MPCU); - Outcome expectations (SCT).
Effort Expectancy
The degree of ease associated with the use of the system.
-Perceived ease of use (TAM/TAM2); - Complexity (MPCU); - Ease of use (IDT).
Using the UTAUT model to analyze students’ ICT adoption 77
Construct Description of Perception Similar Construct and Corresponding Models Social Influence
The degree to which an individual perceives that important others believe he or she should use the new systems.
-Subjective norms (TRA, TAM2, TPB/DTPB and C-TAM-TPB); - Social factors (MPCU); - Image (IDT).
Facilitating Conditions
Refer to consumers’ perceptions of the resources and support available to perform a behaviour Venkatesh et al. (2003)
-Perceived behavioural control (TPB/DTPB, C-TAM-TPB); -Facilitating conditions (MPCU); - Compatibility (IDT).
Evidence from Table 1 shows that there are similarities among some of the models combined to form the UTAUT model. TPB for example is an improvement of TRA and TAM. These three were combined to form C-TAM-TPB. TAM, authored by Davies et al. (1989), is straightforward and easy to use in different research settings. According to Han (2003), C-TAM-TPB has certain decisions that can influence IT usage similar to TAM, but provides additional factors - subjective norm and perceived behaviour control - which are not in TAM (Ajzen and Brown 1991). With the additional construct added to TAM to postulate C-TAM-TPB, the predictive power of behavioural intention to use technology improved (Taylor and Todd 1995b). Nonetheless, prediction of technology usage is better with TAM than C-TAM-TPB. The study focused on four research questions to address the research purpose.
i) What is the degree to which students believe that using ICT available will enhance learning and research?
ii) To what extent do students perceive the ICT provided by administrators as relatively difficult to use?
iii) To what extent do lecturers and students influence other students intention to use the ICT available for learning and research ?
iv) To what extent does technical support influence students' to use ICT available for learning and research?
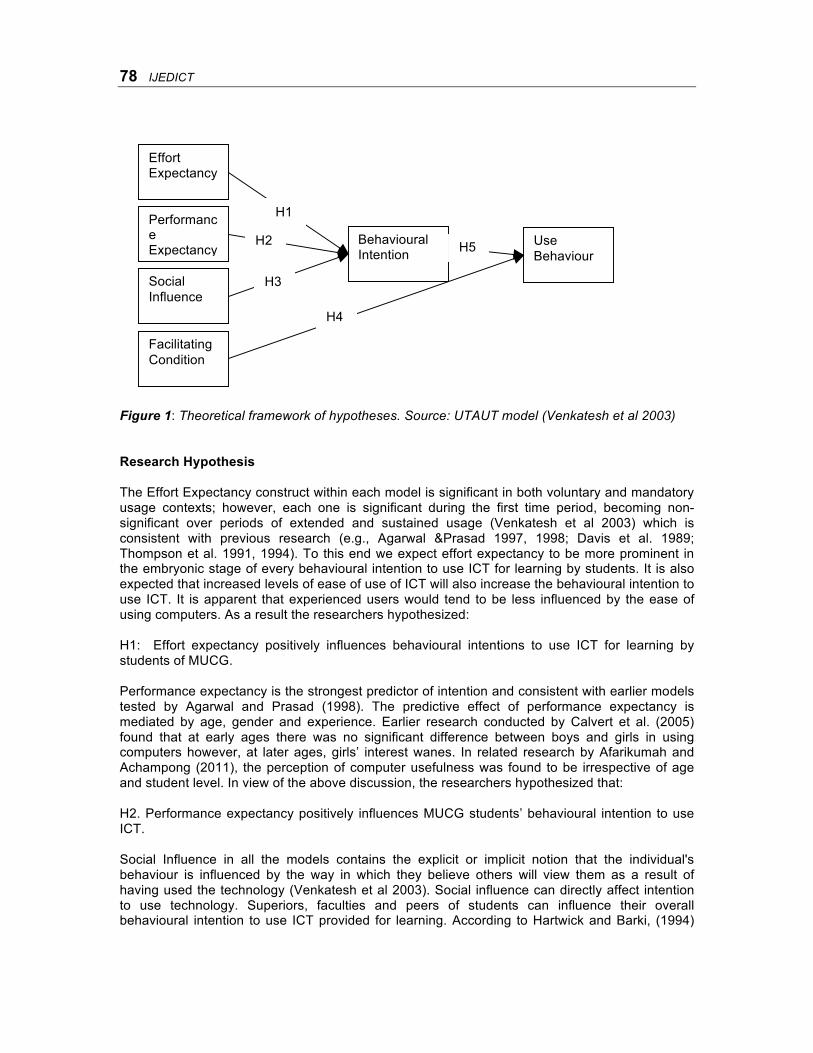
METHODOLOGY The Methodist University College Ghana was used as a case study. It has a student population of 4484 comprising of 2022 male and 2462 female. The university college has four faculties, business administration, social studies, applied sciences and arts and general studies at its main campus in Accra and two other campuses at Tema and Wenchi. Questionnaires were administered to 400 students of the Social Studies and Business Administration faculties using the purposive sampling method. 345 responses were received. The researchers adopted these strategies to enable them to delve deeply into students’ behaviour towards ICT for learning and research as well as using a sample that represented the population (Cresswell 2009). Research Model The purpose of this study was to determine the strength of the predictors (EE, PE, SI, and FC) on students’ intention to accept and use ICT for learning and research. The factors that may influence ICT acceptance by MUCG students are illustrated in Figure 1. The study is based on the model of Venkatesh et al. (2003), which has four exogenous variables and two endogenous variables, however, the moderating variables have been excluded in this study.
78 IJEDICT
Figure 1: Theoretical framework of hypotheses. Source: UTAUT model (Venkatesh et al 2003) Research Hypothesis The Effort Expectancy construct within each model is significant in both voluntary and mandatory usage contexts; however, each one is significant during the first time period, becoming non-significant over periods of extended and sustained usage (Venkatesh et al 2003) which is consistent with previous research (e.g., Agarwal &Prasad 1997, 1998; Davis et al. 1989; Thompson et al. 1991, 1994). To this end we expect effort expectancy to be more prominent in the embryonic stage of every behavioural intention to use ICT for learning by students. It is also expected that increased levels of ease of use of ICT will also increase the behavioural intention to use ICT. It is apparent that experienced users would tend to be less influenced by the ease of using computers. As a result the researchers hypothesized: H1: Effort expectancy positively influences behavioural intentions to use ICT for learning by students of MUCG. Performance expectancy is the strongest predictor of intention and consistent with earlier models tested by Agarwal and Prasad (1998). The predictive effect of performance expectancy is mediated by age, gender and experience. Earlier research conducted by Calvert et al. (2005) found that at early ages there was no significant difference between boys and girls in using computers however, at later ages, girls’ interest wanes. In related research by Afarikumah and Achampong (2011), the perception of computer usefulness was found to be irrespective of age and student level. In view of the above discussion, the researchers hypothesized that: H2. Performance expectancy positively influences MUCG students’ behavioural intention to use ICT. Social Influence in all the models contains the explicit or implicit notion that the individual's behaviour is influenced by the way in which they believe others will view them as a result of having used the technology (Venkatesh et al 2003). Social influence can directly affect intention to use technology. Superiors, faculties and peers of students can influence their overall behavioural intention to use ICT provided for learning. According to Hartwick and Barki, (1994)
Effort Expectancy
Performance Expectancy
Social Influence
Facilitating Condition
Behavioural Intention
Use Behaviour
H1
H2
H3
H4
H5
Using the UTAUT model to analyze students’ ICT adoption 79
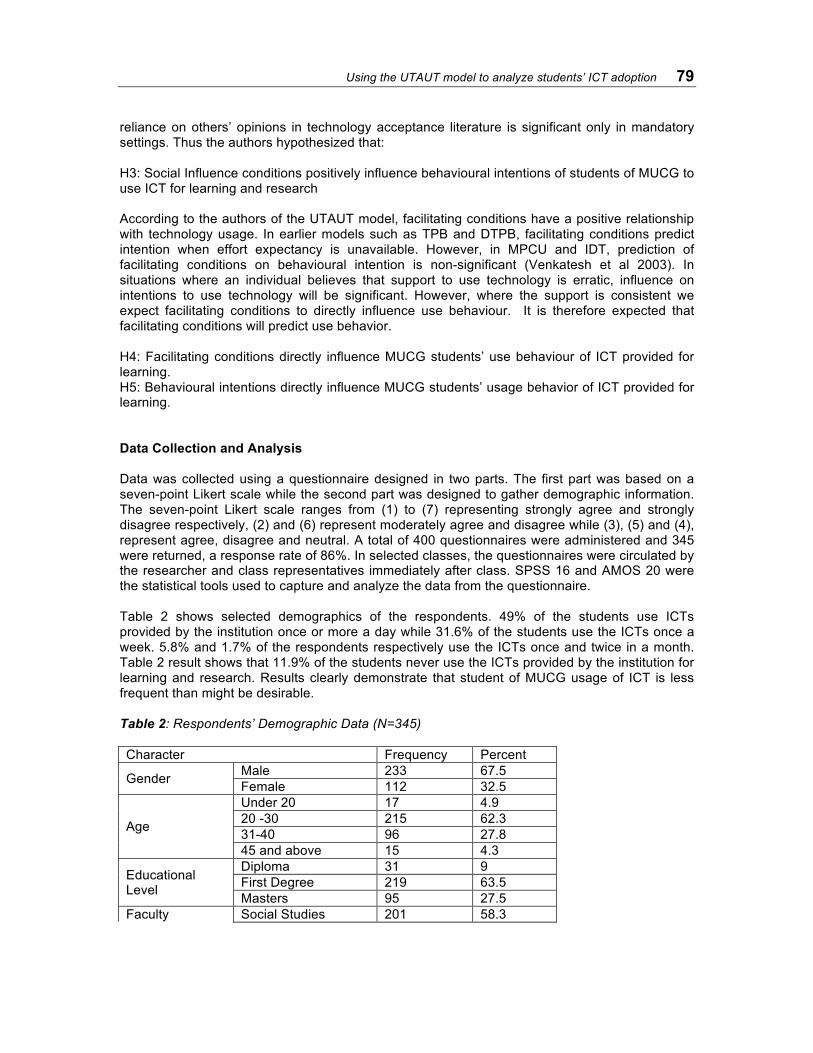
reliance on others’ opinions in technology acceptance literature is significant only in mandatory settings. Thus the authors hypothesized that: H3: Social Influence conditions positively influence behavioural intentions of students of MUCG to use ICT for learning and research According to the authors of the UTAUT model, facilitating conditions have a positive relationship with technology usage. In earlier models such as TPB and DTPB, facilitating conditions predict intention when effort expectancy is unavailable. However, in MPCU and IDT, prediction of facilitating conditions on behavioural intention is non-significant (Venkatesh et al 2003). In situations where an individual believes that support to use technology is erratic, influence on intentions to use technology will be significant. However, where the support is consistent we expect facilitating conditions to directly influence use behaviour. It is therefore expected that facilitating conditions will predict use behavior. H4: Facilitating conditions directly influence MUCG students’ use behaviour of ICT provided for learning. H5: Behavioural intentions directly influence MUCG students’ usage behavior of ICT provided for learning. Data Collection and Analysis Data was collected using a questionnaire designed in two parts. The first part was based on a seven-point Likert scale while the second part was designed to gather demographic information. The seven-point Likert scale ranges from (1) to (7) representing strongly agree and strongly disagree respectively, (2) and (6) represent moderately agree and disagree while (3), (5) and (4), represent agree, disagree and neutral. A total of 400 questionnaires were administered and 345 were returned, a response rate of 86%. In selected classes, the questionnaires were circulated by the researcher and class representatives immediately after class. SPSS 16 and AMOS 20 were the statistical tools used to capture and analyze the data from the questionnaire. Table 2 shows selected demographics of the respondents. 49% of the students use ICTs provided by the institution once or more a day while 31.6% of the students use the ICTs once a week. 5.8% and 1.7% of the respondents respectively use the ICTs once and twice in a month. Table 2 result shows that 11.9% of the students never use the ICTs provided by the institution for learning and research. Results clearly demonstrate that student of MUCG usage of ICT is less frequent than might be desirable. Table 2: Respondents’ Demographic Data (N=345) Character Frequency Percent
Gender Male 233 67.5 Female 112 32.5
Age
Under 20 17 4.9 20 -30 215 62.3 31-40 96 27.8 45 and above 15 4.3
Educational Level
Diploma 31 9 First Degree 219 63.5 Masters 95 27.5
Faculty Social Studies 201 58.3
80 IJEDICT
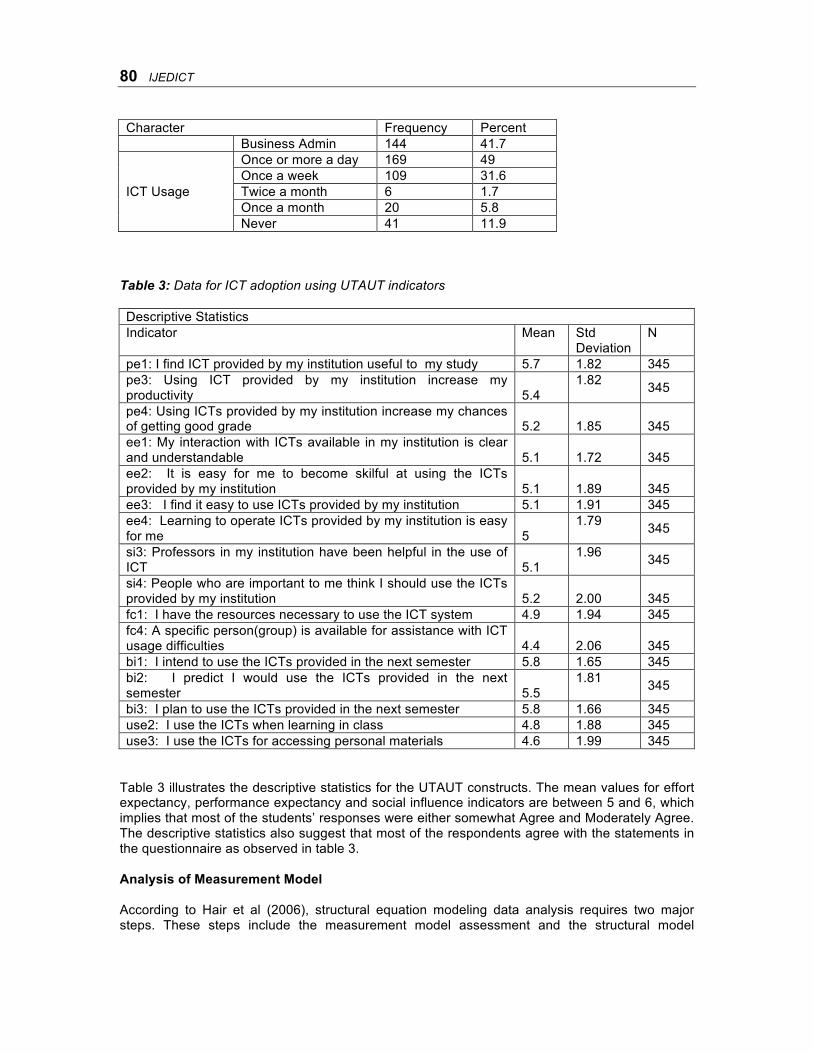
Character Frequency Percent Business Admin 144 41.7
ICT Usage
Once or more a day 169 49 Once a week 109 31.6 Twice a month 6 1.7 Once a month 20 5.8 Never 41 11.9
Table 3: Data for ICT adoption using UTAUT indicators Descriptive Statistics Indicator
Mean Std Deviation
N
pe1: I find ICT provided by my institution useful to my study 5.7 1.82 345 pe3: Using ICT provided by my institution increase my productivity 5.4
1.82 345
pe4: Using ICTs provided by my institution increase my chances of getting good grade 5.2
1.85
345
ee1: My interaction with ICTs available in my institution is clear and understandable 5.1
1.72
345
ee2: It is easy for me to become skilful at using the ICTs provided by my institution 5.1
1.89
345
ee3: I find it easy to use ICTs provided by my institution 5.1 1.91 345 ee4: Learning to operate ICTs provided by my institution is easy for me 5
1.79 345
si3: Professors in my institution have been helpful in the use of ICT 5.1
1.96 345
si4: People who are important to me think I should use the ICTs provided by my institution 5.2
2.00
345
fc1: I have the resources necessary to use the ICT system 4.9 1.94 345 fc4: A specific person(group) is available for assistance with ICT usage difficulties 4.4
2.06
345
bi1: I intend to use the ICTs provided in the next semester 5.8 1.65 345 bi2: I predict I would use the ICTs provided in the next semester 5.5
1.81 345
bi3: I plan to use the ICTs provided in the next semester 5.8 1.66 345 use2: I use the ICTs when learning in class 4.8 1.88 345 use3: I use the ICTs for accessing personal materials 4.6 1.99 345
Table 3 illustrates the descriptive statistics for the UTAUT constructs. The mean values for effort expectancy, performance expectancy and social influence indicators are between 5 and 6, which implies that most of the students’ responses were either somewhat Agree and Moderately Agree. The descriptive statistics also suggest that most of the respondents agree with the statements in the questionnaire as observed in table 3. Analysis of Measurement Model According to Hair et al (2006), structural equation modeling data analysis requires two major steps. These steps include the measurement model assessment and the structural model
Using the UTAUT model to analyze students’ ICT adoption 81
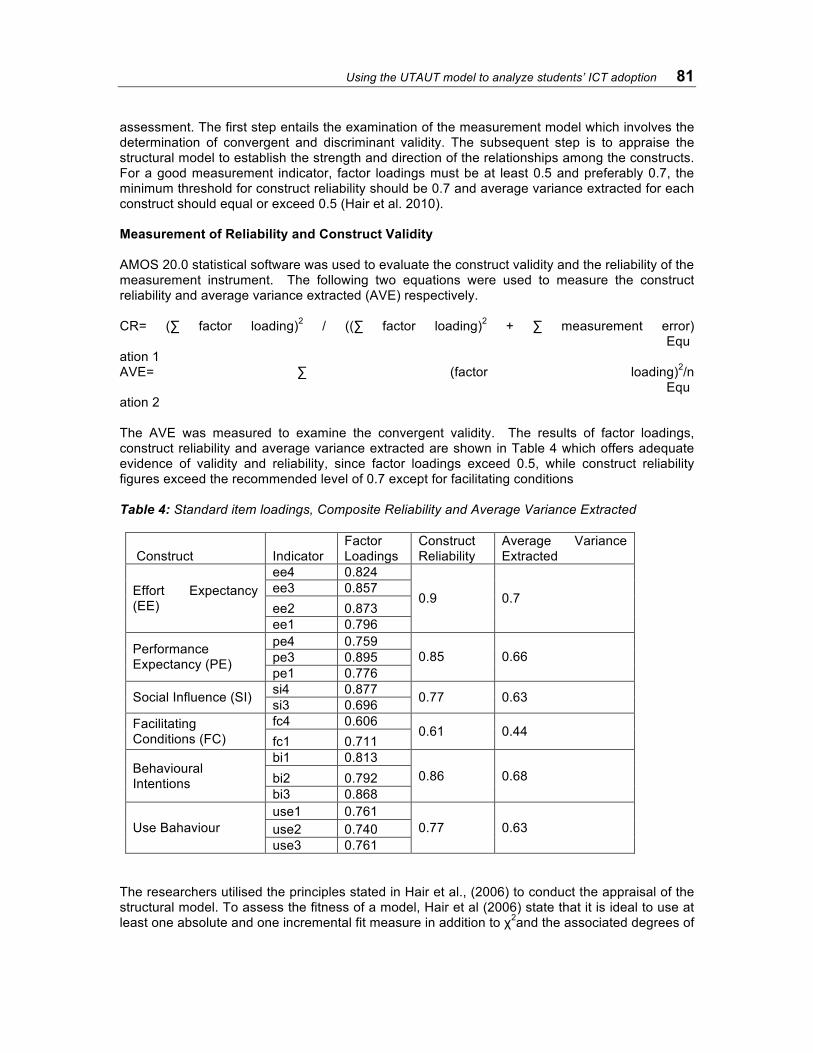
assessment. The first step entails the examination of the measurement model which involves the determination of convergent and discriminant validity. The subsequent step is to appraise the structural model to establish the strength and direction of the relationships among the constructs. For a good measurement indicator, factor loadings must be at least 0.5 and preferably 0.7, the minimum threshold for construct reliability should be 0.7 and average variance extracted for each construct should equal or exceed 0.5 (Hair et al. 2010). Measurement of Reliability and Construct Validity AMOS 20.0 statistical software was used to evaluate the construct validity and the reliability of the measurement instrument. The following two equations were used to measure the construct reliability and average variance extracted (AVE) respectively. CR= (∑ factor loading)2 / ((∑ factor loading)2 + ∑ measurement error) Equation 1 AVE= ∑ (factor loading)2/n Equation 2 The AVE was measured to examine the convergent validity. The results of factor loadings, construct reliability and average variance extracted are shown in Table 4 which offers adequate evidence of validity and reliability, since factor loadings exceed 0.5, while construct reliability figures exceed the recommended level of 0.7 except for facilitating conditions Table 4: Standard item loadings, Composite Reliability and Average Variance Extracted
Construct Indicator Factor Loadings
Construct Reliability
Average Variance Extracted
Effort Expectancy (EE)
ee4 0.824
0.9 0.7 ee3 0.857 ee2 0.873 ee1 0.796
Performance Expectancy (PE)
pe4 0.759 0.85 0.66 pe3 0.895
pe1 0.776
Social Influence (SI) si4 0.877 0.77 0.63 si3 0.696 Facilitating Conditions (FC)
fc4 0.606 0.61 0.44
fc1 0.711
Behavioural Intentions
bi1 0.813 0.86 0.68 bi2 0.792
bi3 0.868
Use Bahaviour use1 0.761
0.77 0.63 use2 0.740 use3 0.761
The researchers utilised the principles stated in Hair et al., (2006) to conduct the appraisal of the structural model. To assess the fitness of a model, Hair et al (2006) state that it is ideal to use at least one absolute and one incremental fit measure in addition to χ2and the associated degrees of
82 IJEDICT
freedom. Earlier researchers have recommended the following cut off for model appraisal: χ2/df < 3 (Bagozzi, R.P., & Yi., 1988), AGFI > 0.8 (Chau, P.Y. K &Hu P.J.H 2001), RMSEA <.08 (Brown M. W. &Cudeck R ,1993), CFI >0.9 (Bagozzi, R.P., & Yi. 1988), NFI > 0.9 (Chin and Todd, 1995, Hair et al., 1998). Table 5 provides a list of fit indices, recommended threshold values and their corresponding authors, and the paper's fit indices which clearly fall within the acceptable region. Hence the result revealed that the measurement model fit with the data collected.
Table 5: Recommended and actual values of fit Indices
Fit Indices Recommended Value Actual Values Authors χ2/df <3 1.787 (Bagozzi, R.P., & Yi., 1988) AGFI >0.8 0.909 (Chau, P.Y. K & Hu P.J.H 2001) RMSEA <0.08 0.048 (Browne M. W. & Cudeck R ,1993) NFI >0.9 0.973 (Chin and Todd, 1995, Hair et al.,
1998) CFI >0.9 0.940 (Bagozzi, R.P., & Yi. 1988)
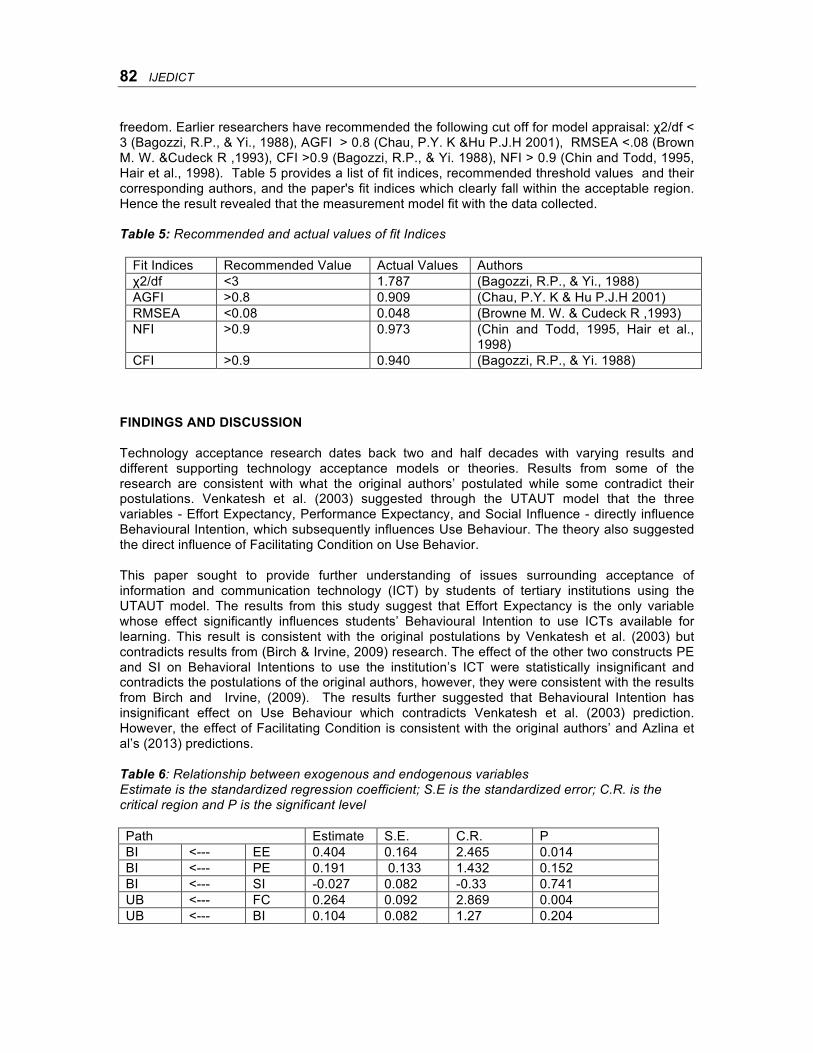
FINDINGS AND DISCUSSION Technology acceptance research dates back two and half decades with varying results and different supporting technology acceptance models or theories. Results from some of the research are consistent with what the original authors’ postulated while some contradict their postulations. Venkatesh et al. (2003) suggested through the UTAUT model that the three variables - Effort Expectancy, Performance Expectancy, and Social Influence - directly influence Behavioural Intention, which subsequently influences Use Behaviour. The theory also suggested the direct influence of Facilitating Condition on Use Behavior. This paper sought to provide further understanding of issues surrounding acceptance of information and communication technology (ICT) by students of tertiary institutions using the UTAUT model. The results from this study suggest that Effort Expectancy is the only variable whose effect significantly influences students’ Behavioural Intention to use ICTs available for learning. This result is consistent with the original postulations by Venkatesh et al. (2003) but contradicts results from (Birch & Irvine, 2009) research. The effect of the other two constructs PE and SI on Behavioral Intentions to use the institution’s ICT were statistically insignificant and contradicts the postulations of the original authors, however, they were consistent with the results from Birch and Irvine, (2009). The results further suggested that Behavioural Intention has insignificant effect on Use Behaviour which contradicts Venkatesh et al. (2003) prediction. However, the effect of Facilitating Condition is consistent with the original authors’ and Azlina et al’s (2013) predictions. Table 6: Relationship between exogenous and endogenous variables Estimate is the standardized regression coefficient; S.E is the standardized error; C.R. is the critical region and P is the significant level Path Estimate S.E. C.R. P BI <--- EE 0.404 0.164 2.465 0.014 BI <--- PE 0.191 0.133 1.432 0.152 BI <--- SI -0.027 0.082 -0.33 0.741 UB <--- FC 0.264 0.092 2.869 0.004 UB <--- BI 0.104 0.082 1.27 0.204
Using the UTAUT model to analyze students’ ICT adoption 83
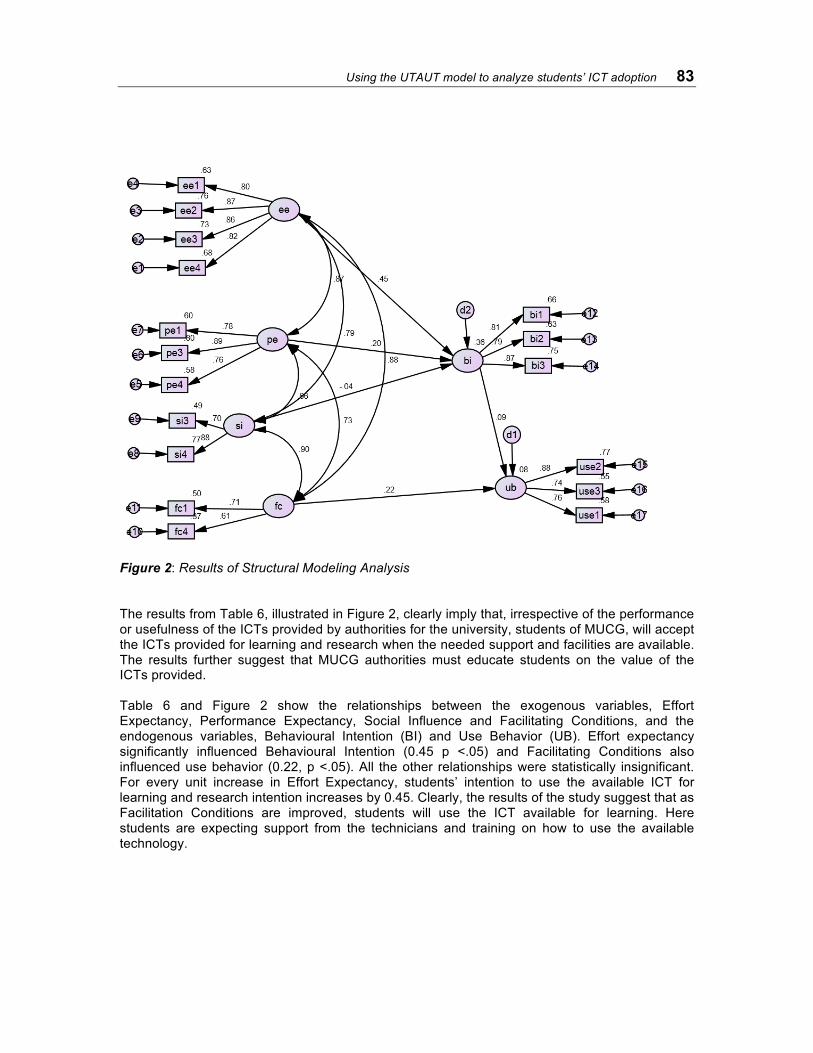
Figure 2: Results of Structural Modeling Analysis The results from Table 6, illustrated in Figure 2, clearly imply that, irrespective of the performance or usefulness of the ICTs provided by authorities for the university, students of MUCG, will accept the ICTs provided for learning and research when the needed support and facilities are available. The results further suggest that MUCG authorities must educate students on the value of the ICTs provided. Table 6 and Figure 2 show the relationships between the exogenous variables, Effort Expectancy, Performance Expectancy, Social Influence and Facilitating Conditions, and the endogenous variables, Behavioural Intention (BI) and Use Behavior (UB). Effort expectancy significantly influenced Behavioural Intention (0.45 p <.05) and Facilitating Conditions also influenced use behavior (0.22, p <.05). All the other relationships were statistically insignificant. For every unit increase in Effort Expectancy, students’ intention to use the available ICT for learning and research intention increases by 0.45. Clearly, the results of the study suggest that as Facilitation Conditions are improved, students will use the ICT available for learning. Here students are expecting support from the technicians and training on how to use the available technology.
84 IJEDICT
CONCLUSION This study provides insights into Ghanaian private tertiary students’ behaviour towards ICT usage when the Venkatesh et al.(2003) model was applied. The study concludes that of the hypotheses stated, Effort Expectancy, Performance Expectancy and Social Influence positively influence Behavioural Intentions to use ICT for learning by students of MUCG while Facilitating Conditions and Behavioural Intention directly influence MUCG students’ Use Behaviour of ICT provided for learning and research. Only Effort Expectancy and Facilitating conditions significantly predict students’ intention to use ICT and ICT use behaviour of students respectively. It is therefore imperative upon administrators to ensure that ICTs provided for learning and research are made friendly, easy to use and with requisite technical support. More students will formulate intention to use ICTs provided and subsequently use the ICTs for learning and research. The study also concludes that when these interventions are applied, students then incorporate ICT into their learning and research and appreciate the value of the ICTs provided and in turn advise their colleagues to use them. This paper used only the Social Studies and Business Administration Faculty students at a private university. It did not also address the effect of the moderating variables presented in the original UTAUT model. The researchers therefore recommend that future studies should include students from other faculties and multiple universities for more reliable results and conclusions. The study also recommends including other variables to improve the variance explained by the predictors, since there are variations in the research environments. REFERENCES Afarikumah, E and Acheampong A (2010), "Modeling computer usage intentions of tertiary
students in a developing country through the Technology Acceptance Model" .International Journal of Education and Development using Information and Communication Technology (IJEDICT), Vol. 6, Issue 1, pp. 102-116.
Agarwal, R., and Prasad, J (1998a), “A Conceptual and Operational Definition of Personal
Innovativeness in the Domain of Information Technology,” Information Systems Research (9:2), pp. 204-215.
Agarwal, R. and Prasad, J. (1998b), “The antecedents and consequents of user perceptions in
information technology adoption”. Decision Support Systems, Vol. 22 No. 1, pp. 15-29. Agarwal, R., and Prasad, J. (1997), “The Role of Innovation Characteristics and Perceived
Voluntariness in the Acceptance of Information Technologies,” Decision Sciences (28:3), 1997, pp. 557-582.
Ajzen, I. (1991) “The Theory of Planned Behavior,” Organizational Behavior and Human Decision
Processes (50:2), pp. 179-211. Azlina,.A, Razak, F. and Abdulla, W. (2013), "Assessing the effects of UTAUT and Self
Determination Predictor on Students Continuance Intention to Use Student Portal", World Applied Sciences Journal 21 pp. 1484-1489
Bandura, A. (1986),"Social Foundations of Thought and Action: A Social Cognitive Theory",
Prentice Hall, Englewood Cliffs, NJ,.
Using the UTAUT model to analyze students’ ICT adoption 85
Bagozzi, R.P. and Yi,Y.(1988) "On the Evaluation of Structural Equation Models," Journal of the Academy of Marketing Science, 16, pp 74-94.
Birch and Irvine, V. (2009),"Preservice teachers’ acceptance of ICT integration in the classroom:
applying the UTAUT model", Educational Media International Vol. 46, No. 4, December 2009, 295–315
Browne, M. W., &Cudeck, R. (1993). "Alternative ways of assessing model fit." In: K. A. Bollen &
J. S. Long (Eds.), Testing structural equation models (pp. 136-162). Beverly Hills, CA: Sage.
Calvert, S., Rideout, V., Woolard, J., Barr, R., & Strouse, G. (2005)."Age ,ethnicity, and
socioeconomic patterns in early computer use: a national survey". American Behavioral Scientist, 48 (5), 590-607.
Chau, P.Y.K. and Hu, P.J.-H. (2001), “Information technology acceptance by professionals: A
model comparison approach,” Decision Sciences, 32(4), 699-719. Chin, W. W. and Todd, P. A. (1995), "On the Use, Usefulness, and Ease of Use of Structural
Equation Modeling in MIS Research: A Note of Caution," MISQuarterly (19) 2 (June), pp. 237-246.
Creswell, J. W.(2009),"Research Design: Qualitative, Quantitative, and Mixed Methods
Approaches."3rd Edition. Los Angeles: Sage Publications, Inc., Davis, F. D. (1989),"Perceived usefulness, perceived ease of use, and user acceptance of
information technology", MIS Quarterly, 13(3) pp 319-340. Davis, F. D., Bagozzi, R. P., and Warshaw, P. R. (1989). "User acceptance of computer
technology: A comparison of two theoretical models". Management Science, 35(8), pp 982–1003.
Davis F., Bagozzi, R., and Warshaw, P. (1992),"Extrinsic and Intrinsic Motivation to Use
Computers in the Workplace" .Journal of Applied Social Psychology, 22(14), pp1111- 1132.
Fishbein, M., and Ajzen, I. (1975),"Belief, Attitude, Intention and Behavior: An Introduction to
Theory and Research", Addison-Wesley, Reading, MA,. Gülbahar, Y. (2007),"Technology planning: A roadmap to successful technology integration in
schools" Computers & Education, vol. 49, no. 4, pp. 943-956. Hair, J. F., Jr., Anderson, R. E., Tatham, R. L., and Black W. C. (1998),"Multivariate Data
Analysis with Readings",5th Edition. Englewood Cliffs, NJ: Prentice Hall. Hair, J. F., Jr., Anderson, R. E., Tatham, R. L. and Black W. C. (2010),"Multivariate Data
Analysis", 7th Edition. Englewood Cliffs, NJ: Prentice Hall Han, S (2003), "Individual Adoption of Information Systems in Organizations: A literature review
of technology acceptance model", TUCS Technical Report 540, TUCS Hartwick, J. and Barki H. (1994) ,"Explaining the Role of User Participation in Information System
Use", Management Science, 40, 4, pp 440-465
86 IJEDICT
Laudon, K. C. and Laudon, J. P (2010). “Management Information Systems: Managing the Digital
Firm”. New Jersey: Pearson Education , Upper Saddle River Loogma, K., Kruusvall, J. and Ümarik, M (2012), "E-learning as innovation: Exploring
innovativeness of the VET teachers’ community in Estonia", Computers & Education, Vol. 58(2) pp 808-817
Rogers, E.M. (1995), Diffusion of Innovation, Free Press, New York, NY. Taylor, S., and Todd, P. A.(1995a) “Assessing IT Usage: The Role of Prior Experience,” MIS
Quarterly (19:2), pp. 561-570. Taylor, S., and Todd, P. A. (1995b) “Understanding Information Technology Usage: A Test of
Competing Models,” Information Systems Research (6:4), pp. 144-176. Thompson, R. L., Higgins, C. A., and Howell, J. M. (1991) “Personal Computing: Toward a
Conceptual Model of Utilization,” MIS Quarterly (15:1), pp. 124-143 Thompson, R. L., Higgins, C. A., and Howell, J. M. “Influence of Experience on Personal
Computer Utilization: Testing a Conceptual Model" Journal of Management Information Systems Vol. 11 No. 1, pp. 167 - 187
Venkatesh, V., Morris, M., Davis, G., and Davis, F. (2003)."User Acceptance of Information
Technology: Toward a Unified View". MIS Quarterly, Vol. 27 (3), pp. 425-478. Vikashkumar, J. (2005),"Technology integration in education in developing countries: Guidelines
to policy makers", International Education Journal, 2005, 6(4), pp. 467-483. White, N, Ringstaff, C, & Kelly L. (2002), "Getting the most from Technology in Schools.
Knowledge Brief" .Retrieved October 2, 2013, from http://www.wested.org/online_pubs/kn-02-01.pdf 2013
Copyright for articles published in this journal is retained by the authors, with first publication rights granted to the journal. By virtue of their appearance in this open access journal, articles are free to use, with proper
attribution, in educational and other non-commercial settings.
Original article at: http://ijedict.dec.uwi.edu/viewarticle.php?id=1895
Recommended