
Using Statewide Longitudinal Data Systems for Post-Using Statewide Longitudinal Data Systems for Post-School Outcomes Data CollectionSchool Outcomes Data Collection
State Capacity Building InstituteState Capacity Building InstituteMay 20, 2010May 20, 2010
Charlotte, North CarolinaCharlotte, North Carolina
Presented by:Presented by:Sheila Gritz, Florida Department of EducationSheila Gritz, Florida Department of Education
Jordan Knab, Project 10 (Transition Education Network)Jordan Knab, Project 10 (Transition Education Network)
Florida Department of EducationFlorida Department of EducationDr. Eric J. Smith, Dr. Eric J. Smith,
CommissionerCommissioner 1

Florida Education and Training Placement Information Program (FETPIP)
History
• Established in the Florida Department of Education – Legislative action in 1988
• Negotiated an arrangement with the Department of Labor and Employment Security
2
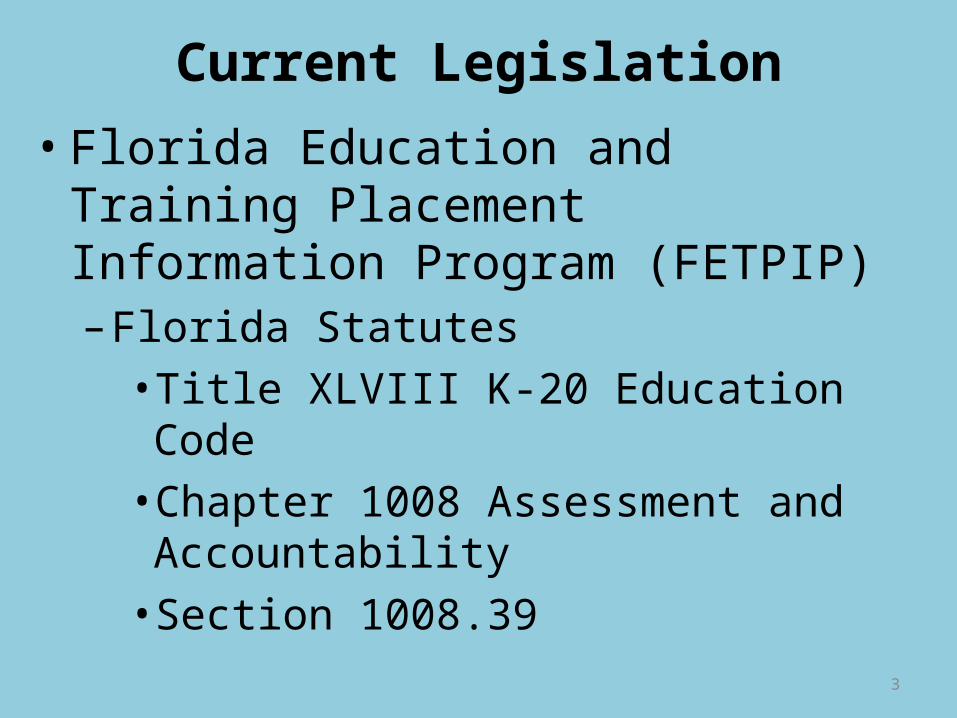
Current Legislation• Florida Education and Training Placement
Information Program (FETPIP)– Florida Statutes
• Title XLVIII K-20 Education Code• Chapter 1008 Assessment and
Accountability• Section 1008.39
3
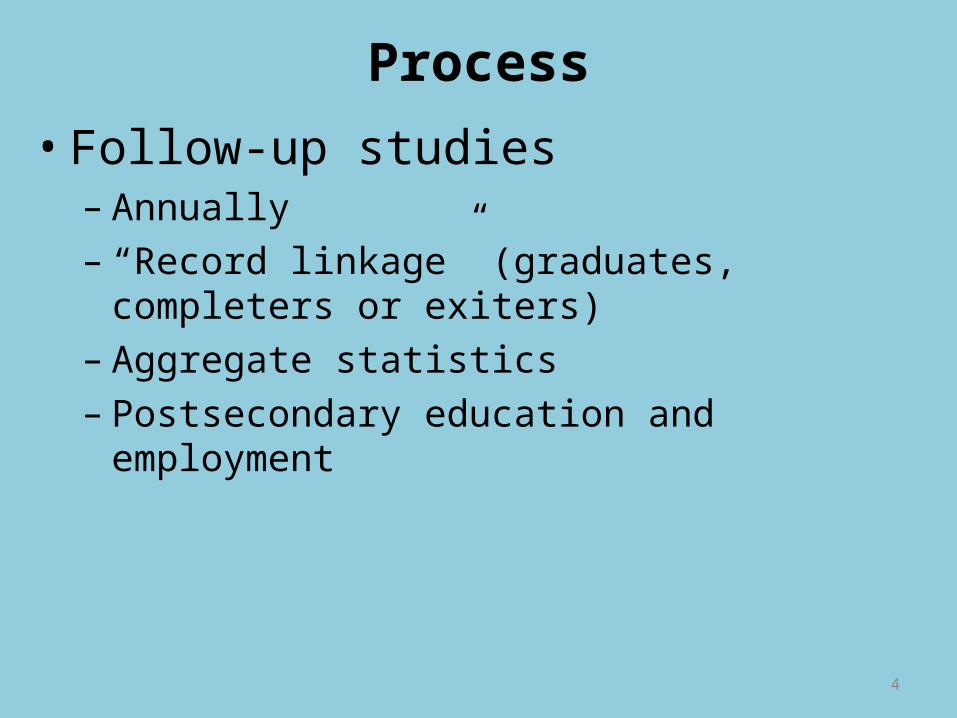
Process• Follow-up studies
– Annually – “Record linkage” (graduates, completers or exiters)– Aggregate statistics– Postsecondary education and employment
4
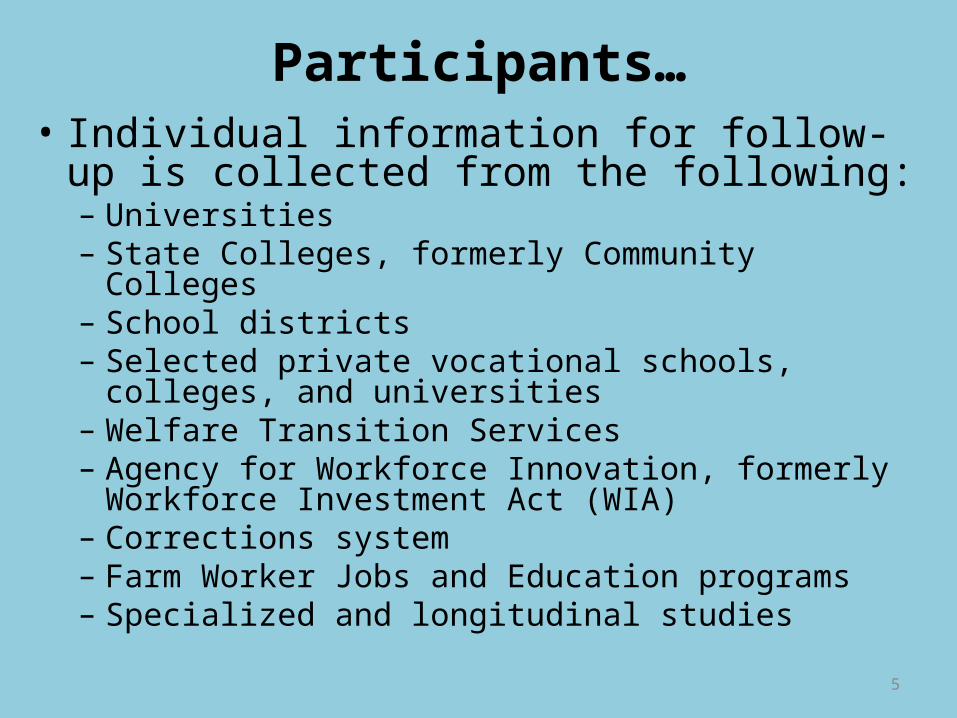
Participants…• Individual information for follow-up is collected
from the following:– Universities– State Colleges, formerly Community Colleges– School districts– Selected private vocational schools, colleges, and
universities– Welfare Transition Services– Agency for Workforce Innovation, formerly Workforce
Investment Act (WIA)– Corrections system– Farm Worker Jobs and Education programs– Specialized and longitudinal studies
5
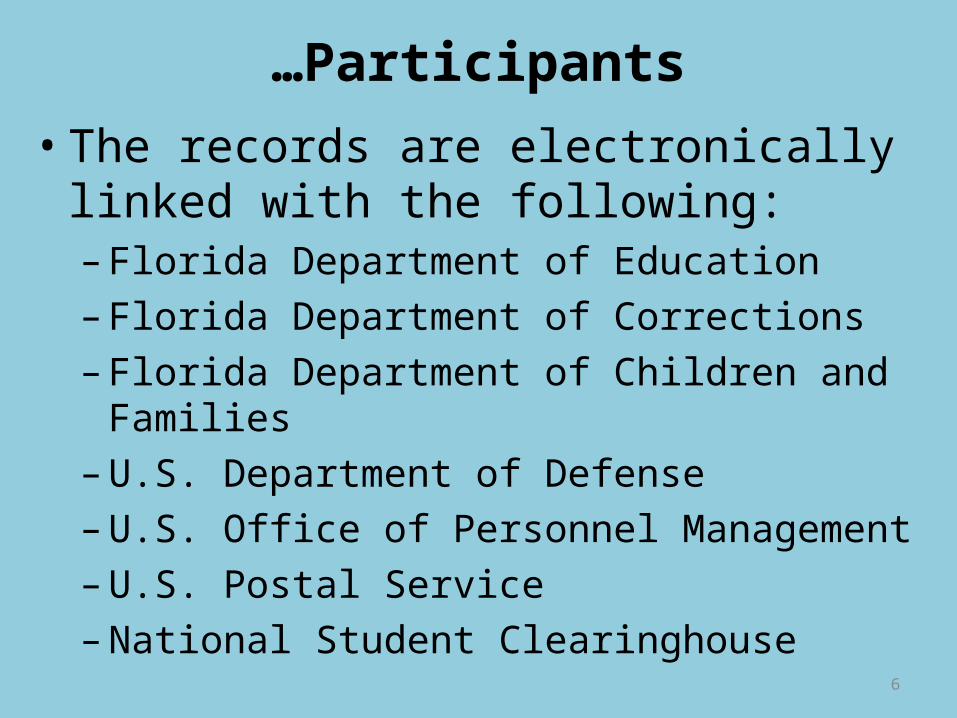
…Participants• The records are electronically linked with
the following:– Florida Department of Education– Florida Department of Corrections– Florida Department of Children and Families– U.S. Department of Defense– U.S. Office of Personnel Management– U.S. Postal Service– National Student Clearinghouse
6
Support• Statutory authority• Funding• Collaboration • Anticipating needs• Stakeholder buy-in• Facilitating discussion
7
Security..• Location within the state education agency• Surpasses requirements and expectations for
security• Limits use to statistical purposes for evaluation
and program improvement• Exchange agreements kept current, and
employees and stakeholders apprised of security and confidentiality issues
• Inquiries about particular resources relayed to resource owners
8

…Security• All individually identifiable data are
protected from public disclosure as specified in the Buckley Amendments and Florida Statutes.
• Fields less than 10 are suppressed.• Districts may access reports with less than
10 with confidentiality statements and notes that “only aggregates of 10 or more can be publicly disseminated.”
9
Use of Data• Employment• Earnings by level• Federal employment data• Continuing education data• Receiving public assistance• Florida Department of Corrections Data
10
Benefits• Existing data resources• Cost efficient, accurate, more capabilities• Objective data• Common core set of outcome measures,
comparisons, discussions
11
Dissemination of Data• Aggregate numbers posted in LEA profiles
and selected reports• LEA data by exceptionality and outcome
sent directly to districts• Broader data on Florida Department of
Education website
12
Suggested District Activities: Data
• Access data and ensure accuracy.• Review and analyze multiple years of
FETPIP data to determine whether an area is consistently problematic.
• Determine if there are trends among groups.
• Disseminate data to all relevant stakeholders (e.g., administrators, teachers).
13
Suggested District Activities: Policies, Procedures and Practices
• Review district and school policies and procedures to determine if existing policies or procedures may be impacting postsecondary outcomes.
• Review inter-institutional agreements and interagency agreements to determine if provisions need to be changed or added to improve postsecondary outcomes.
• Identify and implement evidence-based practices that are known to impact employment and/or postsecondary education outcomes.
14

Suggested District Activities: Training and Technical Assistance
• Identify areas of need and develop a schedule of professional development activities designed to impact postsecondary outcomes.
15

State and Project 10: District Impact
• Explaining how data is collected• Helping districts understand how to read
the data• Assisting districts with identifying
evidence-based practices tied to improving poor outcome areas
16
Resources• Florida Department of Education FETPIP website
– http://www.fldoe.org/fetpip/ • National Post-School Outcomes Center, State Profile Archives
– http://www.psocenter.org/state_profiles_archive.html#FL– Pfeiffer, J. (2005). Florida’s experience in accessing administrative records.
National Post-school Outcomes Center Teleconference. – Pfeiffer, J. (2004). Student follow-up using state and federal administrative
records: Lessons from Florida’s education and training placement information program (FETPIP).
– Pfeiffer, J., (2003). Overview of federal laws pertaining to sharing of individually-identifiable education records.
• Achieving the Dream– http://www.achievingthedream.org/DATARESEARCH/
PUBLICATIONSANDPRESENTATION/default.tp – Mills, J. (2005). State data systems and privacy concerns: Strategies for
balancing public interests. An Achieving the Dream Policy Brief. 17
For additional information:• Sheila Gritz, Program Specialist for Transition
Florida Department of EducationBureau of Exceptional Education and Student Serviceshttp://www.fldoe.org/ese/ [email protected](850) 245-0478
• Jordan Knab, Ed.S., Project DirectorUniversity of South Florida St. Petersburg529 1st Street South, SVB 108St. Petersburg, FL 33701http://www.project10.info [email protected](727) 873-4662
18

Questions?Questions?
19

“UTILIZING DATA TO DIAGNOSE THEN TREAT”Program Evaluation & Improvement
Utilizing Data to Identify Strengths & improve Challenging Areas
___________District
20

Presented By:Federico Valadez Jr., M.Ed.,
Regional Transition Representative, Region 4
University of South Florida St. PetersburgProject 10
529 1st Street South, SVB 108St. Petersburg, FL 33701
p (727) 873-4661f (727) 873-4660
21
Objectives• Understand the importance of data• Understand local school demographics; population
demographics, and major economic industries/employers• Understand where to find data on Florida Department of
Education (FDOE) website• Understand the importance of Local Education Agency (LEA)
Profile for improving performance• Understand district strengths & challenges by reviewing
monitoring self-assessment results• Understand that breaking down the data to the school level can
assist with capacity building in terms of focused training and technical assistance to improve outcomes at each school
22

Why does a doctor take vital signs, x-rays, etc…?
23
Demographic Data• Ethnic/racial make up of the
community (using Census Data)• Number of individuals with
disabilities (using Census Data)• Major industries and employers in
the community– http://www.census.gov/– http://www.onetcenter.org/tools.html
24

Why Compare?Comparing yourself to the state and size-alike school districts is a good way to see how well you are doing and where you might need improvement – much like going to the doctor to see how healthy you are or if you might need some medication to help make you better.
25
Where to find data? FDOE Data– http://www.fldoe.org/ese/datapage.asp
• Exercises:1. How many African-American and
Hispanic students are currently enrolled in your school district?
2. What percent are classified as EBD?3. How does your ratio of these students
compare to the state data? 4. If the number is less or greater than the
state data, are you doing well or do you need to improve? 26
The LEA Profile… The profile is intended to provide districts with a tool for use in planning for systemic improvement in exceptional student education programs.
The profile contains a series of data indicators that describe measures of educational benefit, educational environment, prevalence, parent involvement and provides information about district performance as compared to state level targets in Florida’s State Performance Plan.
27

…The LEA Profile Required by IDEA 2004, the State Performance Plan (2005-2010) is a six-year plan that establishes annual benchmarks and targets for 20 indicators. Annual Performance Reports are submitted to report progress in these performance areas and the process requires annual public reporting for the state and each local education agency.
28
The LEA profile
Introduction: Demographics
Section One: Educational Benefit
Section Two: Educational Environment
Section Three: Prevalence
Section Four: Parental Involvement
Section Five: State Performance Plan Indicators
29
Introduction: Demographics
1)District Name
2)Student Enrollment
3)Enrollment Group
4)Percentage of Students with Disabilities
30
Section One: Educational Benefit
•No Child Left Behind (NCLB) Graduation Rate
•Standard Diploma Graduation Rate
•Dropout Rate
•Postschool Outcome Data
31
Section Two: Educational Environment
•Students with disabilities ages 6-21 by placement setting and children with disabilities ages 3-5 by placement setting
•Part C to Part B transition
•Secondary Transition IEPs
•Discipline Rates and Risk Ratios•Students with disabilities suspended/expelled for more than 10 days in a school year
32
Section Three: Prevalence
•Evaluations completed within 60 days •Student membership by race/ethnicity
•Risk ratios of racial/ethnic groups being identified as disabled
33

Section Four: Parent Involvement
•Survey of Parent Perceptions•Preschool•K-12
34
Section Five: State Performance Indicators
•Summary information on selected State Performance Plan Indicators •State level targets
•District level data
Do you know all 20 of the Indicators?Go to the last page of your LEA Profile and let’s review the Indicators and examine your school district’s data.
35
Section Five: State Performance Indicators
Let’s examine your data.
•Where did you meet the target?
•Where did you not meet the target?
Make the best use of capacity building/training/ technical assistance resources.
Can you break this data down even further by school to determine which school might need more assistance in making improvements (i.e., There might be a high school with a low graduation rate or a high dropout rate…one might focus on helping that particular school more.)?
36
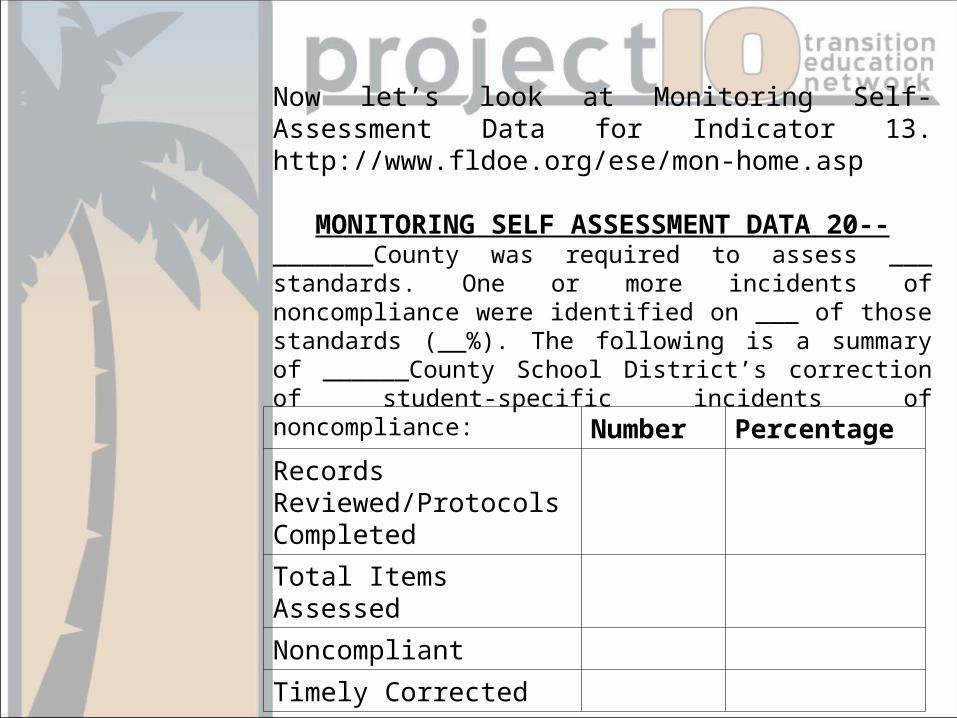
Number Percentage
Records Reviewed/Protocols Completed
Total Items Assessed
Noncompliant
Timely Corrected
Now let’s look at Monitoring Self-Assessment Data for Indicator 13. http://www.fldoe.org/ese/mon-home.asp
MONITORING SELF ASSESSMENT DATA 20--_______County was required to assess ___ standards. One or more incidents of noncompliance were identified on ___ of those standards (__%). The following is a summary of ______County School District’s correction of student-specific incidents of noncompliance:
SELF-ASSESSMENT DATA for Indicator 132008-09…
•Let’s review the sections where you are doing well.
•Let’s review the sections where you need improvement.
…SELF-ASSESSMENT DATA for Indicator 13 2008
•Can you break down this data even further?•Yes, which school(s) were the particular IEP Folders pulled from with concerns/challenges?•Is training around the areas of need being implemented at each school?
owriting measurable postsecondary goalsowriting measurable annual goalso inviting agencieso getting consent…

Now we know your vital signs…what’s next…
40

Important Points to Remember &
Questions
41
Recommended


![[XT] Longitudinal Data/Panel Data - Stata](https://img.pdfslide.us/doc/110x75/620398a5da24ad121e4b3ee7/xt-longitudinal-datapanel-data-stata.jpg)