Using Remote Sensing toOptimize Management
Strategies for Invasive Plant Control
Jim BeanJennifer Vollmer, Ph.D.
Daniel WattsProfessional Vegetation Management Group
BASF Corporation
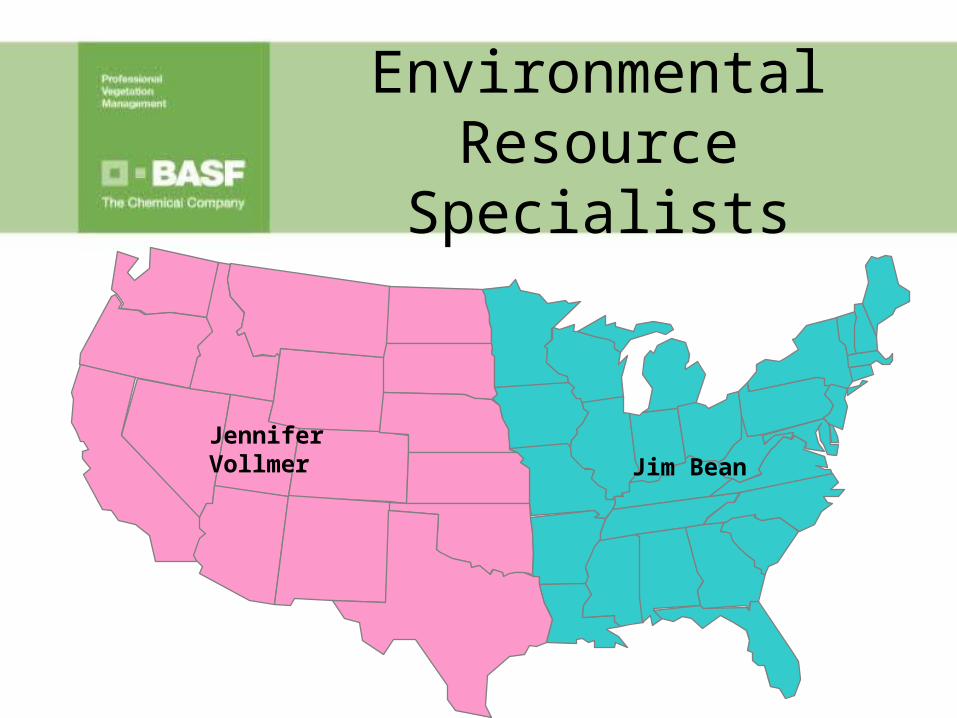
Environmental Resource Specialists
Jennifer VollmerJim Bean
Why Map?
• Diagnose the problem• ‘Lookout Towers’ / Early detection• Search & (rescue) destroy• Create inventory: what, where, how much• More efficient use of resources
Weed survey is an important aspect of land health
Choosing a Method
• How large is the area?
• How long will it take?
• How much will it cost?
• Will methods meet the goals?
Hyper-spectral Imaging
• Photo imaging by aircraft• Full coverage• Multiple weeds• Multiple non-weeds• Abundance / Density• GIS layer• Treatment Optimization
– Can reduce treatment cost and increase herbicide efficiency
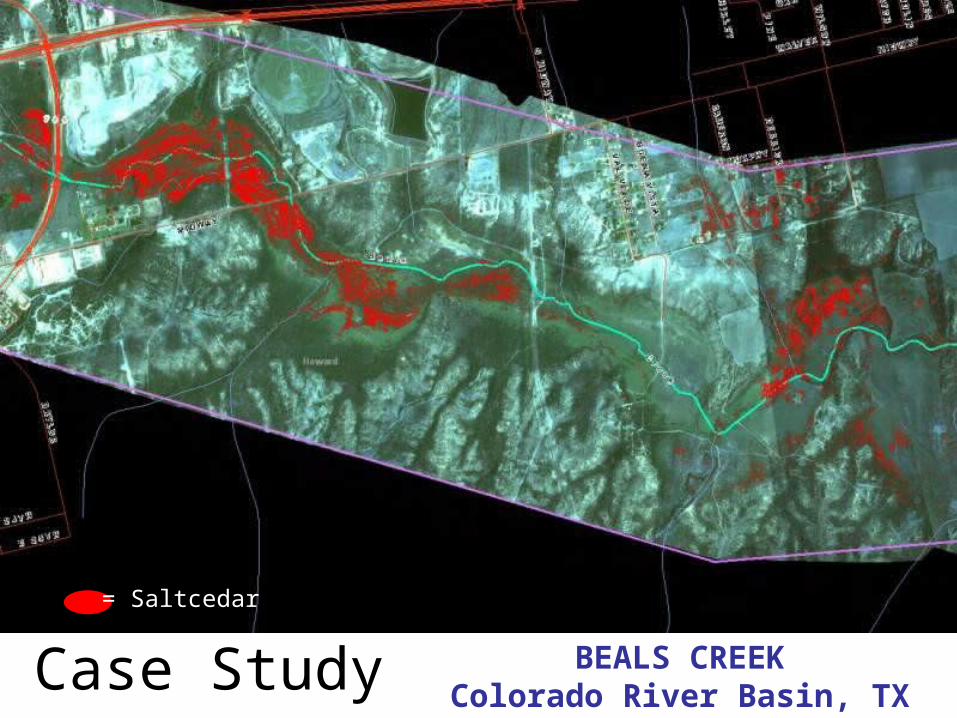
BEALS CREEKColorado River Basin, TXCase Study
= Saltcedar
Actual Northstar treatment map
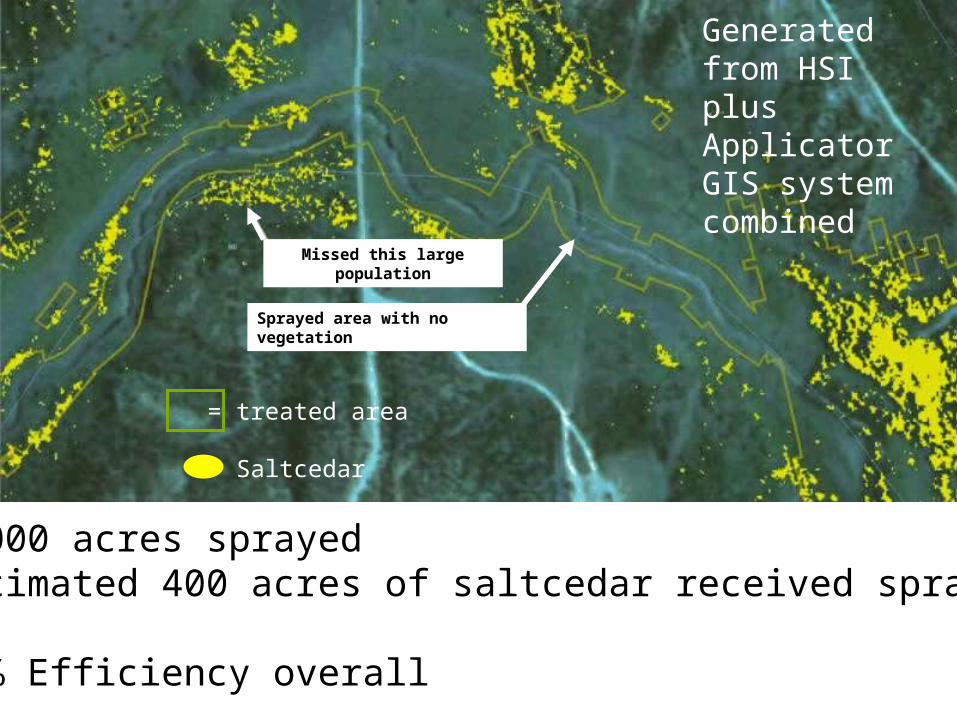
Generated from HSI plus Applicator GIS system combined
~1000 acres sprayedEstimated 400 acres of saltcedar received spray
40% Efficiency overall
= treated area
= Saltcedar
Sprayed area with no vegetation
Missed this large population
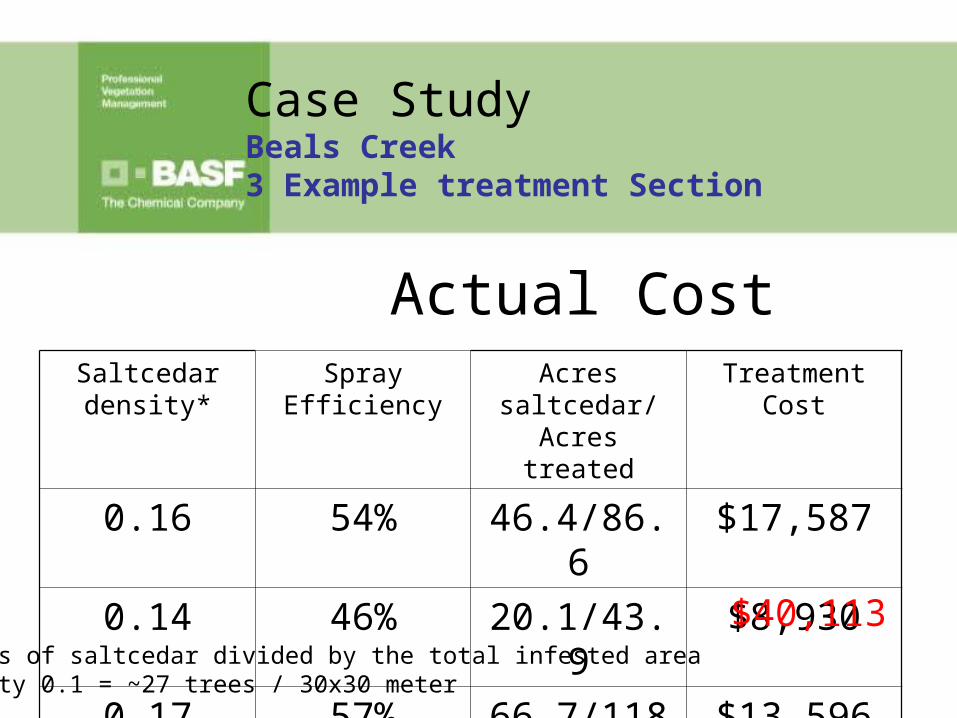
Actual CostSaltcedar density*
Spray Efficiency Acres saltcedar/Acres treated
Treatment Cost
0.16 54% 46.4/86.6 $17,587
0.14 46% 20.1/43.9 $8,930
0.17 57% 66.7/118 $13,596$40,113
•Acres of saltcedar divided by the total infested areaDensity 0.1 = ~27 trees / 30x30 meter
Case Study Beals Creek3 Example treatment Section
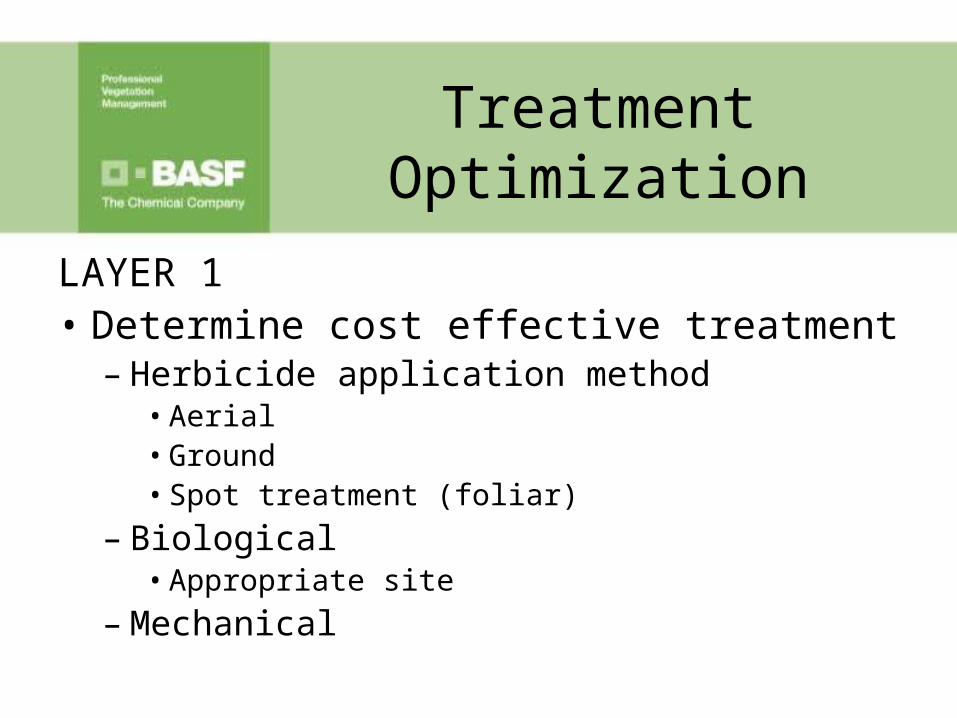
Treatment Optimization
LAYER 1• Determine cost effective treatment
– Herbicide application method• Aerial• Ground• Spot treatment (foliar)
– Biological• Appropriate site
– Mechanical
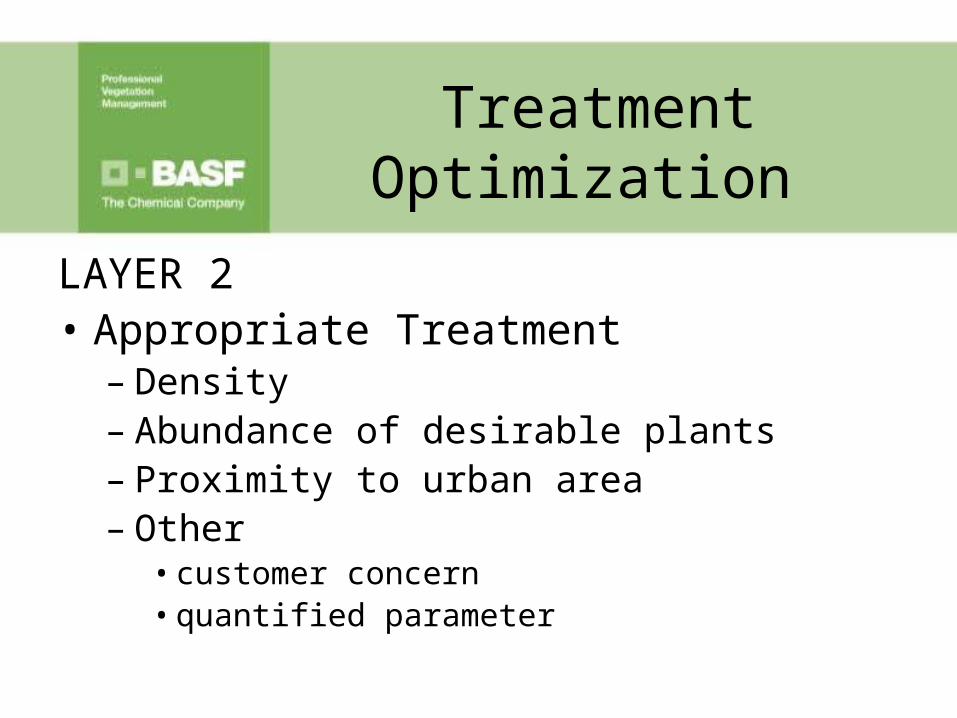
Treatment Optimization
LAYER 2• Appropriate Treatment
– Density– Abundance of desirable plants – Proximity to urban area– Other
• customer concern• quantified parameter
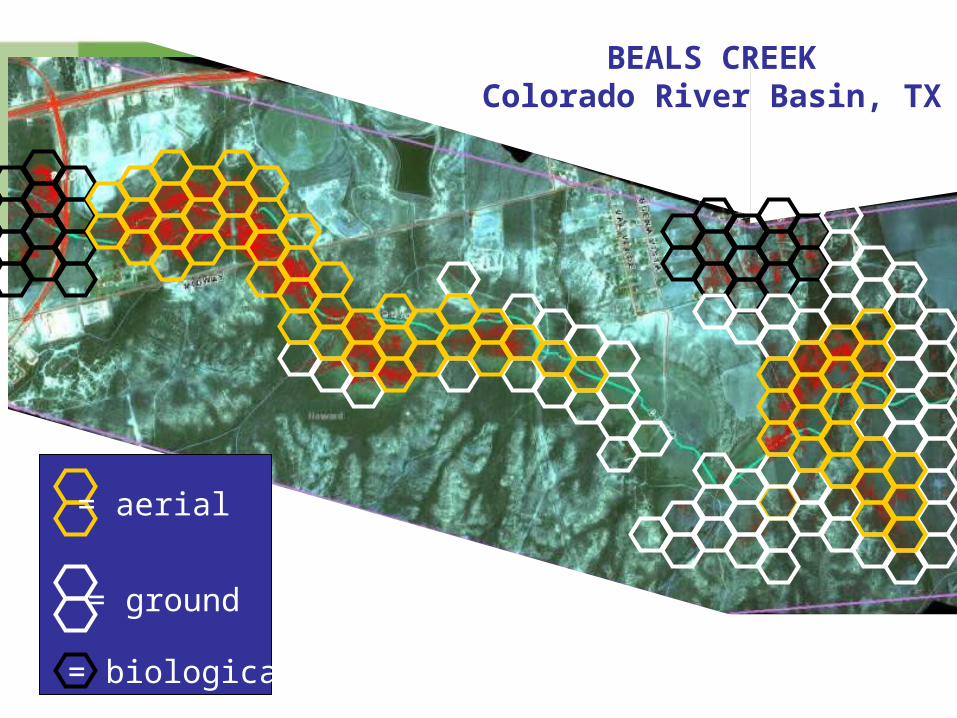
= aerial
= ground
= biological
BEALS CREEKColorado River Basin, TX
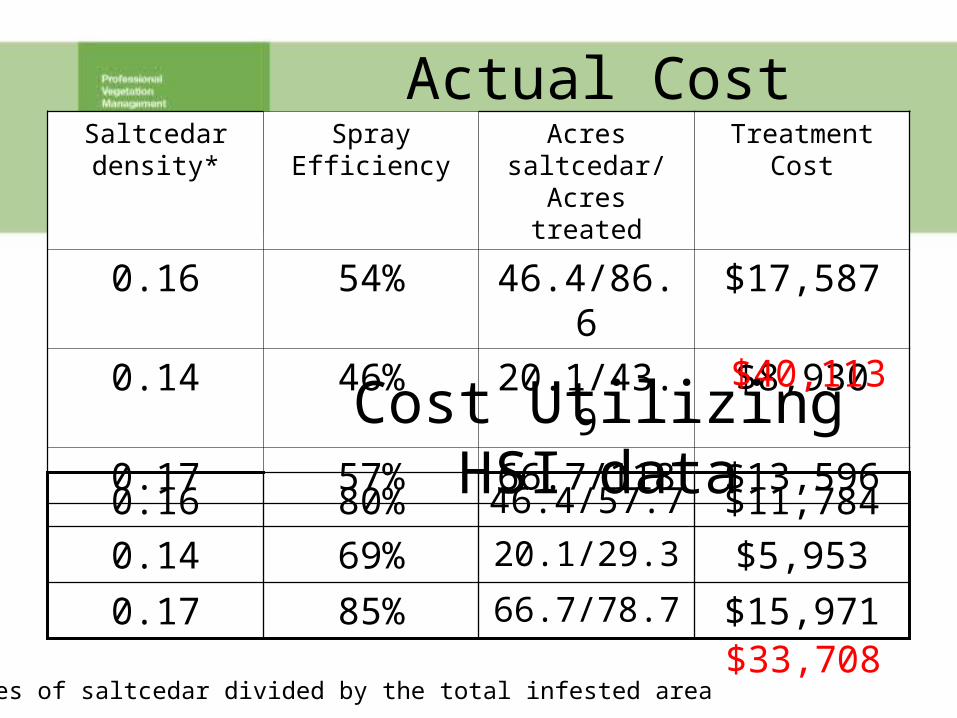
Actual CostSaltcedar density*
Spray Efficiency Acres saltcedar/Acres treated
Treatment Cost
0.16 54% 46.4/86.6 $17,587
0.14 46% 20.1/43.9 $8,930
0.17 57% 66.7/118 $13,596$40,113
$15,97166.7/78.785%0.17
$5,95320.1/29.369%0.14
$11,78446.4/57.780%0.16
$33,708
Cost Utilizing HSI data
* Acres of saltcedar divided by the total infested area
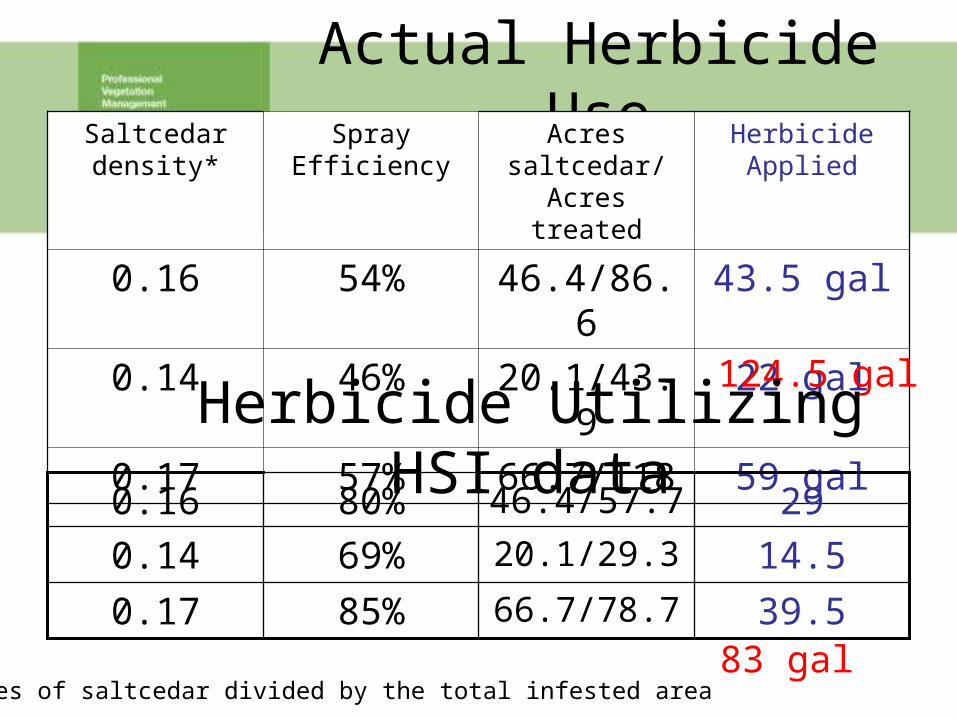
Actual Herbicide UseSaltcedar density*
Spray Efficiency Acres saltcedar/Acres treated
Herbicide Applied
0.16 54% 46.4/86.6 43.5 gal
0.14 46% 20.1/43.9 22 gal
0.17 57% 66.7/118 59 gal124.5 gal
39.566.7/78.785%0.17
14.520.1/29.369%0.14
2946.4/57.780%0.16
83 gal
Herbicide Utilizing HSI data
* Acres of saltcedar divided by the total infested area
Treatment Optimization
LAYER 3
• Appropriate Treatment– Fuel management need– Site Access– Landowner preference– Aesthetics
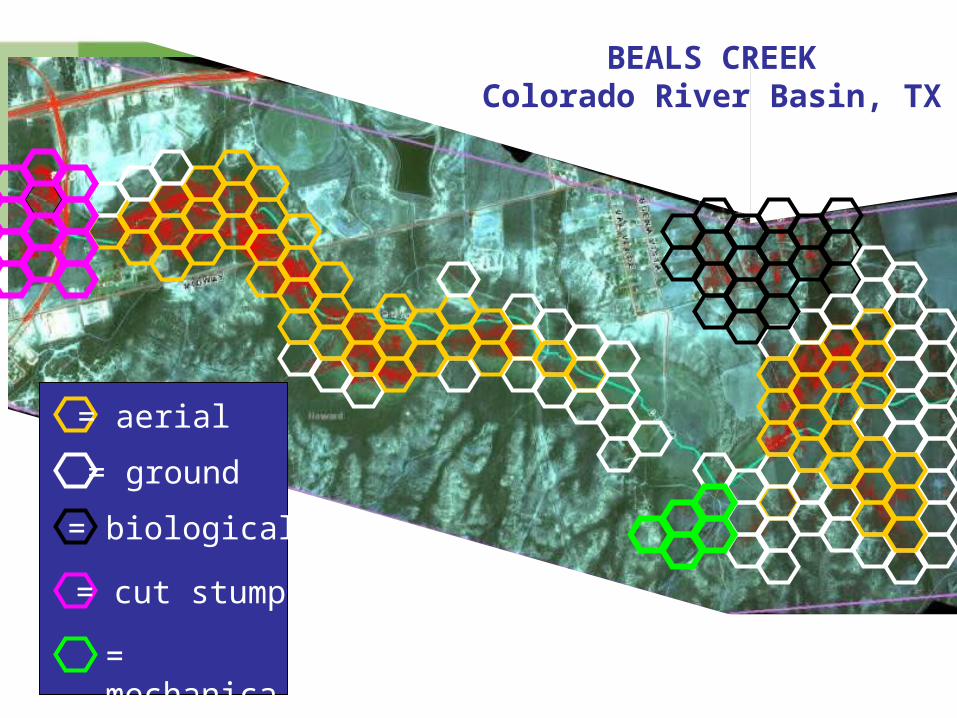
= aerial
= ground
= biological
= mechanical
= cut stump
BEALS CREEKColorado River Basin, TX
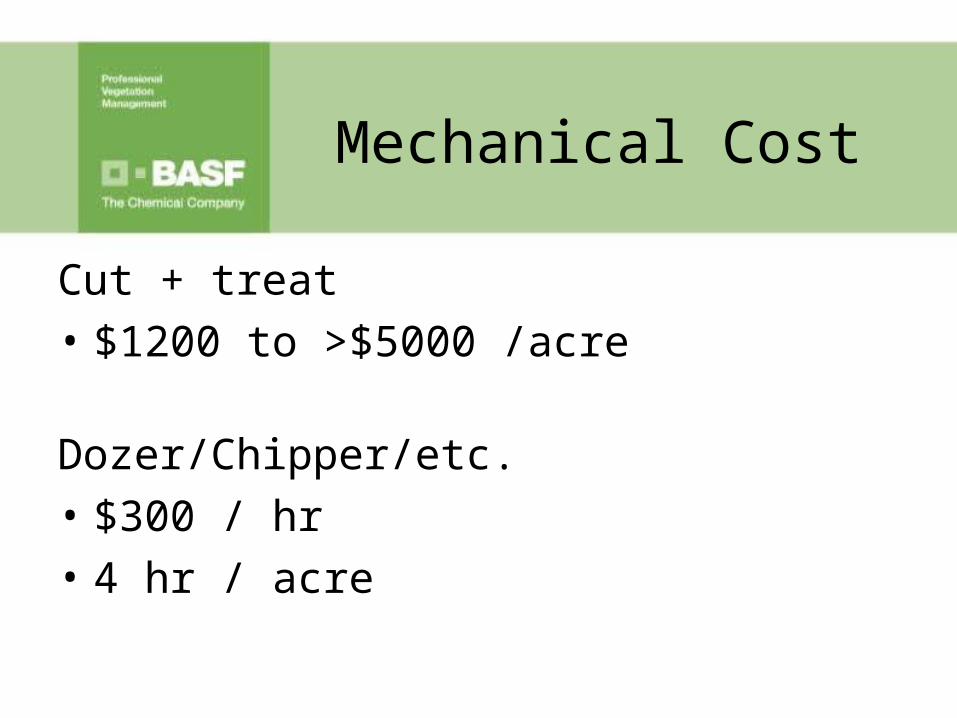
Mechanical Cost
Cut + treat
• $1200 to >$5000 /acre
Dozer/Chipper/etc.
• $300 / hr
• 4 hr / acre
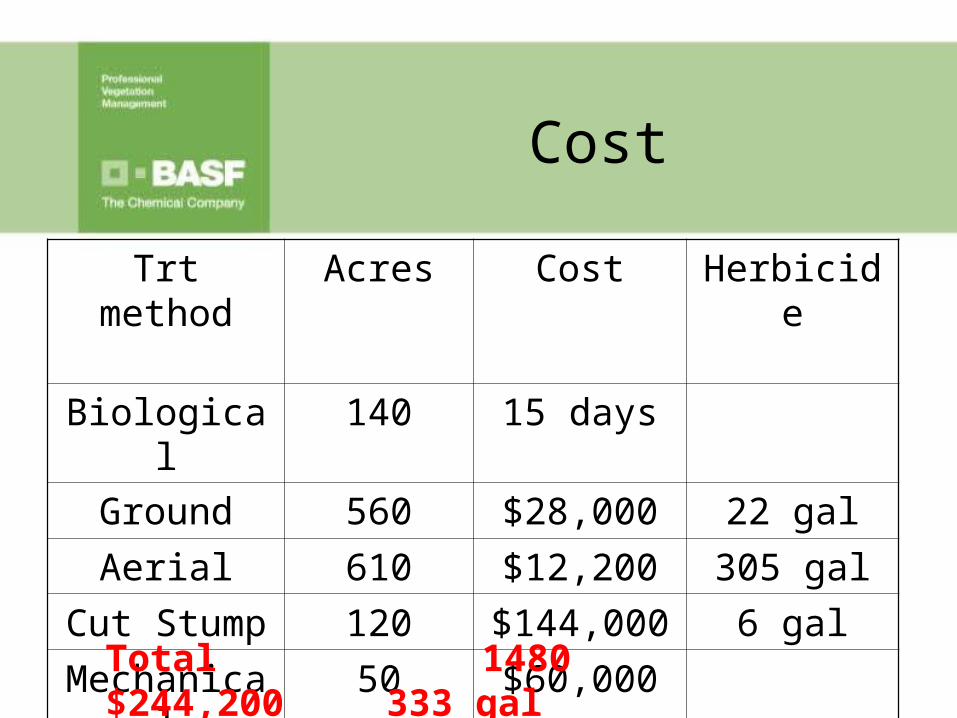
Cost
Trt method Acres Cost Herbicide
Biological 140 15 days
Ground 560 $28,000 22 gal
Aerial 610 $12,200 305 gal
Cut Stump 120 $144,000 6 gal
Mechanical 50 $60,000
Total 1480 $244,200 333 gal
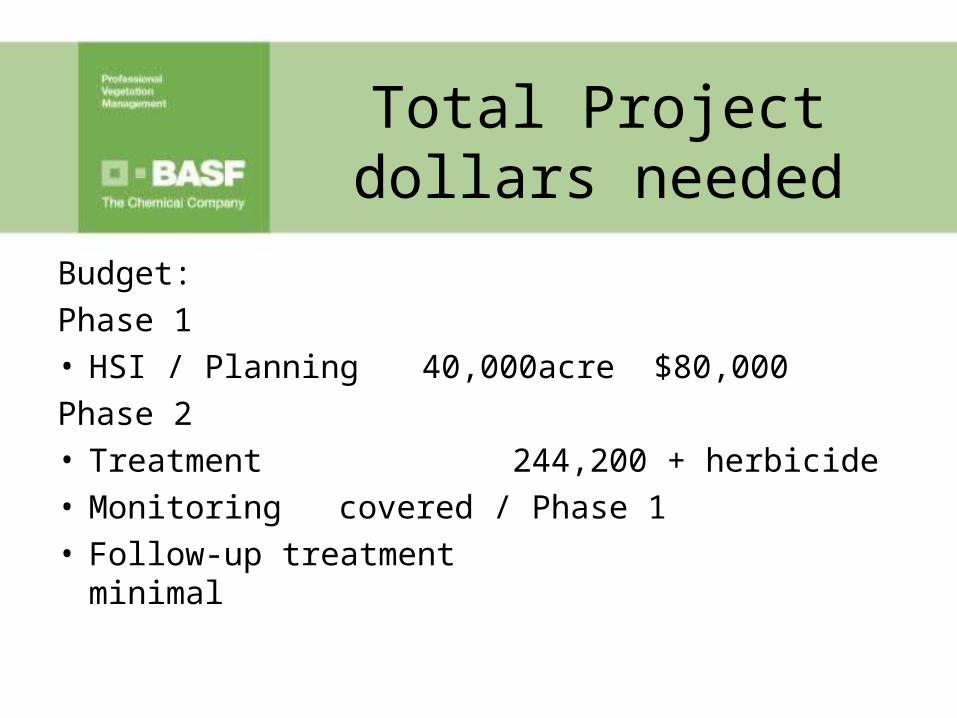
Total Project dollars needed
Budget:
Phase 1• HSI / Planning 40,000acre $80,000
Phase 2• Treatment 244,200 + herbicide• Monitoring covered / Phase 1• Follow-up treatment minimal
Benefits
• Many uses of remote sensing data
• Treatment optimization
• Most efficient use of resources
• Monitor and measure effectiveness
Summary
BASF would like to discuss your remote sensing needs
[email protected] (east)
[email protected] (west)
Thank You!
Recommended


![Remote Sensing Time Series for Modeling Invasive Species ... Sensing...tamarisk distribution on small scales often using high spatial resolution [Ge et al. 2006] or hyperspectral data](https://img.pdfslide.us/doc/110x75/5ff95f17c0053c722927d77d/remote-sensing-time-series-for-modeling-invasive-species-sensing-tamarisk.jpg)