
1
Using a Speed-Dependent Voigt Line Shape to Retrieve O2 from 1
Total Carbon Column Observing Network Solar Spectra to Improve 2
Measurements of XCO2 Improving the Retrieval of XCO2 from 3
Total Carbon Column Network Solar Spectra 4
Authors: Joseph Mendonca1, Kimberly Strong1, Debra Wunch1, Geoffrey C. Toon2, David A. 5
Long3, Joseph T. Hodges3, Vincent T. Sironneau3, and Jonathan E. Franklin4. 6
1. Department of Physics, University of Toronto, Toronto, ON, Canada 7
2. Jet Propulsion Laboratory, Pasadena, CA, USA 8
3. National Institute of Standards and Technology, Gaithersburg, MD, USA 9
4. Harvard John A. Paulson School of Engineering and Applied Sciences, Cambridge, MA, USA 10
Correspondence to: Joseph Mendonca ([email protected]) 11
Abstract. High-resolution absorption spectra of the 𝑎1∆𝑔← 𝑋3𝛴𝑔− oxygen(O2) band measured using cavity ring-12
down spectroscopy were fitted using the Voigt and speed-dependent Voigt line shapes. We found that the speed-13
dependent Voigt line shape was better able to model the measured absorption coefficients than the Voigt line shape. 14
We used these line shape models to calculate absorption coefficients to retrieve atmospheric Ttotal columns 15
abundances of O2 were retrieved from ground-based high-resolution absorption spectra from four Fourier transform 16
spectrometers that are apart of the Total Carbon Column Observing Network (TCCON) sites using both Voigt and 17
speed-dependent Voigt line shapes to calculate absorption coefficients. A lLower O2 concentration total columns 18
was were retrieved with the speed-dependent Voigt line shape, with and the difference between the total columns 19
retrieved using the Voigt and speed-dependent Voigt line shapes increasing increased as a function of solar zenith 20
angle. Previous work has shown that carbon dioxide (CO2) total columns were also retrieved from the same spectra 21
using a Voigt line shape and are better retrieved using a speed-dependent Voigt line shape with line mixing. The 22
column-averaged dry-air mole fraction of CO2 (XCO2) was calculated using the ratio between the columns of CO2 23
and O2 columns retrieved (from the same spectra) with both line shapes from measurements made over a one-year 24
period at the four sites. and compared. The inclusion of speed dependence in the O2 retrievals significantly reduces 25
the airmass dependence of XCO2. The TCCON empirical airmass correction factor for XCO2 derived from a year of 26
measurements from TCCON sites at Darwin, Lamont, and Park Falls for XCO2 improved from -0.0071±0.0057 to -27
0.0012±0.0054 when speed dependence was included. XCO2 retrieved with the Voigt and speed-dependent Voigt 28
line shapes was compared to aircraft profiles measured at 13 TCCON sites. T and the bias between the TCCON 29
measurements and the calibrated integrated aircraft profile measurements was reduced from 0.9897±0.0005 1% to 30
1.0041±0.0005 4%. for XCO2 retrieved with the Voigt and speed-dependent Voigt line shapes respectively. These 31
results suggest that speed dependence should be included in the forward model when fitting near-infrared CO2 and 32
O2 spectra to improve the accuracy of XCO2 measurements. 33

2
1. Introduction 34
Accurate remote sensing of greenhouse gases (GHGs), such as CO2, in Earth’s atmosphere is important for studying 35
the carbon cycle in order to better understand and predict climate change. The absorption of solar radiation by O2 in 36
the Earth’s atmosphere is important because it can be used to study the properties of clouds and aerosols, and to 37
determine vertical profiles of temperature and surface pressure. Wallace and Livingston (1990) were the first to 38
retrieve total columns of O2 from some of the discrete lines of the 𝑎1∆𝑔← 𝑋3𝛴𝑔− band of O2 centered at 1.27 µm 39
(which will be referred to bellow as the 1.27 µm band) using atmospheric solar absorption spectra from the Kitt 40
Peak observatory. Mlawer et al. (1998) recorded solar absorption spectra in the near-infrared (NIR) region to study 41
collision-induced absorption (CIA) in the 𝑎1∆𝑔← 𝑋3𝛴𝑔− band of O2 centered at 1.27 µm (which will be referred to as 42
the 1.27 µm band) as well as two other O2 bands. The spectra were compared to a line-by-line radiative transfer 43
model and the differences between the measured and calculated spectra showed the need for better absorption 44
coefficients in order to accurately model the 1.27 µm band (Mlawer et al., 1998). Subsequently, spectroscopic 45
parameters needed to calculate the absorption coefficients from discrete transitions of the 1.27 µm band were 46
measured in multiple studies (Cheah et al., 2000; Newman et al., 1999, 2000; Smith and Newnham, 2000), as was 47
collision-induced absorption (CIA) (Maté et al., 1999; Smith and Newnham, 2000), while Smith et al. (2001) 48
validated the work done in Smith and Newnham (2000) using solar absorption spectra. 49
The 1.27 µm band is of particular importance to the Total Carbon Column Observing Network (TCCON) (Wunch 50
et al., 2011). TCCON is a ground-based remote sensing network that makes accurate and precise measurements of 51
GHGs for satellite validation and carbon cycle studies. Using the O2 column retrieved from solar absorption spectra, 52
the column-averaged dry-air mole fraction of CO2 (XCO2) has been shown to provide better precision than using the 53
surface pressure to calculate XCO2 (Yang et al., 2002) (Washenfelder et al., 2006). The O2 column is retrieved from 54
the 1.27 µm band because of its close proximity to the spectral lines used to retrieve CO2, thereby reducing the 55
impact of solar tracker mis-pointing and an imperfect instrument line shape (ILS) (Washenfelder et al., 2006). To 56
improve the retrievals of O2 from the 1.27 µm band, Washenfelder et al. (2006) found that adjusting the 57
spectroscopic parameters in HITRAN 2004 (Rothman et al., 2005) decreased the airmass and temperature 58
dependence of the O2 column. These revised spectroscopic parameters were included in HITRAN 2008 (Rothman et 59
al., 2009). Atmospheric solar absorption measurements from this band made at the Park Falls TCCON site by 60
Washenfelder et al. (2006) were the first measurements to observe the electric-quadrupole transitions (Gordon et al., 61
2010). Leshchishina et al. (2011, 2010) subsequently used cavity-ring-down spectra to retrieve spectroscopic 62
parameters for the 1.27 µm band using a Voigt spectral line shape and these parameters were included in HITRAN 63
2012 (Rothman et al., 2013). Spectroscopic parameters for the discrete spectral lines of the O2 1.27 µm band from 64
HITRAN 2016 (Gordon et al., 2017) are very similar to HITRAN 2012 except that HITRAN2016 includes 65
improved line positions reported by Yu et al. (2014). 66
Extensive spectral line shape studies have been performed for the O2 A-band, which is centered at 762 nm and used 67
by the Greenhouse Gases Observing Satellite (GOSAT) (Yokota et al., 2009) and the Orbiting Carbon Observing 68

3
Observatory-2 (OCO-2) satellite (Crisp et al., 2004) to determine surface pressure. These studies Studies have 69
showed shown that the Voigt line shape was is inadequate to describe the spectral line shape of the discrete O2 lines 70
in the A-band;. Dicke narrowing occurs when the motion of the molecule is diffusive due to collisions changing the 71
velocity and direction of the molecule during the time that it is excited. This diffusive motion is taken into account 72
by averaging over many different Doppler states resulting in a line width that is narrower than the Doppler width 73
(Dicke, 1953). The need to take into account Dicke narrowing was shown in Long et al. (2010) and Predoi-Cross et 74
al. (2008) found it necessary to use a spectral Line shape model that accounted for Dicke narrowing when fitting the 75
discrete lines of the O2 A-band. and Line mixing, which occurs when collisions transfer intensity from one part of 76
the spectral band to another (Lévy et al., 1992), was shown to be prevalent in multiple studies (Predoi-Cross et al., 77
2008; Tran et al., 2006; Tran and Hartmann, 2008). Tran and Hartmann (2008) showed that including line mixing 78
when calculating the O2 A-band absorption coefficients reduced the airmass dependence of the O2 column retrieved 79
from TCCON spectra. When fitting cavity ring-down spectra of the O2 A-band, Drouin et al. (2017) found it 80
necessary to use a speed-dependence Voigt line shape, which takes into account different speeds at the time of 81
collision (Shannon et al., 1986), with line mixing to properly fit the discrete spectral lines of the O2 A-band. 82
The need to include non-Voigt effects when calculating absorption coefficients for the O2 1.27 µm band was first 83
shown in Hartmann et al. (2013) and Lamouroux et al. (2014). In Hartmann et al. (2013) and Lamouroux et al. 84
(2014), Lorentzian widths were calculated using the re-quantized classical molecular-dynamics simulations 85
(rCMDSs) and used to fit cavity-ring-down spectra with a Voigt line shape for some isolated transitions in the O2 86
1.27 µm band. The studies concluded that a Voigt line shape is insufficient for modeling the spectral lines of the O2 87
1.27 µm band and that effects such as speed dependence and Dicke narrowing should be included in the line shape 88
calculation. 89
In this study, air-broadened cavity-ring-down spectra of the O2 1.27 µm band were fitted using a spectral line shape 90
that takes into account speed dependence. The corresponding spectroscopic parameters for the speed-dependent 91
Voigt line shape were used to calculate absorption coefficients when fitting high-resolution solar absorption spectra. 92
Using these new O2 total columns, and the simultaneously measured were combined with CO2 total columns, from 93
using the updated line shape model described by Mendonca et al. (2016), to calculate XCO2 and compared these 94
results with XCO2 retrieved using a Voigt line shape. Section 2 details the formulas used to calculate absorption 95
coefficients using different spectral line shapes. In Section 3, we describe the retrieval of spectroscopic parameters 96
from three air-broadened cavity-ring-down spectra fitted with a speed-dependent Voigt line shape. For Section 4, the 97
speed-dependent line shape along with the retrieved spectroscopic parameters is used to fit solar absorption spectra 98
from four TCCON sites and retrieve total columns of O2, which is compared to O2 retrieved using a Voigt line 99
shape. In Section 5, we investigate the change in the airmass dependence of XCO2 with the new O2 parameters 100
retrievals. In Section 6, we discuss our results and their implications for remote sensing of greenhouse gases. 101
2. Absorption Coefficient Calculations 102
2.1 Voigt Line Shape 103

4
The Voigt line shape is the convolution of the Lorentz and the Gaussian Doppler line shapes profiles, which model 104
pressure and Doppler broadening of the spectral line respectively. The corresponding absorption coefficient, 𝑘, at a 105
given wavenumber 𝑣 becomes : 106
𝑘(𝑣) = 𝑁 ∑ 𝑆𝑗
𝑗
(1
𝛾𝐷𝑗
) (ln (2)
𝜋)
1/2
(𝑅𝑒[𝑐(𝑣, 𝑥𝑗 , 𝑦𝑗)]) (1)
where 𝑁 is the number density, 𝑆𝑗 is the line intensity of spectral line 𝑗, 𝛾𝐷𝑗 is the Doppler half-width (HWHM), c is 107
the complex error function, and 108
𝑥𝑗 =
(𝑣−𝑣𝑗𝑜−𝑃𝛿𝑗
𝑜)
𝛾𝐷𝑗
(ln (2))1/2, 𝑦𝑗 =𝛾𝐿𝑗
𝛾𝐷𝑗
(ln (2))1/2 . (2)
Here, 𝑣𝑗𝑜 is the position of the spectral line 𝑗, 𝑃 is the pressure, and 𝛿𝑗
𝑜 is the pressure-shift coefficient. The Lorentz 109
half-width, 𝛾𝐿𝑗, is calculated using: 110
𝛾𝐿𝑗(𝑇)= P 𝛾𝐿𝑗
𝑜 (296
𝑇)
𝑛
(3)
where 𝛾𝐿𝑗
𝑜 is the air-broadened Lorentz half-width coefficient (at reference temperature 296 K) and 𝑛 is the exponent 111
of temperature dependence. The Voigt line shape assumes that pressure broadening is accurately represented by a 112
Lorentz profile calculated for the stastical average velocity at the time of collission. 113
2.2 Speed-Dependent Voigt Line Shape 114
The speed-dependent Voigt line shape refines the pressure broadening component of the Voigt by calculating 115
multiple Lorentz profiles for different speeds at the time of collision. The final contribution from pressure 116
broadening to the speed-dependent Voigt is the weighted sum of Lorentz profiles (weighted by the Maxwell-117
Boltzmann speed-distribution) calculated for different speeds at the time of collision. To take speed dependence into 118
account, we use tThe speed-dependent Voigt line shape (Ciuryło, 1998) with the quadratic representation of the 119
Lorentz width and pressure shift (Rohart et al., 1994) is: 120
𝑘(𝑣) = 𝑁 (2
𝜋32
) ∑ 𝑆𝑗 ∫ 𝑒−V2V
∞
−∞
(𝑡𝑎𝑛−1 [𝑥𝑗 − 𝐵𝑎𝛿𝑗
((V)V2 − 1.5) + V
𝑦𝑗(1 + 𝑎𝛾𝐿𝑗((V)V2 − 1.5))
]) 𝑑𝑉
𝑗
(4)
where 𝑎𝛾𝐿𝑗is the speed-dependent Lorentz width parameter (unitless) for line 𝑗, 𝑎𝛿𝑗
is the speed- dependent pressure-121
shift parameter (unitless), 𝐵 is (ln (2))1/2
𝛾𝐷𝑗
, V is the ratio of the absorbing molecule’s speed to the most probable speed 122
of the absorbing molecule, and all other variables are defined before. 123
3. Fitting Laboratory Spectra 124

5
O2, unlike CO2 and CH4, cannot produce an electric dipole moment and therefore should not be infrared active. 125
However, O2 has two unpaired electrons in the ground state that produce a magnetic dipole moment. Due to the 126
unpaired electrons in the ground state (𝑋3𝛴𝑔−) the rotational state (N) is split into three components which are given 127
by 𝐽 = N-1, 𝐽 = N, and 𝐽 = N+1, while in the upper state (𝑎1∆𝑔), 𝐽 = N. When labeling a transition, the following 128
nomenclature is used ΔN(N′′)Δ𝐽(𝐽′′) (Leshchishina et al., 2010), where ΔN is the difference between N’ in the upper 129
state and N’’ in the lower state, Δ𝐽 is the difference between 𝐽′ in the upper state and 𝐽′′ in the lower state. The 130
magnetic transitions of 𝑎1∆𝑔← 𝑋3𝛴𝑔− allow for Δ𝐽=0, ±1. This leads to 9 branches observed: P(N′′)Q(𝐽′′), 131
R(N′′)Q(𝐽′′), and Q(N′′)Q(𝐽′′), for Δ𝐽=0, O(N′′)P(𝐽′′), P(N′′)P(𝐽′′), and Q(N′′)P(𝐽′′), for Δ𝐽=-1, and S(N′′)R(𝐽′′), 132
R(N′′)R(𝐽′′), and Q(N′′)R(𝐽′′), for Δ𝐽=1. 133
Absorption coefficients for three room temperature air-broadened (NIST Standard reference materal® 2659a 134
containing 79.28 % N2, 20.720(43) % O2, 0.0029 % Ar, 0.00015 % H2O, and 0.001 % other compounds) spectra 135
were measured at the National Institute of Standards and Technology (NIST) using the frequency-stabilized cavity-136
ring-down spectroscopy (FS-CRDS) ) technique (Hodges et al., 2004; Hodges, 2005). The absorption spectra were 137
acquired at pressures of 131 kPa, 99.3 kPa, and 66.9 kPa, at temperatures of 296.28 K, 296.34 K, and 296.30 K 138
respectively. Figure 1a shows the three measured absorption spectra. A more detailed discussion of the present FS-139
CRDS spectrometer can be found in Lin et al. (2015). 140
The spectra were fitted individually using a Voigt line shape (Eq. 1), with 𝑆𝑗, 𝛾𝐿𝑗
𝑜 , and 𝛿𝑗𝑜 for the main isotope of the 141
magnetic dipole lines of the O2 1.27 µm band for lines with an intensity greater than 7.0x10⁻²⁸ cm-1/(molecule cm-2). 142
The spectroscopic parameters measured in Leshchishina et al. (2011) for the spectral lines of interest were used as 143
the a priori for the retrieved spectroscopic parameters. The line positions were left fixed to the values measured in 144
Leshchishina et al. (2011), and all other O2 spectral lines (intensity less 7.0x10⁻²⁸ cm-1/(molecule cm-2)) were 145
calculated using a Voigt line shape with spectroscopic parameters from HITRAN 2012 (Rothman et al., 2013). 146
Spectral fits were done using the lsqnonlin function in Matlab, with a user-defined Jacobian matrix. The Jacobian 147
was constructed by taking the derivative of the absorption coefficients with respect to the parameters of interest. 148
Using an analytical Jacobian instead of the finite difference method is both computationally faster and more 149
accurate. The Voigt line shape was calculated using the Matlab code created by Abrarov and Quine (2011) to 150
calculate the complex error function and its derivatives. To take collision-induced absorption (CIA) into account, a 151
set of 50 Legendre polynomials were added together by retrieving the weighting coefficients needed to add the 152
polynomials to fit the CIA for each spectrum. Figure 1b shows the residual (measured minus calculated absorption 153
coefficients) when using a Voigt line shape with the retrieved spectroscopic parameters. The plot shows that residual 154
structure still remains for all three spectra. The Root Mean Square (RMS) residual values for the spectra are given 155
by the legend at the side of the plot. 156
Figure 2 is the same plot as Figure 1 but for the P(11)P(11), P(11)Q(10), P(9)P(9), and P(9)Q(8) spectral lines only. 157
Figure 2b shows that for all four spectral lines there is a “W” shaped residual at the line center. The P(11)P(11) line 158
was also measured by Hartmann et al. (2013) at pressures ranging from 6.7 to 107 kPa. Figure 5 of Hartmann et al. 159

6
(2013) shows the P(11)P(11) line at a pressure of 66.7 kPa, which is approximately the pressure of the 66.9 kPa 160
spectrum (blue spectrum in Figure 1 and 2). When one compares the blue residual of the P(11)P(11) line in Figure 161
2b to that of the residual of the left panel of Figure 5 of Hartmann et al. (2013), one can see that the residuals are the 162
same. Figure 6 of Hartmann et al. (2013) show that the amplitude of the residual increases with decreasing pressure, 163
which is also seen in Figure 2b. Figure 3 of Lamouroux et al. (2014) shows the same “W” residual for the P(9)P(9) 164
lines and that the amplitude of the residual increases with decreasing pressure (although for lower pressures) 165
consistent with the results for the P(9)P(9) line in Figure 2b. 166
Figure 1c shows the residual when using the speed-dependent Voigt (Eq. 4) to fit each spectrum individually. To use 167
Eq. (4) requires integration over all possible speeds, which is not computationally practical, so we employ the 168
simple numerical integration scheme as was done by Wehr (2005). When fitting the spectra, parameters 𝑆𝑗, 𝛾𝐿𝑗
𝑜 , 𝛿𝑗𝑜, 169
𝑎𝛾𝐿𝑖 and 𝑎𝛿𝑗
were retrieved for lines of intensity greater than 7.0x10⁻²⁸ cm-1/(molecule cm-2), while all other O2 lines 170
were calculated using a Voigt line shape and spectroscopic parameters from HITRAN 2012 (Rothman et al., 2013b). 171
The Jacobian matrix was created by taking the derivative with respect to each parameter of interest, as was done 172
with the Voigt fits. By taking speed-dependent effects into account, the residuals were reduced to 25 times smaller 173
than those for the Voigt fit and the RMS residuals (given in the legend of Figure 1c) are 10 times smaller. However, 174
some residual structure still remains, which is more evident in the in the Q and R branches than the P branch. Figure 175
2c shows the four lines in the P branch, as discussed when analyzing the Voigt fits. A small residual “W” remains at 176
line center, as well as residuals from weak O2 lines. 177
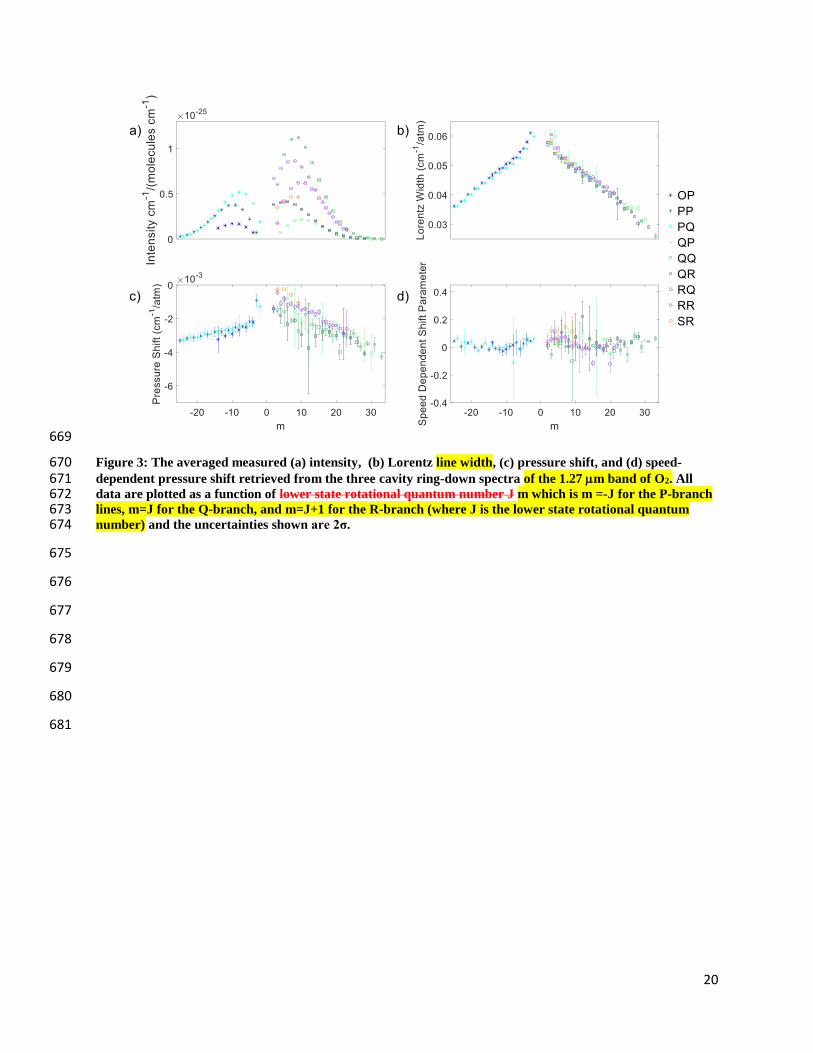
Figure 3 shows the averaged intensity, Lorentz width coefficient, pressure shift coefficient, and speed-dependent 178
shift coefficient of the 1.27 m O2 band, retrieved from the three spectra, plotted as a function of 𝐽′′. quantum 179
number m which is m=-J (where J is the lower state rotational quantum number) for the P-branch lines, m=J for the 180
Q-branch lines, and m=J+1 for the R-branch lines. The intensity, Lorentz widths, and pressure shifts show a 𝐽′′ m 181
dependence for these parameters for the P and R sub-branches. The measured Lorentz widths and pressure shifts for 182
the Q sub-branches show a 𝐽′′ m dependence but are not as strong as the P and R sub-branches. This is because the 183
Q branch lines are broadened enough to blend with each other since they are spaced closer together than the P or R 184
branch lines. Figure 1c shows that some of the residual structure in the Q branch increases with pressure and is 185
partly due to the blending of these transitions as the pressure increases. The weak O2 absorption lines also blend in 186
with the Q branch, contributing to the residual structure in Figure 1c. We tried retrieving the spectroscopic 187
parameters for the weak O2 absorption lines, but since they were overlapping with the strong O2 lines, it was not 188
possible. Figure 4a shows the retrieved speed-dependent width parameter averaged over the three spectra, plotted as 189
a function of 𝐽′′ m, showing that it increases with 𝐽′′ m. Error bars correspond to the 2σ standard deviation and are 190
large regardless of sub-branch. Figure 4b shows the retrieved speed-dependent width for the PQ sub-branch for the 191
different pressures. The speed-dependent width shows the same 𝐽′′ m dependence regardless of pressure, but also 192
increases with decreasing pressure as is the case for sub-branches. It should be noted that the speed-dependent width 193
parameter should be independent of pressure. 194

7
4. Fitting Solar Spectra 195
High-resolution solar absorption spectra were measured at four TCCON sites using a Bruker IFS 125HR FTIR 196
spectrometer with a room temperature InGaAs detector at a spectral resolution of 0.02 cm-1 (45 cm maximum 197
optical path difference). The raw interferograms recorded by the instrument were processed into spectra using the 198
I2S software package (Wunch, D. et al., 2015) that corrects them for solar intensity variations (Keppel-Aleks et al., 199
2007), phase errors (Mertz, 1967), and laser sampling errors (Wunch, D. et al., 2015), and then preforms a fast 200
Fourier transforms to convert the interferograms into spectra (Bergland, 1969). The GGG software package (Wunch, 201
D. et al., 2015) is used to retrieve total columns of atmospheric trace gases. GFIT is the main code that contains the 202
forward model, which calculates a solar absorption spectrum using a line-by-line radiative transfer model and an 203
iterative non-linear least square fitting algorithm that scales an a priori gas profile to obtain the best fit to the 204
measured spectrum. A priori profiles for GHGs are created by an empirical model in GGG that is based on 205
measurements from the balloon-borne JPL MkIV Fourier Transform Spectrometer (FTS) (Toon, 1991), the 206
Atmospheric Chemistry Experiment (ACE) FTS instrument aboard SCISAT (Bernath et al., 2005), and in situ 207
GLOBALVIEW data (Wunch et al., 2011). Temperature and pressure profiles, as well as H2O a priori profiles are 208
generated from the National Centers for Environmental Prediction (NCEP) data. The calculations are performed for 209
71 atmospheric layers (0 km to 70 km), so all a priori profiles are generated on a vertical grid of 1 km. 210
In the current GGG software package (Wunch, D. et al., 2015), the forward model of GFIT calculates absorption 211
coefficients for the discrete lines of the O2 1.27 µm band using a Voigt line shape and spectroscopic parameters 212
from Washenfelder et al. (2006a) and Gordon et al. (2010). To take CIA into account, absorption coefficients are 213
calculated using a Voigt line shape and spectroscopic parameters from the foreign-collision-induced absorption 214
(FCIA) and self-collision-induced absorption (SCIA) spectral line lists provided with the GGG software package 215
(Wunch, D. et al., 2015). Spectroscopic parameters in the FCIA and SCIA line lists were retrieved by Geoff Toon by 216
fitting the laboratory spectra of Smith and Newnham (2000). This was done by retrieving the integrated absorption 217
at every 1 cm-1 of the spectrum and using a Voigt line shape, with fixed Lorentz width and no pressure shift. In 218
GFIT, a volume scale factor is retrieved for the CIA and discrete lines separately so that the O2 column is derived 219
from the discrete lines of the 1.27 µm band only. Airglow is not considered when fitting the 1.27 µm band since the 220
spectrometer views the sun directly, and airglow is overwhelmed by such a bright source. The continuum level and 221
tilt of the 100% transmission level is fitted using a weighted combination of the first two Legendre polynomials. 222
Absorption coefficient for all other trace gases are calculated using a Voigt line shape and spectroscopic parameters 223
from the atm.101 line list (Toon, G. C., 2014a)(Wunch, D. et al., 2015) and solar lines are fitted using the solar line 224
list (Toon, G. C., 2014b)(Wunch, D. et al., 2015). 225
Figure 5 shows the spectral fit to a solar absorption spectrum recorded at Eureka on March 27, 2015, at a solar 226
zenith angle (SZA) of 81.32o (airmass of 6.3). This spectrum is an average of 5 Eureka scans. The TCCON standard 227
is single scan but 5 scans were averaged to decrease the noise. The measured spectrum (red circles), calculated 228
spectrum (black circles) and transitions from all gases in the window (colored lines, refer to the legend for different 229
gases) are shown in Figure 5b. The residual obtained using a Voigt line shape to calculate the discrete lines of the O2 230

8
1.27 µm band is shown in red in Figure 5a. The blue residual is the result of using a speed-dependent Voigt line 231
shape with the spectroscopic parameters retrieved from fitting the absorption coefficients in Section 3. To decrease 232
the amount of time it takes to calculate the absorption coefficients, the quadratic-Speed Dependent Voigt (qSDV) 233
computational approach of Ngo et al. (2013) and Tran et al. (2013)was used instead of Eq. (4) since it requires the 234
Voigt calculation only twice, while Eq. (4) requires numerical integration scheme with 33 iterations. The 235
temperature-dependent parameter of the Lorentz width of the discrete lines of the O2 1.27 µm band reported in 236
HITRAN 2012 was used to take temperature dependence into account for 𝛾𝐿𝑗(𝑇). There was only a slight 237
improvement in the fit residuals with the new absorption coefficients (using the qSDV), as seen in Figure 5a. 238
Absorption coefficients calculated with the qSDV were used to retrieve total columns of O2 from solar spectra 239
recorded over a one year period at TCCON sites in Eureka (eu) (Nunavut, Canada) (Batchelor et al., 2009; Strong et 240
al., 2017)(Batchelor et al., 2009), Park Falls (pa) (Wisconsin, U.S.A) (Washenfelder et al., 2006; Wennberg et al., 241
2017)(Washenfelder et al., 2006b), Lamont (oc) (Oklahoma, U.S.A) (Wennberg et al., 2017b), and Darwin (db) 242
(Australia) (Deutscher et al., 2010; Griffith et al., 2017)(Deutscher et al., 2010). In total 131 124 spectra were fit 243
using the qSDV and the average root mean square (RMS) residual of the fit only decreased by 0.5 %. 244
5. Impact of O2 Columns on XCO2 Measurements 245
The O2 column retrieved from the 1.27 µm band with a Voigt line shape and spectroscopic parameters from the 246
atm.101 line list (Toon, G. C., 2014a) (Wunch, D. et al., 2015) has an airmass dependence such that the O2 column 247
retrieved increases as a function of solar zenith angle (or airmass). Using spectra recorded from Eureka, Park Falls, 248
Lamont, and Darwin over one-year periods, total columns of O2 were retrieved using (1) a Voigt spectral line shape 249
with spectroscopic parameters from the atm.101 line list and (2) the qSDV with the spectroscopic parameters 250
determined in Section 3. Figure 6 shows the percent difference calculated as the column from the qSDV retrieval 251
minus the column from the Voigt retrieval, which was then divided by the latter and multiplied by 100, plotted as a 252
function of solar zenith angle (SZA). At the smallest SZA, the qSDV retrieves 0.75% less O2 than the Voigt, with 253
the difference increasing to approximately 1.8% as the SZA approaches 90o. Figure 7 shows XAIR from Park Falls 254
on June 18, 2013. XAIR is the column of air (determined using surface pressure recorded at the site) divided by the 255
column of O2 retrieved from the spectra and multiplied by 0.2095, which is the dry air mole fraction of O2 in Earth’s 256
atmosphere. Ideally XAIR should be 1 but when using O2 retrieved with a Voigt line shape (red points) it is closer to 257
0.98 near noon (small SZA) and lower near the start and end of the day (large SZA). When using O2 retrieved with 258
the qSDV, XAIR is closer to 0.988 near noon and a bit higher near the start and end of the day. This means the O2 259
column, retrieved with the qSDV, decreases as a function of SZA, while previously the column increased as a 260
function of SZA when the Voigt line shape is used. 261
5.1 Airmass Dependence of XCO2 262
Since the standard TCCON XCO2 (and all other XGas) is calculated using the column of O2 instead of the surface 263
pressure, errors associated with the retrieval of O2, such as the airmass dependence of the O2 column, will affect 264
XCO2. Figure 8 is XCO2 calculated for four different combinations pertaining to the two CO2 column retrievals and 265

9
the O2 column retrievals. The CO2 columns were retrieved with either a Voigt line shape (the standard GGG2014 266
approach) or the qSDV with line mixing as done in Mendonca et al. (2016) while the O2 columns were retrieved 267
with either a Voigt (the standard GGG2014 approach) or the new qSDV approach developed here. Figure 8 shows a 268
spurious symmetric component to XCO2 when the total column of O2 is retrieved with the Voigt line shape, 269
regardless of line shape used to retrieve CO2. When the qSDV is used to retrieve total columns of O2, the symmetric 270
component of XCO2 is dismissed regardless of line shape used to retrieve CO2. This is because the airmass 271
dependence of the column of O2 retrieved using the qSDV is more consistent with the airmass dependence of the 272
column of CO2 (for both line shapes used to retrieve CO2). Mendonca et al. (2016) showed that using the qSDV with 273
line mixing results in better fits to the CO2 windows and impacts the airmass dependence of the retrieved column of 274
CO2. When using a Voigt line shape the retrieved column amount of CO2 decreases as airmass increases until the 275
airmass is large (SZA of about 82o) at which point the retrieved column of CO2 increases as the airmass increases, 276
changing the shape of the airmass dependence of the CO2 column. When the qSDV with line mixing is used, the 277
retrieved column of CO2 decreases as a function of airmass (up until the sun is above the horizon). 278
In order to To correct for this, an empirical correction is applied to all TCCON XCO2 (and XGas). The empirical 279
correction determines the antisymmetrical component of the day’s XCO2, which is assumed to be the true variation 280
of XCO2 throughout the day, as well as the symmetrical component, which is caused by the airmass dependence of 281
the retrieved column of the gas of interest and O2. We can, therefore, represent a measurement as (Wunch et al., 282
2011): 283
𝑦𝑖 = �̂�[1 + 𝛼𝑆(𝜃𝑖) + 𝛽𝐴(𝑡𝑖)] (5)
where �̂� is the mean value of XCO2 measured that day, 𝛽 is the fitted coefficient of the antisymmetric function 𝐴(𝑡𝑖) 284
and 𝛼 is the fitted coefficient of the symmetric function 𝑆(𝜃𝑖). The antisymmetric function is calculated by (Wunch 285
et al., 2011): 286
𝐴(𝑡𝑖) = sin (2𝜋(𝑡𝑖 − 𝑡𝑛𝑜𝑜𝑛)) (6)
where 𝑡𝑖 is the time of the measurement and 𝑡𝑛𝑜𝑜𝑛 is the time at solar noon, both in units of days. The symmetric 287
function is calculated by (Wunch et al., 2011): 288
𝑆(𝜃𝑖) = (
𝜃𝑖 + 13𝑜
90𝑜 + 13𝑜)
3
− (𝜃𝑖45𝑜 + 13𝑜
90𝑜 + 13𝑜)
3
(7)
where 𝜃𝑖 is the SZA in degrees. To determine 𝛼 for the different line shapes, total columns of CO2 were retrieved 289
using the Voigt line shape (Wunch, D. et al., 2015) and the qSDV with line mixing (Mendonca et al., 2016). 290
Henceforth, we will refer to XCO2 calculated from O2 and CO2 using the Voigt line shape as XCO2 Voigt and the 291
qSDV line shape as XCO2 qSDV. 292
Figure 97 shows the average 𝛼 calculated for each season at Darwin, Lamont, and Park Falls. Eureka XCO2 cannot 293
be used to determine 𝛼 because Eureka measurements do not go through the same range of SZAs as the other three 294

10
sites due to its geolocation. The average 𝛼 XCO2 Voigt are represented by stars in Figure 97, while the squares 295
indicate XCO2 qSDV. At all three sites, 𝛼 is closer to 0 when the qSDV line shape is used in the retrieval compared 296
to the Voigt retrieval, regardless of the season. The average 𝛼 for XCO2 Voigt calculated from a year of 297
measurements from Darwin, Park Falls, and Lamont is -0.0071±0.0057 and that for XCO2 qSDV is -0.0012±0.0054. 298
For all four sites, 𝛼 = -0.0071 is used to correct XCO2 Voigt measurements. Figure 108a shows the XCO2 Voigt 299
anomalies plotted as a function of SZA. The data is expressed as the daily XCO2 anomaly, which is the difference 300
between the XCO2 value and the daily median value, in order to remove the seasonal cycle. When XCO2 is left 301
uncorrected for airmass dependencies, there is a clear airmass dependence where the amount of XCO2 decreases as a 302
function of SZA up to a SZA of approximately 82o, at which point XCO2 and increases as a function of SZA at 303
andgles greater than 82o. Figure 108b shows XCO2 Voigt corrected for the airmass dependence. This airmass 304
correction works well only up to a SZA of approximately 82o, after which the correction only serves to increase the 305
airmass dependence. Figure 108c is the same as 108a but for the uncorrected XCO2 qSDV measurements, while 306
Figure 108d is the same as 108b but for the corrected XCO2 qSDV measurements. When the airmass correction is 307
applied to XCO2 qSDV there is a small difference between the corrected and uncorrected XCO2 qSDV 308
measurements, with the difference only noticeable for the Darwin measurements recorded at SZA > 60o. For XCO2 309
qSDV measurements made at SZA > 82o XCO2 does not increase with SZA as it does with the Voigt. 310
5.2 Accuracy of XCO2 311
To assess the accuracy of TCCON XCO2 measurements, they are compared to aircraft XCO2 profile measurements 312
using the method described in Wunch et al. (2010). Figure 119a shows the comparison between the aircraft XCO2 313
measurements (legend on at the top details the different aircraft) and TCCON XCO2 Voigt measurements for 13 314
TCCON sites (given by the color-coded legend on at the bottom right). The gray line indicates the one-to-one line 315
and the dashed line is the line of best fit. There is a bias of 0.9897±0.0005, as given by the slope of the line of best 316
fit in Figure 119a, for the XCO2 Voigt measurements. Figure 119b is the same as 119a but for the XCO2 qSDV 317
measurements. The bias between the aircraft XCO2 measurements and the XCO2 qSDV measurements is 318
1.0041±0.0005 as given by the slope of the line of best fit in Figure 119b. This increase in the slope can be 319
explained by an increase in the retrieved column of CO2 when using the qSDV with line mixing as shown in 320
Mendonca et al. (2016) as well as combined with a decrease in the retrieved O2 column due to using the qSDV. As 321
discussed previously (section 5) the decrease in the retrieved O2 column is an improvement but the expected column 322
of O2 is still approximately 1.2% higher (at the smallest SZA) than it should be. Therefore, the retrieved column of 323
CO2 is higher than it should be, and the slope would be greater if the retrieved column of O2 was 1.2% lower. Never 324
the less Using using the qSDV to retrieve total columns of CO2 and O2 thus reduces the difference between TCCON 325
XCO2 and aircraft XCO2 measurements by 0.62 %. 326
TCCON XCO2 measurements are divided by the scale factors (or bias determined in Figure 119) to calibrate to the 327
WMO scale. For all TCCON XCO2 measurements retrieved with a Voigt line shape, the airmass correction is first 328
applied to the data and the result is divided by the determined bias factor, 0.9897. Figure 1210a to 1210d shows 329

11
XCO2 Voigt (for Eureka, Park Falls, Lamont, and Darwin respectively) indicated by red square boxes in the plots. 330
XCO2 Voigt measurements made at SZA > 82o have been filtered out because they cannot be corrected for the 331
airmass dependence. The blue boxes are XCO2 qSDV corrected for airmass dependence and scaled by 1.0041. No 332
filter was applied to the XCO2 qSDV measurements for SZA since the airmass dependence correction works at all 333
SZA. Figure 1210e to 1210h shows the difference between XCO2 Voigt and XCO2 qSDV for Eureka, Park Falls, 334
Lamont, and Darwin respectively. The mean differences for the data shown in Figures 1210e to 1210h are 335
0.113±0.082, -0.102±0.223, -0.132±0.241, and -0.059±0.231 μmol/mol (ppm) for Eureka, Park Falls, Lamont, and 336
Darwin respectively. The difference throughout the day at Park Falls, Lamont, and Darwin varies between -0.6 to 337
0.2 μmol/mol and is SZA dependent. 338
Figure 1311a shows XCO2 Voigt corrected for the airmass dependence, as well as XCO2 qSDV, uncorrected and 339
corrected for the airmass dependence. These XCO2 measurements were retrieved from Park Falls spectra recorded 340
on June 18, 2013. For all three XCO2 measurements, the amount of XCO2 decreases throughout the day. Figure 341
1311b shows the difference between the corrected Voigt XCO2 and the uncorrected qSDV XCO2, as well as the 342
difference between the corrected Voigt XCO2 and the corrected qSDV XCO2. The difference between the Voigt and 343
the qSDV (corrected and uncorrected) shows that at the start and end of the day, more XCO2 is retrieved with the 344
qSDV, while at midday less is retrieved with the qSDV. The range in the differences seen in Figure 1210e to 1210h 345
varies with SZA throughout the day as shown in Figure 1311b. 346
6. Discussion and Conclusions 347
Using cavity ring-down spectra measured in the lab, we have shown that the Voigt line shape is insufficient to 348
model the line shape of O2 for the 1.27 µm band, consistent with the results of(Hartmann et al. (2013) and 349
Lamouroux et al. (2014). By using the speed-dependent Voigt line shape when calculating the absorption 350
coefficients, we were better able to reproduce the measured absorption coefficients than using the Voigt line shape. 351
However, some residual structure still remains as seen Figures 1 and 2. This is partly due to the blending of spectral 352
lines (i.e., line mixing) and the inability to retrieve the spectroscopic parameters for weak O2 transitions. Fitting low-353
pressure spectra would help with isolating spectral lines and decreasing the uncertainty on the retrieved 354
spectroscopic parameters for the Q branch lines. 355
Accurate measurements of the pressure shifts in the 1.27 µm band have been hard to obtain as shown in Newman et 356
al. (1999) and Hill et al., (2003). While the retrieved pressure shifts show a dependence on quantum number m 357
(Figure 3c) as one would expect, this dependence is not as strong as the m dependence of the Lorentz widths (Figure 358
3b). This can be explained by the fact that line mixing, which is shown to be important for the O2 A-band, was not 359
considered when fitting the cavity-ringdown spectra. Neglecting line mixing usually produces an asymmetric 360
residual in the discrete lines as well as a broad residual feature associated with the fact that collisions are transferring 361
intensity from one part of the spectrum to another. By fitting a set of Legendre polynomials for CIA we could be 362
simultaneously fitting the broader band feature associated with line mixing while the retrieved pressure shifts, and 363
speed-dependent pressure shifts could be compensating for the asymmetric structure one would see in the discrete 364

12
lines when neglecting line mixing. The remaining structure, as seen in Figure 1c, could be due to neglecting line 365
mixing especially in the Q-branch where the spacing between spectral lines is small (in comparison to the P and R 366
branches) and line mixing is most likely prevalent. 367
The pressure dependence of the retrieved speed-dependent width parameter is an indication that Dicke narrowing 368
needs to be taken into account, as shown by Bui et al. (2014) for CO2. However, when When dealing with both 369
speed dependence and Dicke narrowing are present, a multi-spectrum fit needs to be used due to the correlation 370
between the parameters (Bui et al., 2014). Domysławska et al. (2016) recommend using the qSDV to model the line 371
shape of O2 based on multiple line shape studies of the O2 B-band. In these studies, a multi-spectrum fit to low 372
pressure (0.27-5.87 kPa) cavity-ring down spectra was preformed testing multiple line shapes that took speed-373
dependence and Dicke narrowing into account both separately and simultaneously. They found that the line shapes 374
that only used Dicke narrowing were not good enough to model the line shape of the O2 B-band lines, but a line 375
shape that included either speed-dependence or both speed-dependence and Dicke narrowing produced similar 376
quality fits, ultimately concluding that speed-dependence has a larger effect than Dicke narrowing. It was noted in 377
the study by Wójtewicz et al., (2014) that both Dicke narrowing and speed-dependent effects might simultaneously 378
play an important role in modeling the line shape of the O2 B-band lines. However, the speed-dependent and Dicke 379
narrowing parameters are highly correlated at low pressures. To reduce the correlation requires either a multi-380
spectrum fit of spectra at low pressures with high enough signal to nosie ratio or spectra that cover a wide range of 381
pressure (Wójtewicz et al., 2014). So, by combining the high-pressure spectra used in this study with low pressure 382
spectra in a multipspectrum fit both the speed-dependence and Dicke narrowing parameters could be retrieved. The 383
temperature dependence of the Lorentz width coefficients of this band has never been measured before, which could 384
have an impact on the airmass dependence of O2. Combining high-pressure cavity-ring-down absorption coefficient 385
measurements with those for low pressures and different temperatures as done in Devi et al. (2015 and 2016) for 386
CH4 in would lead to more accurate line shape parameters for O2. 387
By taking speed dependence into account for both CO2 (in the work of Mendonca et al., 2016) and O2 (the work 388
presented here), we were able to significantly decrease the airmass dependence of TCCON XCO2 and the bias 389
between TCCON and aircraft XCO2. With the qSDV line shape, XCO2 measurements made at SZA > 82o no longer 390
have to be discarded, resulting in more XCO2 measurement available from all TCCON sites. This is particularly 391
important for high-latitude TCCON sites, such as Eureka, because measurements made from late February to late 392
March and from late September until mid-October are made at SZA > 82o. Filtering out these large SZA 393
measurements thus limits the knowledge of the seasonal cycle of XCO2 at high latitudes. The airmass dependence of 394
the O2 column not only effects XCO2 but all trace gases measured by TCCON and in the future the airmass 395
dependence of all XGas will be determined with these new O2 columns. 396
Acknowledgements 397
This work was primarily supported by the Canadian Space Agency (CSA) through the GOSAT and CAFTON 398
projects and the Natural Sciences and Engineering Research Council of Canada (NSERC). The Eureka 399

13
measurements were made at the Polar Environment Atmospheric Research Laboratory (PEARL) by the Canadian 400
Network for the Detection of Atmospheric Change (CANDAC), which has been supported by the AIF/NSRIT, CFI, 401
CFCAS, CSA, Environment Canada (EC), Government of Canada IPY funding, NSERC, OIT, ORF, PCSP, and 402
FQRNT. The authors wish to thank the staff at EC’s Eureka Weather Station and CANDAC for the logistical and 403
on-site support provided. Thanks to CANDAC Principal Investigator James R. Drummond, PEARL Site Manager 404
Pierre Fogal, and CANDAC/PEARL operators Mike Maurice and Peter McGovern, for their invaluable assistance in 405
maintaining and operating the Bruker 125HR. The research at the Jet Propulsion Laboratory (JPL), and California 406
Institute of Technology was performed under contracts and cooperative agreements with the National Aeronautics 407
and Space Administration (NASA). Geoff Toon and Debra Wunch acknowledge support from NASA for 408
the development of TCCON via grant number NNX17AE15G. Darwin TCCON measurements are possible thanks 409
to support from NASA grants NAG5-12247 and NNG05-GD07G, the Australian Research Council grants 410
DP140101552, DP110103118, DP0879468 and LP0562346, and the DOE ARM program for technical support. The 411
research at the National Institute of Standards and Technology was performed with the support of the NIST 412
Greenhouse Gas Measurements and Climate Research Program. Certain commercial equipment, instruments, or 413
materials are identified in this paper in order to specify the experimental procedure adequately. Such identification is 414
not intended to imply recommendation or endorsement by the National Institute of Standards and Technology, nor is 415
it intended to imply that the materials or equipment identified are necessarily the best available for the purpose. 416
417
418
419
420
421
422
423
424
425
426
427
428
429

14
References 430
Abrarov, S.M., Quine, B.M., 2011. Efficient algorithmic implementation of the Voigt/complex error function based 431 on exponential series approximation. Appl. Math. Comput. 218, 1894–1902. 432 https://doi.org/10.1016/j.amc.2011.06.072 433
Batchelor, R.L., Strong, K., Lindenmaier, R., Mittermeier, R.L., Fast, H., Drummond, J.R., Fogal, P.F., 2009. A 434 New Bruker IFS 125HR FTIR Spectrometer for the Polar Environment Atmospheric Research Laboratory 435 at Eureka, Nunavut, Canada: Measurements and Comparison with the Existing Bomem DA8 Spectrometer. 436 J. Atmospheric Ocean. Technol. 26, 1328–1340. https://doi.org/10.1175/2009JTECHA1215.1 437
Bergland, G., 1969. A radix-eight fast Fourier transform subroutine for real-valued series. IEEE Trans. Audio 438 Electroacoustics 17, 138–144. https://doi.org/10.1109/TAU.1969.1162043 439
Bernath, P.F., McElroy, C.T., Abrams, M.C., Boone, C.D., Butler, M., Camy-Peyret, C., Carleer, M., Clerbaux, C., 440 Coheur, P.-F., Colin, R., DeCola, P., DeMazière, M., Drummond, J.R., Dufour, D., Evans, W.F.J., Fast, H., 441 Fussen, D., Gilbert, K., Jennings, D.E., Llewellyn, E.J., Lowe, R.P., Mahieu, E., McConnell, J.C., 442 McHugh, M., McLeod, S.D., Michaud, R., Midwinter, C., Nassar, R., Nichitiu, F., Nowlan, C., Rinsland, 443 C.P., Rochon, Y.J., Rowlands, N., Semeniuk, K., Simon, P., Skelton, R., Sloan, J.J., Soucy, M.-A., Strong, 444 K., Tremblay, P., Turnbull, D., Walker, K.A., Walkty, I., Wardle, D.A., Wehrle, V., Zander, R., Zou, J., 445 2005. Atmospheric Chemistry Experiment (ACE): Mission overview. Geophys. Res. Lett. 32, L15S01. 446 https://doi.org/10.1029/2005GL022386 447
Bui, T.Q., Long, D.A., Cygan, A., Sironneau, V.T., Hogan, D.W., Rupasinghe, P.M., Ciuryło, R., Lisak, D., 448 Okumura, M., 2014. Observations of Dicke narrowing and speed dependence in air-broadened CO2 449 lineshapes near 2.06 μm. J. Chem. Phys. 141, 174301. https://doi.org/10.1063/1.4900502 450
Cheah, S.-L., Lee, Y.-P., Ogilvie, J.F., 2000. Wavenumbers, strengths, widths and shifts with pressure of lines in 451 four bands of gaseous 16O2 in the systems a1Δg
−X3Σg− and b1Σg
+−X3Σg−. J. Quant. Spectrosc. Radiat. Transf. 452
64, 467–482. https://doi.org/10.1016/S0022-4073(99)00126-0 453 Ciuryło, R., 1998. Shapes of pressure- and Doppler-broadened spectral lines in the core and near wings. Phys. Rev. 454
A 58, 1029–1039. https://doi.org/10.1103/PhysRevA.58.1029 455 Crisp, D., Atlas, R.M., Breon, F.-M., Brown, L.R., Burrows, J.P., Ciais, P., Connor, B.J., Doney, S.C., Fung, I.Y., 456
Jacob, D.J., Miller, C.E., O’Brien, D., Pawson, S., Randerson, J.T., Rayner, P., Salawitch, R.J., Sander, 457 S.P., Sen, B., Stephens, G.L., Tans, P.P., Toon, G.C., Wennberg, P.O., Wofsy, S.C., Yung, Y.L., Kuang, Z., 458 Chudasama, B., Sprague, G., Weiss, B., Pollock, R., Kenyon, D., Schroll, S., 2004. The Orbiting Carbon 459 Observatory (OCO) mission. Adv. Space Res., Trace Constituents in the Troposphere and Lower 460 Stratosphere 34, 700–709. https://doi.org/10.1016/j.asr.2003.08.062 461
Deutscher, N.M., Griffith, D.W.T., Bryant, G.W., Wennberg, P.O., Toon, G.C., Washenfelder, R.A., Keppel-Aleks, 462 G., Wunch, D., Yavin, Y., Allen, N.T., Blavier, J.-F., Jiménez, R., Daube, B.C., Bright, A.V., Matross, 463 D.M., Wofsy, S.C., Park, S., 2010. Total column CO2 measurements at Darwin, Australia – site description 464 and calibration against in situ aircraft profiles. Atmos Meas Tech 3, 947–958. https://doi.org/10.5194/amt-465 3-947-2010 466
Devi, V.M., Benner, D.C., Sung, K., Brown, L.R., Crawford, T.J., Yu, S., Smith, M.A.H., Mantz, A.W., Boudon, 467 V., Ismail, S., 2016. Spectral line parameters including line shapes in the 2ν3 Q branch of 12CH4. J. Quant. 468 Spectrosc. Radiat. Transf., XVIIIth Symposium on High Resolution Molecular Spectroscopy (HighRus-469 2015), Tomsk, Russia 177, 152–169. https://doi.org/10.1016/j.jqsrt.2015.12.009 470
Devi, V.M., Benner, D.C., Sung, K., Crawford, T.J., Yu, S., Brown, L.R., Smith, M.A.H., Mantz, A.W., Boudon, 471 V., Ismail, S., 2015. Self- and air-broadened line shapes in the 2ν3 P and R branches of 12CH4. J. Mol. 472 Spectrosc., Spectroscopy with Synchrotron Radiation 315, 114–136. 473 https://doi.org/10.1016/j.jms.2015.05.003 474
Dicke, R.H., 1953. The Effect of Collisions upon the Doppler Width of Spectral Lines. Phys. Rev. 89, 472–473. 475 https://doi.org/10.1103/PhysRev.89.472 476
Domysławska, J., Wójtewicz, S., Masłowski, P., Cygan, A., Bielska, K., Trawiński, R.S., Ciuryło, R., Lisak, D., 477 2016. A new approach to spectral line shapes of the weak oxygen transitions for atmospheric applications. 478 J. Quant. Spectrosc. Radiat. Transf. 169, 111–121. https://doi.org/10.1016/j.jqsrt.2015.10.019 479
Drouin, B.J., Benner, D.C., Brown, L.R., Cich, M.J., Crawford, T.J., Devi, V.M., Guillaume, A., Hodges, J.T., 480 Mlawer, E.J., Robichaud, D.J., Oyafuso, F., Payne, V.H., Sung, K., Wishnow, E.H., Yu, S., 2017. 481 Multispectrum analysis of the oxygen A-band. J. Quant. Spectrosc. Radiat. Transf., Satellite Remote 482 Sensing and Spectroscopy: Joint ACE-Odin Meeting, October 2015 186, 118–138. 483 https://doi.org/10.1016/j.jqsrt.2016.03.037 484

15
Gordon, I.E., Kassi, S., Campargue, A., Toon, G.C., 2010. First identification of the electric quadrupole transitions 485 of oxygen in solar and laboratory spectra. J. Quant. Spectrosc. Radiat. Transf., Special Issue Dedicated to 486 Laurence S. Rothman on the Occasion of his 70th Birthday. 111, 1174–1183. 487 https://doi.org/10.1016/j.jqsrt.2010.01.008 488
Gordon, I.E., Rothman, L.S., Hill, C., Kochanov, R.V., Tan, Y., Bernath, P.F., Birk, M., Boudon, V., Campargue, 489 A., Chance, K.V., Drouin, B.J., Flaud, J.-M., Gamache, R.R., Hodges, J.T., Jacquemart, D., Perevalov, V.I., 490 Perrin, A., Shine, K.P., Smith, M.-A.H., Tennyson, J., Toon, G.C., Tran, H., Tyuterev, V.G., Barbe, A., 491 Császár, A.G., Devi, V.M., Furtenbacher, T., Harrison, J.J., Hartmann, J.-M., Jolly, A., Johnson, T.J., 492 Karman, T., Kleiner, I., Kyuberis, A.A., Loos, J., Lyulin, O.M., Massie, S.T., Mikhailenko, S.N., Moazzen-493 Ahmadi, N., Müller, H.S.P., Naumenko, O.V., Nikitin, A.V., Polyansky, O.L., Rey, M., Rotger, M., 494 Sharpe, S.W., Sung, K., Starikova, E., Tashkun, S.A., Auwera, J.V., Wagner, G., Wilzewski, J., Wcisło, P., 495 Yu, S., Zak, E.J., 2017. The HITRAN2016 molecular spectroscopic database. J. Quant. Spectrosc. Radiat. 496 Transf., HITRAN2016 Special Issue 203, 3–69. https://doi.org/10.1016/j.jqsrt.2017.06.038 497
Griffith, D.W.T., Deutscher, N.M., Velazco, V.A., Wennberg, P.O., Yavin, Y., Keppel-Aleks, G., Washenfelder, 498 R.A., Toon, G.C., Blavier, J.-F., Paton-Walsh, C., Jones, N.B., Kettlewell, G.C., Connor, B.J., Macatangay, 499 R.C., Roehl, C., Ryczek, M., Glowacki, J., Culgan, T., Bryant, G.W., 2017. TCCON data from Darwin 500 (AU), Release GGG2014.R0. https://doi.org/10.14291/tccon.ggg2014.darwin01.R0/1149290 501
Hartmann, J.-M., Sironneau, V., Boulet, C., Svensson, T., Hodges, J.T., Xu, C.T., 2013. Collisional broadening and 502 spectral shapes of absorption lines of free and nanopore-confined O2 gas. Phys. Rev. A 87, 032510. 503 https://doi.org/10.1103/PhysRevA.87.032510 504
Hill, C., Brown, J.M., Newnham, D.A., 2003. An upper limit for the magnitude of pressure shifts in the O2 505 a1Δg←X3Σ−
g(0–0) band. J. Mol. Spectrosc. 221, 286–287. https://doi.org/10.1016/S0022-2852(03)00227-3 506 Hodges, J.T., 2005. Automated high-resolution frequency-stabilized cavity ring-down absorption spectrometer. Rev. 507
Sci. Instrum. 76, 023112. https://doi.org/10.1063/1.1850633 508 Hodges, J.T., Layer, H.P., Miller, W.., Scace, G.E., 2004. Frequency-stabilized single-mode cavity ring-down 509
apparatus for high-resolution absorption spectroscopy. Rev. Sci. Instrum. 75, 849–863. 510 https://doi.org/10.1063/1.1666984 511
Keppel-Aleks, G., Toon, G.C., Wennberg, P.O., Deutscher, N.M., 2007. Reducing the impact of source brightness 512 fluctuations on spectra obtained by Fourier-transform spectrometry. Appl. Opt. 46, 4774. 513 https://doi.org/10.1364/AO.46.004774 514
Lamouroux, J., Sironneau, V., Hodges, J.T., Hartmann, J.-M., 2014. Isolated line shapes of molecular oxygen: 515 Requantized classical molecular dynamics calculations versus measurements. Phys. Rev. A 89, 042504. 516 https://doi.org/10.1103/PhysRevA.89.042504 517
Leshchishina, O., Kassi, S., Gordon, I.E., Rothman, L.S., Wang, L., Campargue, A., 2010. High sensitivity CRDS of 518 the a1Δg
−X3Σg− band of oxygen near 1.27 μm: Extended observations, quadrupole transitions, hot bands and 519
minor isotopologues. J. Quant. Spectrosc. Radiat. Transf., XVIth Symposium on High Resolution 520 Molecular Spectroscopy (HighRus-2009) XVIth Symposium on High Resolution Molecular Spectroscopy 521 111, 2236–2245. https://doi.org/10.1016/j.jqsrt.2010.05.014 522
Leshchishina, O., Kassi, S., Gordon, I.E., Yu, S., Campargue, A., 2011. The band of 16O17O, 17O18O and 17O2 by 523 high sensitivity CRDS near 1.27 μm. J. Quant. Spectrosc. Radiat. Transf. 112, 1257–1265. 524 https://doi.org/10.1016/j.jqsrt.2011.01.014 525
Lévy, A., Lacome, N., Chackerian Jr., C., 1992. Collisional Line Mixing A2 - Weber, K. Narahari RaoAlfons, in: 526 Spectroscopy of the Earth’s Atmosphere and Interstellar Medium. Academic Press, pp. 261–337. 527
Lin, H., Reed, Z.D., Sironneau, V.T., Hodges, J.T., 2015. Cavity ring-down spectrometer for high-fidelity molecular 528 absorption measurements. J. Quant. Spectrosc. Radiat. Transf. 161, 11–20. 529 https://doi.org/10.1016/j.jqsrt.2015.03.026 530
Long, D.A., Havey, D.K., Okumura, M., Miller, C.E., Hodges, J.T., 2010. O2 A-band line parameters to support 531 atmospheric remote sensing. J. Quant. Spectrosc. Radiat. Transf. 111, 2021–2036. 532 https://doi.org/10.1016/j.jqsrt.2010.05.011 533
Maté, B., Lugez, C., Fraser, G.T., Lafferty, W.J., 1999. Absolute intensities for the O2 1.27 μm continuum 534 absorption. J. Geophys. Res. Atmospheres 104, 30585–30590. https://doi.org/10.1029/1999JD900824 535
Mendonca, J., Strong, K., Toon, G.C., Wunch, D., Sung, K., Deutscher, N.M., Griffith, D.W.T., Franklin, J.E., 2016. 536 Improving atmospheric CO2 retrievals using line mixing and speed-dependence when fitting high-537 resolution ground-based solar spectra. J. Mol. Spectrosc., Atmospheric Spectroscopy 323, 15–27. 538 https://doi.org/10.1016/j.jms.2016.01.007 539

16
Mertz, L., 1967. Auxiliary computation for Fourier spectrometry. Infrared Phys. 7, 17–23. 540 https://doi.org/10.1016/0020-0891(67)90026-7 541
Mlawer, E.J., Clough, S.A., Brown, P.D., Stephen, T.M., Landry, J.C., Goldman, A., Murcray, F.J., 1998. Observed 542 atmospheric collision-induced absorption in near-infrared oxygen bands. J. Geophys. Res. Atmospheres 543 103, 3859–3863. https://doi.org/10.1029/97JD03141 544
Newman, S.M., Lane, I.C., Orr-Ewing, A.J., Newnham, D.A., Ballard, J., 1999. Integrated absorption intensity and 545 Einstein coefficients for the O2 a1Δg
–X3Σg− (0,0) transition: A comparison of cavity ringdown and high 546
resolution Fourier transform spectroscopy with a long-path absorption cell. J. Chem. Phys. 110, 10749–547 10757. https://doi.org/10.1063/1.479018 548
Newman, S.M., Orr-Ewing, A.J., Newnham, D.A., Ballard, J., 2000. Temperature and pressure dependence of line 549 widths and integrated absorption intensities for the O2 a1Δg - X3∑g
- (0,0) transition. J. Phys. Chem. A 104, 550 9467–9480. 551
Ngo, N.H., Lisak, D., Tran, H., Hartmann, J.-M., 2013. An isolated line-shape model to go beyond the Voigt profile 552 in spectroscopic databases and radiative transfer codes. J. Quant. Spectrosc. Radiat. Transf. 129, 89–100. 553 https://doi.org/10.1016/j.jqsrt.2013.05.034 554
Predoi-Cross, A., Hambrook, K., Keller, R., Povey, C., Schofield, I., Hurtmans, D., Over, H., Mellau, G.C., 2008. 555 Spectroscopic lineshape study of the self-perturbed oxygen A-band. J. Mol. Spectrosc. 248, 85–110. 556 https://doi.org/10.1016/j.jms.2007.11.007 557
Rohart, F., Mäder, H., Nicolaisen, H.-W., 1994. Speed dependence of rotational relaxation induced by foreign gas 558 collisions: Studies on CH3F by millimeter wave coherent transients. J. Chem. Phys. 101, 6475–6486. 559 https://doi.org/10.1063/1.468342 560
Rothman, L.S., Gordon, I.E., Babikov, Y., Barbe, A., Chris Benner, D., Bernath, P.F., Birk, M., Bizzocchi, L., 561 Boudon, V., Brown, L.R., Campargue, A., Chance, K., Cohen, E.A., Coudert, L.H., Devi, V.M., Drouin, 562 B.J., Fayt, A., Flaud, J.-M., Gamache, R.R., Harrison, J.J., Hartmann, J.-M., Hill, C., Hodges, J.T., 563 Jacquemart, D., Jolly, A., Lamouroux, J., Le Roy, R.J., Li, G., Long, D.A., Lyulin, O.M., Mackie, C.J., 564 Massie, S.T., Mikhailenko, S., Müller, H.S.P., Naumenko, O.V., Nikitin, A.V., Orphal, J., Perevalov, V., 565 Perrin, A., Polovtseva, E.R., Richard, C., Smith, M.A.H., Starikova, E., Sung, K., Tashkun, S., Tennyson, 566 J., Toon, G.C., Tyuterev, V.G., Wagner, G., 2013b. The HITRAN2012 molecular spectroscopic database. J. 567 Quant. Spectrosc. Radiat. Transf., HITRAN2012 special issue 130, 4–50. 568 https://doi.org/10.1016/j.jqsrt.2013.07.002 569
Rothman, L.S., Gordon, I.E., Barbe, A., Benner, D.C., Bernath, P.F., Birk, M., Boudon, V., Brown, L.R., 570 Campargue, A., Champion, J.-P., Chance, K., Coudert, L.H., Dana, V., Devi, V.M., Fally, S., Flaud, J.-M., 571 Gamache, R.R., Goldman, A., Jacquemart, D., Kleiner, I., Lacome, N., Lafferty, W.J., Mandin, J.-Y., 572 Massie, S.T., Mikhailenko, S.N., Miller, C.E., Moazzen-Ahmadi, N., Naumenko, O.V., Nikitin, A.V., 573 Orphal, J., Perevalov, V.I., Perrin, A., Predoi-Cross, A., Rinsland, C.P., Rotger, M., Šimečková, M., Smith, 574 M.A.H., Sung, K., Tashkun, S.A., Tennyson, J., Toth, R.A., Vandaele, A.C., Vander Auwera, J., 2009. The 575 HITRAN 2008 molecular spectroscopic database. J. Quant. Spectrosc. Radiat. Transf., HITRAN 110, 533–576 572. https://doi.org/10.1016/j.jqsrt.2009.02.013 577
Rothman, L.S., Jacquemart, D., Barbe, A., Chris Benner, D., Birk, M., Brown, L.R., Carleer, M.R., Chackerian Jr., 578 C., Chance, K., Coudert, L.H., Dana, V., Devi, V.M., Flaud, J.-M., Gamache, R.R., Goldman, A., 579 Hartmann, J.-M., Jucks, K.W., Maki, A.G., Mandin, J.-Y., Massie, S.T., Orphal, J., Perrin, A., Rinsland, 580 C.P., Smith, M.A.H., Tennyson, J., Tolchenov, R.N., Toth, R.A., Vander Auwera, J., Varanasi, P., Wagner, 581 G., 2005. The HITRAN 2004 molecular spectroscopic database. J. Quant. Spectrosc. Radiat. Transf. 96, 582 139–204. https://doi.org/10.1016/j.jqsrt.2004.10.008 583
Shannon, I., Harris, M., McHugh, D.R., Lewis, E.L., 1986. Low-pressure spectral line profiles: an analysis in terms 584 of symmetric speed-dependent Voigt profiles. J. Phys. B At. Mol. Phys. 19, 1409. 585 https://doi.org/10.1088/0022-3700/19/10/011 586
Smith, K.M., Newnham, D.A., 2000. Near-infrared absorption cross sections and integrated absorption intensities of 587 molecular oxygen (O2, O2-O2, and O2-N2). J. Geophys. Res. Atmospheres 105, 7383–7396. 588 https://doi.org/10.1029/1999JD901171 589
Smith, K.M., Newnham, D.A., Williams, R.G., 2001. Collision-induced absorption of solar radiation in the 590 atmosphere by molecular oxygen at 1.27 μm: Field observations and model calculations. J. Geophys. Res. 591 Atmospheres 106, 7541–7552. https://doi.org/10.1029/2000JD900699 592
Strong, K., Mendonca, J., Weaver, D., Fogal, P., Drummond, J.R., Batchelor, R., Lindenmaier, R., 2017. TCCON 593 data from Eureka (CA), Release GGG2014.R1. 594 https://doi.org/10.14291/tccon.ggg2014.eureka01.R1/1325515 595

17
Toon, G. C., 2014a. Telluric line list for GGG2014, TCCON data archive. Carbon Dioxide Inf. Anal. Cent. Oak 596 Ridge Natl. Lab. Oak Ridge Tenn. USA. https://doi.org/10.14291/tccon.ggg2014.atm.R0/1221656 597
Toon, G. C., 2014b. Solar line list for GGG2014. TCCON Data Arch. Hosted Carbon Dioxide Inf. Anal. Cent. Oak 598 Ridge Natl. Lab. Oak Ridge Tenn. USA. 599
Toon, G.C., 1991. The JPL MkIV interferometer. Opt. Photonics News 2, 19–21. 600 https://doi.org/10.1364/OPN.2.10.000019 601
Tran, H., Boulet, C., Hartmann, J.-M., 2006. Line mixing and collision-induced absorption by oxygen in the A band: 602 Laboratory measurements, model, and tools for atmospheric spectra computations. J. Geophys. Res. 603 Atmospheres 111, D15210. https://doi.org/10.1029/2005JD006869 604
Tran, H., Hartmann, J.-M., 2008. An improved O2 A band absorption model and its consequences for retrievals of 605 photon paths and surface pressures. J. Geophys. Res. Atmospheres 113, D18104. 606 https://doi.org/10.1029/2008JD010011 607
Tran, H., Ngo, N.H., Hartmann, J.-M., 2013. Efficient computation of some speed-dependent isolated line profiles. 608 J. Quant. Spectrosc. Radiat. Transf. 129, 199–203. https://doi.org/10.1016/j.jqsrt.2013.06.015 609
Wallace, L., Livingston, W., 1990. Spectroscopic observations of atmospheric trace gases over Kitt Peak. I - Carbon 610 dioxide and methane from 1979 to 1985. J. Geophys. Res. 95, 9823–9827. 611 https://doi.org/10.1029/JD095iD07p09823 612
Washenfelder, R.A., Toon, G.C., Blavier, J.-F., Yang, Z., Allen, N.T., Wennberg, P.O., Vay, S.A., Matross, D.M., 613 Daube, B.C., 2006. Carbon dioxide column abundances at the Wisconsin Tall Tower site. J. Geophys. Res. 614 Atmospheres 111, D22305. https://doi.org/10.1029/2006JD007154 615
Wehr, R.A., 2005. Dicke -narrowed spectral lines in carbon monoxide buffered by argon (Ph.D.). University of 616 Toronto (Canada), Canada. 617
Wennberg, P.O., Roehl, C.M., Wunch, D., Toon, G.C., Blavier, J.-F., Washenfelder, R., Keppel-Aleks, G., Allen, 618 N.T., Ayers, J., 2017a. TCCON data from Park Falls (US), Release GGG2014.R0. 619 https://doi.org/10.14291/tccon.ggg2014.parkfalls01.R0/1149161 620
Wennberg, P.O., Wunch, D., Roehl, C.M., Blavier, J.-F., Toon, G.C., Allen, N.T., Dowell, P., Teske, K., Martin, C., 621 Martin, J., 2017b. TCCON data from Lamont (US), Release GGG2014.R0. 622 https://doi.org/10.14291/tccon.ggg2014.lamont01.R0/1149159 623
Wójtewicz, S., Cygan, A., Masłowski, P., Domysławska, J., Lisak, D., Trawiński, R.S., Ciuryło, R., 2014. Spectral 624 line shapes of self-broadened P-branch transitions of oxygen B band. J. Quant. Spectrosc. Radiat. Transf. 625 144, 36–48. https://doi.org/10.1016/j.jqsrt.2014.03.029 626
Wunch, D., Toon, G.C., Blavier, J.-F.L., Washenfelder, R.A., Notholt, J., Connor, B.J., Griffith, D.W.T., Sherlock, 627 V., Wennberg, P.O., 2011. The Total Carbon Column Observing Network. Philos. Trans. R. Soc. Math. 628 Phys. Eng. Sci. 369, 2087–2112. https://doi.org/10.1098/rsta.2010.0240 629
Wunch, D., Toon, G.C., Sherlock, V., Deutscher, N.M., Liu, C., Feist, D.G., Wennberg, P.O., 2015. The Total 630 Carbon Column Observing Network’s GGG2014 Data Version. 631 https://doi.org/10.14291/tccon.ggg2014.documentation.R0/ 1221662 632
Wunch, D., Toon, G.C., Wennberg, P.O., Wofsy, S.C., Stephens, B.B., Fischer, M.L., Uchino, O., Abshire, J.B., 633 Bernath, P., Biraud, S.C., Blavier, J.-F.L., Boone, C., Bowman, K.P., Browell, E.V., Campos, T., Connor, 634 B.J., Daube, B.C., Deutscher, N.M., Diao, M., Elkins, J.W., Gerbig, C., Gottlieb, E., Griffith, D.W.T., 635 Hurst, D.F., Jiménez, R., Keppel-Aleks, G., Kort, E.A., Macatangay, R., Machida, T., Matsueda, H., 636 Moore, F., Morino, I., Park, S., Robinson, J., Roehl, C.M., Sawa, Y., Sherlock, V., Sweeney, C., Tanaka, 637 T., Zondlo, M.A., 2010. Calibration of the Total Carbon Column Observing Network using aircraft profile 638 data. Atmos Meas Tech 3, 1351–1362. https://doi.org/10.5194/amt-3-1351-2010 639
Yang, Z., Toon, G.C., Margolis, J.S., Wennberg, P.O., 2002. Atmospheric CO2 retrieved from ground-based near IR 640 solar spectra. Geophys. Res. Lett. 29, 1339. https://doi.org/10.1029/2001GL014537 641
Yokota, T., Yoshida, Y., Eguchi, N., Ota, Y., Tanaka, T., Watanabe, H., Maksyutov, S., 2009. Global 642 Concentrations of CO2 and CH4 Retrieved from GOSAT: First Preliminary Results. Sola 5, 160–163. 643 https://doi.org/10.2151/sola.2009-041 644
Yu, S., Drouin, B.J., Miller, C.E., 2014. High resolution spectral analysis of oxygen. IV. Energy levels, partition 645 sums, band constants, RKR potentials, Franck-Condon factors involving the X3Σg
−, a1Δg and b1Σg+ states. J. 646
Chem. Phys. 141, 174302. https://doi.org/10.1063/1.4900510 647 648
649

18
Figures 650
651
Figure 1: (a) Cavity-ring-down absorption coefficients for O2 measured at the three pressures indicated in the 652 legend at approximately room temperature and a volume mixing ratio of 0.20720(43) for O2. The difference 653 between measured absorption coeffcients and those calculated using (b) a Voigt line shape, and (c) the speed-654 dependent Voigt line shape. Note the difference in scale between panels (b) and (c). 655
656
657
658

19
659
Figure 2: The same as Figure 1 but zoomed into expanded to show four spectral lines in the P branch of the 660 O2 1.27 μm band. 661
662
663
664
665
666
667
668
20
669
Figure 3: The averaged measured (a) intensity, (b) Lorentz line width, (c) pressure shift, and (d) speed-670 dependent pressure shift retrieved from the three cavity ring-down spectra of the 1.27 m band of O2. All 671 data are plotted as a function of lower state rotational quantum number J m which is m =-J for the P-branch 672 lines, m=J for the Q-branch, and m=J+1 for the R-branch (where J is the lower state rotational quantum 673 number) and the uncertainties shown are 2σ. 674
675
676
677
678
679
680
681

21
682
Figure 4: (a) The averaged measured speed-dependent width parameter of the 1.27 m band of O2 plotted as 683 a function of m.lower state rotational quantum number 𝑱′′. (b) The measured speed-dependent width 684 parameter for spectral lines that belong to the PQ sub-branch plotted as a function of m.lower state 685 rotational quantum number 𝑱′′. 686
687
688
689
690

22
691
Figure 5: (a) The residuals (measured minus calculated) for a spectrum measured at Eureka on March 27, 692 2015 at a SZA of 81.32o. The red residual is the result of using the Voigt line shape and the blue is from using 693 the qSDV. (b) The measured (red dots) and calculated (black dots), with the qSDV, spectrum, along with the 694 gases included in the fit (refer to the legend to the right) in the spectral window. 695
696
697
698
699
700
701

23
702
Figure 6: The percent difference between the O2 column retrieved with the Voigt and qSDV line shapes for a 703 year of measurements from Eureka (eu), Park Falls (pa), Lamont (oc), and Darwin (db). 704
705
706
707
708

24
709
Figure 7: XAIR from Park Falls retrieved from spectra recorded on June 18, 2013. XAIR is calculated using 710 O2 columns retrieved using a Voigt (red) and qSDV (green) line shapes. 711
712
713
714
715

25
716
Figure 8: XCO2 calculated from the CO2 and O2 columns retrieved from Park Falls spectra recorded on June 717 18, 2013. The CO2 columns were retrievied using either the Voigt line shape or the qSDV with line mixing, 718 while the O2 columns were retrieved using either the Voigt or qSDV line shapes. XCO2 was calculated in 719 four ways: 1) Both CO2 and O2 columns retrieved using the Voigt line shape (red), 2) CO2 columns retrieved 720 with the Voigt and O2 columns retrieved with the qSDV (green), 3) CO2 columns retrieved with the qSDV 721 and line mixing and O2 columns retrieved with the Voigt (cyan), and 4) CO2 columns retrieved with the qSDV 722 and line mixing and O2 columns retrieved with the qSDV (blue). 723
724
725

26
726
Figure 97: The average airmass-dependent correction factor for XCO2 derived from a year of spectra 727 measured at Darwin, Lamont, and Park Falls for different seasons. The dashed lines with stars are the α for 728 XCO2 retrieved using a Voigt line shape for both CO2 and O2 columns. The solid lines with squares are from 729 XCO2 retrieved using the qSDV for both CO2 and O2 columns. 730
731
732
733
734
735
736
737

27
738
Figure 108: (a) XCO2 Voigt anomaly for a year of measurements from the four TCCON sites. The XCO2 739 anomaly is the difference between each XCO2 value and the daily median XCO2. (b) The XCO2 Voigt 740 anomaly after the airmass dependence correction is applied to the XCO2 Voigt data. (c) XCO2 qSDV 741 anomaly. (d) XCO2 qSDV anomaly after correction for the airmass dependence. 742
743
744
745
746
747
748

28
749
Figure 119: (a) Correlation between TCCON and aircraft XCO2 Voigt measurements for 13 TCCON sites. 750 Each aircraft type is indicated by a different symbol given by the legend in the top left corner. Each site is 751 represented by a different colour given by the legend in the bottom right corner. The grey line indicates the 752 one-to-one line and the dashed line is the line of best fit for the data. The slope of the line of best fit as well as 753 the error on the slope are given in the plot. (b) the same as (a) but for XCO2 qSDV. 754
755
756
757

29
758
Figure 1210: (a) to (d) XCO2 plotted as a function of day of the year for Eureka (2014), Park Falls (2013), 759 Lamont (2010), and Darwin (2006) respectively. The red boxes are XCO2 calculated from using a Voigt line 760 shape in the retrieval and the blue boxes are from using the qSDV. (e) to (h) the difference between XCO2 761 Voigt and XCO2 qSDV. 762
763
764
765

30
766
Figure 1311: (a) XCO2 from Park Falls retrieved from spectra recorded on June 18, 2013. Plotted is XCO2 767 retrieved: (1) with a Voigt line shape and corrected for the airmass dependence (red squares), (2) with the 768 qSDV (cyan circles), and (3) with the qSDV and corrected for the airmass dependence (blue squares). (b) the 769 difference between the Voigt XCO2 corrected and the qSDV XCO2 (cyan circles), and the difference between 770 the Voigt XCO2 corrected and the qSDV XCO2 corrected (blue squares). 771
772
Recommended