Athens Journal of Sciences- Volume 3, Issue 3 – Pages 183-198
https://doi.org/10.30958/ajs.3-3-1 doi=10.30958/ajs.3-3-1
Use of Satellite Images to Map Spatio-temporal
Variability of PM2.5 in Air
By Saif Uddin
Dust storm episodes are among the most important weather phenomena in arid
countries around the world. Fine particulate matter in the air is a major health
hazard; besides, dust storms can alter air temperatures as a result of scattering and
absorption of solar radiation. The size and type of aerosol have a major influence on
radiation, in addition to cloud cover and surface albedo. Heavy dust storms have been
reported to result in the lowering of ocean temperatures which may affect primary
productivity of seas and oceans, and impact carbon dioxide sequestration. The rates of
dust fallout in Kuwait had been reported to be among the highest in the world with
mean monthly concentrations as high as 1400 µg m-3
. Remote sensing measurements
by virtue of their synoptic monitoring capabilities were used to quantify dust on a
large spatiotemporal scale. The satellite data set from the Multiangle Imaging Spectro
Radio Meter (MISR) and the Moderate Resolution Imaging Spectroradiometer
(MODIS) were used for determining the aerosol optical depth (AOD) over land and
ocean surfaces through observation at visible and infrared wavelengths. The AODs
were used for PM2.5 quantification and generation of PM2.5 spatio-temporal trends. These data sets were downloaded from the Atmospheric Sciences Data Center of the
National Aeronautical and Space Administration (NASA) Langley Research Center
(LARC) from 2008 to 2014. The satellite-derived particulate matter (PM) counts were
verified by field measurements using an infrared particle counter and high-volume air
samplers. One high-volume air sampler (HVAS) equipped with a six-stage cascade
impactor was deployed at Abdalli (Iraq-Kuwait Border) and at Kuwait City (KISR).
Particulate counts and particulate mass were recorded using Aerocet 531 particle
counters at both sites to further calibrate the measurements. The accuracy of the
MISR determination was 68% and 62% for MODIS. This satellite data derived PM2.5,
using AOD can be used as surrogate for PM measurement.
Keywords: Aerosol Optical Depth, Dust, Health, Particulate Matter.
Introduction
Dust storm episodes are among the most important weather phenomena in
arid countries around the world (Al-Awadhi, 2005; Chi et al., 2008; Garrison
et al., 2006). They are caused by high-energy winds eroding the topsoil in
regions with a minimal vegetation cover. Kuwait and other countries in the
Middle East experience some of the worst dust storm episodes around the
world. Kuwait is particularly susceptible to dust storms because of its low
topography, scant vegetative cover, and strong turbulent winds that occur
particularly in the summer months (Al-Awadhi, 2005). The rates of dust fallout
Research Scientist, Kuwait Institute for Scientific Research, Kuwait.

Vol. 3, No. 3 Uddin: Use of Satellite Images to Map Spatio-temporal...
184
in Kuwait had been reported to be among the highest in the world (Foda et al.,
1985) with mean monthly concentrations as high as 1400 µg m-3
.
It is possible to trace the origin of dust and its transport pathway from the
nature of the particulate matter (PM). The frequency of dust activity can be
related to long- and short-term climate changes (Prasad and Singh, 2007).
Climatic processes can also be affected by dust events (Boucher and Haywood,
2001). Air temperatures, for example, may be altered by dust as a result of
scattering and absorption of solar radiation (Li et al., 1996; Moulin et al.,
1997; Alpert et al., 1998; Miller and Tegen, 1998; Goudie and Middleton,
2001). Suspended dust modifies the short-wave solar radiation transmitted
through to the earth and the long-wave infrared radiation emitted to space
(Goudie and Middleton, 2001). Also, the size and type of aerosol have a major
influence on radiation, in addition to cloud cover and surface albedo. Heavy
dust storms have been reported to result in the lowering of ocean temperatures
which may affect primary productivity of seas and oceans (Pierson et al., 2003)
and impact carbon dioxide sequestration (Ridgwell, 2002). This study utilized
satellite data to estimate atmospheric aerosol especially PM2.5, which had been
reported to have a significant effect on human health (Dockery et al., 1993;
Pope and Dockery, 2006; Pope et al., 2002) and on the regional and global
climatic changes (Hansen et al., 1998; Hurtado et al., 1996; Ramanathan et
al., 2007; Hu et al., 2010). Several reports have indicated that dust serves as a
vehicle for long-range transport of associated contaminants including viruses
(Griffin, 2007; Reynolds and Pepper, 2000; Williamson et al., 2003; Yates and
Yates, 1988), pathogens (Garrison et al., 2006; Griffin, 2007; Griffin et al.,
2002), trace metals (Di-Lella et al., 2006), and organic pollutants (Di-Lella et
al., 2006; Gevao et al., 2011).
Remote Sensing-Based Measurements
Remote sensing measurements by virtue of their synoptic monitoring
capabilities can be used to quantify dust on a large spatiotemporal scale.
Currently, the Multiangle Imaging Spectro Radio Meter (MISR), which can
determine AOD over land and ocean surfaces through observation at visible
and infrared wavelengths (King et al., 1992, 1999; Kaufman et al., 1997; Diner
et al., 1998, 2002; Martonchik et al., 1998, 2002; Kahn et al., 1998, 2005a,
2005b; Liu et al., 2004, 2005, 2007a, 2007b, 2009; Hu et al., 2010) was used.
Images over Kuwait and adjacent areas were procured from the National
Aeronautics and Space Administration (NASA). The relationship between the
MISR AOD and surface PM2.5 was established. The PM2.5 data was also
correlated using in situ measurements at two calibration sites: one in Abdalli
and another at the Kuwait Institute for Scientific Research (KISR) Shuwaikh.
A high degree of correlation was observed between the MISR AOD and the
PM2.5 estimates. However, the relationship was empirical due to the
complicated dependence on multiple factors, including aerosol chemistry,
particulate size distribution, aerosol profile, and most importantly, the

Athens Journal of Sciences September 2016
185
atmospheric conditions. Moderate Resolution Imaging Spectroradiometer
(MODIS) has fewer and poor retrievals over Kuwait because of high surface
albedo. However, with the collection 6 data, the problem was solved, and now,
MODIS will be a more useful sensor for PM retrieval. The satellite-based
measurements used in AOD as a quantitative measure of PM abundance in the
atmospheric column. AOD is dominated by near surface emission sources and
can be used to track long-range dust transport pathways caused by a storm
event (Seinfeld and Pandis, 1998). AOD retrieved at visible wavelengths is
sensitive to 0.1 to 2 μm particle size (Kahn et al., 1998b) and is not affected by
gaseous co-pollutants, providing a noisy measurement of fine PM loading over
large spatial areas.
Methodology
The methodology proposed by Liu (Liu et al., 2004) for PM estimation
using MISR data was used. The method had demonstrated the validity of the
MISR AOT with a standard ground level aerosol optical thickness (AOT)
measurement from the Aerosol Robotic Network (AERONET). The sensitivity
of the MISR AOT measurements from (0.05 to 2.0 µm) had also been reported
(Kahn et al., 1998b, 2001; Liu et al., 2005; Hu et al., 2010). Field validation
of the PM2.5 retrievals from the satellite data sets was carried out at the Abdalli
and at KISR’s Shuwaikh campus on a weekly basis over the past 36 mo. The
samples were collected using a high-volume air sampler (HVAS) fitted with a
six-stage cascade impactor. The metrological parameters such as mixing
height, relative humidity (RH), air temperature, and wind speed, which could
affect PM2.5 retrievals, using AOD were also accounted. The rapid update cycle
(RUC) model of the Earth System Research (ERS) group was used to integrate
the various metrological data sources.
Determination of AOD
MISR’s aerosol retrieval algorithmsdoes not depend on explicit
radiometric surface properties (Martonick et al., 2004, 16102 – p 1- 4,
American geophysical Union). Therefore, MISR can retrieve aerosol properties
over a variety of terrain conditions, including highly reflective surfaces like
Kuwait. “Observing continuously at nine distinct zenith angles and in four
narrow spectral bands centered at 446, 558, 672, and 866 nm”. MISR repeats
its measurements every 16 d in tropical region. Version 22 MISR aerosol data,
were used, which has a spatial resolution of 17.6 km. “In this dataset, there are
74 different aerosol mixtures that are constructed from up to 3 of the 8 pre-
defined aerosol components (i.e., components 1, 2, 3, 6, 8, 14, 19, and 21)”
(Liu, 2009, IEEE, p.177) (Figure 1).
Each MISR aerosol component is defined by size distribution, shape, and
single scattering albedo, of which the two (components 19 and 21) are

Vol. 3, No. 3 Uddin: Use of Satellite Images to Map Spatio-temporal...
186
designed for dust particles. “A detailed discussion of the MISR data structure,
the aerosol components used to construct the aerosol models and the
percentage contribution of each component to total AOD as given
elsewhere”(Liu, 2009, IEEE, 177). The MISR aerosol data covering Kuwait
and its surrounding areas from 2008 to 2014 were processed. The data were
downloaded from the NASA Langley Research Center (LARC) Atmospheric
Sciences Data Center.
Figure 1. AOD Map for the Study Area Corresponding to 01 April 2008
Athens Journal of Sciences September 2016
187
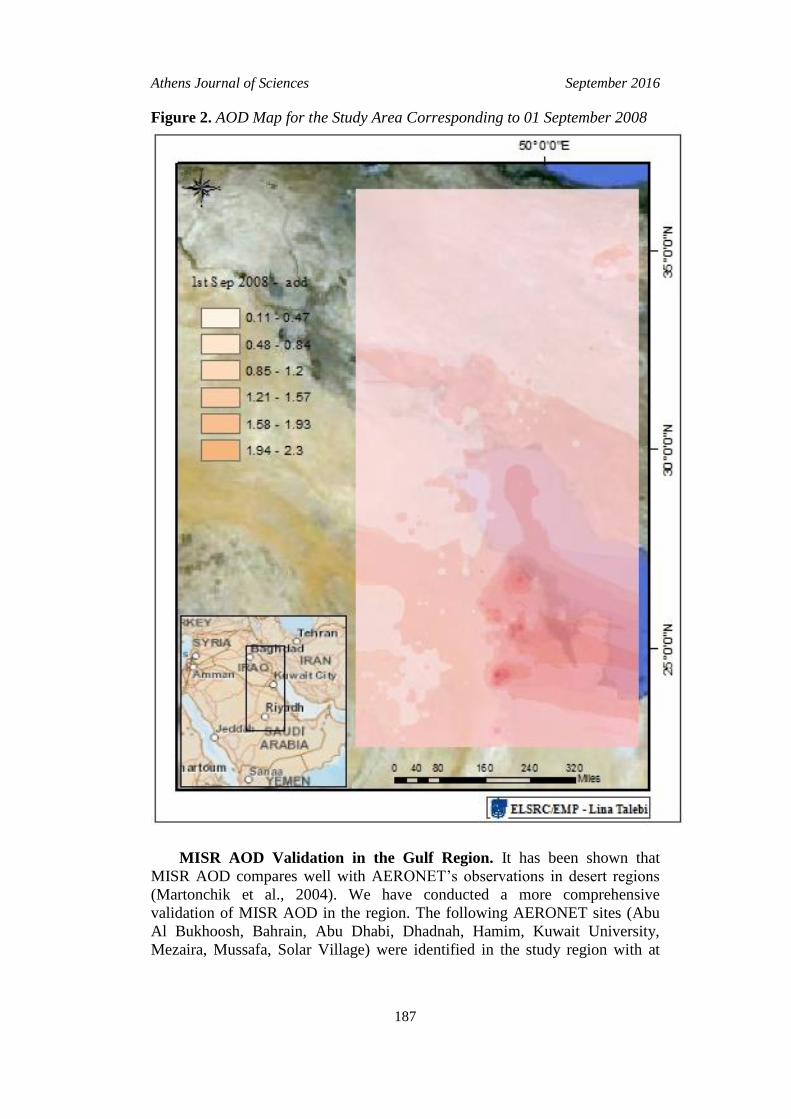
Figure 2. AOD Map for the Study Area Corresponding to 01 September 2008
MISR AOD Validation in the Gulf Region. It has been shown that
MISR AOD compares well with AERONET’s observations in desert regions
(Martonchik et al., 2004). We have conducted a more comprehensive
validation of MISR AOD in the region. The following AERONET sites (Abu
Al Bukhoosh, Bahrain, Abu Dhabi, Dhadnah, Hamim, Kuwait University,
Mezaira, Mussafa, Solar Village) were identified in the study region with at

Vol. 3, No. 3 Uddin: Use of Satellite Images to Map Spatio-temporal...
188
least one year of operation time. These data of AERONET data were
downloaded from the NASA Goddard Space Flight Center (http://aeronet.gsfc.
nasa.gov/). MISR AOD maps are generated for the area (Figures 1 and 2).
Sampling and Particulate Quantification
The sampling campaign was initiated in April 2012. Size-segregated
aerosol samples were collected using a six-stage high volume cascade impactor
(Tisch Environmental, Inc) on the premises of KISR (29o 20.227 N; 47
o 54.208
E) and Abdalli (30o
02.312N; 47o 49.589E). The sampler was located about 2
m above the ground. Over each sampling period that lasted 24 h, approximately
815±5 m3 of air was drawn through the cascade impactor at a constant flow
rate of 0.855 m3/min to trap various aerodynamic particles on different filters.
The particles were separated into the aerodynamic diameter (Dp) sizes ranges
such as the following: < 0.39 (backup high-volume filter), 0.39 to 0.69, 0.69 to
1.3, 1.3 to 2.1, 2.1 to 4.2, 4.2 to 10.2 and > 10.2 µm. In addition to the weekly
sampling, the samples were also collected on all dusty days to capture the
spatiotemporal variations in the PM concentrations.
In addition to the in situ HVAS sampling, a noninvasive infrared (IR)-
based measurement was also taken up for both particulate count and particulate
mass determination using a Metone Aerocet 531 particle mass profiler and
counter, which takes hourly measurements and logs the data in the built-in data
logger.
Calibration of Field and Laboratory Equipment
Air volumes for each sample collected were determined using a flowmeter
with a flow tantalizer, in addition to a Magnehelic gauge (Tisch
Environmental, Inc.). Calibrations were done in accordance with the
manufacturer’s guidelines. The calibrations were performed upon installation
of the sampler, and at least once every quarter.
Model Development for PM2.5 Estimation
Given the scarcity of ground level PM2.5 measurements in the study region,
a technique that can estimate regional PM2.5 concentrations without ground
data support becomes an important tool. MISR has eight aerosol components
that are indicative of different contributions to ground-level PM2.5
concentrations; the total MISR column AOD was disassembled into species-
related fractions using the AOD value associated with, and the three aerosol
components defined by each of the 74 aerosol mixtures (Eq. 1). The fractional
AOD of a MISR aerosol component is defined as the average contribution of
this component to a total AOD. For example, if MISR does not observe the

Athens Journal of Sciences September 2016
189
presence of any dust particles in a 17.6-km pixel, the fractional AODs for dust
components (i.e., 19 and 21) would be zero. By definition, the sum of all the
significant fractional AODs is equal to the total column AOD.
MixturesSuccessfulofNo
FractionAOD
=AOD Fractionalj
jmixture in i componentjmixture
1, 8)(i i .
74
1
__
(1)
Then, the simulated AOD and PM2.5 concentrations from GEOS-Chem
model were used to define a physically consistent relationship between AOD
and surface level PM2.5 concentration (Eq. 2). GC surface [PM2.5] in Eq. 2
refers to the sum of GEOS-Chem fine particle species concentrations within
one kilometer from the surface, and GC column dust AOD refers to the sum of
GEOS-Chem total AOD in all 35 layers. A similar analysis for dust particles
were performed.
AOD MISR dustAOD DustGC Column
Dust] GC Surface Dust
MISR AODAODGC Column
PM2.5] GC Surface PM2.5
[][
[][
(2)
This technique had been demonstrated previously using the early version
MISR and GEOS-Chem data in the US (Liu et al., 2004) and was successfully
utilized in the present study. The annual MISR PM2.5 concentrations exhibited
an improved agreement with the ground measurements in terms of spatial
pattern as compared to simulated PM2.5 concentrations. The annual average
MISR PM2.5 concentrations had a good linear relationship with the ground
measurements (r = 0.69, linear regression slope = 0.87), and the estimated
intercept was insignificant (p = 0.81).
High-resolution spatial statistical models were developed using ground
PM2.5 measurements from the two sites in the study region and Collection 6
MODIS 10-km AOD data. Given the limited ground data support (one site in
Abdalli, KISR, and Wafra each), a linear mixed effects model was developed
similar to, but more advanced than that presented in Lee et al. (2011). This
random intercept, random slope model can be expressed as follows:
(3)
where [PM2.5]i,j is the daily PM2.5 concentration at monitoring site i on day j;
MODIS AODi,j is the average of Collection 6 Terra and Aqua MODIS AOD in
the 10 km x 10 km grid cell corresponding to monitoring site i on day j; α and
uj are the fixed and random intercepts, respectively; β1 and vj are the fixed and
random slopes on same day AOD, respectively; β2 and ωj are the fixed and
Vol. 3, No. 3 Uddin: Use of Satellite Images to Map Spatio-temporal...
190
random slopes on previous day AOD, respectively; εi,j ~ N(0, σ2) is the error
term at site i and on day j. In this statistical model, the AOD fixed effect
represents the average effect of AOD on PM2.5 for all study days. The AOD
random effects explain the daily variability in the PM2.5-AOD relationship.
Given the limited number of monitoring sites, a random intercept was not
included for the site.
Because no previous studies have been done for desert regions, other
statistical model format was explored. A generalized additive model (Liu et al,,
2012b) was tried as well (Eq. 4):
(4)
Where all the covariates on the right hand side of Eq. (3) are averaged
spatially and therefore only vary with time; μ is the model intercept;
fAOD(AOD) is the smooth regression term describing the association between
AOD and PM2.5; fAOD2(AOD_lag) is the smooth regression term, describing the
association between mean AOD of previous two days and PM2.5, fRH(RH) and
fTEMP(TEMP) are smooth regression terms, describing the impact of domain-
averaged relative humidity (RH), and surface air temperature (TEMP) on the
AOD–PM2.5 association, respectively. The inclusion of lag AOD term reflects
the fact that urban aerosol has a general lifetime of a few days without major
scavenging events. Precipitation on a given day (precip) and precipitation on
the previous day (precip_lag) are both modeled as a binary variable (0=no rain,
1=rain). The weekend effect is reflected here as a binary variable (weekend=1
if Friday and Saturday, =0 otherwise).
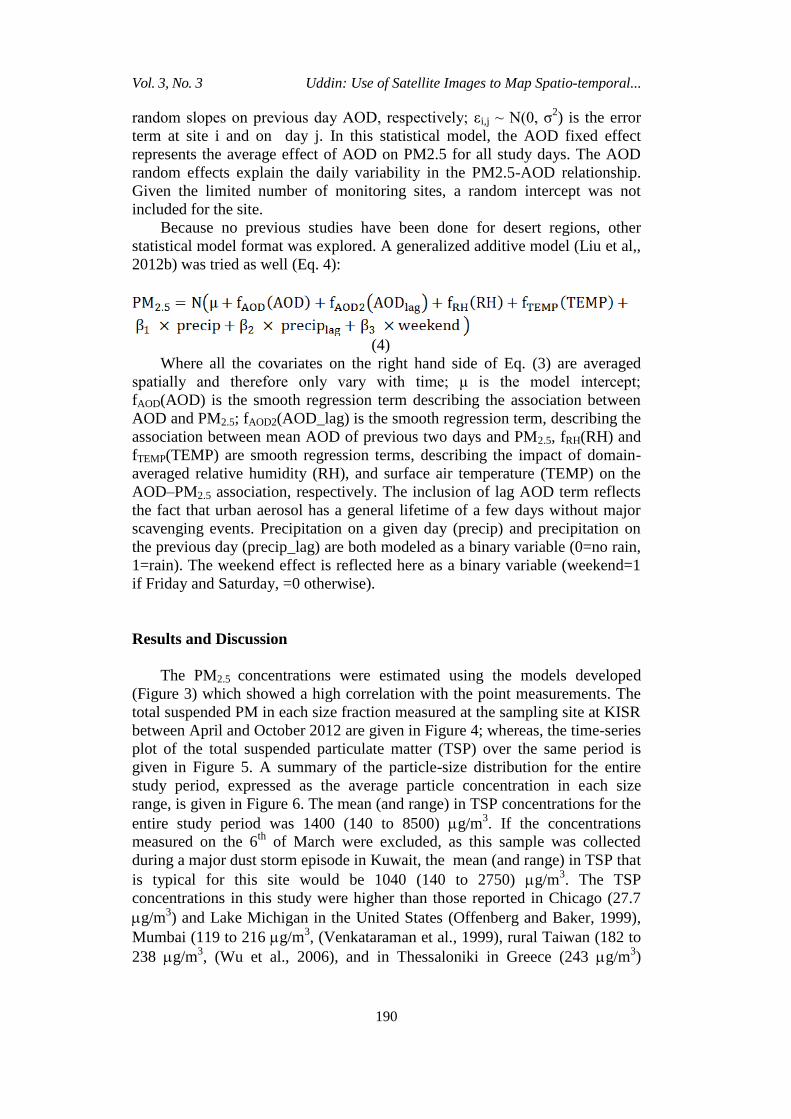
Results and Discussion
The PM2.5 concentrations were estimated using the models developed
(Figure 3) which showed a high correlation with the point measurements. The
total suspended PM in each size fraction measured at the sampling site at KISR
between April and October 2012 are given in Figure 4; whereas, the time-series
plot of the total suspended particulate matter (TSP) over the same period is
given in Figure 5. A summary of the particle-size distribution for the entire
study period, expressed as the average particle concentration in each size
range, is given in Figure 6. The mean (and range) in TSP concentrations for the
entire study period was 1400 (140 to 8500) g/m3. If the concentrations
measured on the 6th
of March were excluded, as this sample was collected
during a major dust storm episode in Kuwait, the mean (and range) in TSP that
is typical for this site would be 1040 (140 to 2750) g/m3. The TSP
concentrations in this study were higher than those reported in Chicago (27.7
g/m3) and Lake Michigan in the United States (Offenberg and Baker, 1999),
Mumbai (119 to 216 g/m3, (Venkataraman et al., 1999), rural Taiwan (182 to
238 g/m3, (Wu et al., 2006), and in Thessaloniki in Greece (243 g/m
3)

Athens Journal of Sciences September 2016
191
(Chrysikou et al., 2009), and in Hamilton, Ontario Canada (58–121 g/m3)
(Katz and Chan, 1980). These high TSP values measured in Kuwait may be
due in part, to the fact that Kuwait is a desert country where high-energy winds
often result in localized or regional dust storms. The rates of dust fallout in
Kuwait have been reported to be one of the highest in the world (Foda et al.,
1985). The particle size distribution was bimodal with the major peak located
in the < 0.63-m fraction, constituting about 85% (range 44 to 94%) of the PM
in air. Another small, but distinct peak occurred in the particle size fraction >
10 m. Particles smaller than 3.0 m are easily transported through the
respiratory tract into the bronchioles and alveoli of the lungs and are therefore
a human health risk.
One of the most important indicators of air quality in most industrialized
countries in the world, according to the World Health Organization (WHO) is
the concentration of PM in the air (WHO, 2005). These standards however,
often ignore the concentrations of toxic compounds such as PAHs, trace
metals, and other contaminants, some of which are carcinogens, that are
associated with these particles. This may be due to inadequate information on
the concentrations of the associated contaminants that are required for risk
assessments. It has been shown in several studies that an inverse relationship
exists between particle size and pollutant concentration (Lewis, et al., 1999).
The inhalable (< 10 µm) and respirable (< 2.5 µm) fractions of PM, which
remain suspended in the air the longest, are thought to be the most important
fractions associated with respiratory illnesses. Many studies have linked long-
term exposure to PM with adverse health effects, such as cardiovascular
disease, chronic respiratory illnesses, and cancer. To better understand the risks
posed by particle inhalation, it is important to understand the distribution of
pollutants in various size fractions.

Vol. 3, No. 3 Uddin: Use of Satellite Images to Map Spatio-temporal...
192
Figure 3. PM2.5 Concentrations Using Satellite Datasets
a. 18 March, 2013. b. 10 May, 2013
c. 18 June, 2013. d. 18 November, 2013.

Athens Journal of Sciences September 2016
193
Figure 4. Atmospheric Concentrations of Particles in Different Impactor Size
Ranges in the Air at KISR in Kuwait City between April and August 2012

Vol. 3, No. 3 Uddin: Use of Satellite Images to Map Spatio-temporal...
194
Figure 5. The Total Suspended Particle Concentrations in Different Impactor
Size Ranges in the Air at KISR in Kuwait City between April and August 2012
Figure 6. Average Particle Concentrations in Different Size Ranges and the
Total Suspended Particulate Matter in the Air at KISR in Kuwait City between
April and August 2012
0
200
400
600
800
1000
1200
1400
TSP < 0.69 µm 0.69 - 1.3 µm 1.3 - 2.1 µm 2.1 - 4.2 µm 4.2 - 10.2 µm > 10.2 µm
Pa
rtic
le s
ize
con
cen
tra
tio
n (
µg
/m3
)
Particle size range
Conclusions
This study provided the basic model framework and the setup which can
be populated by continuous data collection both using HVAS and AEROCET
particle counter. The accuracy of the MISR showed a systematic
underestimate, which by additional data collected can be integrated into the

Athens Journal of Sciences September 2016
195
model. The calibration of Collection 6 for MODIS will also provide an
additional opportunity to use MODIS as a reliable satellite for PM estimation.
The PM2.5 concentration from the satellite images were well-correlated with the
measured data both from the IR mass and particle counter and the high volume
air sampler. The accuracy of the MISR determination was close to 68% and
62% for MODIS. There was a systematic underestimation of PM using both
MISR and MODIS data, currently, possibly due to very high back scatter. But
still, these sensors provide a very reasonable estimate of PM2.5 concentration
on a large spatiotemporal scale.
References
Al-Awadhi, J. 2005. Dust fallout characteristics in Kuwait: a case study. Kuwait
Journal of Science and Engineering, 32(2):135-152.
Alpert, P.; Y. J. Kaufman; Y. El-Shay; D. Tanre; A. da Silva; S. Schubert; and J. H.
Joseph. 1998. Quantification of dust-forced heating of the lower troposphere.
Nature, 394:367-370.
Boucher, O., and J. Haywood. 2001. On summing the components of radiative forcing
of climate change. Climate Dynamics, 18:297 - 302.
Chi, K. H.; S. C. Hsu; S. H. Wang; and M. B. Chang. 2008. Increases in ambient
PCDD/F and PCB concentrations in Northern Taiwan during an Asian dust storm
episode. Science of The Total Environment , 401(1-3):100-8.
Chrysikou, L. P., P. G. Gemenetzis and C. A. Samara. 2009. Wintertime size
distribution of polycyclic aromatic hydrocarbons (PAHs), polychlorinated
biphenyls (PCBs) and organochlorine pesticides (OCP) in the urban environment:
street- vs rooftop-level measurements. Environmental Pollution 43, 290-300.
Di-Lella, L. A.; S. Loppi; G. Protano; and F. Riccobono. 2006. Toxic trace elements
and organic compounds in the ambient air of Kabul, Afghanistan. Atmospheric
Environment 40:225-237.
Diner, D.; J. Beckert; T. H. Reilly; C. Bruegge; J. E. Conel; R. A. Kahn; J.
Martonchik; T. P. Ackerman; R. Davies; S. A. W. Gerstl; H. Gordon; J. P.
Muller; R. B. Myneni; P. J. Sellers; B. Pinty; and M. M. Verstraete. 1998. Multi-
angle Imaging SpectroRadiometer (MISR) Instrument Description and
experiment overview. IEEE Transactions Geoscience Remote Sensing 36 1072-
1087.
Diner, D.; J. Beckert; G. Bothwell; and J. Rodriguez. 2002. Performance of the MISR
instrument during its first 20 months in earth orbit. IEEE Transcripts on
Geosciences and Remote Sensing 40(7):1449-1466.
Dockery, D. W.; C. A. Pope; X. Xiping; J. D. Spengler; J. H. Ware; M. E. Fay; B. G.
Ferris, Jr.; and F. E. Speizer. 1993. An association between air pollution and
mortality in six US cities. The New England Journal of Medicine 329:1753-1759.
Foda, M. A.; F. I. Khalaf; and A. S. Al-Kadi. 1985. Estimation of dust fallout rates in
the northern Arabian Gulf. Sedimentology 32:595-603.
Garrison, V. H.; W. T. Foreman; S. enualdi; D. . riffin; . A. Kellogg; M. S.
Majewski; A. Mohammed; A. Ramsubhag; E. A. Shinn; S. . Simonich; and .
. Smith. 2006. Sahara dust a carrier of persistent organic pollutants, metals
and microbes to the Caribbean. International Journal of Tropical Biology and
Conservation 54 (Supplement 3):9-21.

Vol. 3, No. 3 Uddin: Use of Satellite Images to Map Spatio-temporal...
196
Gevao, B.; A. N. Al-Ghadban; S. Uddin; F. M. Jaward; M. Bahloul; and J. Zafar.
2011. Polybrominated diphenyl ethers (PBDEs) in soils along a rural-urban-rural
transect: sources, concentration gradients, and profiles. Environmental Pollution
159:3666-3672.
Goudie, A. S., and N. J. Middleton. 2001. Saharan dust storms: nature and
consequences. Earth-Science Reviews 56:179-204.
Griffin, D. W.; C. A. Kellogg; V. H. Garrison; and E. A. Shinn. 2002. The global
transport of dust. American Scientist , 90:228-235.
Griffin, D. W. 2007. Atmospheric Movement of Microorganisms in Clouds of Desert
Dust and Implications for Human Health. Clinical Microbiology Reviews
20(3):459-477.
Hansen, J.; M. Sato; A. Lacis; R. Ruedy; I. Tegen; and E. Mathews. 1998. Climate
forcings in the industrial era. Proceedings National Academy of Science 95:
12753-12758.
Hu, D.; L. Qiao; J. Chen; X. Ye; X. Yang; T. Cheng; and W. Fang. 2010.
Hygroscopicity of inorganic aerosols: size and relative humidity effects on the
growth factor. Aerosol and Air Quality Research 10:255-264.
Hurtado, E., A. Vidal, and V. Caselles. 1996. Comparison of two atmospheric
correction methods for Landsat TM thermal band. International Journal of
Remote Sensing 17:237 - 247.
Kahn, R.; P. Banerjee; D. McDonald, and D. Diner 1998. Sensitivity of Multiangle
imaging to Aerosol Optical Depth, and to Pure-Particle Size Distribution and
Composition Over Ocean Journal Geophysical Research 103(D24):32195-32213.
Kahn, R.; P. Banerjee; and D. McDonald. 2001. The sensitivity of Multiangle Imaging
to natural mixtures of aerosols over ocean Journal Geophysical Research
106:18219-18238.
Kahn, R.; B. Gaitley; J. Martonchik; D. Diner; K. Crean; and B. Holben. 2005a. MISR
global aerosol optical depth validation based on two years of coincident Aeronet
observations Journal Geophysical Research 110, D10S04.
doi:10.1029/2004JD00406
Kahn, R.; W.-H. Li; J. Martonchik; C. Bruegge; D. Diner; B. Gaitley; W. Abdou; O.
Dubovik; B. Holben; S. Smirnov; Z. Jin; and D. Clark. 2005b. MISR low-light-
level calibration, and implications for aerosol retrieval over dark water Journal
Atmospheric Sciences 62:1032-1062.
Katz, M., and C. Chan. 1980. Comparative distribution of eight polycyclic aromatic
hydrocarbons in airborne particulates collected by conventional high-volume
sampling and by size fractionation, Environmental Science and Technology 14,
838-843.
Kaufman, Y. J.; D. Tanre´; L. Remer; E. F. Vermote; A. Chu; and B. N. Holben. 1997.
Operational remote sensing of tropospheric aerosol over the land from EOS-
MODIS Journal of Geophysical Research 102:17051 -17068.
King, M. D.; W. P. Menzel; and D. Tanré. 1992. Remote sensing of cloud, aerosol,
and water vapor properties from the Moderate Resolution Imaging Spectrometer
(MODIS). IEEE Transactions on Geoscience and Remote Sensing 30:2-27.
King, M. D.; Y. J. Kaufman; D. A. Tanré; and T. Nakajima. 1999. Remote Sensing of
Tropospheric Aerosols from Space: Past, Present, and Future. Bulletin of the
American Meteorological Society 80(11):2229-2259.
Lewis, R. G., C. R. Fortune, R. D. Willis, D. E. Camann, and J. T. Antley. 1999.
Distribution of pesticides and polycyclic aromatic hydrocarbons in house dust as
a function of particle size, Environmental Health Perspective 107, 721-726.

Athens Journal of Sciences September 2016
197
Li, X.; H. Maring; D. Savoie; K. Voss; and J. M. Prospero. 1996. Dominance of
mineral dust in serosol light-scattering in the North Atlantic trade winds. Nature
380:416-419.
Liu, Y.; R. J. Park; D. J. Jacob; Q. B. Li; V. Kilaru; and J. A. Sarnat. 2004. Mapping
annual mean ground-level PM2.5 concentrations using Multiangle Imaging
Spectroradiometer aerosol optical thickness over the contiguous United States.
Journal of Geophysical Research-Atmospheres, 109(D22):Art. No. D22206.
Liu, Y.; J. Sarnat; V. Kilaru; D. Jacob; and P. Koutrakis. 2005. Estimating ground-
level PM2.5 in the eastern United States using satellite remote sensing.
Environment Science and Technology 39(9):3269-3278.
Liu, Y.; M. Franklin; R. Kahn; and P. Koutrakis 2007a. Using aerosol optical
thickness to predict ground-level PM2.5 concentrations in the St. Louis area: a
comparison between MISR and MODIS. Remote Sensing of Environment 107(1-
2):33-44.
Liu, Y.; R. Kahn; and P. Koutrakis. 2007b. Estimating PM2.5 Component
Concentrations and Size Distributions Using Satellite Retrieved Fractional
Aerosol Optical Depth: Part I - Method Development. J. Air & Waste Manage.
Assoc., 57(11):1351-1359.
Liu, Y.; R. A. Kahn; A. Chaloulakou; and P. Koutrakis. 2009. Analysis of the impact
of the forest fires in August 2007 on air quality of Athens using multi-sensor
aerosol remote sensing data, meteorology and surface observations. Atmospheric
Environment 43(21):3310-3318.
Martonchik, J. V.; D. J. Diner; R. A. Kahn; T. P. Ackerman; M. M. Verstraete; B.
Pinty; and H. R. Gordon. 1998. Techniques for the retrieval of aerosol properties
over land and ocean using multiangle imaging. IEEE Transactions of Geoscience
and Remote Sensing 36:1212 - 1227.
Martonchik, J. V.; D. J. Diner; K. A. Crean; and M. A. Bull. 2002. Regional aerosol
retrieval results from MISR. IEEE Transactions on Geoscience and Remote
Sensing 40:1520-1531.
Martonchik, J.; D. Diner; R. Kahn; B. Gaitley; and B. Holben. 2004. Comparison of
MISR and AERONET aerosol optical depths over desert sites. Geophysical
Research Letters 31(16):Art. No. L16102.
Miller, R. L., and I. Tegen. 1998. Climate response to soil dust serosols. Journal of
Climate 11:3247-3267.
Moulin, C.; C. E. Lambert; F. Dulac; and U. Dayan. 1997. Control of atmospheric
export of dust by North Atlantic oscillation. Nature 387:691-694.
Offenberg, J. H., and J. E. Baker. 1999. Aerosol size distributions of polycyclic
aromatic hydrocarbons in urban and over-water atmospheres, Environmental
Science and Technology 33, 3324-3331.
Pierson, D. C., H. Markensten, and N. Strömbeck. 2003. Long and short term
variations in suspended particulate material: the influence on light available to the
phytoplankton community. Hydrobiologia 494:299–304.
Pope, C. A.; R. T. Burnett; M. J. Thun; E. E. Calle; D. Krewski; K. Ito; and G. D.
Thurston. 2002. Lung cancer, cardiopulmonary mortality, and long-term exposure
to fine particulate air pollution. Journal of the American Medical Association
287:1132-1141.
Pope III, C. A., and D. W. Dockery. 2006. Health effects of fine particulate air
pollution: Lines that connect. Journal of the Air and Waste Management
Association 56:709-742.

Vol. 3, No. 3 Uddin: Use of Satellite Images to Map Spatio-temporal...
198
Prasad, A. K., and R. P. Singh. 2007. Comparison of MISR-MODIS aerosol optical
depth over the Indo-Gangetic basin during the winter and summer seasons (2000
- 2005). Remote Sensing of Environment, 107:109 - 119.
Ramanathan, V.; M. V. Ramana; G. Roberts; D. Kim; C. Corrigan; C. Chung; and D.
Winker. 2007. Warming trends in Asia amplified by brown cloud solar
absorption. Nature 448:575-578
Reynolds, K. A., and I. L. Pepper. 2000. Microorganisms in the Environment. San
Diego, CA: Academic Press.
Ridgwell, A. J. 2002. Dust in Earth system: the biogeochemical linking of land, air
and sea. Phylosophical Transactions of Royal Society London 360:2905-2924.
Seinfeld, J. H., and S. N. Pandis. 1998. Atmospheric Chemistry and Physics: From Air
Pollution to Global Change. New York: John Wiley and Sons.
Venkataraman, C., S. Thomas, and P. Kulkarni. 1999. Size distributions of polycyclic
aromatic hydrocarbonss gas/particle partitioning to urban aerosols. Journal of
Aerosol Science 30: 759 - 770.
WHO. 2005. Air quality guidelines for particulate matter, ozone, nitrogen dioxide and
sulfur dioxide. Global update 2005. World Health Organization, Geneva,
Switzerland.
Williamson, K. E.; K. E. Wommack; and M. Radosevich. 2003. Sampling natural viral
communities from soil for culture-independent analyses. Appllied Environmental.
Microbiology 69:6628-6633.
Wu, S. P. , S. Tao, and W.X. Liu. 2006. Particle size distributions of polycyclic
aromatic hydrocarbons in rural and urban atmosphere of tianjin, china.
Chemosphere 62: 357–367.
Yates, M. V., and S. R. Yates 1988. Modeling microbial fate in the subsurface
environment. CRC Critical Reviews in Environmental Control 17:307-344.
Recommended