Use of Patent Information in theFinancial IndustryA huge potential for financial analysts
Dr. Jochen Spuck, Manuel Wirz
CFA Society SwitzerlandEvent of April 20, 2017
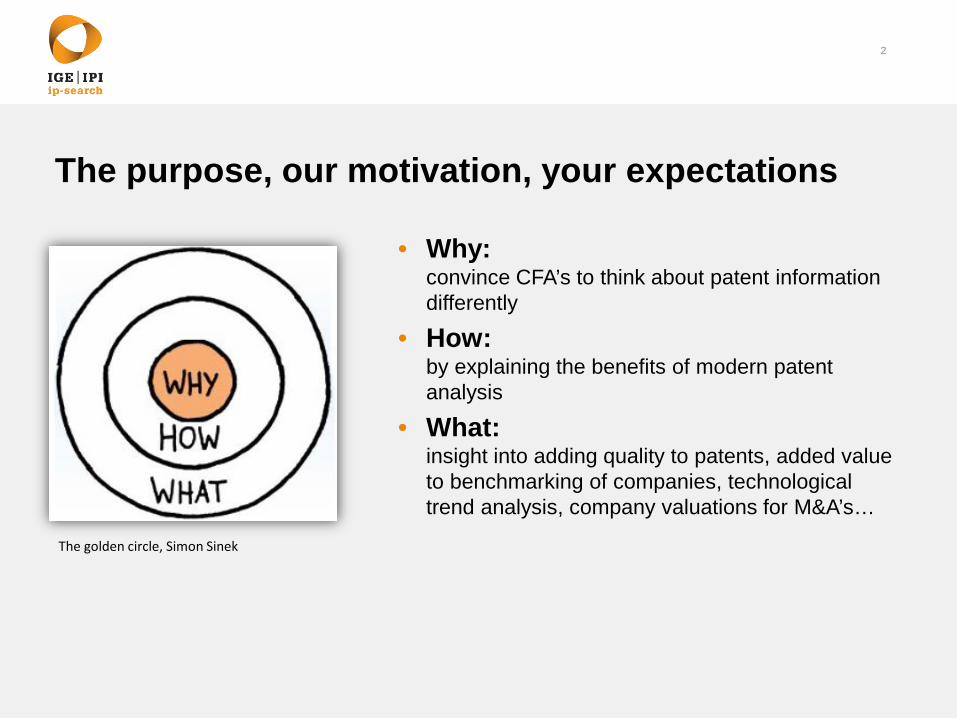
The purpose, our motivation, your expectations
• Why:convince CFA’s to think about patent informationdifferently
• How:by explaining the benefits of modern patent analysis
• What:insight into adding quality to patents, added valueto benchmarking of companies, technologicaltrend analysis, company valuations for M&A’s…
2
The golden circle, Simon Sinek
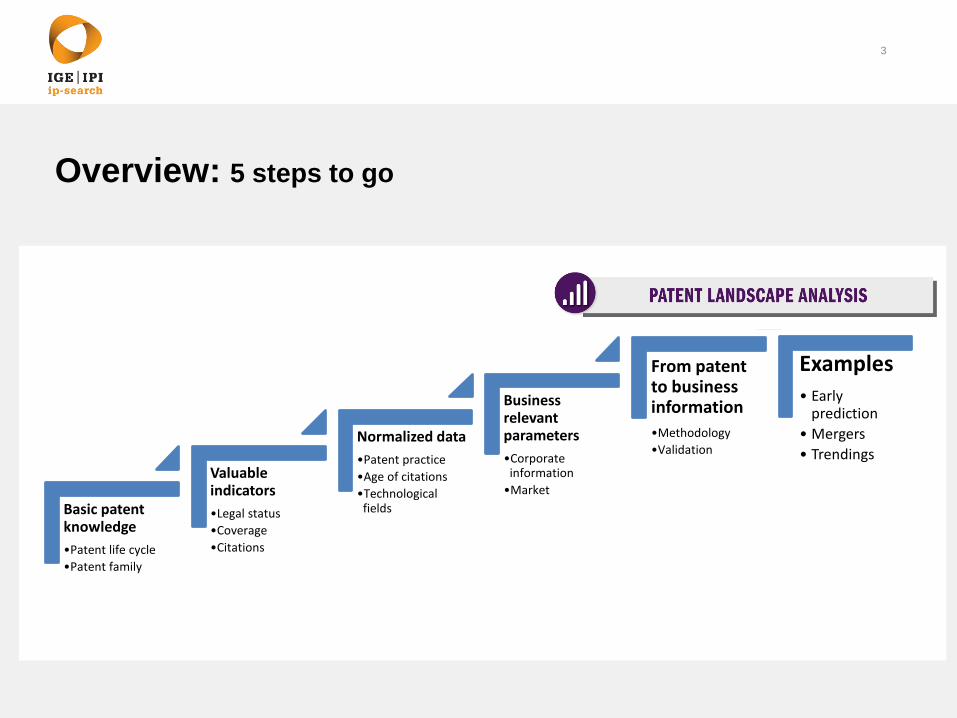
Overview: 5 steps to go
Basic patent knowledge•Patent life cycle•Patent family
Valuableindicators•Legal status•Coverage•Citations
Normalized data•Patent practice•Age of citations•Technological
fields
Business relevant parameters•Corporate
information•Market
From patent to businessinformation•Methodology•Validation
Examples• Early
prediction• Mergers• Trendings
3
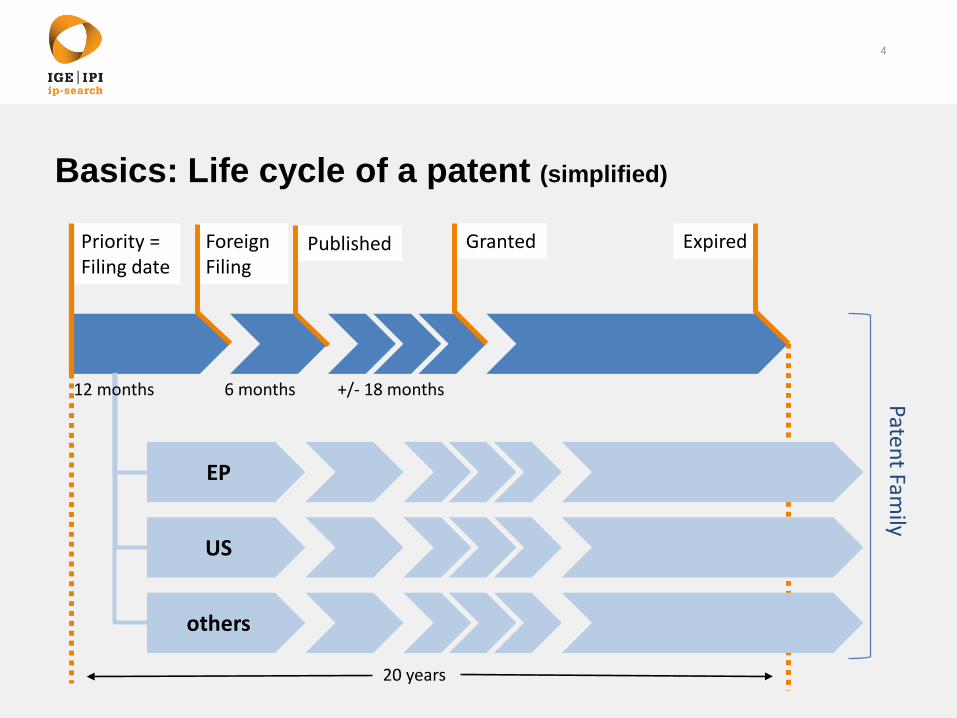
Basics: Life cycle of a patent (simplified)
4
Priority = Filing date
6 months +/- 18 months
ForeignFiling
Published Granted Expired
EP
US
others
12 months
20 years
PatentFamily
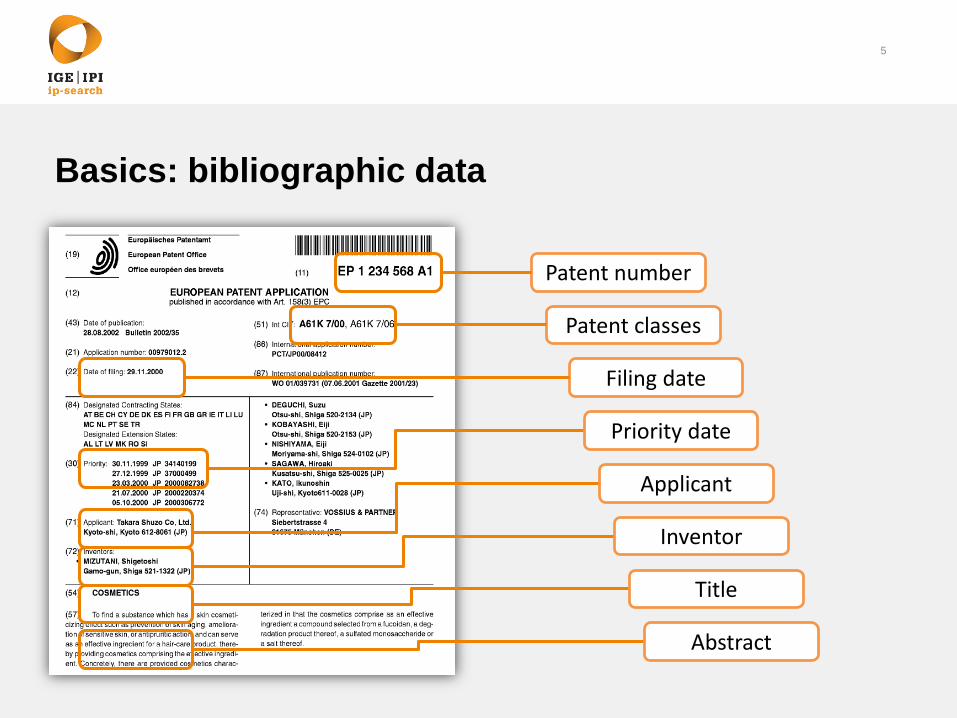
Basics: bibliographic data
5
Patent number
Priority date
Patent classes
Applicant
Inventor
Filing date
Title
Abstract
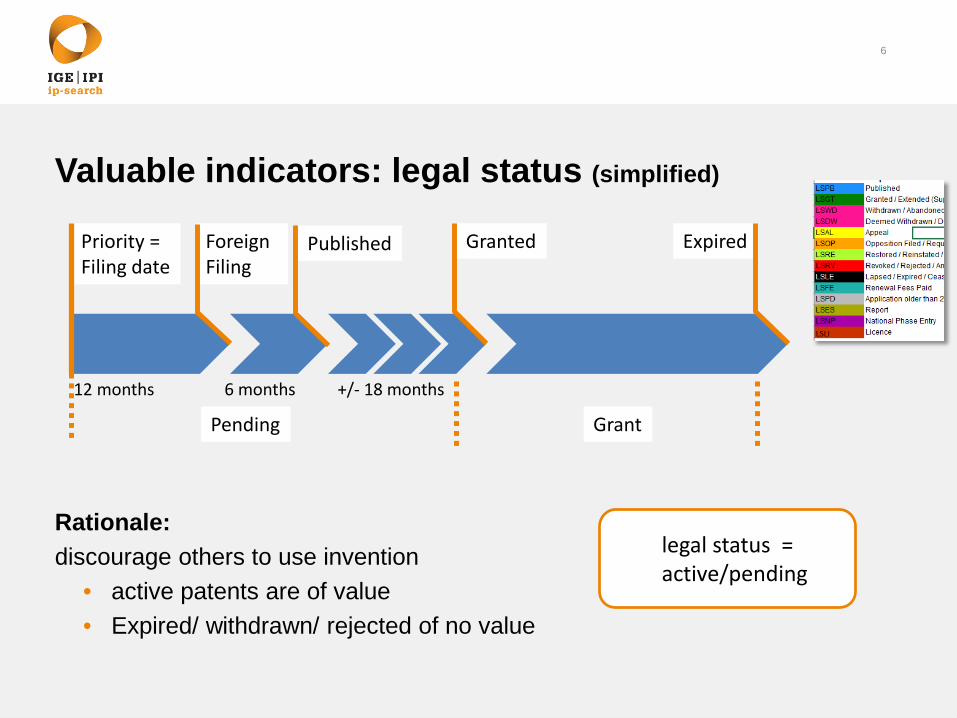
Valuable indicators: legal status (simplified)
Rationale:discourage others to use invention
• active patents are of value• Expired/ withdrawn/ rejected of no value
6
Priority = Filing date
6 months +/- 18 months
ForeignFiling
Published Granted Expired
12 months
Pending Grant
legal status = active/pending
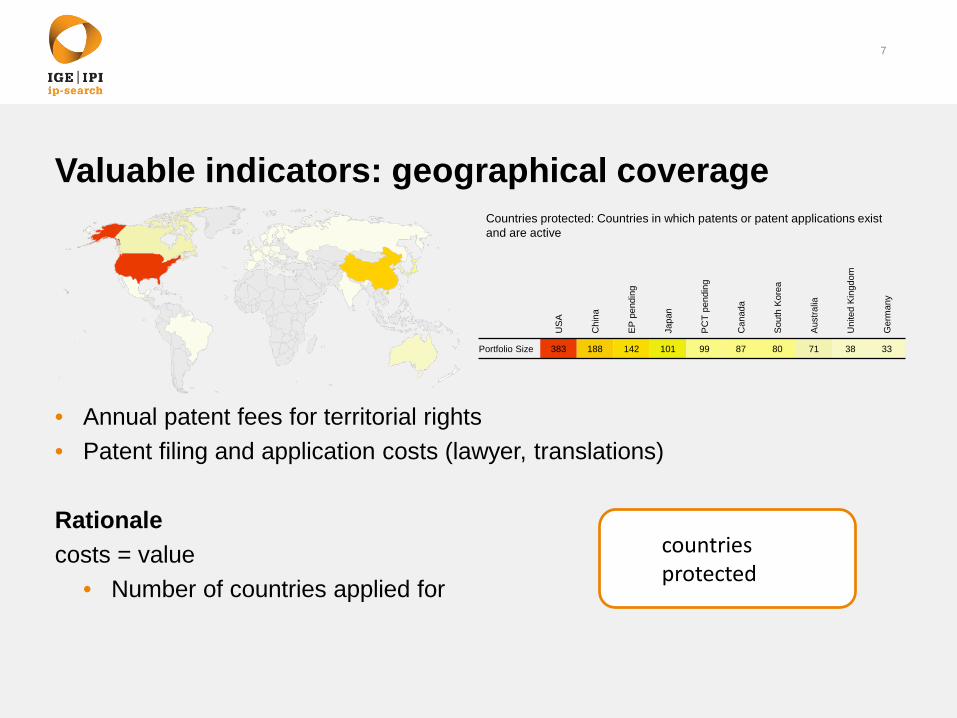
Valuable indicators: geographical coverage
7
• Annual patent fees for territorial rights• Patent filing and application costs (lawyer, translations)
Rationalecosts = value
• Number of countries applied forU
SA
Chi
na
EP
pen
ding
Japa
n
PC
T pe
ndin
g
Can
ada
Sou
th K
orea
Aus
tralia
Uni
ted
Kin
gdom
Ger
man
y
Portfolio Size 383 188 142 101 99 87 80 71 38 33
Countries protected: Countries in which patents or patent applications existand are active
countries protected
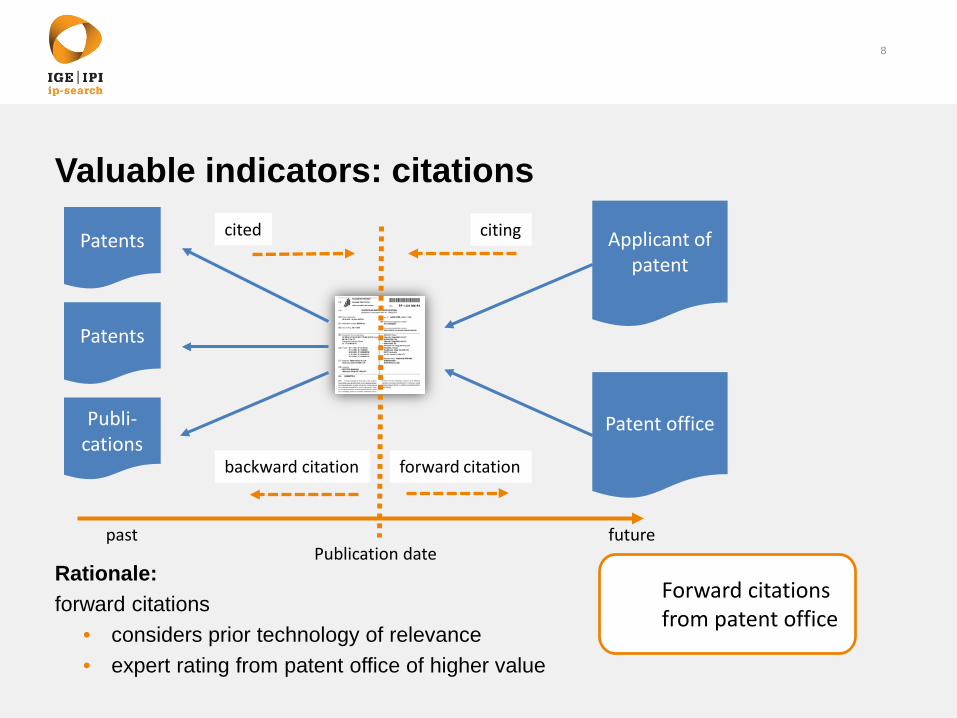
Valuable indicators: citations
8
Applicant ofpatent
Patent office
Patents
Patents
Publi-cations
Publication date
citingcited
backward citation forward citation
past future
Forward citationsfrom patent office
Rationale:forward citations
• considers prior technology of relevance• expert rating from patent office of higher value
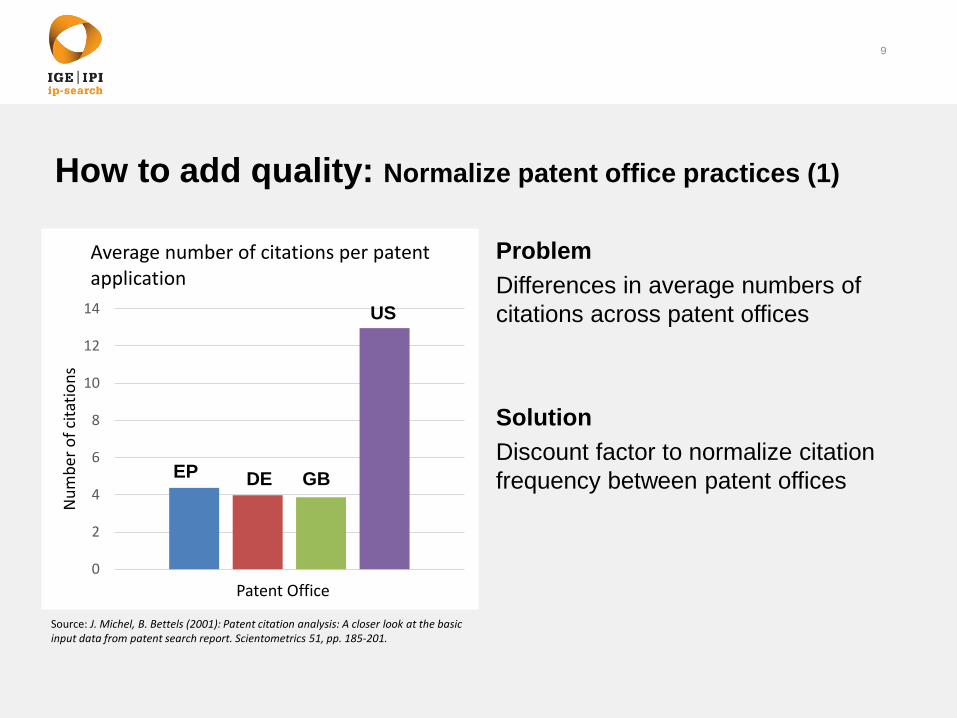
How to add quality: Normalize patent office practices (1)
ProblemDifferences in average numbers ofcitations across patent offices
SolutionDiscount factor to normalize citationfrequency between patent offices
9
0
2
4
6
8
10
12
14
Num
bero
fcita
tions
Patent Office
Average number of citations per patent application
EP DE GB
US
Source: J. Michel, B. Bettels (2001): Patent citation analysis: A closer look at the basic input data from patent search report. Scientometrics 51, pp. 185-201.
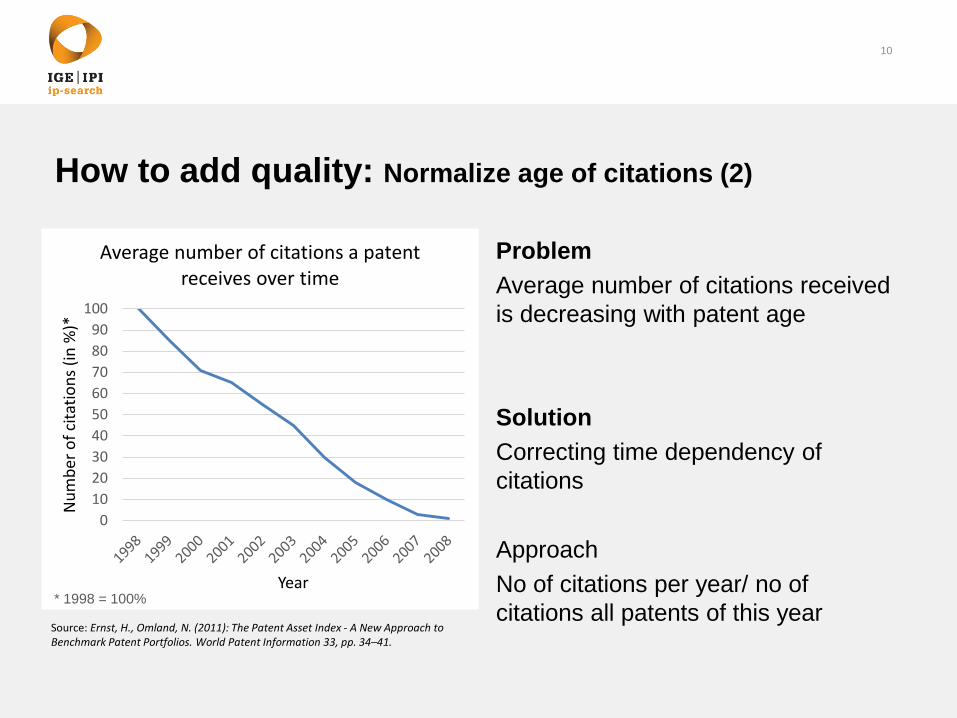
How to add quality: Normalize age of citations (2)
ProblemAverage number of citations receivedis decreasing with patent age
SolutionCorrecting time dependency ofcitations
Approach No of citations per year/ no ofcitations all patents of this year
10
0102030405060708090
100
Num
bero
fcita
tions
(in %
)*
Year
Average number of citations a patent receives over time
Source: Ernst, H., Omland, N. (2011): The Patent Asset Index - A New Approach to Benchmark Patent Portfolios. World Patent Information 33, pp. 34–41.
* 1998 = 100%
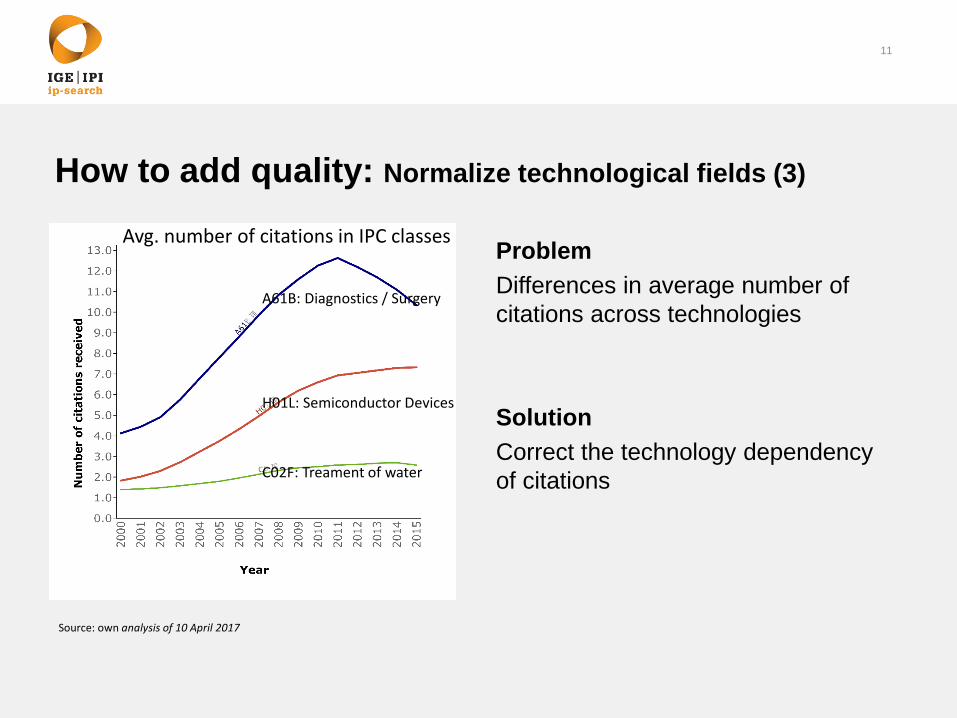
How to add quality: Normalize technological fields (3)
ProblemDifferences in average number ofcitations across technologies
SolutionCorrect the technology dependencyof citations
11
Source: own analysis of 10 April 2017
A61B: Diagnostics / Surgery
H01L: Semiconductor Devices
C02F: Treament of water
Avg. number of citations in IPC classes
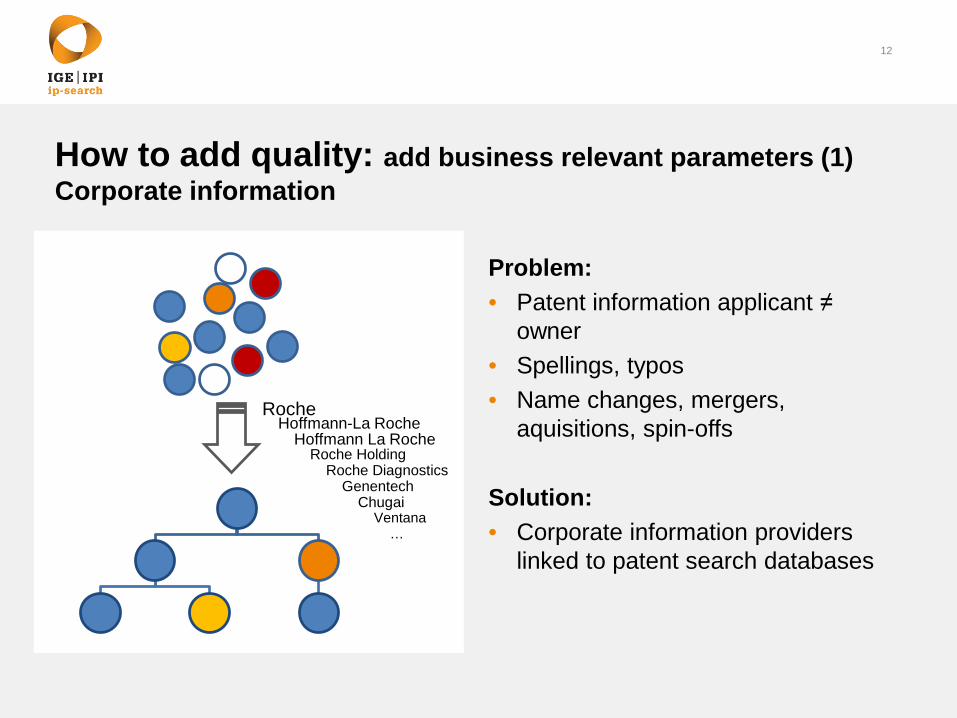
How to add quality: add business relevant parameters (1)Corporate information
Problem:• Patent information applicant ≠
owner• Spellings, typos• Name changes, mergers,
aquisitions, spin-offs
Solution:• Corporate information providers
linked to patent search databases
12
RocheHoffmann-La Roche
Hoffmann La RocheRoche Holding
Roche DiagnosticsGenentech
ChugaiVentana
…
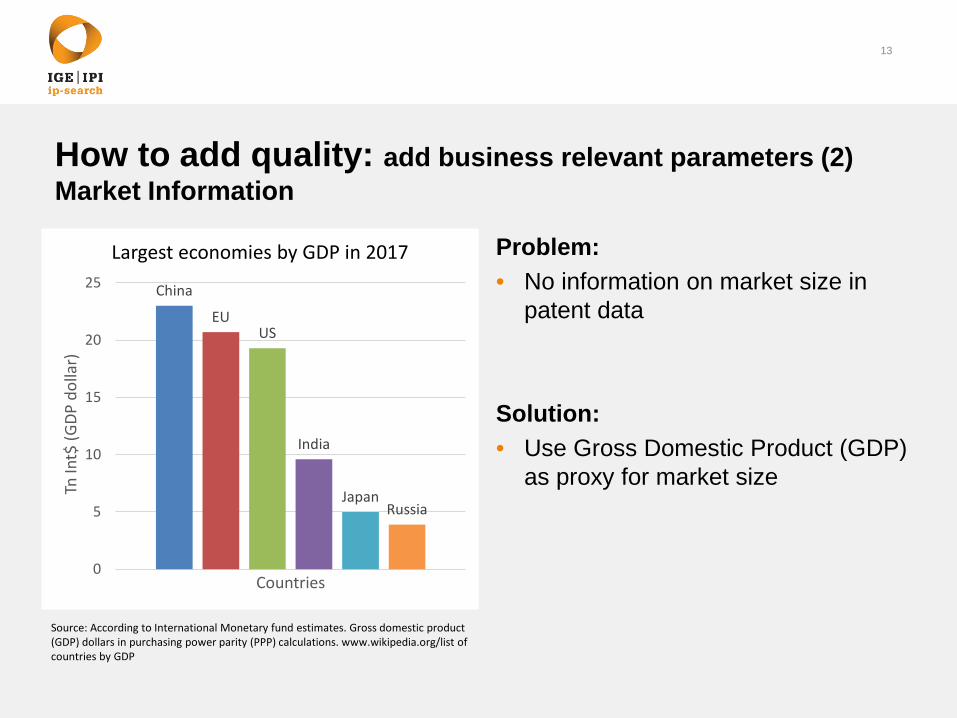
How to add quality: add business relevant parameters (2)Market Information
Problem:• No information on market size in
patent data
Solution:• Use Gross Domestic Product (GDP)
as proxy for market size
13
China
EUUS
India
JapanRussia
0
5
10
15
20
25
TnIn
t$ (G
DP d
olla
r)
Countries
Largest economies by GDP in 2017
Source: According to International Monetary fund estimates. Gross domestic product (GDP) dollars in purchasing power parity (PPP) calculations. www.wikipedia.org/list of countries by GDP
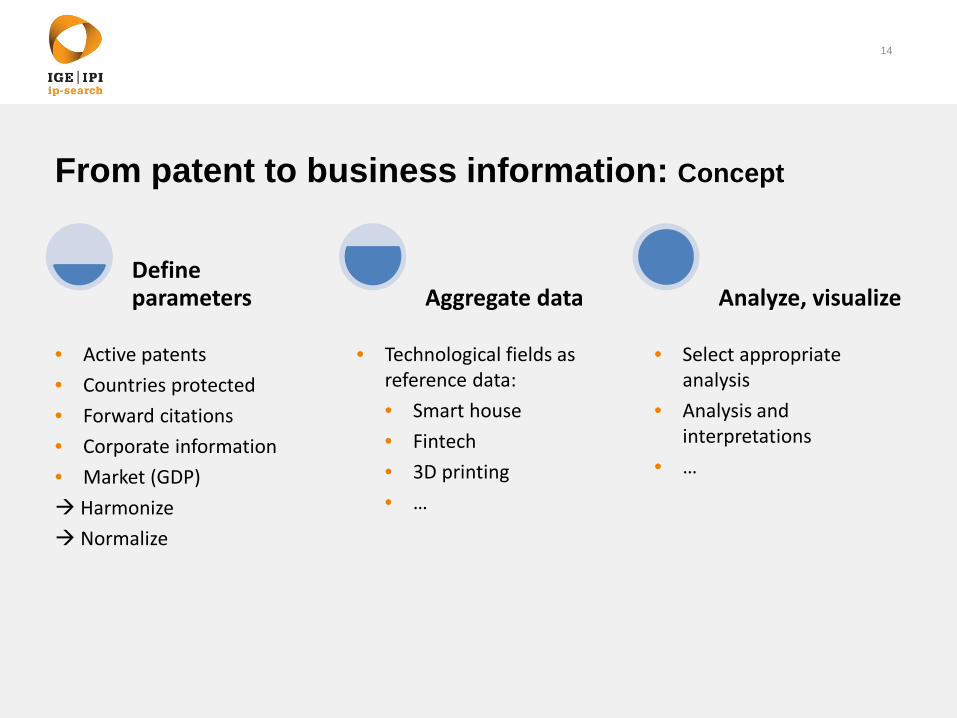
From patent to business information: Concept
Defineparameters Aggregate data Analyze, visualize
14
• Active patents• Countries protected• Forward citations• Corporate information• Market (GDP) Harmonize Normalize
• Technological fields asreference data:• Smart house• Fintech• 3D printing• …
• Select appropriateanalysis
• Analysis andinterpretations
• …
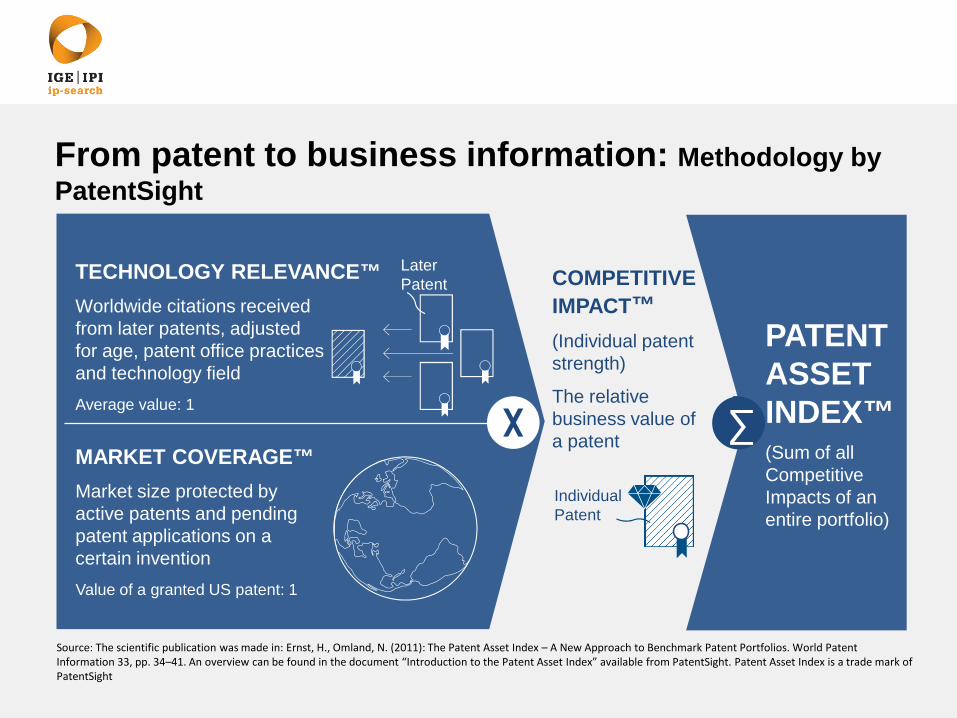
TECHNOLOGY RELEVANCE™Worldwide citations received from later patents, adjusted for age, patent office practices and technology fieldAverage value: 1
MARKET COVERAGE™Market size protected by active patents and pendingpatent applications on a certain inventionValue of a granted US patent: 1
PATENT ASSET INDEX™(Sum of all Competitive Impacts of an entire portfolio)
COMPETITIVE IMPACT™(Individual patent strength)
The relative business value of a patent
LaterPatent
Individual Patent
Source: The scientific publication was made in: Ernst, H., Omland, N. (2011): The Patent Asset Index – A New Approach to Benchmark Patent Portfolios. World Patent Information 33, pp. 34–41. An overview can be found in the document “Introduction to the Patent Asset Index” available from PatentSight. Patent Asset Index is a trade mark of PatentSight
∑
From patent to business information: Methodology byPatentSight
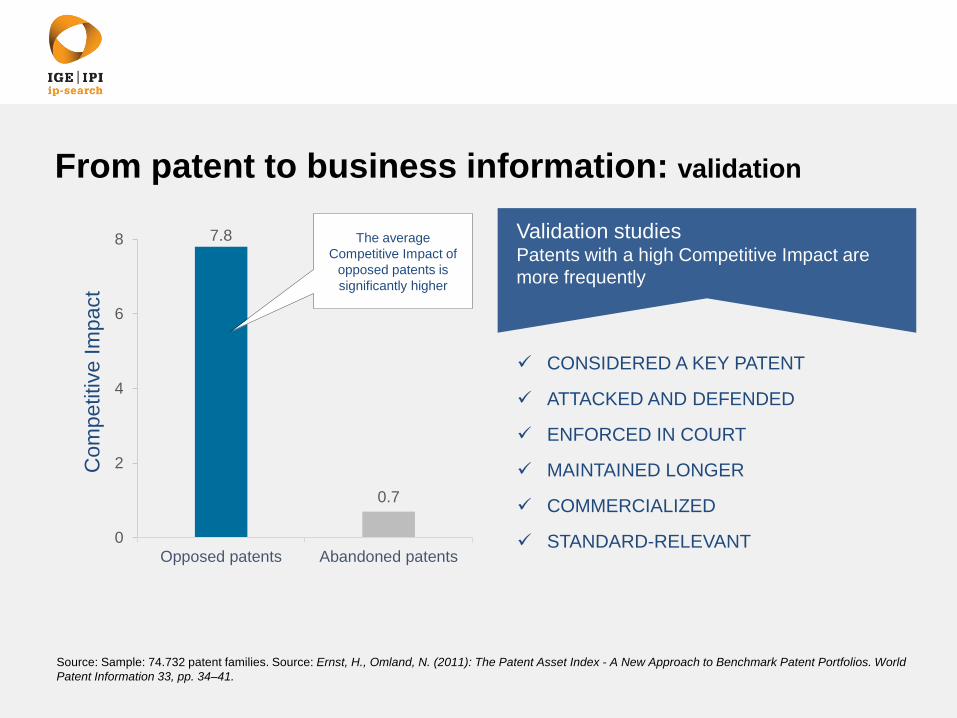
7.8
0.7
0
2
4
6
8
Opposed patents Abandoned patents
The average Competitive Impact of
opposed patents is significantly higher
Com
petit
ive
Impa
ct
CONSIDERED A KEY PATENT
ATTACKED AND DEFENDED
ENFORCED IN COURT
MAINTAINED LONGER
COMMERCIALIZED
STANDARD-RELEVANT
Validation studiesPatents with a high Competitive Impact are more frequently
Source: Sample: 74.732 patent families. Source: Ernst, H., Omland, N. (2011): The Patent Asset Index - A New Approach to Benchmark Patent Portfolios. World Patent Information 33, pp. 34–41.
From patent to business information: validation
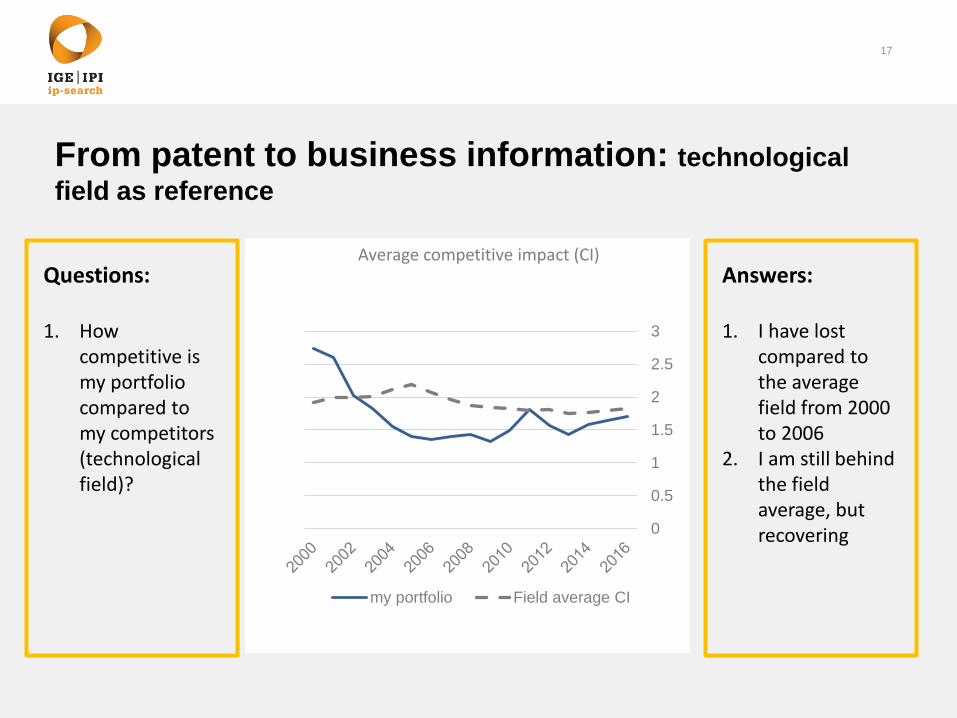
From patent to business information: technologicalfield as reference
17
Questions:
1. Howcompetitive ismy portfoliocompared tomy competitors(technologicalfield)?
Answers:
1. I have lost compared tothe averagefield from 2000 to 2006
2. I am still behindthe fieldaverage, but recovering
Average competitive impact (CI)
0
0.5
1
1.5
2
2.5
3
my portfolio Field average CI
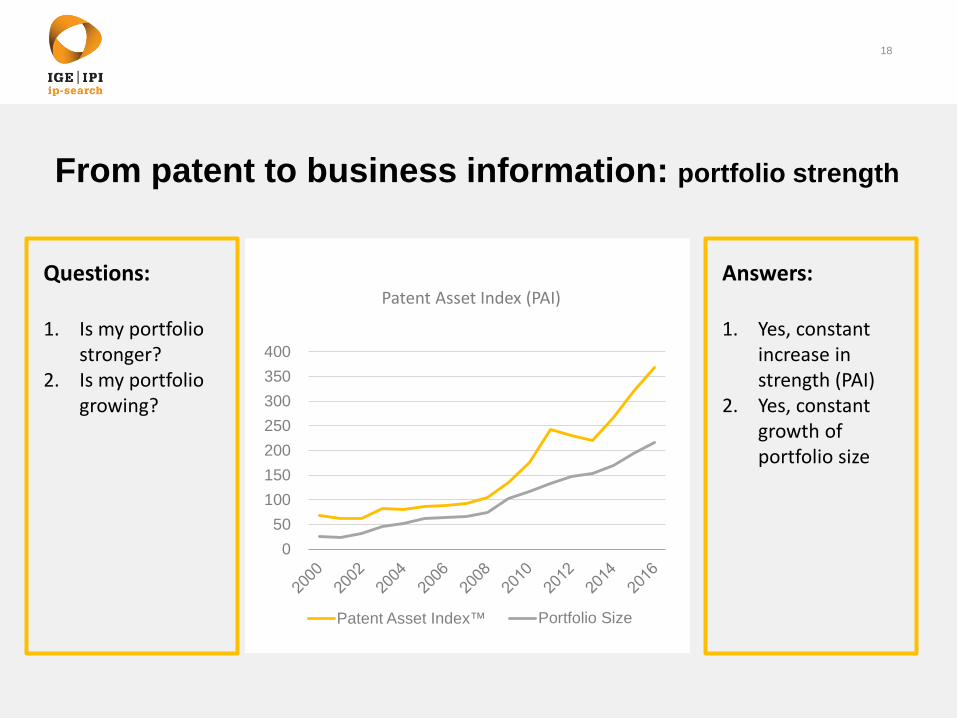
From patent to business information: portfolio strength
18
Questions:
1. Is my portfoliostronger?
2. Is my portfoliogrowing?
Answers:
1. Yes, constantincrease in strength (PAI)
2. Yes, constantgrowth ofportfolio size
050
100150200250300350400
Patent Asset Index™ Portfolio Size
Patent Asset Index (PAI)
19N
umbe
rofa
ctiv
epa
tent
fam
ilies
Year
Com
petit
ive
Impa
ct™
Year
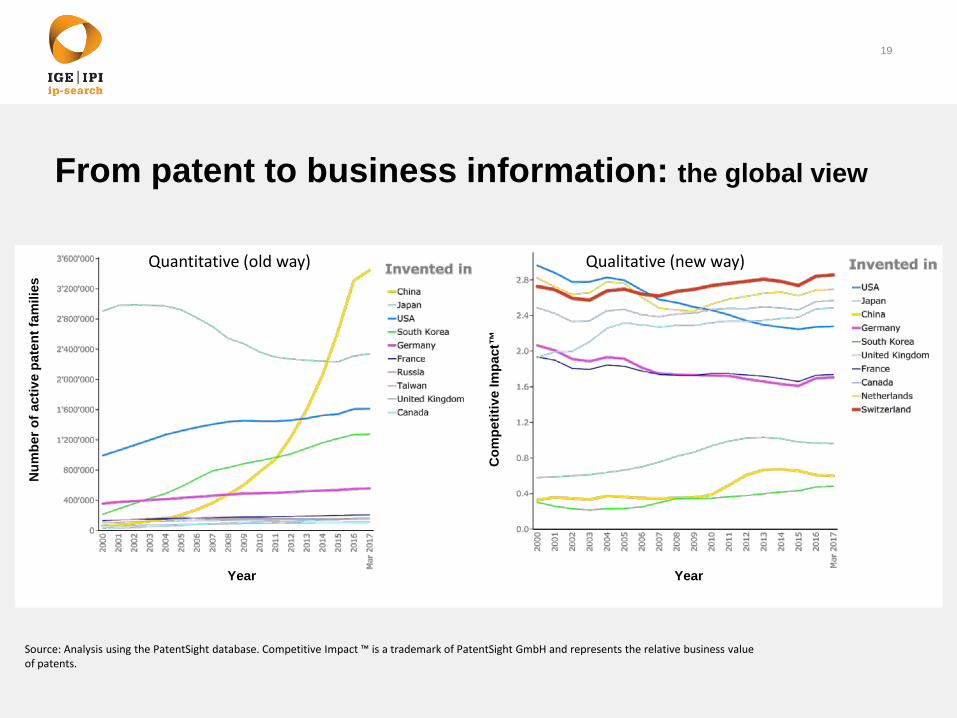
From patent to business information: the global view
Quantitative (old way) Qualitative (new way)
Source: Analysis using the PatentSight database. Competitive Impact ™ is a trademark of PatentSight GmbH and represents the relative business value of patents.
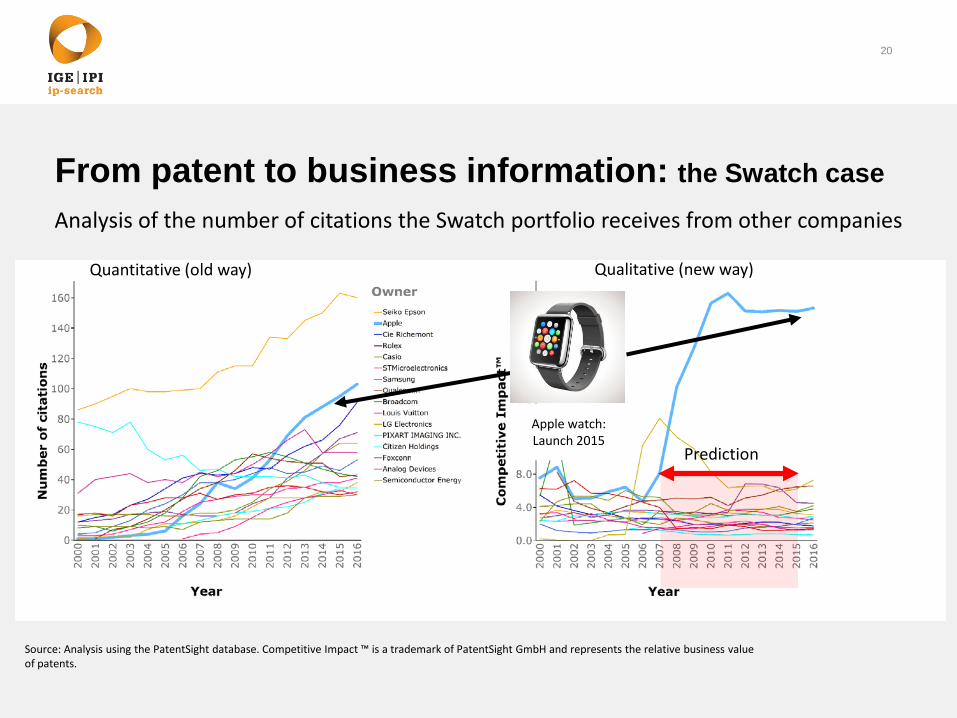
From patent to business information: the Swatch case
20
Apple watch: Launch 2015
Quantitative (old way) Qualitative (new way)
Prediction
Source: Analysis using the PatentSight database. Competitive Impact ™ is a trademark of PatentSight GmbH and represents the relative business value of patents.
Analysis of the number of citations the Swatch portfolio receives from other companies
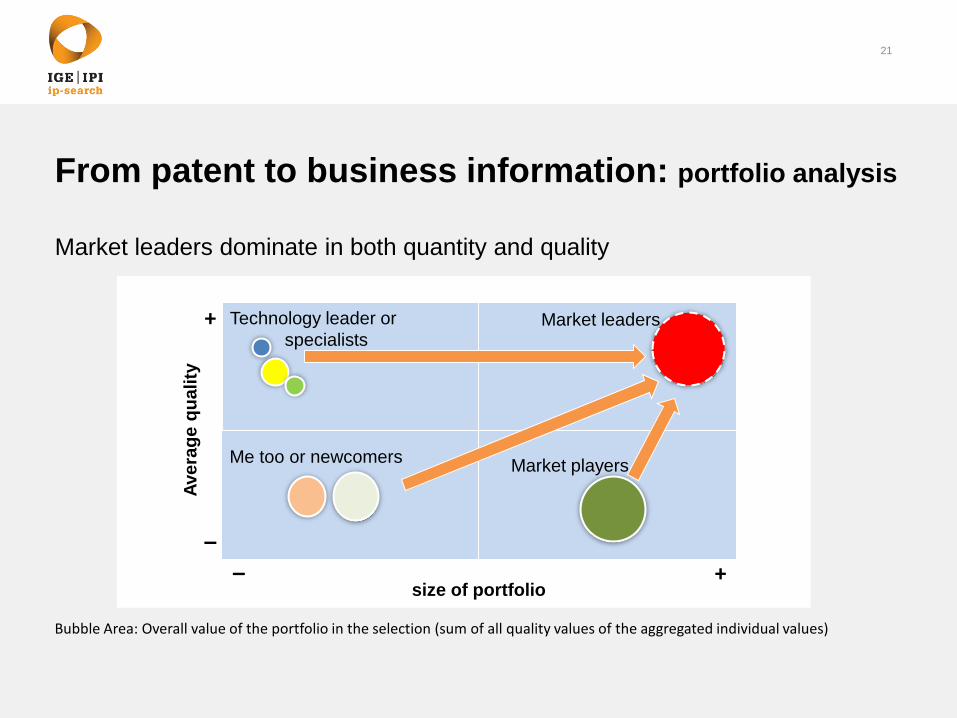
From patent to business information: portfolio analysis
Market leaders dominate in both quantity and quality
21
size of portfolio
Aver
age
qual
ity
+
–– +
Market leadersTechnology leader orspecialists
Market playersMe too or newcomers
Bubble Area: Overall value of the portfolio in the selection (sum of all quality values of the aggregated individual values)
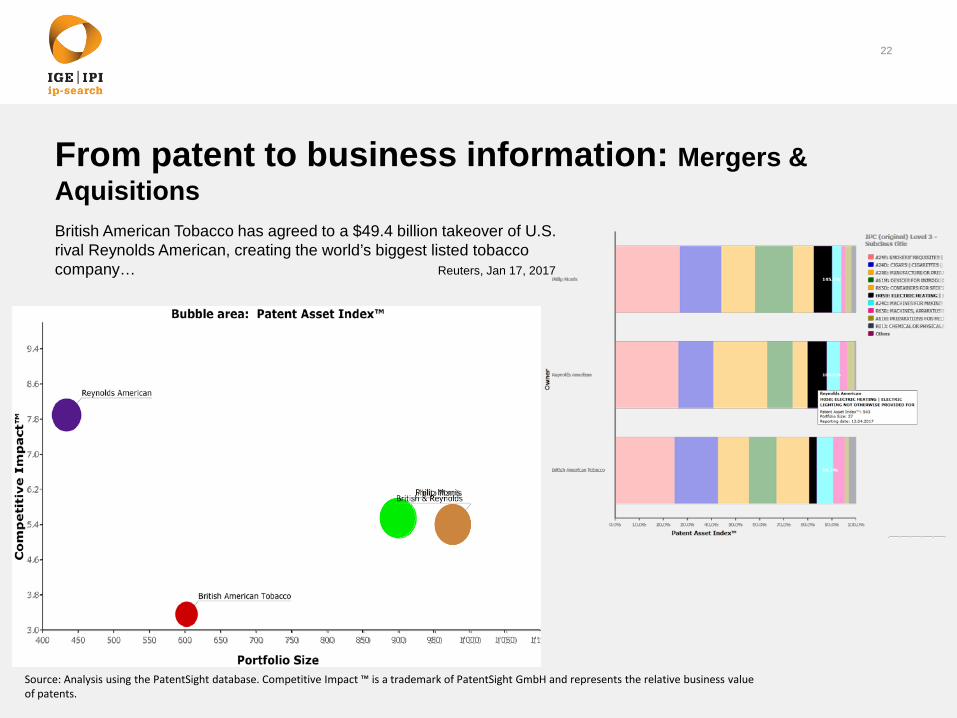
From patent to business information: Mergers & Aquisitions
22
British American Tobacco has agreed to a $49.4 billion takeover of U.S. rival Reynolds American, creating the world’s biggest listed tobaccocompany… Reuters, Jan 17, 2017
Source: Analysis using the PatentSight database. Competitive Impact ™ is a trademark of PatentSight GmbH and represents the relative business value of patents.
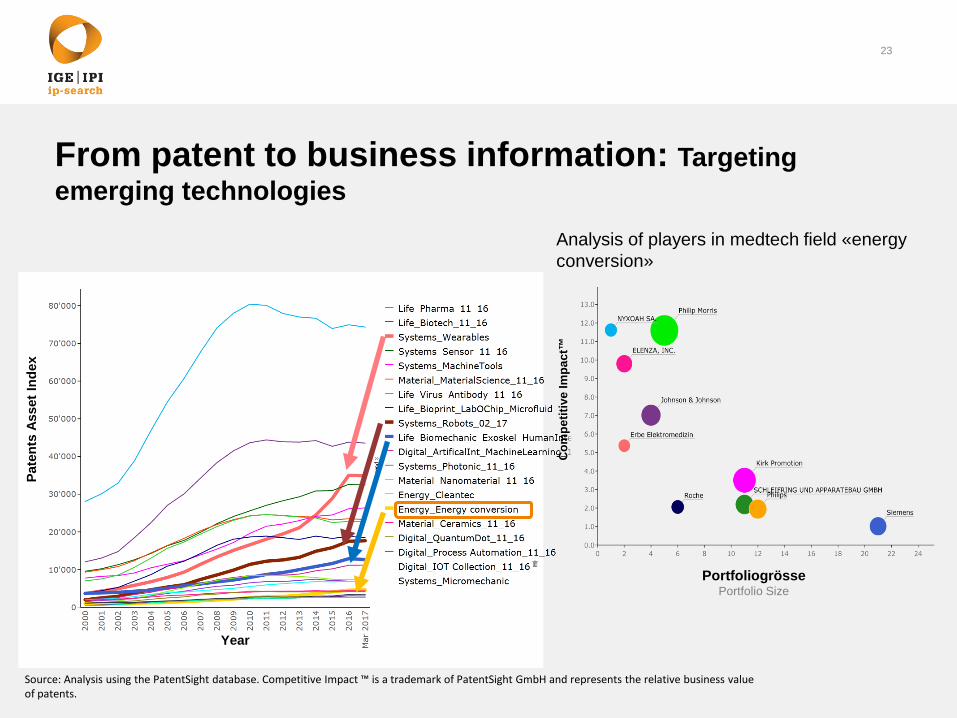
From patent to business information: Targetingemerging technologies
23
Pate
nts
Asse
t Ind
ex
Year
PortfoliogrössePortfolio Size
Analysis of players in medtech field «energyconversion»
Com
petit
ive
Impa
ct™
Source: Analysis using the PatentSight database. Competitive Impact ™ is a trademark of PatentSight GmbH and represents the relative business value of patents.
Take home message
• Patent data contains usefull business information• Normalized parameters are key to add quality to patent information• The adequate analysis transforms patent information to valuable competitive
advantage• Early prediction is possible: identify technology information prior to launch of
products• Impact of mergers & aquisitions may be simulated, potential candidates may
be analysed• Emerging technologies are detectable through trend analysis
24
Contact
25
Manuel WirzPhone +41 31 377 73 75Email [email protected]
www.ip-search.swiss ip-search · Swiss Federal Institute of Intellectual PropertyStauffacherstrasse 65/59g · CH-3003 Bern
Jochen SpuckPhone +41 31 377 73 85Email [email protected]
Recommended


![2395 New Rules of Engagement Whitepaper [full] A4 [FINAL].indd](https://img.pdfslide.us/doc/110x75/58a30a381a28ab366e8bcd83/2395-new-rules-of-engagement-whitepaper-full-a4-finalindd.jpg)