USAID OFFICE OF FOOD FOR PEACE
FOOD SECURITY DESK REVIEW FOR KATANGA,
NORTH KIVU, AND SOUTH KIVU,
DEMOCRATIC REPUBLIC OF CONGO
NOVEMBER 2015
This report is made possible by the generous support of the American people
through the support of the Office of Food for Peace, Bureau for Democracy,
Conflict and Humanitarian Assistance, and the Office of Health, Infectious
Diseases, and Nutrition, Bureau for Global Health, U.S. Agency for International
Development (USAID), under terms of Cooperative Agreement No. No. AID-OAA-
A-12-00005, through the Food and Nutrition Technical Assistance III Project
(FANTA), managed by FHI 360. The contents are the responsibility of FHI 360
and do not necessarily reflect the views of USAID or the United States
Government.
Recommended citation: Murphy, Emmet; Glaeser, Laura; Maalouf-Manasseh,
Zeina; Collison, Deborah Kortso; and Sethuraman, Kavita. 2015. USAID Office of
Food for Peace Food Security Desk Review for Katanga, North Kivu, and South
Kivu, Democratic Republic of Congo. Washington, DC: FHI 360/FANTA.
Food and Nutrition Technical Assistance III Project
(FANTA)
FHI 360
1825 Connecticut Avenue, NW
Washington, DC 20009-5721
T 202-884-8000
F 202-884-8432
www.fantaproject.org
ACKNOWLEDGMENTS
The authors of the USAID Office of Food for Peace Food Security Desk Review for Katanga, North Kivu,
and South Kivu, Democratic Republic of Congo wish to thank the staff of the U.S. Agency for
International Development (USAID)/Office of Food for Peace (FFP), USAID/Democratic Republic of
Congo (DRC), and other USAID/Washington staff for their assistance in providing valuable information
for the desk review, especially Marisa Traniello (USAID/FFP) and Shannon Rogers and Dieudonné
Mbuka (USAID/DRC). The authors also wish to give special thanks to FFP implementers in eastern
DRC, including Adventist Development and Relief Agency (ADRA), Food for the Hungry, and Mercy
Corps for taking the time to share their lessons learned, project reports, studies, and other research that
greatly enriched the desk review. Thanks are also due to researchers at the International Institute of
Tropical Agriculture (IITA) including Nnaka Rudahaba, Rehani Jumaine, Byamungu Kigangu, and
Kasereka Bishikwabo as well as Mireille N’Smire, ICT Specialist and E-Research Ambassador of IITA’s
Central Africa Hub.
In addition, the authors also thank staff from the Food and Nutrition Technical Assistance III Project
(FANTA) for their technical input and edits to this document.
CONTENTS
Acronyms and Abbreviations ..................................................................................................................... i
Executive Summary .................................................................................................................................... 1
1. Introduction ......................................................................................................................................... 2 1.1 History ....................................................................................................................................... 2 1.2 Conflict ...................................................................................................................................... 3 1.3 North Kivu Overview ................................................................................................................ 5 1.4 South Kivu Overview ................................................................................................................ 6 1.5 Katanga Overview ..................................................................................................................... 8
2. Food Security Context ...................................................................................................................... 10 2.1 Food Availability ..................................................................................................................... 10 2.2 Food Accessibility ................................................................................................................... 15 2.3 Food Utilization and Health .................................................................................................... 21 2.4 Shocks, Coping Capacity, and Resilience ............................................................................... 28
3. Lessons Learned ................................................................................................................................ 30 3.1 Cross Cutting Project Lessons ................................................................................................. 31 3.2 Availability, Accessibility, and Disaster Risk Reduction Lessons Learned ............................ 35 3.3 MCHN and WASH Lessons Learned...................................................................................... 46 3.4 Gender Lessons Learned ......................................................................................................... 51
4. References .......................................................................................................................................... 55
Annex A. New Provinces Based on the 2006 Constitution .................................................................... 59
Annex B. Inter-Provincial Trade of Agricultural Goods in DRC......................................................... 60
Annex C. Strategic Objectives and Activities of FFP-Supported Programs in Eastern DRC ........... 61
i
ACRONYMS AND ABBREVIATIONS
ADRA Adventist Development Relief Agency
BBTV Banana Bunchy Top Virus
BMI body mass index
BXW Banana Xanthomonas Wilt
CARG Conseil Agricole Rural de Gestion (Agricultural Council of Rural Management)
CDC Commités de Developpement Communautaires (Community Development Committee)
CFW cash for work
CHW community health worker
CMD cassava mosaic disease
CSI Coping Strategy Index
DHS Demographic and Health Survey
dL deciliter
DRC Democratic Republic of Congo
F2F farmer-to-farmer
FAO Food and Agriculture Organization of the United Nations
FARDC Forces Armées de la République Démocratique du Congo (Armed Forces of the
Democratic Republic of Congo)
FDLR Forces Démocratiques de Libération du Rwanda (Democratic Forces for the Liberation of
Rwanda)
FEWS NET Famine Early Warning Systems Network
FFP USAID Office of Food for Peace
FFS farmer field school
FFW food for work
FNL Forces pour la Libéralisation Nationale (National Forces of Liberation)
FY fiscal year
g gram(s)
HIV human immunodeficiency virus
IDP internally displaced person
INERA Institute National pour l’Etude et la Recherche Agronomiques (National Institution for
Agricultural Research)
INS Institut National de la Statistique (National Statistics Institute)
IPAPEL Inspection provinciale de l'agriculture, pêche et élevage (Agriculture, Fish, and Livestock
Inspection)
km kilometer(s)
MAM moderate acute malnutrition
MCHN maternal and child health and nutrition
MICS Multiple Indicator Cluster Survey
MINAGRI Ministère de l’Agriculture et du Développement Rural (Ministry of Agriculture)
ii
MPSMRM Ministère du Plan et Suivi de la Mise en œuvre de la Révolution de la Modernité
(Ministry of Planning and Implementation of the Modern Revolution)
MT metric tons
NGO nongovernmental organization
PM2A prevention of malnutrition in children under 2 approach
PRONANUT Programme National de Nutrition (National Nutrition Program)
SAM severe acute malnutrition
SBCC social and behavior change communication
SD standard deviation
SENASEM Service National des Semences (National Seed Certification Agency)
UN United Nations
UNHCR UN High Commission for Refugees
USAID U.S. Agency for International Development
WASH water, sanitation, and hygiene
WFP World Food Programme
1
EXECUTIVE SUMMARY
This food security desk review for North Kivu and South Kivu provinces and the Tanganyika territory in
the northern part of Katanga province in the Democratic Republic of Congo (DRC) was requested by the
U.S. Agency for International Development Office of Food for Peace (USAID/FFP) in order to help guide
both FFP and FFP project applicants design projects to address food security needs in the three provinces.
The review draws from secondary resources to understand the history, politics, economy, and food
security situation, as well as Congolese government programs relevant to the region. The review team
also interviewed and collected documentation from current FFP development project implementers in
eastern DRC, specifically Adventist Development Relief Agency (ADRA), Food for the Hungry, and
Mercy Corps to compile lessons learned. The review analyzes the food security situation in eastern DRC
through the lens of availability, accessibility, and utilization and presents current ground realities that
could promote or constrain food security programming in the next few years, especially given challenges
inherent in a region that has been affected by conflict on a nearly ongoing basis since the mid-1990s.
Malnutrition and food insecurity affect a significant portion of the population in the Kivus and Katanga
provinces. A 2014 nationwide Comprehensive Food Security and Vulnerability Analysis by the World
Food Programme (WFP) found that South Kivu has the highest percentage of food insecure households in
DRC (64%) of which 14% are considered severely food insecure. In North Kivu, 49% of households were
food insecure and 13% were severely food insecure. In Katanga, 57% of households were food insecure
and 16% were severely food insecure, the second highest figure for this category in the country. The DRC
Demographic and Health Survey (DHS) for 2013-2014 indicates that the prevalence of stunting in North
Kivu (52%), South Kivu (53%), and Katanga (45%) are higher than the national average (43%). From
2007 to 2013-14, the DHS indicates that the total fertility rate increased in DRC from 6.3 to 6.6; similarly
the total fertility rate for Katanga increased from 5.9 to 7.8, and for South Kivu from 7.4 to 7.7. Although
it has gone down in North Kivu, it still remains high at 6.5. The provinces’ health infrastructure is
inadequate and does not meet the population’s needs.
Most households in the Kivus and Katanga rely upon agriculture as their primary livelihood, but conflict,
crop disease, and access to land are significant constraints. Less than 60% of households in the war-torn
provinces of North and South Kivu cultivated farms in 2011-12, compared to 87% in Katanga (WFP
2014). Farmers primarily grow cassava, maize, and beans in eastern DRC, as well as sweet potatoes and
bananas depending on the agro-ecological zone. Crop diseases such as cassava mosaic virus and Banana
Xanthomonas Wilt have had a devastating impact on crop yields of these economically important crops.
Land access is a problem in the Kivus due to high population density and the fact that a few landowners
own much of the most fertile land, a factor that fuels resentment and ongoing armed conflict. Land is
more readily available in the larger Katanga province, but land ownership is problematic due to
contradictory customary and formal law, as well as competing mining interests assigned by the national
government. Poor road conditions, insecurity due to conflict, and illegal taxation by state personnel
thwarts farmers’ ability to buy and sell food in traditional markets.
In addition to USAID/FFP’s efforts to improve food security in eastern DRC, USAID/DRC’s Country
Development Cooperation Strategy 2015–2019 Transition Objective intends to work with the government
to: identify drivers of conflict to create a basis for peace, improve governance, and economic
development; support models which mitigate drivers of conflict, improve living conditions, and
strengthen the social compact; and guarantee access to basic services for citizens.
2
1. INTRODUCTION
1.1 HISTORY
Pygmies were the earliest inhabitants of the Congo who first came to the region 5,000 years ago, some of
which, such as the Batwa tribe, can still be found throughout eastern parts of the current Democratic
Republic of Congo (DRC). They lived by hunting and gathering in Congo’s dense and game-rich forests.
Roughly 2,000 years ago Bantu-speaking horticulturalists settled in the area, ushering in an era of settled
cultivation (Edgerton 2002). The Congo’s rich mineral deposits prompted King Leopold II of Belgium to
establish Belgian Congo in 1891 (Hochschild 1998). During his brutal reign, the population was reduced
from an estimated 20 million to just 6 million people (Edgerton 2002).
After Leopold, the first Belgian minister of the colonies, Jules Renkin, sought to improve conditions and
give Congolese chiefs greater power. His so-called “native policy” provided education to local chiefs who
represented their people and served as intermediaries with the colonial government. He divided Belgian
Congo into chiefdoms (chefferies) and sub-chiefdoms (sous-chefferies) giving Congolese chiefs authority
to carry out administrative and police duties (Edgerton 2002). This arrangement was ultimately flawed as
the appointed “chiefs” were not always recognized by their tribes. The state apparatus was carried out by
mostly European state officials (chef de poste), most of whom had held a similar role during Leopold’s
reign and were generally incompetent. The administrative structure and posts used currently in DRC, such
as chefferies and chef de poste, are historical remnants of the structure created by Renkin over 100 years
ago. The Belgian colonial administration also considered some tribes such as the Luba of Kasai and Hutu
of Rwanda to be hard workers and recruited many of them to work in the copper mines in Katanga.
Similarly, they also transferred families from resource-poor Rwanda, which was part of the Belgian
Congo during this period, to more productive areas in eastern Congo. These significant movements of
people during the colonial era continue to fuel ethnic division and conflict in the region (Turner 2007).
Katanga. During the Belgian colonial period, Katanga played an important role in the colony’s economic
fortunes. Large mining concessions were granted to Belgian companies and the railroad project begun by
Leopold continued. Shortly after securing independence from Belgium in 1960, Moise Tshombe
proclaimed Katanga’s independence from the Congo.1 Many Europeans in Katanga supported secession
given their economic interests in the province. Prior to their secession, Katanga’s sizable copper reserves
and plantations comprised 80% of the Congo’s wealth. Unable to secure support from the United States or
United Nations to quell the secession movement in Katanga, newly-elected Prime Minister Patrice
Lumumba turned to the Soviet Union, unwittingly leading to a CIA-financed coup led by Colonel Joseph
Mobutu and Lumumba’s execution in 1961. Conflict between UN troops and those loyal to Tshombe and
his bid for independence continued until early 1963 when his secession movement was finally put to rest
at the cost of thousands of Congolese and European lives (Edgerton 2002).
During this same period, another group loyal to Lumumba called the Balubakat party opposed Tshombe,
and launched the “Simba Rebellion.” The movement was partly led by the socialist-leaning Laurent
Kabila, a native of Katanga (Prunier 2009). Following Tshombe’s defeat and self-exile, the Simba
Rebellion also sought independence for Eastern Congo and opposed the U.S.-backed Mobutu (Edgerton
2002). The campaign was eventually defeated in 1965 and Kabila decamped to South Kivu and then Dar
1 The “Belgian Congo” was renamed “Congo” at the time of independence (1960). President Mobutu renamed the country
“Zaire” in 1971. In 1997, President Laurent Kabila renamed the country “Democratic Republic of Congo.” Apart from historical
references, this review refers to the country by its current name, “Democratic Republic of Congo,” or simply “DRC.”
3
es Salaam until he was “reactivated” by the Ugandans and Rwandans to overthrow Mobutu in 1997
(Prunier 2009).
North and South Kivu. Given the relative remoteness of the Kivus, the Great Lakes region was not fully
explored until the 1870s by British explorer Henry Morton Stanley (Hochschild 1998). The colonial
authorities established Goma at the northern tip of Lake Kivu and Bukavu at the southern end as
government posts and both towns became thriving commercial centers by the 1940s. Congolese identity
in the Kivus has long been fraught by the large presence of “settler” populations, such as the Tutsi and
Hutu, who had been at odds with “indigenous” peoples over land rights. Historians note that the Great
Lakes region has long been characterized by fluctuating migration patterns (Jourdan 2005). During the
colonial period, many large pyretheum plantations relied on Hutu labor from Rwanda (Carr 1999).
Following Congo’s independence in 1960, Prime Minister Patrice Lumumba sent the Congolese army to
the Kivu province to quell unrest, leading to land seizures and a mass migration of whites and other ethnic
groups such as Banyaruandans from Goma, Bukavu, and its environs (Devlin 2007). UN Peacekeepers
were active in the Kivus in the early 1960’s and would return in the mid-1990s, responding to a broader
humanitarian crisis.
Following the Rwanda genocide in 1994, there were roughly 850,000 Rwandan refugees in North Kivu
and 650,000 in South Kivu with a toxic mix of former Rwandan military and ordinary civilians who had
committed genocide in Rwanda (Prunier 2008). Mobutu was sympathetic to the fallen Rwandan regime,
allowing former military men and politicians free movement in the country (ibid). These Rwandan
military men and politicians formed the core of the Democratic Forces for the Liberation of Rwanda
(FDLR). The FDLR still exists and has prompted Rwandan President Paul Kagame to invade DRC on
several occasions to combat the FDLR and back Congolese Tutsi armed groups.
1.2 CONFLICT
Issues associated with land rights, ethnicity, and the significant presence of valuable mineral resources
fueled much of the fighting during the 1996-1997 and 1998-2003 wars and simmering conflicts that linger
to the present day. Historian Gerard Prunier described the ongoing conflict in eastern DRC which partly
evolved out of the Rwandan genocide in the early 90s and Mobutu’s ouster by Laurent Kabila as “… the
disintegration of ‘rational’ war into myriad ‘privatized’, socially and economically motivated sub-
conflicts” (Prunier 2009).
Myriad rebel groups backing various causes vie for control of the Kivus. The Congolese Tutsi-led M23
rebel group briefly overtook the city of Goma in late 2012, then withdrew a month later to convene peace
talks with the government. However, they continued to have a presence in Kiwanja and Rutshuru, North
Kivu until October 2013, around which time they officially ended their rebellion with the surrender of the
rebel commander, Bosco Ntaganda, to the International Criminal Court in the Hague. At the same time,
roughly 1,500 M23 troops surrendered after crossing the Ugandan border. Elements of the various militias
collectively known as Mai Mai and foreign (FDLR and FNL)2 armed groups are also active in South
Kivu, especially in Shabunda, Fizi, and Uvira. As of late 2013, nearly 600,000 people had fled the zone
due to the armed conflicts (ADRA 2014). In response, the armed forces (FARDC) undertook an anti-rebel
operation in Uvira in 2014 (IRIN 2015). The UN High Commission for Refugees (UNHCR) estimates
that there were 2.7 million internally displacement persons (IDPs) within DRC in 2014, primarily in the
east, and another 430,000 Congolese refugees in Burundi, Rwanda, Tanzania, and Uganda. Youth are at
greatest risk of joining or supporting armed groups because of a breakdown in the education system and a
2 FNL (National Forces of Liberation) is a Burundian rebel group originally formed in 1985 as the military wing of a political
group led by the majority Hutu ethnic group. They have been active in the Uvira area of South Kivu.
4
lack of employment opportunities and other ways to earn a living. As a result, many young people enter a
vicious cycle of violence that is difficult to break, even if they participate in donor-funded demobilization
programs (Rudolf 2014).
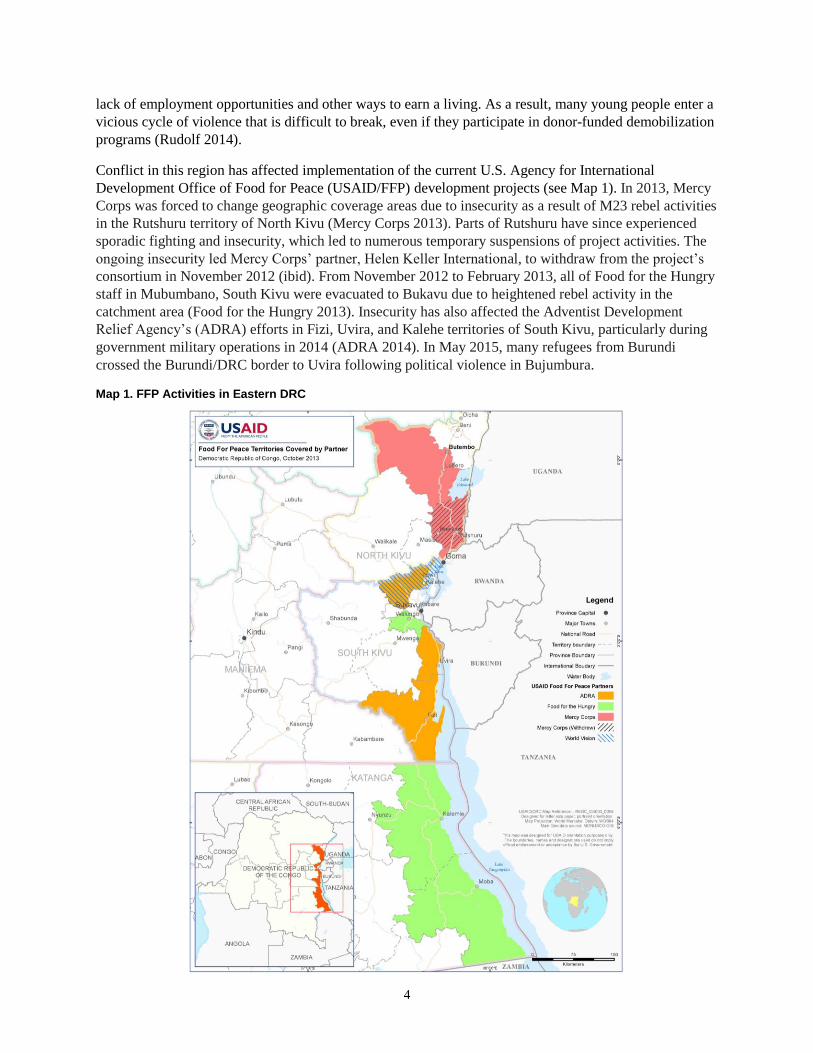
Conflict in this region has affected implementation of the current U.S. Agency for International
Development Office of Food for Peace (USAID/FFP) development projects (see Map 1). In 2013, Mercy
Corps was forced to change geographic coverage areas due to insecurity as a result of M23 rebel activities
in the Rutshuru territory of North Kivu (Mercy Corps 2013). Parts of Rutshuru have since experienced
sporadic fighting and insecurity, which led to numerous temporary suspensions of project activities. The
ongoing insecurity led Mercy Corps’ partner, Helen Keller International, to withdraw from the project’s
consortium in November 2012 (ibid). From November 2012 to February 2013, all of Food for the Hungry
staff in Mubumbano, South Kivu were evacuated to Bukavu due to heightened rebel activity in the
catchment area (Food for the Hungry 2013). Insecurity has also affected the Adventist Development
Relief Agency’s (ADRA) efforts in Fizi, Uvira, and Kalehe territories of South Kivu, particularly during
government military operations in 2014 (ADRA 2014). In May 2015, many refugees from Burundi
crossed the Burundi/DRC border to Uvira following political violence in Bujumbura.
Map 1. FFP Activities in Eastern DRC
5
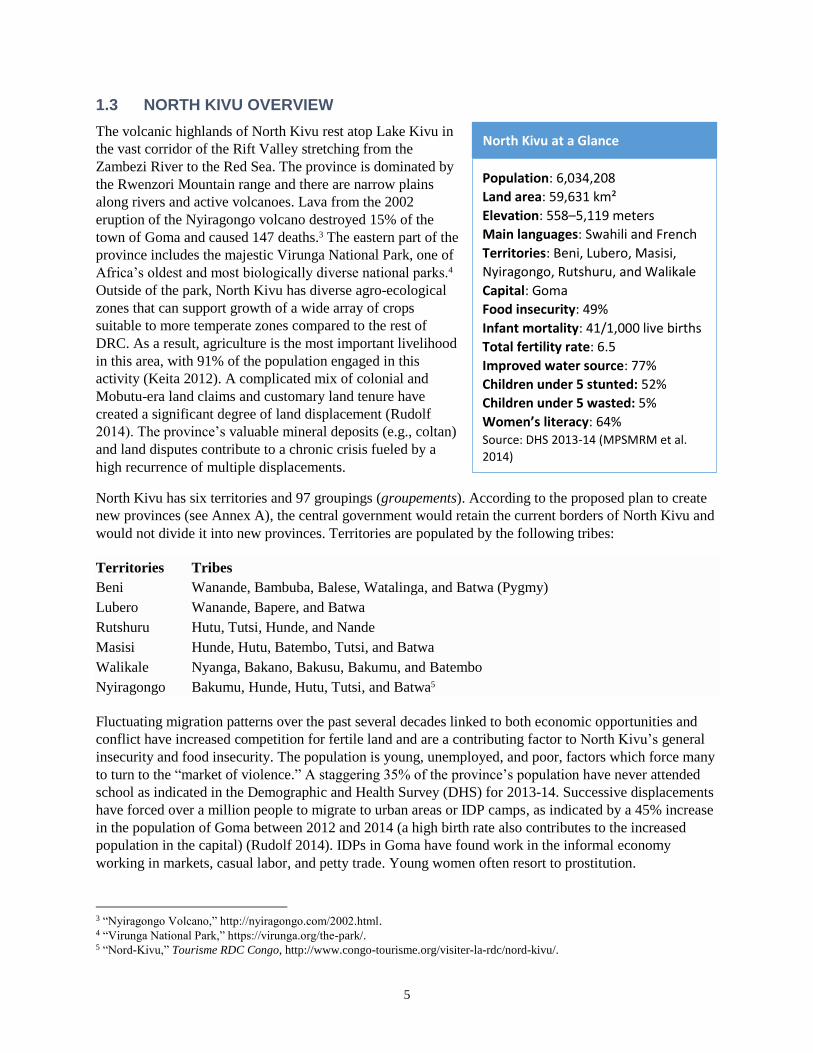
1.3 NORTH KIVU OVERVIEW
The volcanic highlands of North Kivu rest atop Lake Kivu in
the vast corridor of the Rift Valley stretching from the
Zambezi River to the Red Sea. The province is dominated by
the Rwenzori Mountain range and there are narrow plains
along rivers and active volcanoes. Lava from the 2002
eruption of the Nyiragongo volcano destroyed 15% of the
town of Goma and caused 147 deaths.3 The eastern part of the
province includes the majestic Virunga National Park, one of
Africa’s oldest and most biologically diverse national parks.4
Outside of the park, North Kivu has diverse agro-ecological
zones that can support growth of a wide array of crops
suitable to more temperate zones compared to the rest of
DRC. As a result, agriculture is the most important livelihood
in this area, with 91% of the population engaged in this
activity (Keita 2012). A complicated mix of colonial and
Mobutu-era land claims and customary land tenure have
created a significant degree of land displacement (Rudolf
2014). The province’s valuable mineral deposits (e.g., coltan)
and land disputes contribute to a chronic crisis fueled by a
high recurrence of multiple displacements.
North Kivu has six territories and 97 groupings (groupements). According to the proposed plan to create
new provinces (see Annex A), the central government would retain the current borders of North Kivu and
would not divide it into new provinces. Territories are populated by the following tribes:
Territories Tribes
Beni Wanande, Bambuba, Balese, Watalinga, and Batwa (Pygmy)
Lubero Wanande, Bapere, and Batwa
Rutshuru Hutu, Tutsi, Hunde, and Nande
Masisi Hunde, Hutu, Batembo, Tutsi, and Batwa
Walikale Nyanga, Bakano, Bakusu, Bakumu, and Batembo
Nyiragongo Bakumu, Hunde, Hutu, Tutsi, and Batwa5
Fluctuating migration patterns over the past several decades linked to both economic opportunities and
conflict have increased competition for fertile land and are a contributing factor to North Kivu’s general
insecurity and food insecurity. The population is young, unemployed, and poor, factors which force many
to turn to the “market of violence.” A staggering 35% of the province’s population have never attended
school as indicated in the Demographic and Health Survey (DHS) for 2013-14. Successive displacements
have forced over a million people to migrate to urban areas or IDP camps, as indicated by a 45% increase
in the population of Goma between 2012 and 2014 (a high birth rate also contributes to the increased
population in the capital) (Rudolf 2014). IDPs in Goma have found work in the informal economy
working in markets, casual labor, and petty trade. Young women often resort to prostitution.
North Kivu at a Glance
Population: 6,034,208
Land area: 59,631 km²
Elevation: 558–5,119 meters
Main languages: Swahili and French
Territories: Beni, Lubero, Masisi,
Nyiragongo, Rutshuru, and Walikale
Capital: Goma
Food insecurity: 49%
Infant mortality: 41/1,000 live births
Total fertility rate: 6.5
Improved water source: 77%
Children under 5 stunted: 52%
Children under 5 wasted: 5%
Women’s literacy: 64% Source: DHS 2013-14 (MPSMRM et al.
2014)
3 “Nyiragongo Volcano,” http://nyiragongo.com/2002.html. 4 “Virunga National Park,” https://virunga.org/the-park/. 5 “Nord-Kivu,” Tourisme RDC Congo, http://www.congo-tourisme.org/visiter-la-rdc/nord-kivu/.
6
Nearly half of households in North Kivu were moderately or severely food insecure according to analysis
by the World Food Programme (WFP 2014). A baseline carried out in five health zones of Mercy Corps’
FFP-funded project areas in 2012 found that 51% of children under 5 years were stunted (Keita 2012).
Major constraints to improving household production and marketing include: lack of access to arable
land; large pre- and post-harvest losses; crop disease; inability to access credit; long distances to market
centers; and taxation (informal and formal) on products going to markets. Within health and nutrition,
households exhibit: poor dietary diversity and hygiene and sanitation practices; lack of water and
sanitation infrastructure; poor understanding of optimal nutrition actions; and underutilization of de-
worming medicines and iron and vitamin A supplementation. Stock-outs of medicines are common and
health staff have limited knowledge beyond basic training. The ongoing conflict and displacement
maintains instability in the province and this has meant that men and women cannot consistently farm on
their land, and at times the land they have been allocated is usurped by others. In this context sexual and
physical gender-based violence perpetrated by the rebels, the army, and within households remains a
significant threat to women and children, both resulting from and causing displacement (Oxfam 2015;
Slegh et al. 2012).
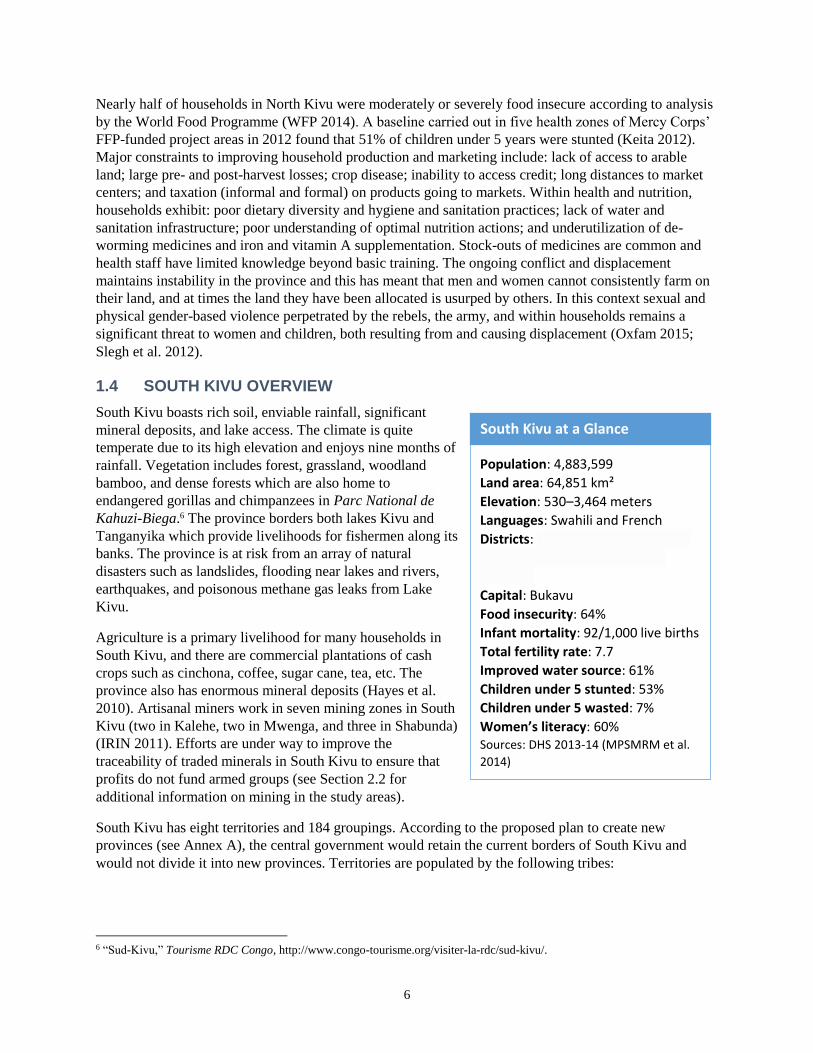
1.4 SOUTH KIVU OVERVIEW
South Kivu boasts rich soil, enviable rainfall, significant
mineral deposits, and lake access. The climate is quite
temperate due to its high elevation and enjoys nine months of
rainfall. Vegetation includes forest, grassland, woodland
bamboo, and dense forests which are also home to
endangered gorillas and chimpanzees in Parc National de
Kahuzi-Biega.6 The province borders both lakes Kivu and
Tanganyika which provide livelihoods for fishermen along its
banks. The province is at risk from an array of natural
disasters such as landslides, flooding near lakes and rivers,
earthquakes, and poisonous methane gas leaks from Lake
Kivu.
Agriculture is a primary livelihood for many households in
South Kivu, and there are commercial plantations of cash
crops such as cinchona, coffee, sugar cane, tea, etc. The
province also has enormous mineral deposits (Hayes et al.
2010). Artisanal miners work in seven mining zones in South
Kivu (two in Kalehe, two in Mwenga, and three in Shabunda)
(IRIN 2011). Efforts are under way to improve the
traceability of traded minerals in South Kivu to ensure that
profits do not fund armed groups (see Section 2.2 for
additional information on mining in the study areas).
South Kivu has eight territories and 184 groupings. According to the proposed plan to create new
provinces (see Annex A), the central government would retain the current borders of South Kivu and
would not divide it into new provinces. Territories are populated by the following tribes:
South Kivu at a Glance
Population: 4,883,599
Land area: 64,851 km²
Elevation: 530–3,464 meters
Languages: Swahili and French
Districts: Fizi, Idjwi, Kabare, Kalehe,
Mwenga, Shabunda, Uvira, and
Walungu
Capital: Bukavu
Food insecurity: 64%
Infant mortality: 92/1,000 live births
Total fertility rate: 7.7
Improved water source: 61%
Children under 5 stunted: 53%
Children under 5 wasted: 7%
Women’s literacy: 60% Sources: DHS 2013-14 (MPSMRM et al.
2014)
6 “Sud-Kivu,” Tourisme RDC Congo, http://www.congo-tourisme.org/visiter-la-rdc/sud-kivu/.
7
Territories Tribes
Fizi Barega and Babembe
Idjwi Bahavu and Batwa
Kabare Bashi and Batwa
Kalehe Bahavu, Bashi, and Batwa
Mwenga Bashi, Barega, and Banyindu
Shabunda Barega
Uvira Bavira, Bafulero, and Barundi
Walungu Bashi and Banyindu7
Prior to the start of the conflict in 1996, South Kivu’s favorable environment, proximity to East African
markets, and developed commercial network contributed to a higher standard of living compared to more
remote and dry regions of eastern DRC (Fermon 2008). Food security has deteriorated remarkably in the
last twenty years despite some improvement in the security situation since 2005. The province now has
the highest level of food insecurity in DRC, with 64% considered food insecure (WFP 2014). Many
displaced households lost assets such as grain, seeds, tools, and livestock due to conflict. More
importantly the conflict has eroded the province’s social fabric. Many have migrated to urban areas, IDP
camps, or have become refugees in neighboring Rwanda, Burundi, Tanzania, and Uganda. The conflict
has shown no sign of abating and significant population movements were registered following FARDC’s
military operations in 2014 and there was a more recent influx of refugees due to political instability in
neighboring Burundi. For some IDPs who returned to their homes, they have been unable to get their land
back (Fermon 2008). Years of conflict have taken a toll on the education system reflected by the fact that
37% reported having never attended school (MPSMRM et al. 2014). The second highest illiteracy rate in
DRC is in South Kivu (36%). In addition, at a national level, female heads of household are more likely
to be illiterate (53%) than male heads of household (25%), and, in aggregate, South Kivu has a
comparatively large proportion of female-headed households (33%) (WFP 2014; FEWS NET 2015).
Most of the province’s population depend on livestock and agriculture as their primary livelihood.
Important subsistence crops such as banana and cassava have been significantly affected by Banana
Xanthomonas Wilt (BXW), which has cut banana production by half, and cassava mosaic disease (ADRA
2012). Many farmers have switched to other crops such as beans, maize, and sweet potato in an effort to
mitigate the negative impacts of these blights. Farmers also report a significant drop in rainfall and erratic
weather patterns compared to the past. Poor road conditions and the near absence of a functioning
government have further worsened the situation. As in North Kivu, the health system suffers from
frequent stock-outs of medicines and lack of qualification of health staff in areas such as nutrition beyond
basic training. Sexual and physical gender-based violence both within and outside the home are also
common (Oxfam 2015).
7 “Sud-Kivu,” Tourisme RDC Congo, http://www.congo-tourisme.org/visiter-la-rdc/sud-kivu/.
8
1.5 KATANGA OVERVIEW
Katanga is a vast province, larger than many countries, and the
source of one of the world’s greatest rivers—the Congo. The
province has high plateaus covered with dense bush and
scattered forests, which once had a variety of wildlife. As
previously noted, Katanga has some of the world’s largest
deposits of copper, cobalt, and zinc, as well as other precious
minerals. The Tanganyika territory, which is the focus of this
document, is 1,000 kilometers north of Lubumbashi and has a
vastly different ecosystem than the rest of the province.8
Kalemie, previously named Albertvilles, lies in a dry plateau
surrounded by tropical forest (Butcher 2008). The Kalemie rail
line at Lake Tanganyika which once served as a vital link to the
Lubumbashi–Kindu line used for copper exports has been in
disrepair for years and was further vandalized/looted by rebels
during the conflict in the 1990s. Nonetheless, Kalemie Port
continues to serve as an important logistics hub for UN-
MONUSCO (the UN Stabilization Mission in Congo) and
WFP’s humanitarian operations for cargo crossing Lake
Tanganyika from the Tanzanian coastline. In the Tanganyika
territory, agriculture, fishing, and livestock are the primary
livelihoods. There is also some small scale artisanal mining of
gold and other precious minerals.
The most dominant tribe along the banks of Lake Tanganyika are the Balunda. In the forested, inland
areas west of Kalemie, there are numerous Pygmy tribes such as the Batwa.9 In Tanganyika, the
Banyamulenge tribe (descended from Rwanda) faced significant persecution from the beginning of the
conflict in the late 1990s. The area saw substantial fighting during the 1996-1997 and 1998-2003 wars
and as recently as 2013 when FARDC troops battled Mai in the forested areas around Kalemie (Food for
the Hungry 2013). In 2014, there were interethnic clashes between pygmies (Batwa) and other Bantu
tribes (e.g., Balunda) in Moba and Kalemie (UNHCR 2014).
At present, Katanga has 22 territories and 504 groupings (groupements), making it one of the largest
provinces in the country. According to the proposed plan to create new provinces (see Annex A), the
central government would split Katanga into four new provinces which are currently categorized as
districts, including: Tanganyika (134,940 km²), Haut Lomami (108,204 km²), Haut Katanga (132,425
km²), and Lualaba (121,308 km²).
Sixteen percent of households in Katanga face severe food insecurity (WFP 2014). This was the second
worst rate in the country after Equateur province. For areas assessed by the 2012 baseline for Food for the
Hungry’s FFP development project, rates of severe acute malnutrition (SAM) were determined to be 2.6%
and 3.4% in Moba and Kalemie, respectively. Roughly half of children under 2 years were found to be
stunted and about a quarter were underweight in both regions. The health system in Katanga is somewhat
weak in vitamin A supplementation, deworming, and treatment of SAM (MPSMRM et al. 2014; Food for
the Hungry 2014b). Another significant problem in the province is the fact that 16% of women have never
gone to school, compared to 2% of men (WFP 2014). In addition, conflict over land remains a widespread
8 For the purpose of this study, the analysis focuses on the Tanganyika territory, i.e., the lakeside region from Moba to Kalemie. 9 “Population & langues,” Katanga Tourisme, http://www.katanga-tourisme.org/cultures-traditions.
Katanga at a Glance Population: 5,608,683
Land area: 496,877 km²
Elevation: 504–2,710 meters
(Tanganyika only)
Languages: Swahili and French
Districts: Haut Katanga, Haut
Lomami, Kolwezi, Lualaba, and
Tanganika
Capital: Lubumbashi
Food insecurity: 57%
Infant mortality: 72/1,000 live
births
Total fertility rate: 7.8
Improved water source: 48%
Children under 5 stunted: 45%
Children under 5 wasted: 8%
Women’s literacy: 54% Sources: DHS 2013-14 (MPSMRM et al.
2014)
9
problem in Katanga, and this has important implications from a gender perspective as local skirmishes
between the rebels and the army has continued to fuel gender-based sexual and physical violence against
women—both within and outside the home (FAO 2008). Conflict over land appears to be partly due to
contradictions between who manages the land, the state or local chiefs. This is further compounded by the
fact that Katanga is rich in mineral resources, and an increasing number of mining exploration permits
have been issued by the state, resulting in many families being displaced and unable to farm. Farmers
have also noted that seasonal and climate variability have curtailed the growing season and reduced crop
production significantly, according to a comprehensive seed security assessment undertaken in
Tanganyika territory. In response, farmers are abandoning crops such as maize, beans, and groundnuts
and switching to sweet potatoes more broadly and planting rice and horticultural crops in valley bottoms
(Sperling 2012).
10
2. FOOD SECURITY CONTEXT
2.1 FOOD AVAILABILITY
2.1.1 PRODUCTION SYSTEMS, LEVELS, AND TRENDS
Agriculture is an important livelihood for most households in the Kivus and North Katanga. In North and
South Kivu ample rainfall and fertile volcanic soils present some of the greatest opportunities for the
production of food and cash crops. However the prolonged conflict has had a critical impact on the ability
of households to farm, due in part to displacement. In areas such as Masisi and Rutshuru in North Kivu,
land is scarce and poor households must rent from landowners. A similar dynamic exists in South Kivu
where an ongoing cycle of violence since the late 1960s has limited farmers’ capacity to produce food and
contributes to food insecurity (Cox 2011). High population density in the Kivus, as indicated in Table 1,
also contributes particularly to land scarcity and disputes. In response, many men have moved to urban
areas to undertake a variety of paid labor leaving agriculture to relatively more vulnerable groups such as
children, women, elders, and disabled people (Sadiki 2011). In contrast, land availability and population
density are less of a problem in North Katanga and sporadic conflict has created only temporary
displacements; nothing close to the scale of the neighboring Kivus (see Table 1).
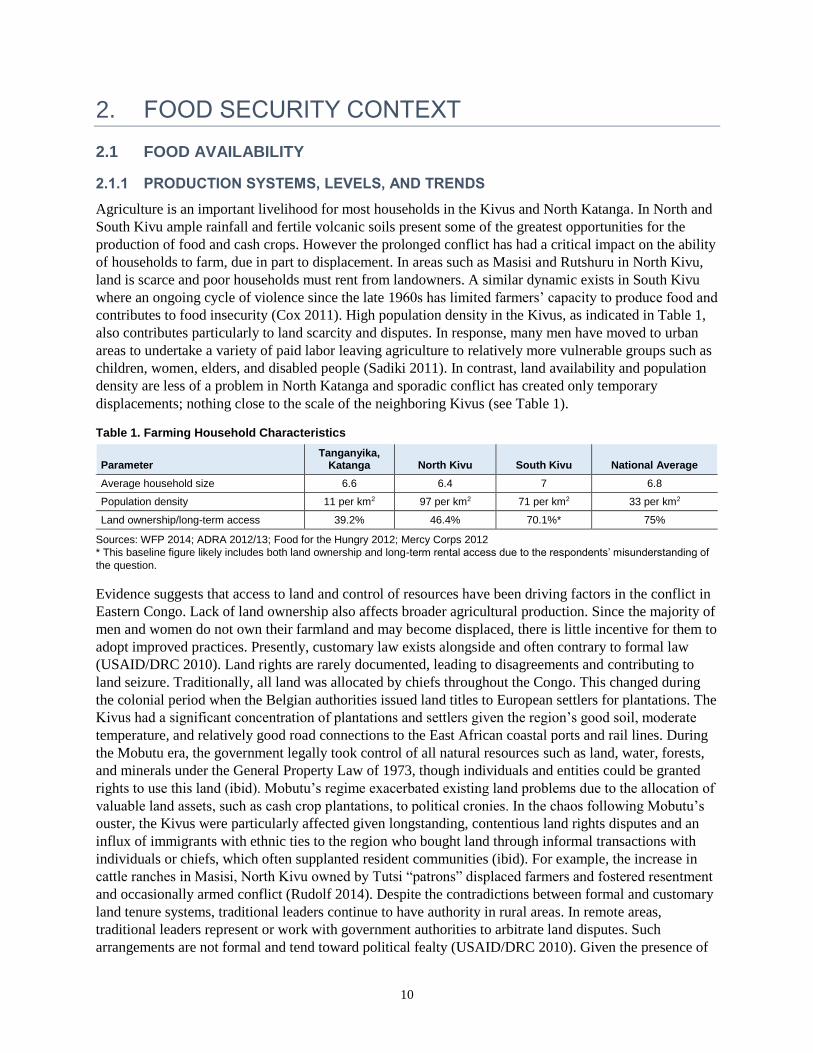
Table 1. Farming Household Characteristics
Parameter Tanganyika,
Katanga North Kivu South Kivu National Average
Average household size 6.6 6.4 7 6.8
Population density 11 per km2 97 per km2 71 per km2 33 per km2
Land ownership/long-term access 39.2% 46.4% 70.1%* 75%
Sources: WFP 2014; ADRA 2012/13; Food for the Hungry 2012; Mercy Corps 2012
* This baseline figure likely includes both land ownership and long-term rental access due to the respondents’ misunderstanding of
the question.
Evidence suggests that access to land and control of resources have been driving factors in the conflict in
Eastern Congo. Lack of land ownership also affects broader agricultural production. Since the majority of
men and women do not own their farmland and may become displaced, there is little incentive for them to
adopt improved practices. Presently, customary law exists alongside and often contrary to formal law
(USAID/DRC 2010). Land rights are rarely documented, leading to disagreements and contributing to
land seizure. Traditionally, all land was allocated by chiefs throughout the Congo. This changed during
the colonial period when the Belgian authorities issued land titles to European settlers for plantations. The
Kivus had a significant concentration of plantations and settlers given the region’s good soil, moderate
temperature, and relatively good road connections to the East African coastal ports and rail lines. During
the Mobutu era, the government legally took control of all natural resources such as land, water, forests,
and minerals under the General Property Law of 1973, though individuals and entities could be granted
rights to use this land (ibid). Mobutu’s regime exacerbated existing land problems due to the allocation of
valuable land assets, such as cash crop plantations, to political cronies. In the chaos following Mobutu’s
ouster, the Kivus were particularly affected given longstanding, contentious land rights disputes and an
influx of immigrants with ethnic ties to the region who bought land through informal transactions with
individuals or chiefs, which often supplanted resident communities (ibid). For example, the increase in
cattle ranches in Masisi, North Kivu owned by Tutsi “patrons” displaced farmers and fostered resentment
and occasionally armed conflict (Rudolf 2014). Despite the contradictions between formal and customary
land tenure systems, traditional leaders continue to have authority in rural areas. In remote areas,
traditional leaders represent or work with government authorities to arbitrate land disputes. Such
arrangements are not formal and tend toward political fealty (USAID/DRC 2010). Given the presence of
11
minerals in the Kivus, the government has some local representatives who collect taxes on artisanal
miners and businesses (ibid).
Perched in the highlands, the Kivus are heavily forested and enjoy some of the highest average rainfall
and lowest temperatures in DRC, while the savannas in Tanganyika lakeshore region are dryer and hotter
(see Table 2). There are more inhabited zones in Tanganyika and North Kivu compared to South Kivu.
Active and dormant volcanoes in the Kivus have blessed the region with high quality andosol and vertisol
soil rich in calcium, magnesium, and aluminum, thus ideal for agricultural production (MINAGRI 2009).
Soil in Tanganyika is primarily clay-heavy, ferrisol soil with scattered deposits of sand, especially on the
banks of the lake (ibid). Although the soil is poorer quality than that of the Kivus, inhabitants of the
region produce an array of crops.
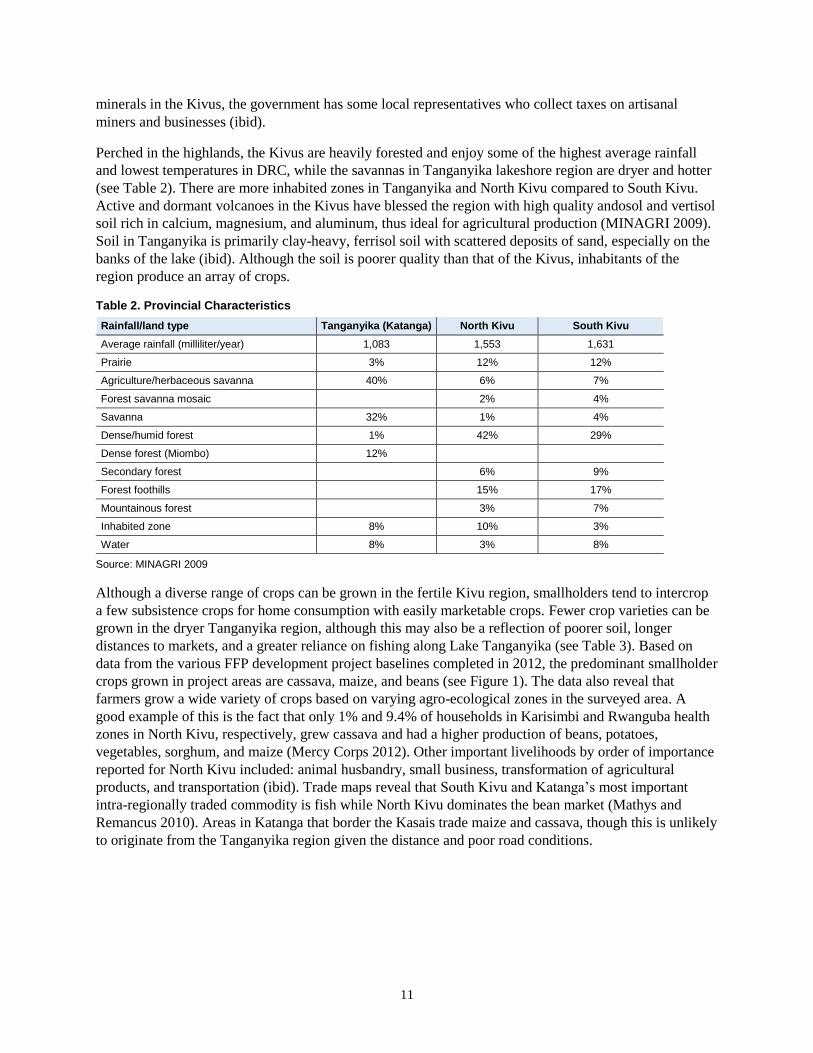
Table 2. Provincial Characteristics
Rainfall/land type Tanganyika (Katanga) North Kivu South Kivu
Average rainfall (milliliter/year) 1,083 1,553 1,631
Prairie 3% 12% 12%
Agriculture/herbaceous savanna 40% 6% 7%
Forest savanna mosaic 2% 4%
Savanna 32% 1% 4%
Dense/humid forest 1% 42% 29%
Dense forest (Miombo) 12%
Secondary forest 6% 9%
Forest foothills 15% 17%
Mountainous forest 3% 7%
Inhabited zone 8% 10% 3%
Water 8% 3% 8%
Source: MINAGRI 2009
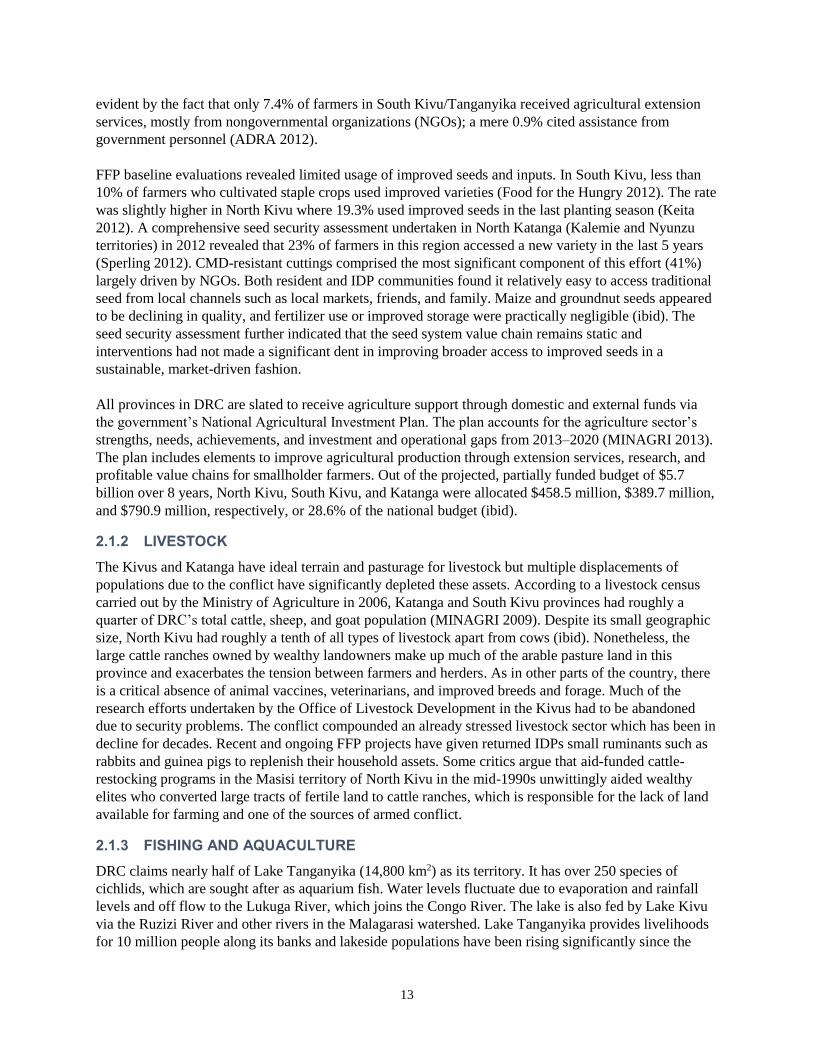
Although a diverse range of crops can be grown in the fertile Kivu region, smallholders tend to intercrop
a few subsistence crops for home consumption with easily marketable crops. Fewer crop varieties can be
grown in the dryer Tanganyika region, although this may also be a reflection of poorer soil, longer
distances to markets, and a greater reliance on fishing along Lake Tanganyika (see Table 3). Based on
data from the various FFP development project baselines completed in 2012, the predominant smallholder
crops grown in project areas are cassava, maize, and beans (see Figure 1). The data also reveal that
farmers grow a wide variety of crops based on varying agro-ecological zones in the surveyed area. A
good example of this is the fact that only 1% and 9.4% of households in Karisimbi and Rwanguba health
zones in North Kivu, respectively, grew cassava and had a higher production of beans, potatoes,
vegetables, sorghum, and maize (Mercy Corps 2012). Other important livelihoods by order of importance
reported for North Kivu included: animal husbandry, small business, transformation of agricultural
products, and transportation (ibid). Trade maps reveal that South Kivu and Katanga’s most important
intra-regionally traded commodity is fish while North Kivu dominates the bean market (Mathys and
Remancus 2010). Areas in Katanga that border the Kasais trade maize and cassava, though this is unlikely
to originate from the Tanganyika region given the distance and poor road conditions.
12
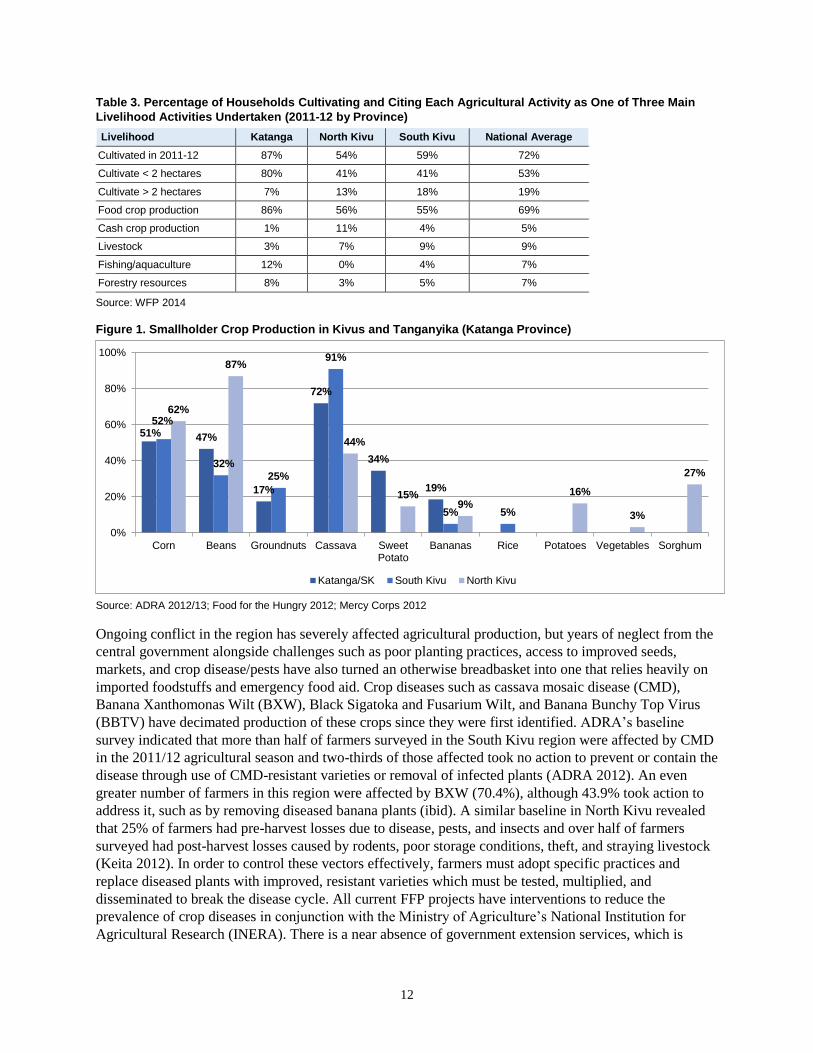
Table 3. Percentage of Households Cultivating and Citing Each Agricultural Activity as One of Three Main
Livelihood Activities Undertaken (2011-12 by Province)
Livelihood Katanga North Kivu South Kivu National Average
Cultivated in 2011-12 87% 54% 59% 72%
Cultivate < 2 hectares 80% 41% 41% 53%
Cultivate > 2 hectares 7% 13% 18% 19%
Food crop production 86% 56% 55% 69%
Cash crop production 1% 11% 4% 5%
Livestock 3% 7% 9% 9%
Fishing/aquaculture 12% 0% 4% 7%
Forestry resources 8% 3% 5% 7%
Source: WFP 2014
Figure 1. Smallholder Crop Production in Kivus and Tanganyika (Katanga Province)
Source: ADRA 2012/13; Food for the Hungry 2012; Mercy Corps 2012
51% 47%
17%
72%
34%
19%
52%
32%
25%
91%
5% 5%
62%
87%
44%
15%9%
16%
3%
27%
0%
20%
40%
60%
80%
100%
Corn Beans Groundnuts Cassava SweetPotato
Bananas Rice Potatoes Vegetables Sorghum
Katanga/SK South Kivu North Kivu
Ongoing conflict in the region has severely affected agricultural production, but years of neglect from the
central government alongside challenges such as poor planting practices, access to improved seeds,
markets, and crop disease/pests have also turned an otherwise breadbasket into one that relies heavily on
imported foodstuffs and emergency food aid. Crop diseases such as cassava mosaic disease (CMD),
Banana Xanthomonas Wilt (BXW), Black Sigatoka and Fusarium Wilt, and Banana Bunchy Top Virus
(BBTV) have decimated production of these crops since they were first identified. ADRA’s baseline
survey indicated that more than half of farmers surveyed in the South Kivu region were affected by CMD
in the 2011/12 agricultural season and two-thirds of those affected took no action to prevent or contain the
disease through use of CMD-resistant varieties or removal of infected plants (ADRA 2012). An even
greater number of farmers in this region were affected by BXW (70.4%), although 43.9% took action to
address it, such as by removing diseased banana plants (ibid). A similar baseline in North Kivu revealed
that 25% of farmers had pre-harvest losses due to disease, pests, and insects and over half of farmers
surveyed had post-harvest losses caused by rodents, poor storage conditions, theft, and straying livestock
(Keita 2012). In order to control these vectors effectively, farmers must adopt specific practices and
replace diseased plants with improved, resistant varieties which must be tested, multiplied, and
disseminated to break the disease cycle. All current FFP projects have interventions to reduce the
prevalence of crop diseases in conjunction with the Ministry of Agriculture’s National Institution for
Agricultural Research (INERA). There is a near absence of government extension services, which is
13
evident by the fact that only 7.4% of farmers in South Kivu/Tanganyika received agricultural extension
services, mostly from nongovernmental organizations (NGOs); a mere 0.9% cited assistance from
government personnel (ADRA 2012).
FFP baseline evaluations revealed limited usage of improved seeds and inputs. In South Kivu, less than
10% of farmers who cultivated staple crops used improved varieties (Food for the Hungry 2012). The rate
was slightly higher in North Kivu where 19.3% used improved seeds in the last planting season (Keita
2012). A comprehensive seed security assessment undertaken in North Katanga (Kalemie and Nyunzu
territories) in 2012 revealed that 23% of farmers in this region accessed a new variety in the last 5 years
(Sperling 2012). CMD-resistant cuttings comprised the most significant component of this effort (41%)
largely driven by NGOs. Both resident and IDP communities found it relatively easy to access traditional
seed from local channels such as local markets, friends, and family. Maize and groundnut seeds appeared
to be declining in quality, and fertilizer use or improved storage were practically negligible (ibid). The
seed security assessment further indicated that the seed system value chain remains static and
interventions had not made a significant dent in improving broader access to improved seeds in a
sustainable, market-driven fashion.
All provinces in DRC are slated to receive agriculture support through domestic and external funds via
the government’s National Agricultural Investment Plan. The plan accounts for the agriculture sector’s
strengths, needs, achievements, and investment and operational gaps from 2013–2020 (MINAGRI 2013).
The plan includes elements to improve agricultural production through extension services, research, and
profitable value chains for smallholder farmers. Out of the projected, partially funded budget of $5.7
billion over 8 years, North Kivu, South Kivu, and Katanga were allocated $458.5 million, $389.7 million,
and $790.9 million, respectively, or 28.6% of the national budget (ibid).
2.1.2 LIVESTOCK
The Kivus and Katanga have ideal terrain and pasturage for livestock but multiple displacements of
populations due to the conflict have significantly depleted these assets. According to a livestock census
carried out by the Ministry of Agriculture in 2006, Katanga and South Kivu provinces had roughly a
quarter of DRC’s total cattle, sheep, and goat population (MINAGRI 2009). Despite its small geographic
size, North Kivu had roughly a tenth of all types of livestock apart from cows (ibid). Nonetheless, the
large cattle ranches owned by wealthy landowners make up much of the arable pasture land in this
province and exacerbates the tension between farmers and herders. As in other parts of the country, there
is a critical absence of animal vaccines, veterinarians, and improved breeds and forage. Much of the
research efforts undertaken by the Office of Livestock Development in the Kivus had to be abandoned
due to security problems. The conflict compounded an already stressed livestock sector which has been in
decline for decades. Recent and ongoing FFP projects have given returned IDPs small ruminants such as
rabbits and guinea pigs to replenish their household assets. Some critics argue that aid-funded cattle-
restocking programs in the Masisi territory of North Kivu in the mid-1990s unwittingly aided wealthy
elites who converted large tracts of fertile land to cattle ranches, which is responsible for the lack of land
available for farming and one of the sources of armed conflict.
2.1.3 FISHING AND AQUACULTURE
DRC claims nearly half of Lake Tanganyika (14,800 km2) as its territory. It has over 250 species of
cichlids, which are sought after as aquarium fish. Water levels fluctuate due to evaporation and rainfall
levels and off flow to the Lukuga River, which joins the Congo River. The lake is also fed by Lake Kivu
via the Ruzizi River and other rivers in the Malagarasi watershed. Lake Tanganyika provides livelihoods
for 10 million people along its banks and lakeside populations have been rising significantly since the
14
1960s (Fermon 2008). There are six primary species that fishermen seek for marketing purposes—two
types of sardines (ndagala) and four types of larger predator Latidae fish known locally as mukeke (ibid).
Industrial fishermen operate within 5 kilometers of the shore with larger boats, outboard motors, etc.
However, this practice has diminished significantly in the northern part of the lake since fish production
reached its peak in the early 1980s. Artisanal fisherman use catamarans or pirogues with 4–8 fisherman
onboard who fish as their primary livelihood. Subsistence fisherman fish very close to shore with
motorless pirogues as a means to supplement income from farming. A number of elements affect the lake
in the long term. Deforestation near the lake and in its watershed contributes to soil erosion, which has a
negative impact on littoral fish stocks. The lake is also negatively affected by the removal of rocks and
reeds for construction, pollution from human and agro-chemical waste, and overfishing in certain zones.
Although the ongoing FFP projects have not been actively supporting fishermen, ACF International has
been working in this sector for the past decade to provide materials to fishermen displaced by conflict in
Fizi and Uvira, South Kivu.
Lake Kivu is 2,370 km² and 240 meters at its deepest point and borders DRC and Rwanda. Compared to
Lake Tanganyika, it has a more modest 18 species of cichlids fish, and the ever popular and marketable
tilapia. The lake also includes Idjwi Island, the world’s tenth largest inland island and home to nearly
200,000 people who have their own dialect, Kihavu. The number of fishermen working on Lake Kivu has
seen a sharp decline since the onset of the Rwandan genocide and ongoing conflict in the Kivus. Many
fishermen lost their equipment due to displacement. Additionally, existing fishing techniques, equipment,
and conservation methods are poor, thus production of fresh and dried fish is low. The presence of both
methane and carbon dioxide gas trapped in the lake caused by volcanic interaction in the lake’s bottom
water presents both an economic opportunity and potential catastrophe. For example, Rwanda is in the
process of harnessing methane gas as a significant power source and it currently powers the Bralirwa
brewery in Gisenyi, the border town of Goma, using methane from the lake. However, the inhabitants
surrounding Kivu are under a low threat of a massive methane explosion which could release carbon
dioxide and subsequently suffocate hundreds of thousands of people around the lake and on Idjwi Island.
2.1.4 GENDER AND LAND ACCESS
As in other parts of DRC, women are very active in the agricultural sector in the study areas—63.4%
participate in agriculture in North Kivu, 70.7% in South Kivu, and 60.4% in Katanga—but few are able to
own or inherit land (MPSMRM et al. 2014). Although the DRC’s constitution espouses equality for
women, many of the country’s laws do not reflect this. For example, previous studies indicate that a
married woman is unable to purchase or lease land, or open a bank account without her husband’s
permission (USAID/DRC 2010). Although women are expected to grow food for the family’s
consumption on land provided by their husbands, they do not own the land. Since the conflict began in
this area 20 years ago, women have found it increasingly difficult to access land due to the presence of
armed militias, which contribute to their displacement and sexual violence against them.
Recent survey data from Katanga and the Kivus suggests that access to land and asset ownership by men
and women remains a widespread problem (FAO 2008; Oxfam 2015; Slegh et al. 2012). As mentioned
previously, persistent instability as a result of skirmishes between rebels and the army have resulted in
men and women losing access to land and their homesteads. This is compounded by the fact that land is
managed by chiefs in these regions and land is not titled to men or women. Continuing rebel activity has
resulted in men and women having to make payments to rebels, chiefs, and others to retain access to their
land; at the same time, lack of land titling and temporary displacement adversely impact food production.
Women in particular are affected because they depend on their husbands or male family members to
access land. Because of the limited access to land more broadly in this context, women may only be able
to farm on land allocated or leased to men. The reality is that while women provide the predominant farm
15
labor, they are a lower priority in terms of the social hierarchy for land allocation. As a result of this, land
that is allocated to women (if at all) may be rented or leased for shorter periods of time, and is often of
poorer quality and smaller in size, limiting the extent to which women can produce food compared to
men.
2.2 FOOD ACCESSIBILITY
2.2.1 HOUSEHOLD FOOD ACCESS DETERMINANTS, TRENDS, AND VARIATION
As noted previously, the majority of households in the Kivus and Katanga engage in crop and/or livestock
production as a primary livelihood. In Katanga, 86% of households reported food crop production as one
of three primary livelihood activities. This figure drops to 56% and 55% in North and South Kivu,
respectively (see Table 3), where, despite relatively more favorable production conditions (e.g., more
fertile soil, stronger market linkages), widespread and persistent conflict and resultant displacement
(which also affects Katanga province) limit households’ capacities to consistently engage in these
activities, in terms of their ability to access plots and adequate labor for production (WFP 2014). In all
three areas reviewed, agricultural production faces several constraints that prevent households from
optimizing yields and income gains. As previously noted, these constraints include limited access to land,
improved seed and other inputs, and government extension services. Crop diseases and pest infestations
further inhibit production. In terms of land access, in a recent survey from Katanga, 80% of households
who reported cultivating crops did so on less than 2 hectares of land (WFP 2014). The majority of
farming households in North and South Kivu also reported producing on limited landholdings. For
example, in North Kivu, 54% of the population reported engaging in production. Of this 54%, 41%
produced on less than 2 hectares of land and the remaining 13% produced on more than 2 hectares (see
Table 3) (ibid). Similarly in South Kivu, 59% of the population reported cultivating crops (ibid). Of this,
41% cultivated on less than 2 hectares of land and 18% produced on more than 2 hectares. With regard to
livestock production, cattle ranching is common along DRC’s eastern border, though this activity is
typically reserved for wealthier households. Those smallholder farmers who own animals typically raise
smallstock (e.g., goats, guinea pigs, rabbits), in part because of limited access to the inputs and services
needed to support larger livestock, and in part because persistent conflict in these areas increases the risk
(theft, inability to access needed inputs, significant asset loss if forced to flee) of large livestock
production (Fintrac 2010). Together these constraints lead to high production costs, low farm incomes,
and ultimately, low levels of production. As a result, the majority of what is produced in North and South
Kivu and Katanga provinces is consumed and/or sold locally to generate income for the purchase of
additional food and/or non-food essentials.
As an example, cassava is a primary source of food and income across DRC. According to a MINAGRI
agricultural sector study, cassava accounts for more than 50% of the total cropped area in the country and
nearly 70% of the total national demand for food products (MINAGRI 2009). This is also true in the
Kivus and Katanga, where cassava and other tubers, such as sweet potatoes, provide a relatively cheap
and risk-tolerant source of dietary energy (tubers are more tolerant of environmental stresses and produce
relatively better yields in marginal soil). That said, poor growing conditions (limited land access and
persistent conflict), the limited application of improved practices, and the prevalence of crop-specific
diseases, such as CMD, contribute to suboptimal yields of this crop among smallholders. In addition, the
deteriorated state of the socioeconomic environment and physical infrastructure in these production areas
increases transaction costs (and ultimately, prices) associated with the crop. These increased costs and
prices lead to shifts in production and consumption patterns, and cause relatively ubiquitous cassava
products to be comparatively expensive (ibid). As a result, consumers who can access cheaply processed
and imported foods, such as rice, wheat, and maize flour substitute these for “local” cassava products.
16
This limits the profitability of cassava production and goes some way toward explaining farmers’ low
input use and traders’ lack of incentive to invest in value-added technologies for the crop.10
While cassava dominates cropped area and energy intake, banana plays an important role in income
generation among smallholders in some of the reviewed areas, such as South Kivu, where the crop
provides about 80% of income through sale in either its raw or processed (banana beer) form (Food for
the Hungry 2013). That said, local trade of this crop also suffers from a lack of production efficiencies
(e.g., rudimentary production techniques, its extended crop cycle compared to other crops, and limited
coordination among supply chain actors) and widespread disease outbreaks, such as BXW and BBTV.
In some FFP implementation areas groundnuts are the predominant cash crop (in Mubumbano, South
Kivu and Kalemie, north Katanga), while in other areas wheat is the primary cash crop (in Moba, north
Katanga). While groundnuts predominate in Kalemie (followed by rice and cassava), the Food for the
Hungry 2013 value chain analysis indicated that farmers in this area make more overall profit from rice
production, followed by groundnut and palm oil production. In Moba, wheat is the largest cash crop,
followed by groundnuts and palm oil, which are more profitable according to the research. In
Mubumbano, where the main cash crops are groundnuts (followed by maize, then cassava and potatoes),
the value chain analysis showed that bananas turned the highest profit, followed by sweet potatoes,
groundnuts, cassava, and then maize.
Another constraint to income generation from crop production is that the majority of people in eastern
DRC do not have access to formal or informal financial services (Mathys and Remancus 2010; WFP
2014). Such access is important, as it can facilitate household investments in productive activities and
offset and/or mitigate associated risks and potential unforeseen hazards, in addition to smoothing
households’ access to basic family needs during lean periods.
Given the importance of agricultural production for food and income and constraints to the production
and sale of crops, it is not surprising that significant portions of the population in these areas are food
insecure (57% of households in Katanga, 49% of households in North Kivu, and 64% of households in
South Kivu) (WFP 2014). In terms of sources of food, 68% and 66% of households in South and North
Kivu, respectively, reported sourcing their food primarily at the market. Households in Katanga rank
second to last in their reliance on the market as a primary source of food (33%) (ibid). However, Katanga
has high annual yields of cassava and maize, with an average production of 2.8 million metric tons per
year. As such, about 62% of food consumed in Katanga is sourced from households’ own production
(ibid). The relatively high reliance on markets as food sources in the Kivus is somewhat attributable to the
lower number of households cultivating in these areas and their relatively better access to regional
markets, as discussed more later. In addition, frequent exposure to conflict can significantly disrupt
production cycles, leading to higher reliance on markets for food. Furthermore, conflict can act as a
disincentive to engage beyond subsistence production (e.g., many households reported perceiving that
“profit attracts insecurity)” (Fintrac 2010; Rudolf 2014). As a 2014 study on the effects of the conflict in
North Kivu province found, “The continuous experience of expropriation and extortion has diminished
the readiness [of local populations] to plan or work for the long-term, and has led the affected population
to hide [or, in some cases, minimize] their capital in order to avoid being exposed. Production in rural
areas is often diminished to the minimum to avoid burglary and robbery” (Rudolf 2014, p. 32).
10 Most crops produced in the review areas—and by smallholder farmers in general—are minimally processed. Cassava, maize,
and wheat (where grown) are processed into flour and palm fruits are pressed into oil. Groundnut, rice, and sweet potatoes are not
processed, due in part to a lack of awareness of processing options for these products. Constraints to processing include lack of
materials and credit and market access to sell processed goods for an adequate return (Food for the Hungry 2013).
17
The impact of civil conflict on the current livelihoods and likely future income-earning potential of
populations in the reviewed areas is nearly ubiquitous and cannot be overstated. These impacts are further
worsened by reduced educational attainment in these areas (which is also affected by conflict).
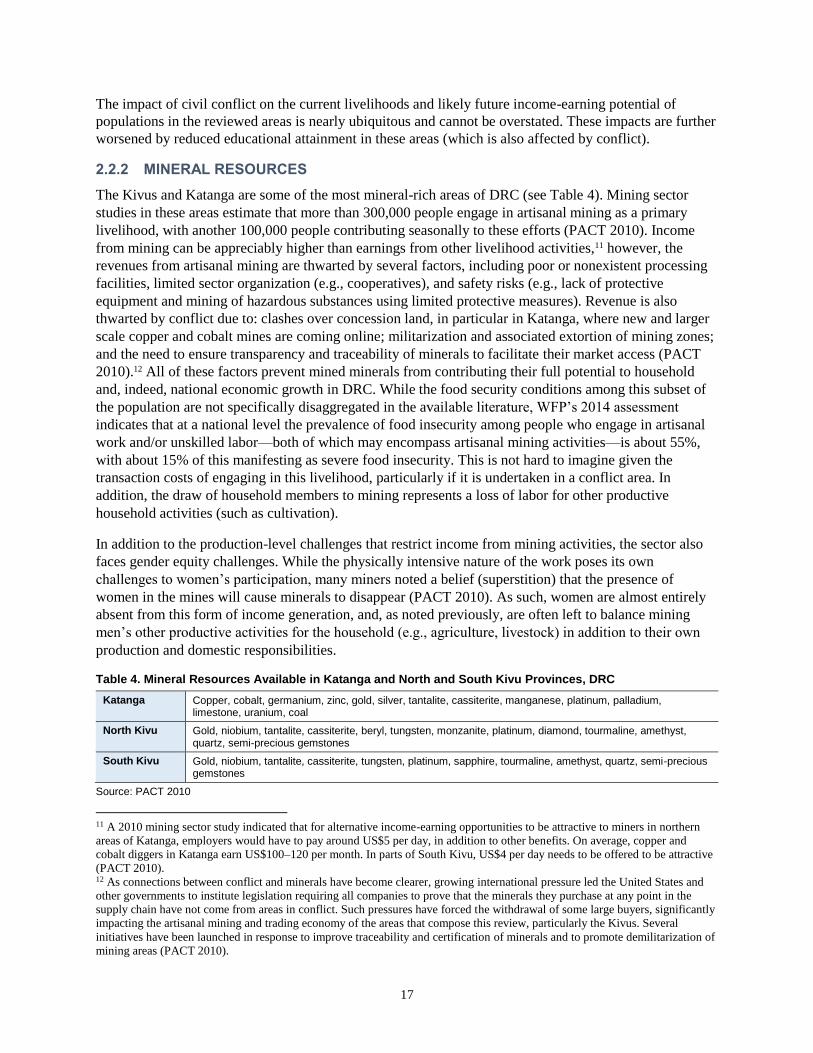
2.2.2 MINERAL RESOURCES
The Kivus and Katanga are some of the most mineral-rich areas of DRC (see Table 4). Mining sector
studies in these areas estimate that more than 300,000 people engage in artisanal mining as a primary
livelihood, with another 100,000 people contributing seasonally to these efforts (PACT 2010). Income
from mining can be appreciably higher than earnings from other livelihood activities,11 however, the
revenues from artisanal mining are thwarted by several factors, including poor or nonexistent processing
facilities, limited sector organization (e.g., cooperatives), and safety risks (e.g., lack of protective
equipment and mining of hazardous substances using limited protective measures). Revenue is also
thwarted by conflict due to: clashes over concession land, in particular in Katanga, where new and larger
scale copper and cobalt mines are coming online; militarization and associated extortion of mining zones;
and the need to ensure transparency and traceability of minerals to facilitate their market access (PACT
2010).12 All of these factors prevent mined minerals from contributing their full potential to household
and, indeed, national economic growth in DRC. While the food security conditions among this subset of
the population are not specifically disaggregated in the available literature, WFP’s 2014 assessment
indicates that at a national level the prevalence of food insecurity among people who engage in artisanal
work and/or unskilled labor—both of which may encompass artisanal mining activities—is about 55%,
with about 15% of this manifesting as severe food insecurity. This is not hard to imagine given the
transaction costs of engaging in this livelihood, particularly if it is undertaken in a conflict area. In
addition, the draw of household members to mining represents a loss of labor for other productive
household activities (such as cultivation).
In addition to the production-level challenges that restrict income from mining activities, the sector also
faces gender equity challenges. While the physically intensive nature of the work poses its own
challenges to women’s participation, many miners noted a belief (superstition) that the presence of
women in the mines will cause minerals to disappear (PACT 2010). As such, women are almost entirely
absent from this form of income generation, and, as noted previously, are often left to balance mining
men’s other productive activities for the household (e.g., agriculture, livestock) in addition to their own
production and domestic responsibilities.
Table 4. Mineral Resources Available in Katanga and North and South Kivu Provinces, DRC
Katanga Copper, cobalt, germanium, zinc, gold, silver, tantalite, cassiterite, manganese, platinum, palladium, limestone, uranium, coal
North Kivu Gold, niobium, tantalite, cassiterite, beryl, tungsten, monzanite, platinum, diamond, tourmaline, amethyst, quartz, semi-precious gemstones
South Kivu Gold, niobium, tantalite, cassiterite, tungsten, platinum, sapphire, tourmaline, amethyst, quartz, semi-precious gemstones
Source: PACT 2010
11 A 2010 mining sector study indicated that for alternative income-earning opportunities to be attractive to miners in northern
areas of Katanga, employers would have to pay around US$5 per day, in addition to other benefits. On average, copper and
cobalt diggers in Katanga earn US$100–120 per month. In parts of South Kivu, US$4 per day needs to be offered to be attractive
(PACT 2010). 12 As connections between conflict and minerals have become clearer, growing international pressure led the United States and
other governments to institute legislation requiring all companies to prove that the minerals they purchase at any point in the
supply chain have not come from areas in conflict. Such pressures have forced the withdrawal of some large buyers, significantly
impacting the artisanal mining and trading economy of the areas that compose this review, particularly the Kivus. Several
initiatives have been launched in response to improve traceability and certification of minerals and to promote demilitarization of
mining areas (PACT 2010).
18
2.2.3 MARKET FUNCTIONALITY AND INTEGRATION
For most smallholder-produced goods in rural DRC the supply chain is relatively short. Smallholder
farmers typically sell to rural assemblers either at the farm gate or at local markets (where they may also
sell directly to consumers). Rural assemblers in turn sell this product either to transporters (who are often
hired by urban wholesalers, the latter of which distribute transported goods to urban retailers or
commercial entities such as restaurants and hotels, or sell the produce directly to consumers) or rural
retailers (who tend to sell products directly to rural consumers) (Food for the Hungry 2013).
The major market in Katanga Province is the border market of Lubumbashi; in Tanganyika Province
specifically, Kalemie and Moba are important trade hubs (Murphy et al. 2004). The major markets in
North Kivu are the border market of Goma and the interior market of Butembo, and the major market in
South Kivu is the border market of Bukavu (ibid). Despite their size, limited transport infrastructure and
high levels of taxation/graft prevent the integration of these markets with those in other parts of DRC,
beyond those within relatively close geographic proximity. Instead, markets in Katanga Province tend to
be more closely linked to regional markets in Tanzania and Zambia; markets in North Kivu Province tend
toward integration with those in Rwanda and Uganda, and markets in South Kivu Province tend to be
more aligned with those in Burundi, Rwanda, and Tanzania, though transport options between the study
areas and these regional markets are limited, as discussed below (FEWS NET 2015a). Markets in the
reviewed areas face other significant constraints that contribute to their fractured nature, including civil
insecurity. As previously noted, this amalgamation of constraints not only negatively impacts access to
food in the short term, it acts as a disincentive to production, which limits food availability and access in
the longer term as well. For example, despite the increasing demand for rice in the country (consumption
of which rose 260% from 1975 to 2000), in particular in Kinshasa and environs, domestic rice from areas
in eastern DRC where this crop is grown, rarely reaches markets in Kinshasa or other western parts of the
country (Fintrac 2010; World Bank 2010). Instead, demand for this crop is filled through more easily
accessible (and cheaper) imports.
In addition to the poor condition of available transport infrastructure in eastern DRC, which makes
moving commodities within and between regions time consuming and expensive, the transport
infrastructure that is available is, itself, highly limited. In Katanga, for example, while several sections of
railway run through the province, only the section running from the Zambian border at Sakania to central
Katanga (at Kamina) appears to be in passable condition (Log Cluster 2013). About half of the section
running from Kalemie on Lake Tanganyika to Kamina is passable, and the remaining railway sections are
in “poor condition or complete disrepair” (ibid). While no functional railway runs through North or South
Kivu, part of the railway from Dar es Salaam to Kagoma, Tanzania, can serve portions of North and
South Kivu and Katanga, though this requires several additional hours of overland travel from Tanzania
into these areas (Log Cluster 2013; Murphy et al. 2004). Boat transport across and along Lake
Tanganyika, including among Molira, Moba, and Kalemie ports in Katanga and Mushimbake and
Kulundu ports in South Kivu, is also possible and some of these transport routes have been used by WFP
(Log Cluster 2013; FEWS NET 2015a; Murphy et al. 2004). Onward transport from these South Kivu
ports to Bukavu (or vice versa) is also facilitated by relatively good road infrastructure (FEWS NET
2015a). In addition, boat transport along Lake Kivu facilitates the movement of goods between North and
South Kivu, though port and overall transport facilities in North Kivu are in poorer condition relative to
those of South Kivu (ibid). Security risks (e.g., hijackings and theft) along roads also pose challenges,
though roads remain the primary (and sometimes only) method of transport for agricultural products in
the country, despite the fact that they are also limited and are often in a state of disrepair. For example,
North and South Kivu contain less than 5% of the paved and unpaved roads available across the country
(Observatoire National des Transports 2011). In Katanga, the roads outside of the area immediately
19
surrounding Lubumbashi are in poor condition and sometimes entirely impassable (FEWS NET 2015a).
The overall lack of infrastructure, its limited reliability, and high resultant transaction costs restrict the
scope of formal trade between and among the areas that compose this review and the rest of DRC. Known
formal agricultural trade flows are presented in Annex B.
While formal trade is limited, evidence indicates that informal inter-provincial and cross-border trade is
an important supplier of markets in these locations (Food for the Hungry 2013). Anecdotal evidence
suggests that thousands of tons of maize in its whole or processed form arrive in Katanga Province from
Zambia via informal channels annually.13 Dynamic informal trade of rice and beans (also from Zambia) is
also evident, though levels of informal trade fluctuate significantly, depending in part on factors such as
production levels, prevailing trade policy, and level of enforcement of police controls and border
crossings (FEWS NET and WFP 2012).14 Furthermore, DRC is infamous for its abundance of tax
collecting agencies. For example, nine state agencies tax agricultural products. There are formal taxes
collected by a road maintenance fund (Fond Entretien Routier or FONER). Informal taxes are collected
by the national army (FARDC); the national intelligence agency (Agence Nationale du Renseignement);
the traffic police (Police Circulation Routière); Transcom (the DRC’s transport authority); tourism
authorities; and the border police. In such an environment it is difficult for farmers and others in the value
chain to make a profit from the sale of their goods. Prohibitive taxation on off-farm income-generating
activities (many of which target women) has also impeded gains in this intervention area across the
current FFP development projects in eastern DRC.
2.2.4 GENDER, INCOME, AND ASSET OWNERSHIP
The majority of women across DRC and in the Kivus and Katanga reported earning less than their
spouses, according to the most recent DHS (see Table 5). In addition, less than 30% of women nationally
and 25% in the Kivus and Katanga reported having control over how to use their income. Importantly,
while 34% of women nationally reported participating in household decisions, less than 25% of women in
Katanga reported participating in household decisions in contrast with 45% in North Kivu and 51% in
South Kivu. Women’s decision-making power in Katanga is among the lowest of all the provinces,
indicating the extent to which gender inequality is entrenched in this province. While women in North
and South Kivu reported greater decision-making authority, even higher than the national average, overall
this still accounts for only half of all women in these two provinces. Women’s limited control over their
own income, their lack of participation in household decisions, and the extremely high fertility rate
directly impacts women’s control over food access and subsequently undermines their capacity to provide
optimal care to prevent stunting and other poor outcomes in their children.
While there is limited information on actual asset ownership by men and women, and the situation is
constantly changing due to instability, the 2013-14 DRC DHS survey provides some useful insights in
terms of reported asset ownership. At least half of women and men interviewed reported not owning a
house or land (see Table 5). In addition, the pattern of asset ownership at the national level is age-related,
13 The Famine Early Warning Systems Network’s (FEWS NET’s) Cross Border Trade Report for August 2012 reported cross-
border trade figures for maize from Zambia into DRC of close to 10,000 MT, with an additional estimated 1,900 MT devoted to
maize meal in the 2009/10 season. These figures increased to nearly 13,000 MT for maize and 1,500 MT for maize meal in
2010/11, and decreased to 9,700 MT for maize and 1,500 MT for maize meal in 2011/12. However, these figures are based on
trade seen at official border posts during specific times of day. It is assumed that actual trade flows are much greater (FEWS NET
2012; WFP 2014). 14 FEWS NET’s Staple Food Market Fundamentals for DRC indicates that, “the lack of infrastructure and capacity to prohibit
flows to bypass the formal border checkpoint at Kasumbalesa [Zambia], have encouraged the informal, unregulated flow of
almost all staple foods across the border, in small quantities (accounting for approximately 90 percent of all flows into the DRC
at this border point)” (FEWS NET 2015a, p.64).
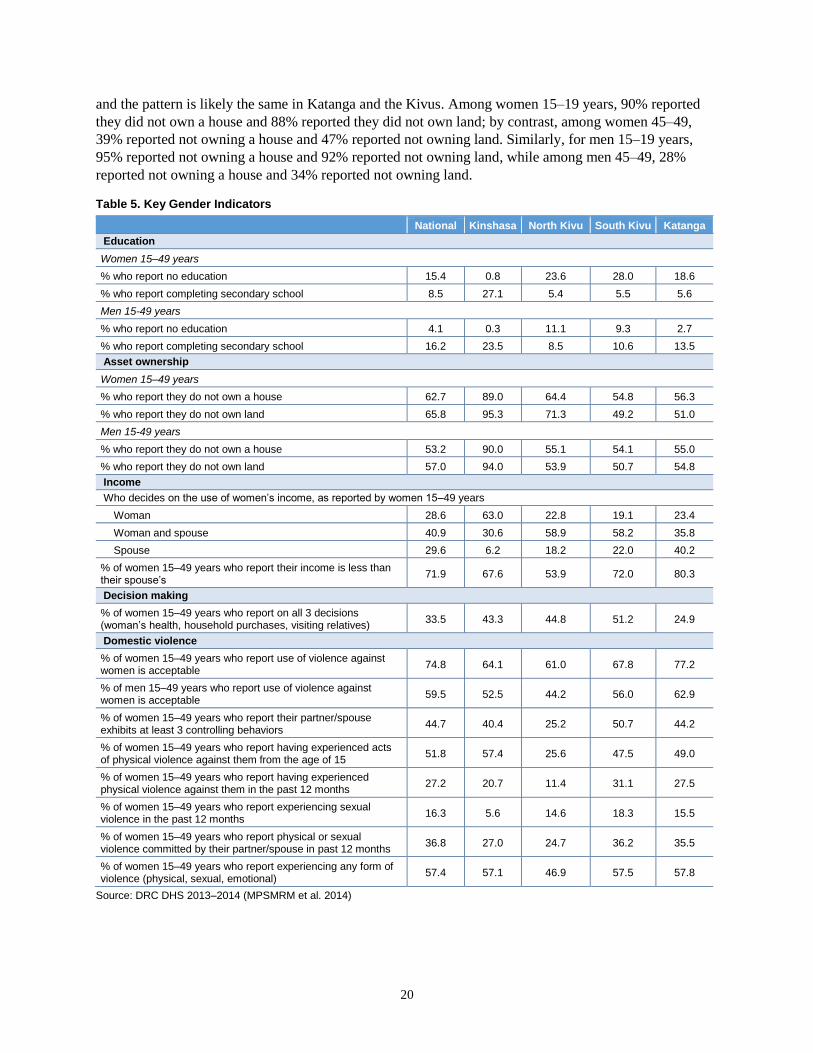
20
and the pattern is likely the same in Katanga and the Kivus. Among women 15–19 years, 90% reported
they did not own a house and 88% reported they did not own land; by contrast, among women 45–49,
39% reported not owning a house and 47% reported not owning land. Similarly, for men 15–19 years,
95% reported not owning a house and 92% reported not owning land, while among men 45–49, 28%
reported not owning a house and 34% reported not owning land.
Table 5. Key Gender Indicators
National Kinshasa North Kivu South Kivu Katanga
Education
Women 15–49 years
% who report no education 15.4 0.8 23.6 28.0 18.6
% who report completing secondary school 8.5 27.1 5.4 5.5 5.6
Men 15-49 years
% who report no education 4.1 0.3 11.1 9.3 2.7
% who report completing secondary school 16.2 23.5 8.5 10.6 13.5
Asset ownership
Women 15–49 years
% who report they do not own a house 62.7 89.0 64.4 54.8 56.3
% who report they do not own land 65.8 95.3 71.3 49.2 51.0
Men 15-49 years
% who report they do not own a house 53.2 90.0 55.1 54.1 55.0
% who report they do not own land 57.0 94.0 53.9 50.7 54.8
Income
Who decides on the use of women’s income, as reported by women 15–49 years
Woman 28.6 63.0 22.8 19.1 23.4
Woman and spouse 40.9 30.6 58.9 58.2 35.8
Spouse 29.6 6.2 18.2 22.0 40.2
% of women 15–49 years who report their income is less than their spouse’s
71.9 67.6 53.9 72.0 80.3
Decision making
% of women 15–49 years who report on all 3 decisions (woman’s health, household purchases, visiting relatives)
33.5 43.3 44.8 51.2 24.9
Domestic violence
% of women 15–49 years who report use of violence against women is acceptable
74.8 64.1 61.0 67.8 77.2
% of men 15–49 years who report use of violence against women is acceptable
59.5 52.5 44.2 56.0 62.9
% of women 15–49 years who report their partner/spouse exhibits at least 3 controlling behaviors
44.7 40.4 25.2 50.7 44.2
% of women 15–49 years who report having experienced acts of physical violence against them from the age of 15
51.8 57.4 25.6 47.5 49.0
% of women 15–49 years who report having experienced physical violence against them in the past 12 months
27.2 20.7 11.4 31.1 27.5
% of women 15–49 years who report experiencing sexual violence in the past 12 months
16.3 5.6 14.6 18.3 15.5
% of women 15–49 years who report physical or sexual violence committed by their partner/spouse in past 12 months
36.8 27.0 24.7 36.2 35.5
% of women 15–49 years who report experiencing any form of violence (physical, sexual, emotional)
57.4 57.1 46.9 57.5 57.8
Source: DRC DHS 2013–2014 (MPSMRM et al. 2014)
21
2.3 FOOD UTILIZATION AND HEALTH
2.3.1 CHILD HEALTH AND NUTRITIONAL STATUS
Trends in child health and nutritional status. The health and nutritional status of children in DRC have
historically been poor, and despite public health efforts in recent years, child health in DRC remains
suboptimal. (Table 6 provides data on child health and nutritional status nationally and in the three
provinces from the DRC 2013/14 DHS). The mortality rate for children under 5 years is 104 per 1,000
(MPSMRM et al. 2014), and it is the eighth-worst globally (UNICEF 2014). The under-5 mortality rates
in Katanga, South Kivu, and North Kivu are 121, 139, and 65 per 1,000, respectively (MPSMRM et al.
2014). The poor nutritional status of children under 5 is an important contributor to these high mortality
rates.
The prevalence of stunting, underweight, and wasting nationally is 43%, 23%, and 8% respectively. In
Katanga, South Kivu, and North Kivu, the prevalence of stunting exceeds national levels, at 45%, 53%,
and 52%, respectively (MPSMRM et al. 2014). Katanga’s wasting prevalence (8%) matches the national
prevalence. The wasting prevalence in North Kivu (5%) and South Kivu (7%) are a little lower. Looking
at historical trends, the prevalence of stunting in the Kivus has declined slightly from 2007 to 2013-14
and has remained the same in Katanga, while wasting has declined slightly in all three provinces (see
Figure 2).
Malnutrition among children under 5 in DRC often begins in utero due to poor maternal nutritional status.
At the national level, stunting and underweight begin to increase from 6–8 months, rising steadily until 2
years of age. This is also likely the case in the Kivus and Katanga provinces, suggesting that efforts to
improve complementary feeding practices in the first 2 years of life are crucial to prevent stunting and
underweight in this age range. In addition, the high infant mortality rates (41, 92, and 72 per 1,000,
respectively in North Kivu, South Kivu, and Katanga) point to the need for improved exclusive
breastfeeding practices in the first 6 months, a proven life-saving measure in infancy. The extent to which
mothers can provide optimum care in terms of improved infant and young child feeding practices is a
challenge in the Kivus and Katanga particularly given the exceedingly high total fertility rate (6.5 children
per woman in North Kivu, 7.7 in South Kivu, and 7.8 in Katanga). These high rates leave women
stretched in terms of household and caring responsibilities and result in limited time to provide children
with optimum care and feeding. Inadequate hygiene practices and lack of sanitation facilities are also key
contributors to stunting in this context. As such the three key determinants of stunting are the high
fertility rates, poor infant and young child feeding practices, and inadequate hygiene practices and lack of
sanitation facilities.
In 2002, DRC adopted a national nutrition policy to help end the deterioration of its nutritional situation.
This policy, updated in 2013, provides broad guidelines to combat all forms of malnutrition. Based on the
policy, the national nutrition program (Programme National de Nutrition or PRONANUT) first developed
a 5-year nutrition plan (2001–2005), then a 3-year plan in 2006, and finally a 2009–2015 plan that
outlines priority interventions, specific objectives, monitoring and evaluation indicators and targets, and a
budget (PRONANUT 2008). The interventions in the latest plan are consistent with international
recommendations for addressing malnutrition.
22
Micronutrients. Anemia, which influences a child’s brain development and school performance, is still
highly prevalent in children under 5 in DRC (60%) and is alarmingly high among children 6–8 months of
age (76.4%) (MPSMRM et al. 2014). Interestingly, in North and South Kivu, the anemia prevalence in
children under 5 is not as high as in the rest of the country (34% and 36%, respectively), however it is
high (60%) in Katanga. Iron deficiency is a major contributor to anemia in children under 5 and
micronutrient supplements such as sprinkles do not appear to be available nationally nor within the Kivus
and Katanga (MPSMRM et al. 2014). Malaria and hookworm, which are prevalent in the Kivus and
Katanga, are also significant contributors to the anemia prevalence. In North and South Kivu, 66% and
74% of children under 5, respectively, received deworming tablets in the past 6 months, but only 43% of
children in Katanga received them.
Coverage of vitamin A supplementation, an important public health measure to mitigate vitamin A
deficiency, is 85%, 84%, and 65% in children under the age of 5 in North Kivu, South Kivu, and Katanga,
respectively, compared to the national coverage of 70%. Earlier studies seem to suggest that while
vitamin A deficiency is prevalent nationally (affecting approximately 10% of the population), it is not as
prevalent in Katanga (affecting approximately 7% of the population) and is more prevalent in North and
South Kivu (affecting approximately 12% and 15% of the population, respectively) (Ulimwengu et al.
2012). Nonetheless, children 6–23 months in all three provinces seem to consume vitamin A-rich foods at
a relatively high rate, comparable to the national average of 82%.
The majority of children live in households consuming iodized salt. Based on this information alone, it is
difficult to draw conclusions on the extent of iodine deficiency in children, as the quality of iodization in
the salt consumed by these households is unknown and it is also unknown whether children consume
adequate quantities.
Infant and young child feeding. While almost every child in DRC is breastfed (98%), only 48% of
mothers exclusively breastfeed their children nationally, the median duration of exclusive breastfeeding is
only 3.6 months, and just over half of infants (52%) are put to the breast within an hour of birth.
Breastfeeding practices are not ideal in North Kivu, South Kivu, and especially in Katanga where the
median durations of exclusive breastfeeding are 5.2 months, 3.6 months, and 1.1 months, respectively
(MPSMRM et al. 2014). There is an alarmingly low prevalence of exclusive breastfeeding until 6 months
of age in these provinces (58% in North Kivu, 39% in South Kivu, and only 31% in Katanga according to
the 2010 Multiple Indicator Cluster Survey [MICS] [INS and UNICEF 2011]).
The diet quality of infants and young children in the three focus provinces is far from adequate.
Nationally, 48% of children 6–23 months consume cereal-based foods, and 66% of children 6–23 months
consume vitamin A-rich fruits and vegetables, but only 47% consume meat or fish, 9% consume eggs,
and 1% consume dairy products, indicating a low protein intake (MPSMRM et al. 2014). In North Kivu,
24% of infants and young children have the minimum recommended diet diversity, 43% have the
Summary of DRC’s National Nutrition Policy
The goal of DRC’s national nutrition policy is to guarantee a productive human capital through the population’s adequate nutritional status, for the development of the country. The guiding principles of the plan include: leadership by the government, decentralization, the integration of nutrition-specific and nutrition-sensitive interventions, accountability by local communities, inter-sectoral collaboration, the principle of equity, ethical delivery and monitoring of services, gender consideration, management transparency, partnerships, coordination, and sustainability. It is built around two main axes: (1) nutrition-specific interventions, separately listed for infants 0-23 months and 24-59 months, children 6-19 years, women of reproductive age, and pregnant and lactating women, and (2) nutrition-sensitive interventions involving the sectors of food security; water, sanitation, and hygiene; education; and others. It outlines the institutions involved in operationalizing the policy with specific roles and responsibilities clearly defined.
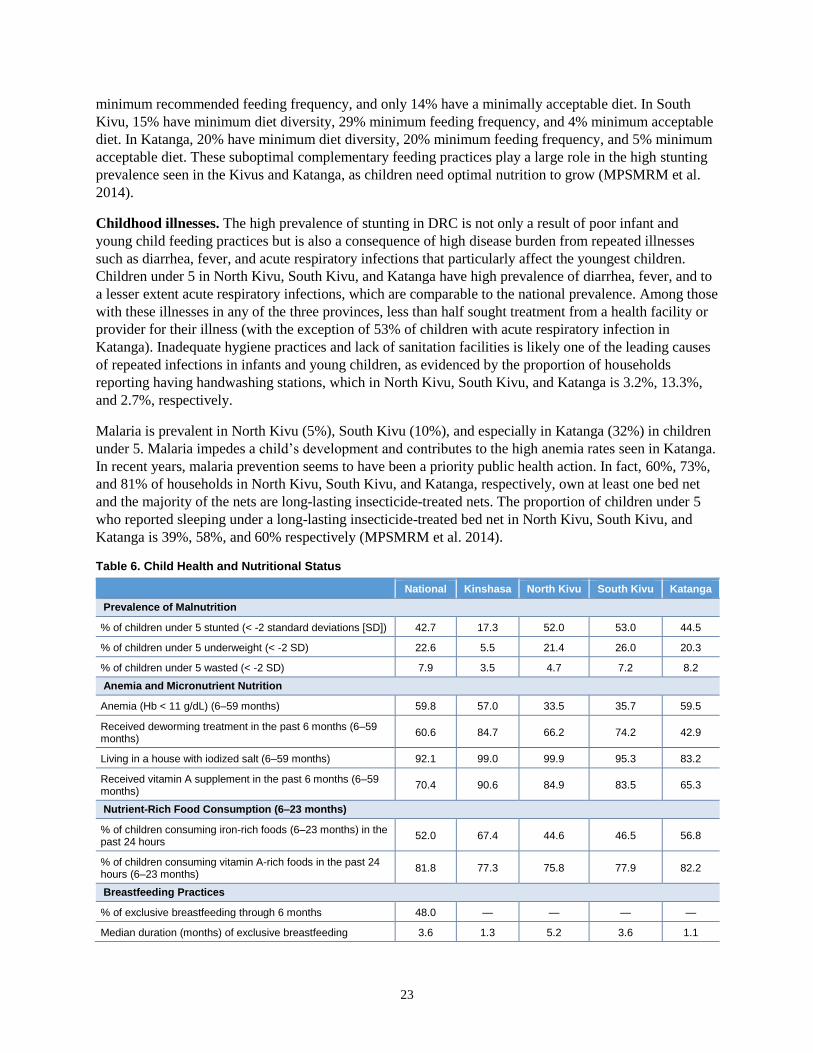
23
minimum recommended feeding frequency, and only 14% have a minimally acceptable diet. In South
Kivu, 15% have minimum diet diversity, 29% minimum feeding frequency, and 4% minimum acceptable
diet. In Katanga, 20% have minimum diet diversity, 20% minimum feeding frequency, and 5% minimum
acceptable diet. These suboptimal complementary feeding practices play a large role in the high stunting
prevalence seen in the Kivus and Katanga, as children need optimal nutrition to grow (MPSMRM et al.
2014).
Childhood illnesses. The high prevalence of stunting in DRC is not only a result of poor infant and
young child feeding practices but is also a consequence of high disease burden from repeated illnesses
such as diarrhea, fever, and acute respiratory infections that particularly affect the youngest children.
Children under 5 in North Kivu, South Kivu, and Katanga have high prevalence of diarrhea, fever, and to
a lesser extent acute respiratory infections, which are comparable to the national prevalence. Among those
with these illnesses in any of the three provinces, less than half sought treatment from a health facility or
provider for their illness (with the exception of 53% of children with acute respiratory infection in
Katanga). Inadequate hygiene practices and lack of sanitation facilities is likely one of the leading causes
of repeated infections in infants and young children, as evidenced by the proportion of households
reporting having handwashing stations, which in North Kivu, South Kivu, and Katanga is 3.2%, 13.3%,
and 2.7%, respectively.
Malaria is prevalent in North Kivu (5%), South Kivu (10%), and especially in Katanga (32%) in children
under 5. Malaria impedes a child’s development and contributes to the high anemia rates seen in Katanga.
In recent years, malaria prevention seems to have been a priority public health action. In fact, 60%, 73%,
and 81% of households in North Kivu, South Kivu, and Katanga, respectively, own at least one bed net
and the majority of the nets are long-lasting insecticide-treated nets. The proportion of children under 5
who reported sleeping under a long-lasting insecticide-treated bed net in North Kivu, South Kivu, and
Katanga is 39%, 58%, and 60% respectively (MPSMRM et al. 2014).
Table 6. Child Health and Nutritional Status
National Kinshasa North Kivu South Kivu Katanga
Prevalence of Malnutrition
% of children under 5 stunted (< -2 standard deviations [SD]) 42.7 17.3 52.0 53.0 44.5
% of children under 5 underweight (< -2 SD) 22.6 5.5 21.4 26.0 20.3
% of children under 5 wasted (< -2 SD) 7.9 3.5 4.7 7.2 8.2
Anemia and Micronutrient Nutrition
Anemia (Hb < 11 g/dL) (6–59 months) 59.8 57.0 33.5 35.7 59.5
Received deworming treatment in the past 6 months (6–59 months)
60.6 84.7 66.2 74.2 42.9
Living in a house with iodized salt (6–59 months) 92.1 99.0 99.9 95.3 83.2
Received vitamin A supplement in the past 6 months (6–59 months)
70.4 90.6 84.9 83.5 65.3
Nutrient-Rich Food Consumption (6–23 months)
% of children consuming iron-rich foods (6–23 months) in the past 24 hours
52.0 67.4 44.6 46.5 56.8
% of children consuming vitamin A-rich foods in the past 24 hours (6–23 months)
81.8 77.3 75.8 77.9 82.2
Breastfeeding Practices
% of exclusive breastfeeding through 6 months 48.0 — — — —
Median duration (months) of exclusive breastfeeding 3.6 1.3 5.2 3.6 1.1
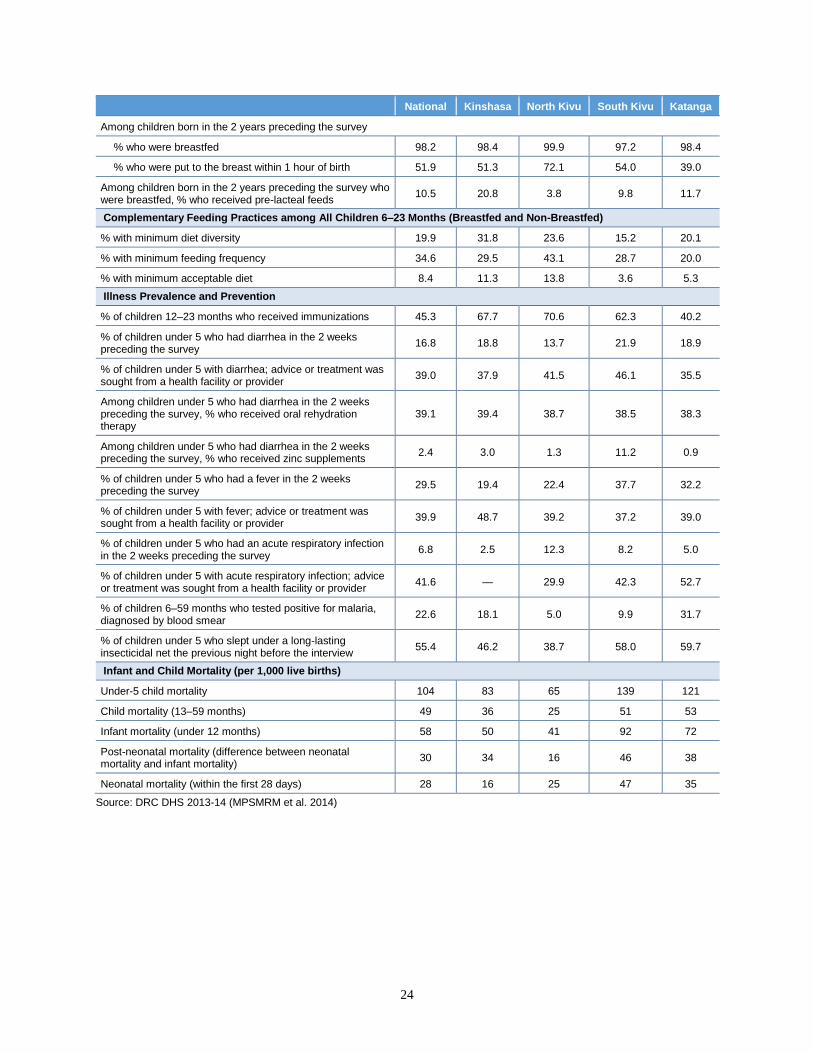
24
National Kinshasa North Kivu South Kivu Katanga
Among children born in the 2 years preceding the survey
% who were breastfed 98.2 98.4 99.9 97.2 98.4
% who were put to the breast within 1 hour of birth 51.9 51.3 72.1 54.0 39.0
Among children born in the 2 years preceding the survey who were breastfed, % who received pre-lacteal feeds
10.5 20.8 3.8 9.8 11.7
Complementary Feeding Practices among All Children 6–23 Months (Breastfed and Non-Breastfed)
% with minimum diet diversity 19.9 31.8 23.6 15.2 20.1
% with minimum feeding frequency 34.6 29.5 43.1 28.7 20.0
% with minimum acceptable diet 8.4 11.3 13.8 3.6 5.3
Illness Prevalence and Prevention
% of children 12–23 months who received immunizations 45.3 67.7 70.6 62.3 40.2
% of children under 5 who had diarrhea in the 2 weeks preceding the survey
16.8 18.8 13.7 21.9 18.9
% of children under 5 with diarrhea; advice or treatment was sought from a health facility or provider
39.0 37.9 41.5 46.1 35.5
Among children under 5 who had diarrhea in the 2 weeks preceding the survey, % who received oral rehydration therapy
39.1 39.4 38.7 38.5 38.3
Among children under 5 who had diarrhea in the 2 weeks preceding the survey, % who received zinc supplements
2.4 3.0 1.3 11.2 0.9
% of children under 5 who had a fever in the 2 weeks preceding the survey
29.5 19.4 22.4 37.7 32.2
% of children under 5 with fever; advice or treatment was sought from a health facility or provider
39.9 48.7 39.2 37.2 39.0
% of children under 5 who had an acute respiratory infection in the 2 weeks preceding the survey
6.8 2.5 12.3 8.2 5.0
% of children under 5 with acute respiratory infection; advice or treatment was sought from a health facility or provider
41.6 — 29.9 42.3 52.7
% of children 6–59 months who tested positive for malaria, diagnosed by blood smear
22.6 18.1 5.0 9.9 31.7
% of children under 5 who slept under a long-lasting insecticidal net the previous night before the interview
55.4 46.2 38.7 58.0 59.7
Infant and Child Mortality (per 1,000 live births)
Under-5 child mortality 104 83 65 139 121
Child mortality (13–59 months) 49 36 25 51 53
Infant mortality (under 12 months) 58 50 41 92 72
Post-neonatal mortality (difference between neonatal mortality and infant mortality)
30 34 16 46 38
Neonatal mortality (within the first 28 days) 28 16 25 47 35
Source: DRC DHS 2013-14 (MPSMRM et al. 2014)
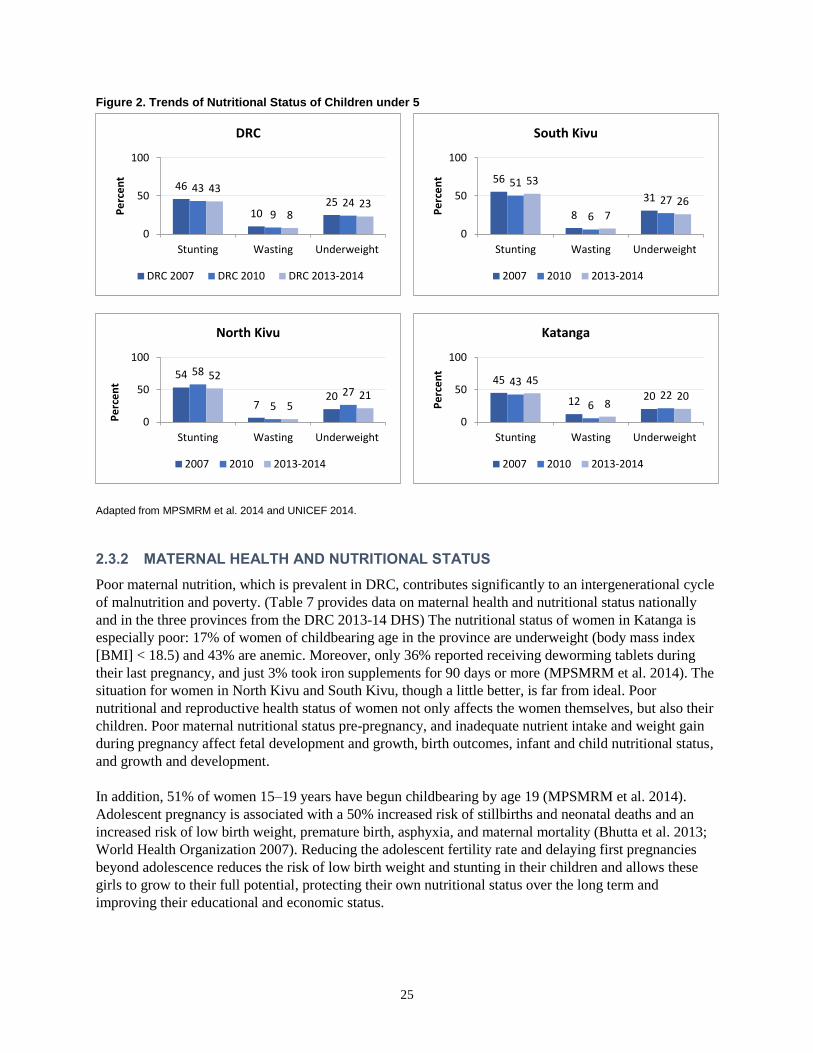
25
Adapted from MPSMRM et al. 2014 and UNICEF 2014.
2.3.2 MATERNAL HEALTH AND NUTRITIONAL STATUS
Poor maternal nutrition, which is prevalent in DRC, contributes significantly to an intergenerational cycle
of malnutrition and poverty. (Table 7 provides data on maternal health and nutritional status nationally
and in the three provinces from the DRC 2013-14 DHS) The nutritional status of women in Katanga is
especially poor: 17% of women of childbearing age in the province are underweight (body mass index
[BMI] < 18.5) and 43% are anemic. Moreover, only 36% reported receiving deworming tablets during
their last pregnancy, and just 3% took iron supplements for 90 days or more (MPSMRM et al. 2014). The
situation for women in North Kivu and South Kivu, though a little better, is far from ideal. Poor
nutritional and reproductive health status of women not only affects the women themselves, but also their
children. Poor maternal nutritional status pre-pregnancy, and inadequate nutrient intake and weight gain
during pregnancy affect fetal development and growth, birth outcomes, infant and child nutritional status,
and growth and development.
In addition, 51% of women 15–19 years have begun childbearing by age 19 (MPSMRM et al. 2014).
Adolescent pregnancy is associated with a 50% increased risk of stillbirths and neonatal deaths and an
increased risk of low birth weight, premature birth, asphyxia, and maternal mortality (Bhutta et al. 2013;
World Health Organization 2007). Reducing the adolescent fertility rate and delaying first pregnancies
beyond adolescence reduces the risk of low birth weight and stunting in their children and allows these
girls to grow to their full potential, protecting their own nutritional status over the long term and
improving their educational and economic status.
Figure 2. Trends of Nutritional Status of Children under 5
46
1025
43
924
43
823
0
50
100
Stunting Wasting Underweight
Pe
rce
nt
DRC
DRC 2007 DRC 2010 DRC 2013-2014
56
8
31
51
6
27
53
726
0
50
100
Stunting Wasting Underweight
Pe
rce
nt
South Kivu
2007 2010 2013-2014
54
720
58
527
52
521
0
50
100
Stunting Wasting Underweight
Pe
rce
nt
North Kivu
2007 2010 2013-2014
45
12 2043
622
45
820
0
50
100
Stunting Wasting UnderweightP
erc
en
t
Katanga
2007 2010 2013-2014
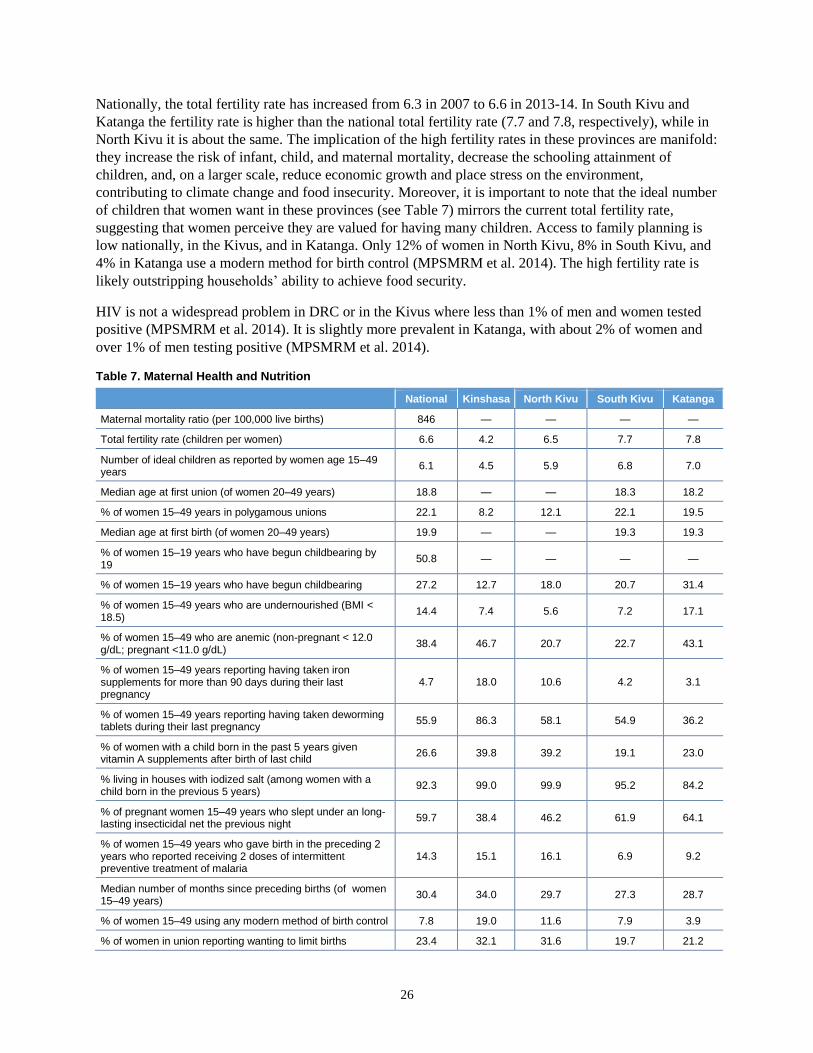
26
Nationally, the total fertility rate has increased from 6.3 in 2007 to 6.6 in 2013-14. In South Kivu and
Katanga the fertility rate is higher than the national total fertility rate (7.7 and 7.8, respectively), while in
North Kivu it is about the same. The implication of the high fertility rates in these provinces are manifold:
they increase the risk of infant, child, and maternal mortality, decrease the schooling attainment of
children, and, on a larger scale, reduce economic growth and place stress on the environment,
contributing to climate change and food insecurity. Moreover, it is important to note that the ideal number
of children that women want in these provinces (see Table 7) mirrors the current total fertility rate,
suggesting that women perceive they are valued for having many children. Access to family planning is
low nationally, in the Kivus, and in Katanga. Only 12% of women in North Kivu, 8% in South Kivu, and
4% in Katanga use a modern method for birth control (MPSMRM et al. 2014). The high fertility rate is
likely outstripping households’ ability to achieve food security.
HIV is not a widespread problem in DRC or in the Kivus where less than 1% of men and women tested
positive (MPSMRM et al. 2014). It is slightly more prevalent in Katanga, with about 2% of women and
over 1% of men testing positive (MPSMRM et al. 2014).
Table 7. Maternal Health and Nutrition
National Kinshasa North Kivu South Kivu Katanga
Maternal mortality ratio (per 100,000 live births) 846 — — — —
Total fertility rate (children per women) 6.6 4.2 6.5 7.7 7.8
Number of ideal children as reported by women age 15–49 years
6.1 4.5 5.9 6.8 7.0
Median age at first union (of women 20–49 years) 18.8 — — 18.3 18.2
% of women 15–49 years in polygamous unions 22.1 8.2 12.1 22.1 19.5
Median age at first birth (of women 20–49 years) 19.9 — — 19.3 19.3
% of women 15–19 years who have begun childbearing by 19
50.8 — — — —
% of women 15–19 years who have begun childbearing 27.2 12.7 18.0 20.7 31.4
% of women 15–49 years who are undernourished (BMI < 18.5)
14.4 7.4 5.6 7.2 17.1
% of women 15–49 who are anemic (non-pregnant < 12.0 g/dL; pregnant <11.0 g/dL)
38.4 46.7 20.7 22.7 43.1
% of women 15–49 years reporting having taken iron supplements for more than 90 days during their last pregnancy
4.7 18.0 10.6 4.2 3.1
% of women 15–49 years reporting having taken deworming tablets during their last pregnancy
55.9 86.3 58.1 54.9 36.2
% of women with a child born in the past 5 years given vitamin A supplements after birth of last child
26.6 39.8 39.2 19.1 23.0
% living in houses with iodized salt (among women with a child born in the previous 5 years)
92.3 99.0 99.9 95.2 84.2
% of pregnant women 15–49 years who slept under an long-lasting insecticidal net the previous night
59.7 38.4 46.2 61.9 64.1
% of women 15–49 years who gave birth in the preceding 2 years who reported receiving 2 doses of intermittent preventive treatment of malaria
14.3 15.1 16.1 6.9 9.2
Median number of months since preceding births (of women 15–49 years)
30.4 34.0 29.7 27.3 28.7
% of women 15–49 using any modern method of birth control 7.8 19.0 11.6 7.9 3.9
% of women in union reporting wanting to limit births 23.4 32.1 31.6 19.7 21.2
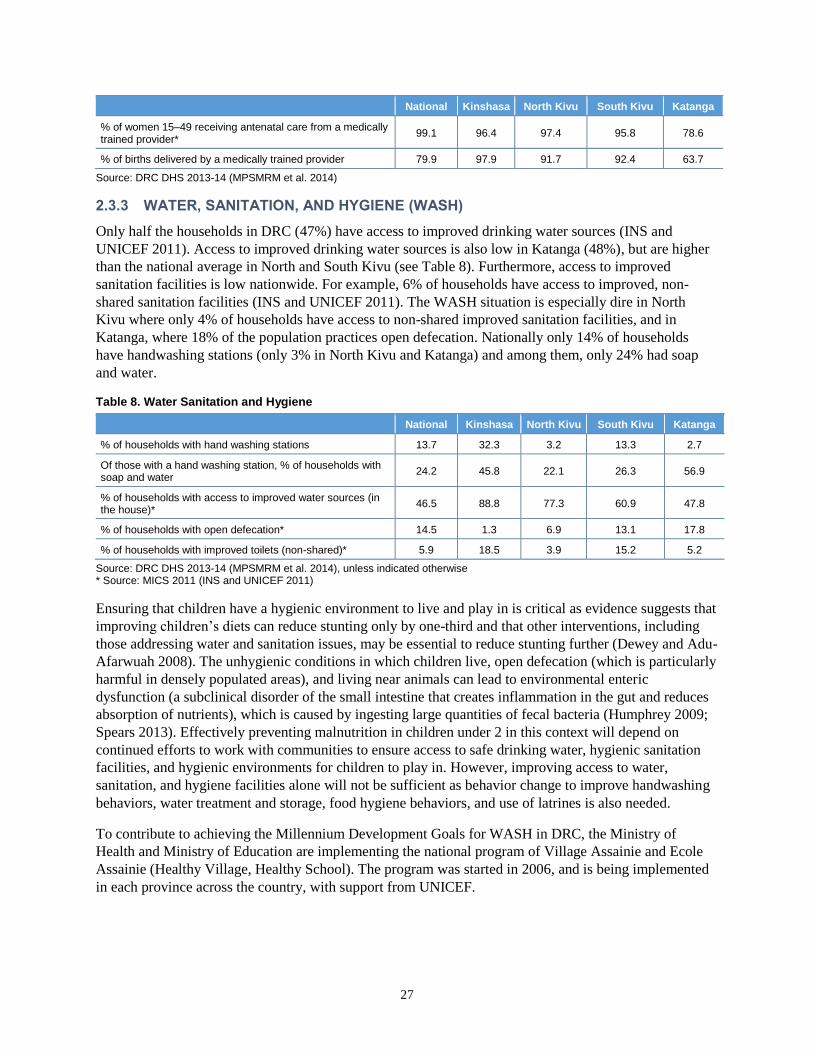
27
National Kinshasa North Kivu South Kivu Katanga
% of women 15–49 receiving antenatal care from a medically trained provider*
99.1 96.4 97.4 95.8 78.6
% of births delivered by a medically trained provider 79.9 97.9 91.7 92.4 63.7
Source: DRC DHS 2013-14 (MPSMRM et al. 2014)
2.3.3 WATER, SANITATION, AND HYGIENE (WASH)
Only half the households in DRC (47%) have access to improved drinking water sources (INS and
UNICEF 2011). Access to improved drinking water sources is also low in Katanga (48%), but are higher
than the national average in North and South Kivu (see Table 8). Furthermore, access to improved
sanitation facilities is low nationwide. For example, 6% of households have access to improved, non-
shared sanitation facilities (INS and UNICEF 2011). The WASH situation is especially dire in North
Kivu where only 4% of households have access to non-shared improved sanitation facilities, and in
Katanga, where 18% of the population practices open defecation. Nationally only 14% of households
have handwashing stations (only 3% in North Kivu and Katanga) and among them, only 24% had soap
and water.
Table 8. Water Sanitation and Hygiene
National Kinshasa North Kivu South Kivu Katanga
% of households with hand washing stations 13.7 32.3 3.2 13.3 2.7
Of those with a hand washing station, % of households with soap and water
24.2 45.8 22.1 26.3 56.9
% of households with access to improved water sources (in the house)*
46.5 88.8 77.3 60.9 47.8
% of households with open defecation* 14.5 1.3 6.9 13.1 17.8
% of households with improved toilets (non-shared)* 5.9 18.5 3.9 15.2 5.2
Source: DRC DHS 2013-14 (MPSMRM et al. 2014), unless indicated otherwise * Source: MICS 2011 (INS and UNICEF 2011)
Ensuring that children have a hygienic environment to live and play in is critical as evidence suggests that
improving children’s diets can reduce stunting only by one-third and that other interventions, including
those addressing water and sanitation issues, may be essential to reduce stunting further (Dewey and Adu-
Afarwuah 2008). The unhygienic conditions in which children live, open defecation (which is particularly
harmful in densely populated areas), and living near animals can lead to environmental enteric
dysfunction (a subclinical disorder of the small intestine that creates inflammation in the gut and reduces
absorption of nutrients), which is caused by ingesting large quantities of fecal bacteria (Humphrey 2009;
Spears 2013). Effectively preventing malnutrition in children under 2 in this context will depend on
continued efforts to work with communities to ensure access to safe drinking water, hygienic sanitation
facilities, and hygienic environments for children to play in. However, improving access to water,
sanitation, and hygiene facilities alone will not be sufficient as behavior change to improve handwashing
behaviors, water treatment and storage, food hygiene behaviors, and use of latrines is also needed.
To contribute to achieving the Millennium Development Goals for WASH in DRC, the Ministry of
Health and Ministry of Education are implementing the national program of Village Assainie and Ecole
Assainie (Healthy Village, Healthy School). The program was started in 2006, and is being implemented
in each province across the country, with support from UNICEF.
28
2.3.4 HEALTH CARE SYSTEM AND ACCESS
Addressing the pressing health needs of mothers and children in the Kivus and Katanga is a challenging
task. According to the 2011–2015 national health plan, North Kivu is divided into four health districts,
with a total of 34 health zones, South Kivu is divided into five health districts and a total of 34 health
zones, while Katanga is divided into seven health districts and 67 health zones (Ministère de la Santé
Publique 2010). Each health zone is further divided into aires de santé, which are each supposed to have a
fully functioning primary health care center. However, the health system in the provinces suffers from
major constraints, including a heavy disease and malnutrition burden, poor health infrastructure, frequent
stock-outs of medicines and other pharmaceuticals (sometimes longer than 6 months) in public health
facilities, a lack of health promotional materials, a lack of transportation and other logistics to reach rural
populations, and health staff’s need for training to bring them up to speed with the latest medical
developments and to allow them to address the nutritional care needs of the population they are serving.
2.3.5 GENDER AND NUTRITION
Gender inequality is pervasive in DRC and is a significant underlying factor that exacerbates food
insecurity and malnutrition. One of the clearest manifestations of this relationship is, as noted previously,
the high fertility rate which reflects how women are valued, and the prevalence of early marriage and
adolescent pregnancy among girls 15–19 years, all of which reflect prevailing gender norms that
discriminate against women and girls and contribute significantly to chronic undernutrition in their
children. Nationally, about 13% of women are married by the age of 19 compared to only 1% of men;
however 51% of women begin childbearing by 19 years of age (MPSMRM et al. 2014). In many respects
the gender issues that exist nationally are magnified further in the Kivus and Katanga; in almost every
instance, gender indicators for Katanga are worse compared to other provinces and the whole nation (see
Table 5).
Gender inequality is reflected in several other key indicators. Maternal education is a key indicator of
women’s empowerment and children are less likely to be stunted if their mother had secondary education
or higher compared to no education. According to the 2013-14 DHS, 15% of women 15–49 years
(compared to 4% of men 15–49) in DRC have no education. This is even more severe in North Kivu,
South Kivu, and Katanga, where 24%, 28%, and 19% of women, respectively, have no education and
only a very small proportion has secondary education (MPSMRM et al. 2014).
Domestic violence is widely prevalent in DRC. Over half of women 15–49 years of age (52%) have
suffered physical violence at some point in their lives after the age of 15 and 27% in the past 12 months;
in the majority of cases, the violence was perpetrated by their husbands/partners (MPSMRM et al. 2014).
In North Kivu, 26% of women reported having been victims of physical violence, in South Kivu, 48%,
and in Katanga, 49%. Sexual violence is also common, with 15% of women in North Kivu, 18% in South
Kivu, and 16% of women in Katanga reported having experienced it in the past 12 months (MPSMRM et
al. 2014). This reflects how deeply entrenched gender inequality and violence against women are across
DRC. Many women have virtually no control over aspects of their lives such as sexuality, fertility,
income, and household decision-making power—all of which affect the number of children they have,
their ability to both provide and care for them well, and ultimately their children’s nutritional status.
2.4 SHOCKS, COPING CAPACITY, AND RESILIENCE
While conflict is a predominating shock in the areas reviewed, it is by no means the only hazard to which
populations are exposed. At a national level, the most common shocks reported by households were more
idiosyncratic in nature, such as serious illness and death of a household member, which was reported by
nearly 40% and 20% of households, respectively (WFP 2014). Following this were more covariate
29
shocks, such as irregular rains, crop pests and disease, low (farm gate) prices for crops, high (retail) prices
for food, livestock disease, and insecurity/conflict and associated population displacement—each of
which affected less than 10% of households nationally (ibid). Given the high prevalence of conflict and
insecurity in the areas reviewed, their rankings of shock exposure vary from national trends, though many
of the same non-conflict-related shocks are present (Fintrac 2010).
At a national level, households noted employing a number of strategies to deal with these shocks,
including: consuming seed stock (about 32% of households), relying on income from casual labor to
access food or going an entire day without eating (about 27%), harvesting more than usual and consuming
crops intended to be saved for the following season (about 25%), and reducing expenditures on livelihood
inputs (e.g., seeds, tools) (about 18%) (WFP 2014).
In addition to the shocks listed above, eastern DRC is at a high risk of other natural disasters, including
geologic shocks such as earthquakes (reported in 2005 and 2008) and volcanic eruptions from mounts
Nyiragongo and Nyamulagira (reported in 2002, 2006, 2010, 2011, and 2014), both of which have the
potential to trigger the release of previously noted toxic gases from Lake Kivu (Mathys and Remancus
2010; Volcano Discovery). While such shocks would not necessarily directly impact the areas reviewed,
at a significant enough magnitude, they have the potential to disrupt economic activities in and around
major area trade hubs, such as Goma, further compromising food availability and access.
Household capacity to respond to shock varies between the Kivus and Katanga. WFP recently assessed
nationwide coping strategies related to a household’s ability to access food during times of stress (WFP
2014). The assessment’s Coping Strategy Index (CSI) used weighted values to determine the severity of
the coping strategies employed, such as reducing the number of meals per day, consuming seed stock for
the following season, relying upon casual labor, etc. A high CSI score often reflects heightened exposure
to food insecurity and limited resilience. Households in Katanga had the worst CSI scores in DRC.
Households from North and South Kivu also showed relatively poor coping capacity, with CSI scores
slightly worse than the national average for rural inhabitants.
30
3. LESSONS LEARNED
FFP supports three development food assistance projects in DRC. These projects started in 2011 and
continue until 2016, and are implemented by ADRA, Food for the Hungry, and Mercy Corps in South
Kivu, South Kivu and Katanga, and North Kivu provinces, respectively. Given the volatile and
unpredictable security conditions in the Kivus, Mercy Corps was required to change a portion of their
project intervention sites in North Kivu. ADRA and Food for the Hungry have occasionally withdrawn
staff for extended periods due to insecurity in their intervention areas, however they have not been
required to permanently cease work in any of their original intervention zones. The projects’ strategic
objectives and activities are summarized in Annex C.
ADRA’s JENGA JAMAA II is a $50 million, 5-year FFP development food assistance project being
implemented with consortium partners World Vision and Johns Hopkins University. JENGA II follows
on from JENGA, which was implemented from 2008–2010 in Fizi and Uvira territories in South Kivu.
The goal of JENGA II is to sustainably reduce food insecurity among vulnerable households in Fizi,
Uvira, and Kalehe territories of South Kivu Province. JENGA II aims to reach over 250,000 people
during the life of the project.
Budgeted at about $48 million, Food for the Hungry’s 5-year FFP development project targets nearly
669,000 people in the territories of Kalémie and Moba in Katanga Province and Walungu in South Kivu
Province. The project covers sectors including agriculture and natural resources management, health and
nutrition, water and sanitation, and access to credit. Community capacity strengthening and gender
mainstreaming are cross-cutting themes. The project’s overall goal is to reduce food insecurity of
vulnerable households in the targeted areas.
Mercy Corps, in partnership with Catholic Relief Services is implementing the 5-year Resources to
Improve Food Security in Eastern DRC (RISE or SIMAMA in Swahili) FFP development project with an
estimated budget of about $25 million. The project aims to ensure that 370,000 vulnerable households and
communities in North Kivu build and sustain their food security by improving agricultural production,
increasing household incomes, and preventing childhood malnutrition. SIMAMA will build communities’
resilience to shocks by encouraging the adoption of sustainable coping mechanisms. The project includes
a substantial focus on good governance to facilitate the likelihood that project results are sustained.
SIMAMA originally targeted five Health Zones (HZ) in North Kivu, four in Rutshuru Territory (Rutshuru,
Rwanguba, Binza, and Birambizo) and one in Nyiragongo Territory (Karisimbi). In 2013, insecurity as a
result of M23 rebel activities in the Rutshuru area led Mercy Corps to scale down activities in Rwanguba,
Binza, and Rutshuru HZs in Rutshuru Territory and Karisimbi HZ in Nyiragongo Territory. All activities
in these areas were closed except for a final season of: seed multiplication, support to women and youth
associations, and follow-up with village savings and loan associations.
Methods and structure for identifying key lessons learned. The lessons learned presented here are
informed by a comprehensive review of each project’s design, implementation, and monitoring
documents, including project applications, annual reports, midterm evaluations, and complementary
materials, as well as in-depth interviews with key headquarters and field staff from each project. These
lessons are not exhaustive of the learning associated with each project, but rather emphasize key findings
across the projects consulted. The lessons presented cover general project design, followed by specific
intervention areas: availability/accessibility, maternal and child health and nutrition (MCHN)/WASH, and
gender. Each set of lessons includes an overview of activities related to a specific topic synthesized from
the three FFP projects assessed and a text box with pertinent lessons learned.
31
3.1 CROSS CUTTING PROJECT LESSONS
3.1.1 PROJECT SCALE AND FLEXIBILITY
Current FFP projects in eastern DRC all reported experiencing programming interruptions, due largely to
the persistence of civil insecurity stemming both from the activities of armed groups as well as interethnic
clashes over land and other resources. The magnitude, duration, and impacts of these disruptions varied,
with activities being delayed by a few weeks in some instances, while in other instances activities were
entirely dropped. In the most extreme case, civil insecurity led one project to close down all operations in
a portion of its target area midway through implementation and introduce these same activities to new
recipients in relatively more secure areas. Such disruptions reduce projects’ abilities to achieve significant
positive outcomes and impacts, especially on indicators that are hard to change in the short term, such as
stunting. Given these experiences, realism in project scale and strategic selection of activities (discussed
more in lesson 3.1.2) is paramount.
Lessons Learned: Project Scale and Flexibility
Focus project design on key activities to be implemented in a relatively small geographic area, with due
consideration of the distance between targeted communities (to facilitate regular project monitoring, as well as
recipient access to project-sponsored activities).
Consider an area’s propensity for conflict (e.g., the presence of armed groups or valuable minerals) in project
design and realistically evaluate project capacity to implement adequate contingencies for implementation
disruptions in all target areas.
Ensure project design includes a range of contingency plans to address implementation disruptions, for
example, approaches that allow for continued, if slower, progress when escalations in insecurity require a
temporary suspension of project support or approaches for the considered suspension of activities should more
extreme insecurity conditions dictate the need to terminate project implementation.
Integrate strong project monitoring, as well as regular monitoring of the broader implementation environment,
into project design and implementation to ensure that benefits from project activities do not unwittingly make
recipient populations targets for armed groups.
3.1.2 INTEGRATION OF PROJECT ACTIVITIES
The current FFP development projects in eastern DRC began implementation of most of their activities in
a siloed fashion. All projects reported altering their project design to better integrate different sectors
around the middle of the project timeline. They did this by incorporating staff from different sectors into
the same teams and facilitating teams’ abilities to work in the same offices, develop work plans together,
conduct joint field visits, and participate in training on other sectors’ messages and activities.
In addition to identifying a need to better integrate activities across sectors, the midterm evaluations of
some of the projects indicated that different partners within a given project did not necessarily implement
key project activities consistently (e.g., one partner implemented livelihood activities using one approach,
while another partner implemented the same livelihood activities using a different approach). This
complicated project monitoring and sometimes resulted in confusion and tension among project recipients
in neighboring implementation areas. Discrepancies in how activities were implemented among different
donor-funded projects sometimes also fueled confusion, competition, and tensions among targeted
recipients and between recipients and implementers, in particular when different projects applied
divergent approaches to work in a given sector in the same or neighboring geographic area.
32
Lessons Learned: Integration of Project Activities
Train project team members on the theory of change that underlies all key activities to facilitate: staff
identification of linkages, cross-enrollment, referrals, coordination across sectors, etc. For example, health
agents should understand how use of improved agronomic practices links to improved health outcomes and
agronomists should understand how a combination of production-focused and health-focused activities is
intended to facilitate achievement of the project goal.
Consider co-locating project field supervisors in targeted communities to facilitate coordination of activities in
their respective zones.
Ensure that project efforts to integrate activities include an awareness of recipients’ time constraints; full
integration may not be feasible for all target populations.
Engage mobile and/or web-based applications that are capable of tracking recipient households participating in
one or more than one strategic objective (in addition, see lessons in section 3.1.3)
Ensure that proposed project activities are implemented at a scale that facilitates focused, internally cohesive
interventions that can be closely monitored for their effectiveness while protecting recipients against unintended
harm.
Develop clear, easy-to-use implementation manuals for key project activities to ensure consistency in their
implementation among project partners.
Enact partnership agreements at the application submission stage that clearly define how organizations electing
to work in a consortium will collaborate across geographic areas and technical sectors to achieve project
outcomes (e.g., develop joint implementation strategies for all formative research or the roll-out of activities
across strategic objectives).
Collaborate with other governmental and nongovernmental entities working within and/or in neighboring
implementation zones to coordinate activities (and associated incentives), to the extent possible.
3.1.3 HOUSEHOLD TARGETING
Ongoing FFP-funded development projects target highly food insecure populations in eastern DRC.
These populations include chronically food insecure groups, as well as those who have been exposed to
repeated shocks, such as smallholder farming households; women farmers and female-headed households;
conflict-affected households; pregnant and lactating women; children under 2 years of age; adolescent
girls; and victims of sexual or gender-based violence. Each project’s midterm evaluation was critical of
aspects of how households had been targeted in each strategic objective. For example, some
implementing organizations lacked a methodology that clearly targeted the most vulnerable households
across intervention areas, appearing instead to target larger population centers nearer to health posts or
more accessible from peri-urban areas. In addition, the midterm evaluations found that not all partners
within a given project appeared to apply the same targeting methodology when implementing similar
interventions across targeted populations (e.g., one implementing partner targeted livelihood activities
using one approach, while another implementing partner on the same project used a different targeting
approach for the same livelihood activities). As mentioned previously, these divergent project practices,
including those associated with targeting, resulted in confusion and, in some instances, unnecessarily
created tension among recipients and between recipients and the project—two significant obstacles to
achievement of outcomes and impacts in any intervention. This confusion and tension was sometimes
also fueled by discrepancies in targeting methods between different donor-funded projects (e.g., one
project targeted food for work or cash for work activities one way, while a project funded by another
donor in a neighboring community targeted them differently).
33
Lessons Learned: Household Targeting
Create and apply a clearly defined and transparent census methodology at project outset to identify project-
eligible households and enable project teams to target (and more easily track the progress of) the same
households for multiple project interventions, where appropriate.
Apply mobile and web-based technology at project start-up to aid in comprehensive, systematic registration and
tracking of recipients.
Building on the implementation manuals noted in the lessons for section 3.1.2, develop standard protocols for
targeting among partners within a given project, and, to the extent possible, between projects implementing
similar activities within a broader geographic area to facilitate complementarity and mitigate confusion and
tension.
3.1.4 STAFF RECRUITMENT AND RETENTION
In order for a well-designed and well-targeted project to function optimally, it must be consistently staffed
with qualified and motivated people. Recruitment of qualified staff has been a challenge for the current
FFP development projects both because of favoritism in hiring, which is reportedly common in the
region, but also because of rampant falsification of professional documents. The persistence of conflict in
the current target areas further exacerbates the challenges associated with identifying and maintaining
qualified and motivated staff.
Lessons Learned: Staff Recruitment and Retention
Design recruitment systems with built-in mechanisms to decrease recruitment bias, such as: rigorous interview
processes, thorough background checks, performance-based annual contract renewals, etc.
Encourage professional development and other incentives that support staff and affirm their value.
Ensure all contingency plans provide clear and adequate protections for staff.
3.1.5 SOCIAL AND BEHAVIOR CHANGE COMMUNICATION (SBCC) AND PROJECT
COMMUNICATION
Current FFP development project implementers in eastern DRC use a variety of materials to reach
targeted audiences with SBCC related to improved health, agricultural, and other practices. That said, not
all projects’ outreach efforts appeared to include sufficient attention to or application of communication
approaches that meaningfully engage recipient audiences. For example, one project’s midterm evaluation
noted that some project materials had been produced in French (not the language most commonly spoken
among recipient populations) and included little imagery; these appeared to be less effective than
materials that used local languages and pictures. Since materials such as posters and flip charts are key
tools in the implementation of improved practices across several project activities, the importance of
developing communications that engage recipient audiences cannot be overstated.
In addition to appropriate communication on project interventions, messaging about the goal, objectives,
and approaches of the project itself also proved important, particularly in this implementation context.
The Kivus and Katanga have been impacted by near-continuous conflict and displacement over the past
20 years. As a result, there is often an expectation among recipients that they will receive handouts from
governmental and/or nongovernmental entities to respond to their needs, and some have refused to
participate in activities if no incentives or inputs are provided. Ongoing FFP development projects were
often challenged by this problem in their implementation areas.
34
Lessons Learned: SBCC and Project Communication
Develop a project-wide SBCC strategy—working jointly with all project partners—that addresses the different
technical sectors, audiences within each sector, and the various levels at which activities need to be undertaken
(e.g., advocacy, social mobilization, and individual behavior change).
Ensure that all printed project materials for a recipient audience (e.g., posters, flip charts, users’ manuals) use
pictures and, if necessary, a story line in the local language that is engaging, relatable, and facilitates information
uptake among illiterate populations.
Consider reinforcing dissemination of key project messages through radio programs, given high illiteracy rates in
many project areas. These radio programs could include interviews with “local heroes” who are successfully
implementing project-promoted improved practices.
Sensitize communities to the longer-term nature of FFP development interventions prior to commencing and
throughout activity implementation. Sensitization might include introducing and/or providing progress updates on
project objectives to strengthen communities’ capacities, project efforts to link communities with other public and
private actors who can further facilitate community efforts at self-improvement, etc.
3.1.6 SUSTAINABILITY CONSIDERATIONS
Working to increase the likelihood that project results are maintained following project closure is
challenging in any environment. This is particularly true in eastern DRC, where government technical and
management capacities and other resources (e.g., funding and availability of qualified staff) are
exceedingly low, and where repeated shocks—in particular, civil conflict—lead to frequent emergency
responses that habituate populations to a pattern where needed inputs are delivered externally and, if
necessary, delivered again, without concerted efforts to build local capacities to obtain these inputs
independently. All three current implementing partners noted the importance of having a document that
clearly lays out the exit and sustainability strategies for each activity, along with steps and associated
tasks, a timeline, responsible parties, and where applicable, the structure that will continue the activities
after the end of the project, though the projects did not necessarily invest significant time or resources in
the creation or revision of these documents as the project and implementing context evolved.
A recent FANTA study indicates that three factors are essential to ensure sustainability of project
outcomes—resources, capacity (technical and managerial), and motivation. A fourth factor, linkages, is
also important (Rogers and Coates 2015). Many of the current FFP projects’ sustainability strategies for
implemented activities in eastern DRC had a strong and important focus on capacity and linkages, but did
not consistently sufficiently consider the motivation and resources also essential to create an environment
in which project outcomes and impacts are likely to be sustained. For example, to ensure the sustainability
of project-supported irrigation and drainage infrastructure, a current project intended to train point people
in the communities in irrigation system maintenance, while also training farmers more broadly in
appropriate irrigation infrastructure management. The project’s sustainability plan states that the methods
and inputs used to construct the irrigation systems and train farmers on them will ensure that targeted
farmers engage in simple infrastructure maintenance as part of their regular work. However, the plan does
not detail what will motivate farmers to maintain these structures, or how those appointed to maintenance
positions are to access the resources needed for inputs when repairs are necessary.
On the other hand, community savings and loan activities—for which current partners report particularly
high demand—have facilitated training of community volunteers to form and supervise associated
community savings and loan groups. These volunteers receive decreasing project support as
implementation continues so as to be able to support savings and loan groups independently before the
project ends. The volunteers make direct remuneration arrangements with the groups they supervise
without implementing partner involvement. This approach ensures that volunteers have the capacities
35
necessary to effectively continue savings and loan group activities, while the funds generated serve as a
source of resources and motivation for the groups and their volunteer supervisors alike.
Lessons Learned: Sustainability Considerations
Incorporate routine follow-up on project-sponsored activities (e.g., trainings) into project monitoring to ensure
appropriate uptake of highlighted practices and facilitate exploration and resolution of unforeseen barriers.
Develop clear, detailed exit strategies and sustainability plans—with measurable benchmarks of progress—for
all activities, outcomes, and impacts that are to continue post-implementation. These plans should account for
the motivation, resources, and capacity and, where necessary, linkage needs of all project efforts that are to
be maintained.
Account for the capacity strengthening needs of any governmental and/or nongovernmental linkage partners
who are to play a supporting role during and following project implementation in any exit strategies and
sustainability plans.
Formalize partnerships (linkages) with governmental and/or nongovernmental entities to be responsible for
providing continued support of activities post-project before engaging communities in these activities to the
extent possible to facilitate a smooth eventual transition of activities to these entities.
3.2 AVAILABILITY, ACCESSIBILITY, AND DISASTER RISK REDUCTION
LESSONS LEARNED
3.2.1 FARMER TRAINING AND OUTREACH
All FFP implementers in eastern DRC train local farmers in
improved agricultural production techniques. The traditional
farmer field school (FFS) model relies upon a lead farmer
trained by a project agronomist or extension agent to impart
their knowledge to others, often through training on
demonstration plots. Of the projects reviewed here, one uses a
farmer-to-farmer (F2F) training approach whereby selected
farmers train three neighboring farmers—a requisite for
participation in FFSs. The F2F training covers the same topics
that farmers are trained in through the FFSs. The FFS project
extension agent follows-up on subsequent F2F trainings and
keeps records to make sure that each “adopted” farmer is
trained consistently.
Another partner has created a hybrid “cascade” model to
disseminate information on improved production techniques,
based on the care group approach sometimes used in maternal
and child health interventions. In the cascade model,
households are grouped together to elect farmer leaders.
Elected farmer leaders receive training from a project
agronomist related to the technical and group management
aspects of their work. Farmer leaders are trained on an
agricultural curriculum (comprised of flip charts and lesson
plans) that includes: the agriculture calendar; agroforestry;
fruit tree, livestock, and staple crop production; post-harvest
handling/storage; and other relevant topics. Farmer leaders
relay agriculture messages to their neighbors twice per month
Impact of Farmer Field Schools
A recent study assessed the
effectiveness and efficiency of the
impacts of the farmer field school (FFS)
and farmer-to-farmer (F2F)
methodology related to technology
adoption and the respective costs per
farmer trained. Researchers used a
pseudo-experimental approach that
combines a difference-in-differences
(DID) analysis with weighted regression
models using the inverse of propensity
score. The results of their study
consistently suggest significant impacts
of both FFS and F2F training on
farmers’ adoption of improved
technologies. While FFS training is 30–
40% more effective to foster technology
adoption, dissemination of technologies
promoted in FFSs can well be
formalized through F2F training, which
has proven to substantially alleviate a
major constraint to the large-scale
introduction of FFS as a training
method—the high costs per farmer
trained. The addition of the F2F training
component to the traditional FFS
extension system has proven to have a
cost 25% lower than the cost of FFS to
train an additional farmer (Santos
Rocha and van den Berg 2015a).
36
using the flip charts. Cascade model farmer leaders visit farmer recipient fields to monitor whether
recommended techniques and behaviors are being adopted and encourage the improved agricultural
production behaviors highlighted during trainings. Data reported from the project implementing this
approach supports the efficacy of the cascade model and its contribution to the adoption of improved
farming practices. In particular, annual reporting for the project implementing this model shows that the
percentage of individual farmers using at least four sustainable agriculture technologies is higher for
farmers participating in the cascade model compared to standard FFSs. The cascade model also increases
the number of participants who can be targeted, compared to the FFS model.
Lessons Learned: Farmer Training and Outreach
Use appropriate training materials (e.g., manuals and flip charts) tailored to the targeted recipient groups (e.g.,
written in local languages, use of images for illiterate groups).
Pre-test training material with the targeted communities and refine to facilitate effective communication.
Farmer-to-farmer and cascade training methodologies reduce travel time for participants and cost of
implementation while building social cohesion and cooperation.
Community-based extension models increase the number of trained extension service agents in the
communities through the farmer leaders, making up for the lack of government agricultural extension.
Farmers prefer interventions that promote intercropping to reduce the risk of crop failure and given the small
amount of land they have to farm.
Farmers want to understand why crops fail and compare their experiences with other farmers.
Transfer extension oversight to the Agricultural Council of Rural Management (known as CARG) and farmer
business associates to build their capacity. Provide refresher training to farmers and progressively decrease
support to farmer business associates.
3.2.2 CROP DISEASE
Banana Xanthomonas Wilt (BXW), banana bunchy top virus
(BBTV), and cassava mosaic disease (CMD) are widespread crop
diseases that reduce the yields of these subsistence crops in the
Kivus and Katanga. A value chain analysis for South Kivu and
Katanga shows that bananas are extremely profitable, though the
crop cycle lasts 13–16 months, compared to 3–6 months for maize,
for example (Food for the Hungry and IITA 2013). FFP
implementers in eastern DRC work to mitigate the spread of these
crop diseases through farmer training and cooperation with
government-supported research stations such as INERA (National
Institution for Agricultural Research) to secure disease-resistant
planting material. In particular, implementers provide guidance on
proper identification of infected plants and promote selected
removal techniques to control the spread of these diseases. For
cassava, CMD-resistant varietals must be identified, tested for
agro-ecological zone appropriateness and taste preference with
local communities, then multiplied for eventual dissemination to
affected areas. For banana crops, macro and the micro-propagation
(in vitro culture) are appropriate for the rapid multiplication of
banana. However, there are no varieties resistant to BXW. Beyond
multiplication and distribution of banana suckers, farmers must be
trained in preventative control methods against BXW.
Rural Agricultural Management
Councils, or CARGs, are structures
designed to provide a forum for
public institutions, civil society
groups, private sector actors,
community members, and others to
express and advocate for their needs
and priorities for development-
related planning and interventions, in
particular as they relate to
agriculture. Initially established with
external donor support during the
reform of the DRC’s Ministry of
Agriculture, CARGs have been
established at the national,
provincial, and territorial levels and
“local” administrators at each of
these levels are responsible for
maintaining them. CARGs were
designed, in part, to provide a
coordination mechanism that could
facilitate economies of scale in the
agriculture sector. To date, however,
limited resources have been
available to CARGs at all
administrative levels (Mathys and
Remancus 2010).
37
Lessons Learned: Crop Disease
Macro-propagation is an effective technique in this environment to multiply clean banana suckers, though
farmers must be trained in how to prevent BXW and BBTV.
Micro-propagation can serve as another source of material, though suckers propagated this way must be
sourced commercially and their availability is therefore more limited.
Participation in wider dissemination of CMD-resistant cutting is critical, as well as demonstration plots and
multiplication sites in rural areas.
Implementers should consider mechanisms for farmer-led macro-propagation sites to be sustained through
community-based funding, such as village savings and loan associations.
Given that seed multipliers and agro-dealers lack financing, consider means to create a special loan window
through localized financial institutions via partly collateralized loans.
Involve CARGs and INERA in community-based macro-propagation and CMV-resistant cassava from the
outset through meetings, trainings, and workshops to transfer oversight to these entities.
Implementers should consider building capacity of INERA staff and consider including a provision for research
grants to develop tissue culture and multiply disease-resistant varieties.
Sensitization of provincial authorities about the economic impact of crop disease and relevant control
mechanisms can help marshal human and financial resources for the long term.
Cascade and farmer-to-farmer methods can be useful to pass broader messages of crop disease control
methods to a wider array of affected farmers.
Targeted training along with creation/enforcement of local ordinances to control BXW and CMV through fines
can help ensure that farmers stay vigilant.
3.2.3 SEEDS
A variety of modalities have been employed to address the lack of improved seeds in FFP intervention
areas in eastern DRC. One implementer provided a “seed starter kit” to farmer field school participants.
This kit included CMD-resistant cuttings; improved maize, bean, and groundnut seeds; and a hoe,
machete, and roll of rope to facilitate row planting. At a community level, implementers have selected
seed multiplication sites to test and multiply varieties that perform well. In addition, farmers in proximity
to government-led seed multiplication facilities managed by INERA receive tested, improved varieties.
In some instances, farmer associations supported by FFP implementers have made bulk purchases of
commercially available seeds on behalf of their members. For seed multiplied by communities, FFP
implementers chose local associations to manage seed multiplication, often as a food for work activity.
These associations received support from project agronomists. In some locations, the projects also
constructed a seed storage depot at the sites.
According to agreements between implementers and the National Seed Certification Agency
(SENASEM), seed multiplier associations are supposed to be monitored up to three times so that
producers can get their seeds certified. A midterm evaluation for one of the programs found that
inspection visits varied between location and in some cases, did not occur on time or at all. For one
implementer (that did not continue seed multiplication in the third year of the program), the inability to
secure certification status and the lack of technical assistance from SENASEM led the local seed
multiplier association to abandon the multiplication site. Since the midterm evaluation, more associations
have received certification, but one implementer notes that many SENASEM agents sought payment to
secure certification, though this was not stipulated in any agreements between FFP implementers and
SENASEM.
On a broader level, a seed security assessment prepared by the International Center for Agriculture
(CIAT) et al. in 2012 in North Katanga found that seed multiplication projects by NGOs tended not to be
sustainable because the seed value chain was not well understood and little was done to address farmer
38
demand for new seed varieties (see section 3.2.9 for additional information on the seed value chain). One
of the implementers confirmed a need to strengthen farmer demand for improved seeds, as well as the
quality of the seeds provided. The implementer stated it would pursue improved seed multiplication
activities in the future, ensuring a “two-sided” approach that increases the supply of quality seeds (e.g.,
how to select, clean, and protect improved seeds), as well as farmer demand for them.
Another study in one FFP project implementation area related to the impact of smallholder farmer’s
adoption of yield-enhancing technologies following the receipt of improved inputs showed no long term
impact on adoption of improved seeds (Santos Rocha and van den Berg 2015b). Using a randomized
controlled trial methodology to compare farmers who had received seed starter packs compared to those
who did not, the results show that the distribution of free inputs does not encourage long-term use of
improved seeds or inputs, though the authors conceded that this may be a result of their limited supply in
the marketplace. Nonetheless, their findings echo similar studies completed by MIT’s Poverty Lab
concerning the impact of seed distribution programs (Duflo et al. 2011).
Lessons Learned: Seeds
Focus on farmer demand for improved seeds by undertaking seed value chain analysis at project outset.
Support seed fairs to promote product and price discovery among farmers and create an opportunity for
suppliers and farmers to meet and arrange for future seed orders.
Secure a memorandum of understanding with INERA and SENASEM to provide capacity building, base seed
material (to the extent possible), certification of the seeds produced, and ongoing technical support.
Agree and articulate roles for INERA and SENASEM to ensure that seed multiplication centers and
monitoring/certification remain operational post-project.
Train farmers in post-harvest handling of seeds using improved and locally available materials.
Encourage bulk purchase of improved seeds through commercial suppliers and that are agro-ecologically
appropriate to the targeted zone.
Develop a strategy to ensure that farmers continue to implement integrated pest management practices or are
able to purchase pesticides for smallholder/farmer business associates seed multiplication efforts.
Secure legally documented, long-term access agreements for seed multiplication and storage sites from
community leaders or land owners prior to investment.
Train farmers in market planning focused on crop varieties with high net production value per hectare as
identified in project value chain analyses.
3.2.4 LAND TENURE
Those working in the agricultural sector in eastern DRC frequently confront issues related to land tenure,
in particular for smallholder farmers. Current projects’ experiences show that most of the land, especially
in North and South Kivu, belongs to a few people and that the majority of the population either rents land
or does not have access to land for cultivation. Although some implementers have attempted to reach
consensus with the various stakeholders to organize community land access programs, land ownership
remains a sensitive issue, which has occasionally contributed to violence. In the Tanganyika territory of
North Katanga province, land is more readily available due in part to lower population densities and poor
road infrastructure (the latter of which inhibits land access), but it is rare for farmers to possess land titles.
Implementers noted that often when farmers become successful, chiefs who own the land levy higher
taxes or even take the land back if it produces more than it had in the past. This confirmed the importance
of negotiating the terms of the lease of farmland prior to engaging in associated project activities to avoid
unlimited taxes levied on farmers. For reforestation efforts that work to create or reinforce a community
good (see section 3.2.10 for more information on this set of activities), it proved advantageous for one
implementer to sign a memorandum of understanding with the provincial Ministry of Lands and
39
Environment to lead a tenure agreement process so that reforestation efforts implemented on private lands
can continue to benefit the targeted communities once the project is completed. The advocacy plan was
finalized and is now being implemented. Representatives of the Ministry of Lands and Environment have
appealed to the provincial parliament for a final decision so that it can be implemented at the community
level.
Lessons Learned: Land Tenure
Collaborate with state and non-state organizations, e.g., CARG, Justice and Peace Commission, NRCF (a land
conflict resolution network), FPJ (Youth Peace Forum); CLPC (Permanent Local Conciliation Committees), and
CRC (conflict resolution committees), to launch scalable land reform efforts in target intervention areas.
Reinforce the capacities of local civil society organizations engaged in improving land tenure for smallholder
farmers noted above.
Harmonize existing land tenure policies and initiatives and strengthen coordination between different activities
and stakeholders.
Mobilize and reinforce local customary and state authorities in land security strategies.
Create advocacy plans and appeal to the provincial parliament to ensure legal protections to protect land rights
for smallholders and vulnerable households.
Undertake formative research during project design and refinement to understand the breakdowns in
relationships between private land owners and the farming communities using their land and design project
activities for both sets of stakeholders.
3.2.5 POST-HARVEST HANDLING AND STORAGE
Post-harvest handling and storage of production in the FFP implementation areas of eastern DRC are poor
and contribute substantially to overall yield losses. One FFP project’s baseline survey found that 68% of
households are affected by post-harvest losses. The main causes of these losses include rodent
infestations, poor storage conditions, theft, and straying livestock. Various implementing project surveys
showed that less than 10% of farmers use improved storage methods, such as containers, improved
household granaries, community storage facilities, or other means. In order to address this shortfall, all
implementers have included a training module to encourage improved post-harvest drying, handling, and
storage methods; construction of storage baskets; and use of organic pesticides. Two of the three current
projects have promoted PICS bags, an improved, reusable bag that reduces moisture and insect
infestation, though this bag is not readily available in most markets in eastern DRC and must be procured
in Rwanda or Burundi. Another approach has been to construct community-based warehouses, called
agricultural collection centers, to store dried commodities in PICS bags for bulk sale. These centers are
managed by farmer groups in proximity of the warehouses.
Lessons Learned: Post-Harvest Handling and Storage
Emphasize the financial benefits of improved drying and storage techniques related to bulk sale of
commodities.
Promote improved local granaries and invest in community warehouses, as appropriate, which include
inventory control, pest management, and grain moisture testing capacity.
Catalog and disseminate local methods to improve grain handling, drying, and storage.
Strengthen the capacity of farmer groups to manage and finance agricultural collection centers for long-term
success.
Assess the longer term efficacy of PICS bags to understand their availability and capacity of rural input dealers
to access this product on an ongoing basis.
40
3.2.6 GOVERNMENT COLLABORATION IN AGRICULTURE
Without exception, FFP development projects in eastern DRC work closely with government
representatives, in particular those tasked with agricultural development at the provincial level. All
current implementers reported that it has been helpful to have memorandums of understanding with the
provincial representatives of IPAPEL (Agriculture, Fish, and Livestock Inspection) to facilitate their
involvement in project work and to work with INERA to access new seed varieties, and with SENASEM
for official seed certification. However, these entities’ remote posts are poorly funded, resulting in few
agents who are able to reach farmers. In addition, those government agents in the field often lack
transportation for travel to project areas. In many cases, government personnel have demanded payments
from NGOs, including current FFP partners, to collaborate with projects. Given limited resources among
these entities, current implementers have found it helpful to involve IPAPEL staff in project training
sessions of lead farmers, which also builds their capacities. The projects have also engaged IPAPEL to
participate in quarterly or semi-annual round tables to coordinate, review progress, share knowledge and
best practices, and document project diffusion (adoption of project-encouraged practices by non-
recipients). Despite these efforts, barring a massive improvement in the government’s ability to provide
broader agricultural extension to farmers in remote rural areas, a community-based farmer training model
with well-trained farmer leaders will remain necessary to bridge the knowledge and outreach gap.
Collaboration with INERA at seed research stations to multiply and disseminate improved seed varieties,
especially CMD- and BXW-resistant varieties, has been vital for all projects. However, the need for
improved seed and the massive scale of crop diseases in the region both exceed INERA’s response
capacities. Nonetheless, there is a great deal that implementers can do to bolster this work through
multiplication and dissemination of improved seed varieties, in particular through collaborative
community seed multiplication initiatives (see lessons associated with section 3.2.3, previously).
Lessons Learned: Government Collaboration in Agriculture
Establish memorandums of understanding with relevant government organizations involved in agriculture to
ensure seed certification (SENASEM), to access improved seed varieties from government multiplication sites,
as feasible (INERA), and to participate in farmer training and regular meetings (IPAPEL).
Build capacity and identify roles and responsibilities of community development committees as a conduit
between governmental and nongovernmental entities.
Advocate with government entities to reduce predatory taxation on farmer-produced goods prior to activity
implementation. Solicit assistance from IPAPEL to do this.
3.2.7 IMPROVED INFRASTRUCTURE (FOOD FOR WORK/CASH FOR WORK
INTERVENTIONS)
In the current FFP development projects, implementers used food for work (FFW) to improve community
infrastructure, such as roads, drainage canals, and irrigation. FFW participants engage in workday
rotations of 22 days and work teams are drawn from members of community associations who manage
FFW activities. Others from the surrounding area who are fit and willing to work can also participate.
Specific FFW efforts in some areas were thwarted due to ethnic land disputes, which are rife in some
implementation areas, particularly in the Kivus. Many of the FFW activities undertaken by the ongoing
FFP development projects are designed to improve market access for farmers and open new land by
improving drainage and irrigation systems for the cultivation of cassava, rice, and maize. Implementers
felt strongly that there is a continuing need to organize community labor to enhance the commons for
targeted communities’ benefit.
41
Concerning FFW as a means of payment, projects reported that many laborers felt that the food they
received was insufficient for the work accomplished. Moreover, implementers had trouble recruiting men
to work for food which is viewed culturally as appropriate payment only for women. This is also
compounded by the fact that many men migrate from their households to work in mines or as casual
laborers. As a result, programs often recruit an abundance of women and older people, but found that the
nature of the FFW activities can be quite burdensome for these groups. One implementer introduced cash
for work (CFW) activities near mining areas to recruit more men. In communities where CFW was used
as a payment mechanism, implementers noticed a marked increase in household assets, school attendance
and purchasing power. The project reported that recipients used funds for school fees, food, hospital bills,
building materials, etc. That said, the implementer did note challenges associated with delivering cash in
their target areas, given the dearth of formal financial institutions in these areas and the logistical and
security challenges associated with cash distributions.
Lessons Learned: Improved Infrastructure
Use FFW during the lean season and CFW during other times of year to support local markets.
Sensitize community about improved infrastructure to ensure community buy-in for its long-term maintenance
so that they see benefits beyond direct payment for the work.
Collaborate with the Division Provinciale des Voies de Desserte Agricole (Agricultural Division of Provincial
Roads) on any road rehabilitation work to ensure ongoing maintenance.
Involve women in efforts to improve and maintain infrastructure projects.
Train community members on the technical and management aspects of infrastructure maintenance to enable
future access to inputs needed for maintenance and repairs.
Prioritize land at greatest risk of erosion when undertaking terracing interventions.
Use locally available skilled labor and materials, as feasible, for ongoing maintenance of the infrastructure to
enhance community buy-in and facilitate sustainability.
Tap into traditional community labor mechanisms, such as salongo, whereby citizens oversee community
assets and organize work when needed.
Ensure proper monitoring for worker registration/attendance and quality control, and avoid repeat labor
rotations.
Identify vulnerable households to participate in FFW/CFW efforts to the extent possible.
3.2.8 LIVESTOCK/FISHING
All ongoing FFP development projects in eastern DRC are implementing some type of livestock
intervention to improve the livelihoods of target recipients. These interventions concentrate on the
provision and maintenance of small ruminants such as goats, guinea pigs, and rabbits. A focus on small
ruminants in these intervention areas is important given the frequency of displacement due to repeated
conflict and the lack of available pastureland. The Kivus, in particular, have many large cattle ranches
owned by wealthy landowners. Project animal distribution programs have primarily targeted women’s
groups, each of which receive, for example, 8–11 goats to manage collectively. In some projects,
community-based animal health workers support women’s groups to care for the goats, provide
vaccinations, and monitor overall animal health. Recipients are required to give offspring to new
members in the group, though this may take between 2–3 years depending on the size of the group and the
reproductive success of the distributed stock. Some projects reported that such a prolonged waiting period
has occasionally affected group cohesion. Goats were appreciated for their cultural and economic value.
They can also be easily sold to meet pressing needs in the household, such as school fees or emergency
medical costs. Nonetheless, women noted that they have no influence on the decision to buy, sell, or
slaughter a goat, as this is decided by the husband, regardless of how the animal was procured.
42
One implementer has focused on distribution of rabbits and guinea pigs and the construction of
multiplication units stocked with breeding rabbits/guinea pigs at various locations. In order to scale up
this approach, the implementer trains participants to build holding pens for groups of four households
participating in MCHN activities (this also provides an example of integration of project activities). One
mother raises the first batch of rabbits over a 6-month period, after which each female rabbit will have
delivered an average of 5–6 offspring. These offspring are then divided among the other mothers. Such a
strategy is intended to facilitate sustainability and increase targeted households’ consumption of animal
protein.
None of the current implementers are undertaking direct fishing interventions (though some project
activities support training on fish drying as an income-generating activity), despite the proximity of many
current project implementation areas to lakes Kivus and Tanganyika and numerous tributary waterways.
The current projects indicated that fishing on its own may not be economically viable in these
implementation areas, but that they could be considered as part of a package of expanded livelihood
opportunities in future activities. However, given concerns that many of these water bodies are already
over-fished, the approach to such activities would need to be carefully considered based on profitability,
sustainability, and environmental concerns.
Lessons Learned: Livestock/Fishing
Focus on smaller ruminants due to ease of transport, land constraints, and frequent theft/loss caused by
displacement due to insecurity.
Engage livestock specialists who can test a variety of animal types and breeds to identify those most
adaptable to various implementation environments.
Select recipients of initial breeding stock based on their capacity to oversee the reproduction of these animals,
rather than the fact that they are vulnerable or a farmer/mother leader.
Provide primary breeders with sufficient training and complementary support to ensure success.
Boost animal survival rates by constructing adequate animal enclosures with local materials.
Incorporate community-based savings and lending activities to increase the resource base available for
livestock interventions and the likelihood of their post-project sustainability.
Partner with government agents (IPAPEL), train paravets, and work collaboratively with international entities to
address shortfalls in animal health and vaccine services.
Ensure that the offspring revolving and reproduction process maximizes animal survival rates through training
in animal health and ensure that participants give offspring to new participants on a timely basis. Replace and
discourage consumption of deceased animals.
Include fishing interventions on fishponds, lakes, and rivers in future projects (e.g., improve fish catch on a
sustainable basis, improve environment-friendly smoking and drying techniques, improve marketing).
Analyze potential environmental impacts and market viability of fishing and livestock activities to ensure that
such activities do no harm.
3.2.9 VALUE CHAIN ANALYSIS AND MARKETING
All current FFP projects in eastern DRC have at least one set of activities associated with income
generation. These activities focus on marketing of agricultural production or associated inputs (e.g., seeds
from seed multiplication activities), sale of products from off-farm income-generating activities (e.g.,
soap making), or a combination of these. For income-generation activities associated with agricultural
production, all FFP implementing partners noted having undertaken value chain analyses to understand
and select the markets for at least some of the products they intended to promote or were promoting,
though not all partners undertook this work in a timeframe and/or with a rigor that was conducive to
optimizing returns on these investments.
43
In terms of implementation of value chain activities, projects found that when engaging smallholder
farmers, clustering farmers into producer associations or other groupings to facilitate bulking allowed
these groups to increase their marketability to larger processors and/or buyers. Such groupings also
strengthened these producers’ access to capital, increasing their capacities to engage in value-added
activities, though current partners were quick to underscore that the equipment needed to transform
harvested crops (e.g., grinders, washers, presses) tends to be costly, even for grouped small-scale
producers/processors. Some projects highlighted that sustainability plans that consider the continued
training and maintenance needs associated with this equipment are also necessary. In addition, though
perhaps obvious, successful engagement in agricultural value chains is predicated on a number of other
factors—including access to adequate land and consistent application of successful improved production
practices—each of which brings its own challenge as was discussed previously.
Similar value chain and marketing considerations apply for small-scale off-farm income-generating
activities, such as bread and brick making, tailoring, etc., although few such activities were implemented
in the current projects. These activities often target vulnerable households that do not have access to land
or the composition necessary to undertake physically demanding activities (e.g., field cropping, food for
work, cash for work, or similar project interventions). Ensuring clear demand, returns that outweigh
investments within the life of the project, and a basic recipient understanding of marketing is essential for
both agricultural and non-agricultural production and marketing activities. Given the volatile security
context of eastern DRC, consideration of how to protect recipients of successful production and
marketing activities from the predatory practices of armed groups and/or ethnic clashes is also paramount.
Lessons Learned: Value Chain Analysis and Marketing
For the implementation of value chain analyses:
Conduct analyses that examine the level of effective demand and the costs and benefits of engaging in various
value chains for all agricultural and non-agricultural products to be marketed prior to engaging in project
activities associated with these goods.
Ensure value chain analyses are conducted at a level (e.g., provincial, territorial) sufficient to capture the market
interventions of public and private sector groups external to the project.
Establish a common platform (preferably one led by a government entity, with appropriate capacity
strengthening) that involves all partners within a targeted value chain to establish quality standards and
integrate market information, to the extent possible.
For the design and implementation of income-generating activities:
Strengthen producers’ capacities to engage in value-added activities (e.g., post-harvest handling and
processing), including by facilitating access to equipment through loan mechanisms, training on local fabrication
of equipment, etc.
Consider project approaches that facilitate bulking of goods from smallholder producers to achieve quantities
that are marketable to larger processors and/or buyers.
Ensure value chain interventions are supported by adequate associated programming, for example, training to
foster recipient understanding of marketing basics, such as commodity quality management, input procurement,
calculating yields and their associated economics (inputs and outputs), and understanding the benefits of
bulking (production and/or producing in groups) to facilitate sustainability.
Anticipate and create contingency plans to address the possibility that marketing and/or other commercialization
activities attract insecurity, as increased economic activity can attract the interest of armed groups and/or fuel
ethnic and/or resource-based tensions.
Support project value chain/marketing activities with interventions that attend to land tenure and farmer training
and outreach issues (see sections 3.2.4 and 3.2.1, respectively).
44
3.2.10 COMMUNITY SAVINGS AND LOAN ACTIVITIES
Given the dearth of availability of formal and informal financial services in most implementing areas, the
current FFP projects are engaged in community-based savings and lending activities wherein community
members form small groups and contribute resources to a fund, the total of which is distributed in a
rotating fashion among participants. The current projects strengthen recipient capacities to run these
groups independently, such that most groups no longer require project support after the first couple of
loan cycles. Some implementers also reported that these interventions have led to the diffusion of this
activity (the formation of spin-off savings and lending groups among non-targeted community members).
In addition, some of the current projects work to link more advanced community savings and loan
participants to existing, established credit providers (in instances where these latter entities exist),
grouping still others into federations in an effort to attract microfinance institutions to implementation
areas to further grow recipients’ access to financial services. According to project implementers,
community savings and loan activity participants cited using funds from these community mechanisms to
pay school fees, access medical care, procure food, and establish additional income-generating
activities—including opening new or expanding existing farming fields. Projects reported that community
savings and loan activities also improved community solidarity and social cohesion among group
members.
Partners acknowledged the importance of not only helping participants to access basic savings and loan
services, but also training interested groups on expanding their savings and lending capacities through
engagement in income-generating activities such as masonry, sewing, baking, cash crop production, etc.
(while heeding the lessons outlined previously in section 3.2.9). This expanded approach involves
integrating project recipients into these other activities, where applicable, and/or developing technical
capacity strengthening modules for such activities, in addition to the more common community savings
and loan training modules on business development and management topics. Current implementers noted
that, in some instances, community members have come together on their own to pursue an income-
generating activity without direct training/skills development from the project. As a final consideration
for implementing these types of activities, current projects noted that the lack of access to formal financial
institutions in many target areas creates a potential risk for savings and lending groups’ cash box
holders—who store accumulated funds prior to share-out meetings—and that future projects may want to
consider mobile options to reduce associated security risks for participating members.
Lessons Learned: Community Savings and Loan Activities
Consider complementing savings and loan activities with training on income-generating activities among
interested groups, where appropriate.
Explore mobile banking options to link groups with available financial institutions (following research into mobile
network coverage, the costs and benefits to local mobile providers of engaging in such activities, mapping the
location of mobile agents, etc.).
Continue applying an implementation approach that strengthens recipients’ capacities to run community savings
and loan groups independent of project support to facilitate sustainability.
3.2.11 REFORESTATION
Each ongoing FFP development project in eastern DRC includes a natural resources management/
disaster risk reduction element, one of the foci of which is reforestation activities. In some
implementation areas, these activities are undertaken on private lands while in others they are undertaken
on communal lands. Results from activities in this intervention area indicate that targeted communities
preferred reforesting with trees that (1) grow (and/or, after harvesting, regenerate) rapidly, such as
45
eucalyptus, and (2) can be used for multiple purposes (eucalyptus can serve as a source of fuel, as a
facilitator of land reclamation activities, as construction material, etc.). Some communities cited a
preference for quinquina trees for reforestation activities, given their relatively rapid regeneration rate and
the eventual utility of this tree’s bark as a source of income.15
All current FFP projects in eastern DRC noted that with reforested land comes the increased risk of forest
fires, which significantly threaten these activities. Some of this threat is offset by reforestation activities
that utilize tree varietals that can generate income beyond their utility as fuel or as assistants in land
reclamation (such as the aforementioned eucalyptus and quinquina)—which helps incentivize producers
to protect these crops for their potential returns. In addition, implementers reported that local government
implementation/enforcement of bylaws and fines to cover the cost of replacing areas destroyed by fire
increased community efforts to prevent and fight forest fires at reforestation sites. Projects must also be
aware of and work with communities to mitigate issues associated with the gains some communities may
garner from engaging in this activity, as these gains have the potential to lead to tensions with non-
targeted communities or targeted communities experiencing relatively less success in similar activities.
For example, one implementer reported that neighboring community members set fire to one targeted
community’s reforestation sites because they were jealous of their seeming prosperity.
Lessons Learned: Reforestation
Consider selecting trees for reforestation activities that regenerate quickly (to maintain reforestation efforts) and
have value beyond a source of fuel and/or means of land reclamation (to motivate protection of this resource).
Collaborate with local government counterparts to enact or enforce existing efforts to prevent and mitigate the
impacts of forest fires.
Ensure an activity design that regularly monitors the outcomes and impacts of reforestation activities in an effort
to mitigate the potential for conflict between targeted and non-targeted communities.
Train reforestation committee members on appropriate harvesting of trees and/or tree by-products, including
harvesting at a scale that facilitates sustainable regeneration of the resource.
Consider grouping reforestation site committee members to facilitate bargaining power when tree by-products
become available for sale (following the lessons on marketing activities in section 3.2.9).
3.2.12 DISASTER RISK REDUCTION AND EARLY WARNING
While the majority of attention to eastern DRC focuses on the considerable number of externalities
populations in this area face—in particular those related to civil insecurity—these populations’ internal
efforts to mitigate the negative impacts of many hazards is noteworthy. All current FFP implementing
partners in eastern DRC included a project component to strengthen targeted communities’ capacities to
mitigate disaster risks, be this through broad efforts such as the development of disaster management
plans or specific activities such as the aforementioned reforestation initiatives and efforts to organize
communities to monitor for and provide early warning of the incidence of key hazards and specific shocks
(e.g., crop pests and disease outbreaks, human health issues, and river levels). Given the level of exposure
to shocks these populations face, efforts to reduce disaster risk and provide earlier warning of hazards is
essential.
15 Quinquina bark is a key ingredient in quinine, a common malarial prophylaxis; though the first harvest of this bark is not
available until about 8 years after planting. If intercropping, there are a limited number of crops with which quinquina can be
intercropped and, while the mature trees are relatively disease resistant, seedlings are prone to pest and disease attacks and must
be carefully managed.
46
A key challenge, in particular for project-level early warning elements, centers around the fact that
communities are more likely to continue implementing early warning efforts when they see benefits from
them—either in the form of a crisis diverted or an effective response from the community (or an external
entity when the magnitude of the shock surpasses the community’s response capacity). Current FFP
development project implementers acknowledged that while they work to reinforce communities’ and
community structures’ capacities to respond to shocks, many of these efforts did not begin until midway
through the project cycle, which has not afforded them sufficient time to achieve the desired results in
most areas. In addition, they noted that there is a need for the development of complementary national
disaster risk reduction policies and response frameworks to further support these interventions and
increase the likelihood of their sustainability.
Lessons Learned: Disaster Risk Reduction and Early Warning
Implement disaster risk reduction and early warning elements early (e.g., at the beginning of the project) and in
such a way that communities play a leading role (to enhance their participation in and ultimate ownership of
these efforts).
Provide practical trainings on disaster risk reduction activities such as hazard mapping, indicator monitoring
and analysis, etc., to the community-level structures that will govern these activities.
Ensure inclusion of community-level capacity strengthening in shock response in the design of this project
element while facilitating linkages with entities responsible for responding to larger (e.g., covariate) shocks.
Consider partnering with other entities working to strengthen national-level capacities in disaster risk reduction,
including FAO, UNICEF, WFP, and the European Commission.
3.3 MCHN AND WASH LESSONS LEARNED
3.3.1 PREVENTION OF MALNUTRITION
Given the high prevalence of stunting in children in Eastern DRC, FFP development projects are working
to improve the diets and nutritional status of their recipient communities, with a focus on the 1,000-day
period that covers pregnant and lactating mothers and children under 2 years of age. Two of the three
implementing partners are distributing monthly food rations to pregnant and lactating women and
children under 2 (individual rations) consisting of corn-soy blend and oil using the prevention of
malnutrition in children under 2 approach (PM2A). The third implementing partner is not distributing
food rations to either individuals or households (it is instead focusing on BCC messages to encourage the
consumption of a nutritious and diverse diet, and promotes the production and consumption of
micronutrient-rich vegetables and fruits).
A PM2A program is usually designed to provide both an individual ration and a protective household
ration to prevent sharing of the individual ration; however in some cases implementing partners select to
distribute only an individual ration, as in the case of these FFP projects. In some respects, the choice of
providing only the individual ration is not surprising since, in contrast to the poor nutritional status at a
provincial level, especially in Katanga, the baseline surveys in the project areas specifically did not reveal
widespread maternal underweight, suggesting that mothers get adequate calories from staples.
Nonetheless, the quality and diversity of the diet is poor. The other rationale for excluding protective
rations seems to have been to avoid dependency on food assistance at the household level, given the
ongoing aid families have received due to the conflict, despite the fact that households are highly food
insecure and could benefit from the added rations. In at least one of these two projects, recipients reported
running out of the rations within a week or two of their receipt.
47
PM2A usually follows an age-based targeting approach, targeting all pregnant and lactating women and
their children under the age of 2 in the communities served. A review of project experiences suggests that
good census data is a crucial starting point in the planning stage. Once ready to implement its activities,
one partner was surprised by a larger than expected number of potential recipients in its target
communities due to a high fertility rate. As a result, they were unable to serve all the pregnant and
lactating women and children under 2 years in their project areas. The project decided to modify the
enrollment criteria, identifying a subset of at-risk pregnant women. These at risk women included
primiparas, women who had previously had a child with low birth weight, women who were pregnant
with multiples, or women in an otherwise high risk pregnancy due to maternal underweight or high parity.
While the modified enrollment criteria allowed the project to deliver its planned ration quantities, this has
the potential to create conflict within the community, especially if the communities are involved in
selecting the recipients of the rations. Given the challenges to provide rations to all pregnant and lactating
women and children under 2 in the areas chosen, the project could have instead reduced the scale and size
of the selected geographic area in order to serve all eligible mothers and children.
Usually, the receipt of rations in a PM2A program is conditional on the participation of mothers in the
various SBCC and health care activities. Given the ongoing aid that communities have received due to the
conflict, partners felt that enforcing the conditionality of receipt of rations on participation in such other
activities would not be feasible or would risk the participation and trust of their recipients. In addition,
enforcing such conditionality would pose complications with tracking participation and impose additional
managerial burden on the projects.
Lessons Learned: Prevention of Malnutrition
Conduct an accurate and realistic census before beginning the distribution of rations to adequately account for
the needs of the communities and carefully plan and refine the coverage area.
Lay out clear inclusion criteria for the distribution of rations at the outset of the project, and communicate them
clearly to the target beneficiaries and the communities at large to prevent conflicts with and within the
communities.
Follow an age-based targeting approach by including all pregnant and lactating women and children under the
age of 2 to aid in the prevention of conflicts and confusion and contribute to prevention of stunting.
Distribute a household ration in addition to the individual ration to ensure that the target individual will consume
his/her ration instead of sharing it with the household, and that the ration will last for the intended month.
Establish a commodity management and recipient tracking system at the outset that allows an efficient
distribution of rations.
Ensure ongoing collaboration with other organizations implementing development and emergency programs in
the same area to prevent the inclusion of recipients who are participating in other programs.
Promote the production and consumption of micronutrient-rich foods over the long-term, while also taking into
consideration the displacement of the population due to insecurity and conflict and lack of land tenure in the
short and medium-term when considering the options available for the prevention of stunting.
3.3.2 TREATMENT OF MALNUTRITION, WASH, AND FAMILY PLANNING
Treatment of malnutrition. The treatment of severe acute malnutrition (SAM) requires intensive feeding
with specialized, high-energy foods, and hospitalization for cases with complications. By design, the three
current FFP projects planned to refer cases of SAM that they detected in the communities to government
facilities for further assessment and treatment. However, the capacity of government facilities to treat
malnutrition is very low, and all three projects have had to stop referring children identified with SAM
since little or no therapeutic services are available in the project areas. Although SAM prevalence is not
alarmingly high, cases in the communities exist and the children with SAM are at high risk.
48
One option for projects could be to screen children monthly to identify moderate acute malnutrition
(MAM) cases to treat them before they become SAM. For this, projects could encourage the use of
locally prepared fortified supplements, including a component to educate the community on the
preparation of locally available and nutritious diets for children with MAM.
Lessons Learned: Treatment of Malnutrition
Strengthen and support the health system through training and provision of supplies for the treatment of SAM
to create the foundation for quality SAM treatment and to enable referral from FFP programs to the health
facilities.
Screen, prevent, and treat moderate acute malnutrition (MAM) and use locally available commodities.
Identifying and treating MAM before it progresses may to reduce the overall burden of SAM treatment in
government health facilities.
WASH. Lack of access to clean water and sanitation has a significant adverse impact on nutrition and
such access is very low in eastern DRC. All three current FFP development projects include SBCC and
messages around critical hygiene practices. Two projects have undertaken WASH infrastructure
activities, including the construction of latrines and water wells, the capping of springs, and the
rehabilitation of water systems. A third project limits its WASH activities to improving hygiene and
teaching households to construct tippy taps—simple household washing stations.
In one project, the use of consultant/contract staff for WASH infrastructure activities under project staff
supervision has allowed the completion of planned construction in a timely manner. It was also an
opportunity for the project to support local associations and organizations, and thus to support the local
economy. For the other project, the use of such mechanisms has not been of satisfactory quality. Using
consultant/contract staff or using project staff each has advantages and disadvantages, but regardless of
the approach a project choses, current projects agree that close supervision by project staff engineers hired
specifically for that purpose is essential. A rigorous and unbiased selection process for awarding contracts
was seen as important, along with an agreement on the payment plan before the work begins.
Lessons Learned: WASH
Expand and improve WASH infrastructure as this is a prerequisite to preventing malnutrition. Projects can do
so by constructing permanent infrastructure in the communities, as well as simple structures in the households
(such as tippy taps), in addition to advocating for changed hygiene behaviors.
Ensure project staff provide close supervision of water and sanitation construction.
Family planning. Working in a high fertility environment, the ability of food security projects to make
an impact is limited without addressing family planning. As effective as food security interventions can
be, if the population base is large and expanding, the ability of the project to have an impact becomes
small and diluted. Current FFP project activities related to family planning are limited, with little SBCC
and messages on the importance of birth spacing and family planning.
49
Lessons Learned: Family Planning
Support and strengthen the health system to expand and deliver family planning services, particularly taking
charge of distributing family planning commodities and related services, in addition to SBCC on family
planning, as this helps projects achieve their food security objectives.
Build on USAID efforts to collaborate, collocate, and coordinate to leverage and collaborate with other USAID-
funded health projects that can focus on distributing family planning commodities, with FFP playing a more
substantive role in the SBCC related to promoting the adoption of family planning (e.g., FFP projects through
their focus on agriculture extension work extensively with men can reach this key audience to promote uptake
of family planning, in addition to the MCHN audiences they reach).
3.3.3 COMMUNITY HEALTH WORKERS AND SBCC
Projects have trained mothers (and sometimes fathers) to act as volunteer community health workers—
calling them leader mothers or leader fathers—who conduct many of the project MCHN activities in the
communities. In most projects, these leaders were not found to be highly motivated, especially when other
leader mothers used in the same areas by other organizations are provided with material gifts. This is
likely due to the fact that leader mothers cannot afford to work for free. Projects have learned that some
compensation such as the provision of seeds, T-shirts, or bags to the leader mothers could help increase
their motivation. They can also benefit from project-led literacy and numeracy activities. One potential
motivation seems to be the integration of project volunteers, such as leader mothers, into the public health
system. They already often perform duties similar to the public health system community health workers,
and are trained to fulfill their roles. Projects could negotiate with the Ministry of Health for them to be
trained and/or recognized as community health workers (CHWs) either during the life of the project, or
when the project ends. Interestingly, some men were interested in training and performing the duties of
leader fathers, and were encouraged by the projects to do so. This is an important step toward gender
integration, but more can be done to encourage men as leader fathers. Engagement of men in the broader
health system is important to improve their engagement and understanding of women and children’s
health and nutrition needs.
All three projects use the care group model for the majority of their SBCC. Cascade training is led by the
project health promoters. The promoters train leader mothers, who in turn train recipient mothers. From
the project directors’ and managers’ points of view, this model seems to work well for MCHN activities,
although data on the effectiveness of this model on changes in behavior is not yet available. Based on
qualitative data in more than one project, radio messages seem to be popular and effective in producing
behavior change, especially among men. An interview with a father who was not initially supportive of
his wife’s participation in the care groups illustrates this behavioral and attitude change as a result of
radio messages. After hearing a radio spot about the importance of prenatal and postnatal care and
nutrition, he became supportive and helped his wife manage her time and household tasks so that she
would be able to attend antenatal care and care group meetings.
50
Lessons Learned: CHWs and SBCC
Collaborate with other projects working in target areas to ensure provision of uniform compensation for
volunteer CHWs to help improve their motivation and performance.
Train the public health system CHWs, or integrate the project-trained CHWs into the public health system
during the project period, as this provides an opportunity to support the government health services.
Encourage men to serve as CHWs to improve gender integration in an area where it is needed.
Use mass media approaches, such as radio spots, as a means to reach the community at large but also target
men as a key audience of SBCC activities to both engage men to improve gender integration and support the
adoption of improved nutrition and health behaviors at the household level, which ultimately improves the
project’s impact on nutrition-related behaviors and outcomes.
3.3.4 SUSTAINABILITY CONSIDERATIONS IN MCHN ACTIVITIES
From a review of project documents and discussion with project staff, it is clear that the three FFP
projects in eastern DRC have learned that working with local authorities increases the likelihood that
project MCHN activities will be sustainable. Additionally, working through local government bodies has
enabled the projects to access communities more easily, as they have built a rapport and trust with these
institutions as partners. This partnership has been key in ensuring the safety and security of project staff
and commodities in this volatile region. Projects have also found that having a system for community
feedback or complaint and a response mechanism allows them to be aware of and respond to
communities’ needs, as well as any rumors, and to address them in a timely manner so that long-term
repercussions can be avoided. Working closely with government health center staff helps the projects
increase the chances of its activities’ and impacts’ sustainability. Projects have done so by setting up joint
supervision of project volunteers; joint field visits; joint training on the Essential Nutrition Actions,
Essential Health Actions, and infant and young child feeding; and refresher training on nutrition and the
implementation of the national nutrition policy, among other activities. One lesson that was learned after
setting up a parallel structure of mother and father leaders was that perhaps, for sustainability purposes, it
would be better for projects to work with existing government CHWs (as mentioned in section 3.3.3). In
that case however, it is important for the project to set up performance expectations for the CHWs, and to
provide the same kind of training and supervision as they would for mother and father leaders. Care
should be taken to ensure a reasonable workload for these CHWs, and if they become overloaded,
projects could support the hiring of additional CHWs.
Projects have worked on improving the sustainability of their activities by building the capacity of
community structures such as Commités de Developpement Communautaires (CDCs) and WASH
committees (who themselves are under the supervision of CDCs). The challenge with this approach is
ensuring funding and availability of outside inputs, such as serviceable parts for WASH infrastructure.
Projects are also working on improving the links of these community structures to government services
and entities at the local level. Another contribution to the sustainability of the projects’ impact is the
hiring of local staff as much as possible. It is interesting to note that although preventing children from
becoming stunted in the first 2 years of life is a sustainable effect that will impact a whole generation, and
would have potential effects on their offspring, none of the projects expressed that as part of their
sustainability strategy.
51
Lessons Learned: MCHN Sustainability
Collaborate closely with local and national government health sector entities from the inception of the project,
as this can ease the project’s access to the communities and increase the likelihood of the sustainability of the
project activities and impact after the exit of the project.
Implement a system for community feedback or complaint and a response mechanism for health service and
conditional transfer activities related to MCHN.
Establish joint training and supervision with the local and provincial health authorities.
Integrate project CHWs into the government health system, or employ the government CHWs.
Develop the capacity of local community structures to support health service delivery and referral.
3.4 GENDER LESSONS LEARNED
3.4.1 PROGRAMMATIC GENDER INTEGRATION
While gender integration was expected of all ongoing projects in eastern DRC, the extent to which
projects have been successful in integrating gender has varied. However, even the most successful efforts
have not fully addressed the gender issues that affect the communities where the projects operate. In part
this is due to where the projects are located in DRC, where the transition to a post-conflict setting faces
frequent setbacks. Each of the projects has been affected by insecurity, which has impeded project
implementation to varying degrees. In some cases, insecurity has meant changing the geographic focus of
activities, in other cases, it has meant narrowing the focus of programming to a more limited area, and in
other cases still both strategies have been applied. But this is also partly a result of projects themselves
not adequately integrating gender in their program design and implementation activities.
All current FFP development projects in eastern DRC sought to address gender issues. However, in two
projects staff to support these efforts were brought on after midterm evaluations, at which point there is
not enough time to fully address gender issues and/or reorient program implementation to integrate
gender. While two of the three projects conducted gender assessments early in the life of their projects,
only one of the projects, which had a partner with expertise on gender, was able to use the results of the
assessment to help guide programming early on. Some key benefits included: training and sensitization on
gender issues for project staff at all levels in the first year of operation, incorporating insights gained from
the gender assessment into project activities, and designing effective program approaches based on the
partner’s experience in gender dynamics and social change.
The focus on gender dynamics and social change is an important one because in the conflict-heavy
context of eastern DRC, men and women’s roles evolve particularly rapidly, and understanding what
changes are underway and how to promote positive changes in how men and women relate is essential—
both for social stability and to support food security programming objectives. It is important to note that
just as the three projects have had varying success with integrating gender, the approaches they used were
also different. The two projects that sought to integrate gender after their midterm evaluations used a
“women in development” approach, whereas the project that sought to integrate gender from the
beginning adopted a “gender and development” approach. The difference is an important one. In the
projects that used the women in development approach, the emphasis of activities was to target women
and provide them with additional skills and capabilities. The perceived benefit was that women could do
more for themselves by learning these additional skills and that, as a result, they would need to depend
less on men. The problem in the eastern DRC context however, is that men already do little to support
farming and livelihood activities for fear of losing their lives as a result of insecurity. This has resulted
more broadly in women taking on greater household and farming responsibilities while putting
52
themselves at great risk of sexual violence on the way to their farms, all while still remaining subservient
to men.
In contrast, the project that used the gender and development approach engaged men and women, and
sought to transform how they relate to one another. In this approach, men have been engaged to play a
more active role in supporting women, and have been made aware of the need to resolve conflict using
different approaches such as dialogue and collaboration rather than resorting to violence. This has
resulted in more effective pooling and managing of household resources toward the shared objective of
improving the well-being of their children. While the project has not achieved transformation of all
relations between men and women, their approach has led men and women to be more introspective about
the value of greater cooperation and management of resources at the household level. Even so, some men
and women in this project area continue to perceive that there is something to lose by promoting gender
equality. Some men perceive this as men relinquishing power and taking on more submissive roles, and
some women perceive that it is inappropriate for men to take on women’s roles. That said, the project’s
results to date suggest that change is possible, if challenging. This suggests that, going forward,
emphasizing what men and women can gain by promoting gender equality is important for projects to
articulate so that gains are not only perceived in terms of what women gain, but also in terms of what men
gain.
Even though one of the three projects has been more able to integrate gender, it is important to note that
gender integration has been uneven across the project strategic objectives. Efforts to promote social
change and improve gender relations did not permeate across all aspects of the project. The next two sets
of lessons illustrate this point, examining constraints to gender integration in the availability/accessibility
and MCHN objectives.
Finally, gender, family planning, and sexual and gender-based violence are intimately linked in this
region of DRC. Despite the widespread prevalence of sexual and gender-based violence, ongoing project
partners noted that they do not feel well equipped to deal with such issues and future projects will need to
consider how to address this issue. Although some of the projects have been effective at engaging in
community-level dialogues to change social norms and values, given the deeply entrenched gender
discrimination against women in these areas, it will take a significant amount of time and effort to
engender change.
53
Lessons Learned: Programmatic Gender Integration
Integrate gender from the inception of the project and undertake a robust gender analysis during the first year of
implementation. Integrating gender any later is too late, because how the project is implemented depends on a
sound understanding of and approach to addressing gender issues that affect men and women’s participation in
program activities.
Train staff on gender in the first year of the project so they gain a better understanding of gender issues in the
project context and appreciate why these issues are important to address through their daily work
responsibilities.
Hire staff with expertise in gender at the start of the project to ensure and oversee the integration of gender
across the project. These staff serve as stewards of gender integration in a project, but are not solely
responsible for its effective integration. Establishing a gender-focused position at a high enough level is also
important to provide the authority to direct and oversee how gender is integrated, and hold staff accountable.
Investing in such staff also reflects the commitment of the project to addressing gender issues.
Adopt a gender and development approach that engages men and women to promote gender equality and
transform gender relations in eastern DRC. Using a win-win approach in which men and women perceive gains
in shifting gender norms is also important to support sustainable change.
Integrate gender evenly and consistently across all project objectives to achieve the intended impact of
promoting gender equality and improving household food security.
Include gender in the development and implementation of an SBCC strategy to ensure that the relevant
audiences are engaged to shift normative beliefs and support the adoption of improved practices. Efforts to
engage the community through radio spots have been particularly successful. Key audiences that need to be
targeted include community gatekeepers and religious leaders.
Develop a project-wide plan aimed at anticipating and addressing sexual and gender-based violence and
protection issues as they are likely to arise over the life of a project.
3.4.2 GENDER IN AGRICULTURE, LIVELIHOODS, AND DISASTER RISK REDUCTION
Agriculture. Access to land for farming for men and women in eastern DRC is a particularly complex
issue as has been discussed throughout this report. Recent surveys for this region and partner experiences
suggest that access to land and land tenure are significant problems due to insecurity and instability,
resulting in disrupted food production. Women’s access to land is even more constrained than men’s
because they depend on men to gain access to land. Despite these challenges to land access, which were
evident in all cases even at the time of the ongoing projects’ baseline surveys, the projects have
emphasized improving farming practices over the life of these awards. It is important to note that under
the agriculture objective particularly, while men and women participated in these activities, the
monitoring indicators were not sex-disaggregated so it is difficult to measure the extent to which women
and men benefited relative to one another.
Livelihoods. Another important lesson learned is that challenges related to land access, particularly for
women, and the general instability in this region point to the need for a greater future emphasis on
productive off-farm livelihood activities. This diversification is important to sustain families during
periods of shocks and when they are unable to farm. Even from the efforts some partners made to
introduce village savings and loan activities targeted to women, partners noted that more needs to be done
in the area of skill-building (e.g., technical skills as well as managerial skills) so that recipients could
maximize the use of their loans and be more successful in their income-generation efforts. The current
projects have not included these activities and it is clear that, for both men and women, more support is
needed to make the most of this capital.
Disaster risk reduction. All of the ongoing projects implemented activities in disaster risk reduction,
which were intended to be implemented at the community level. No efforts were made to address the
specific vulnerabilities of men and women in disaster situations. This was an important gap, as men and
54
women in these communities experience disasters and shocks differently based on their resource access,
age, and social responsibilities. This suggests that future implementing partners should seek to implement
disaster risk reduction activities taking gendered vulnerabilities into account so that even community-
level activities can be tailored to meet the needs of men and women.
Lessons Learned: Gender in Agriculture, Livelihoods, and Disaster Risk Reduction
Negotiate the terms of land leases, taxes, and payments with chiefs, local leaders, and large landowners prior
to the start of agricultural activities. This is essential to protect both male and female farmers’ investments to
gain the most from their efforts to produce food and cash crops.
Adopt more sex-disaggregated indicators in these technical sectors to be able to track how well male and
female beneficiaries are doing over the course of the project.
Develop an explicit approach for off-farm income-generation activities that provides male and female
beneficiaries with associated necessary technical and managerial skills.
Integrate gender into disaster risk reduction activities, including by planning activities to address men’s and
women’s specific vulnerabilities during disasters.
3.4.3 GENDER IN MATERNAL AND CHILD HEALTH AND NUTRITION
Across the three projects, MCHN objectives predominantly engage women. Two of the projects have
sought to engage men as leader fathers on a very limited scale, primarily as a result of men asking to
participate in health and nutrition activities or because it was identified as a gap in the project midterm
evaluation, but this was not part of the original design. Male engagement in this aspect of programming is
important to enable and support women to adopt improved health and nutrition practices. Without the
support of men, the degree of change in practices is likely to be smaller and less sustained. One important
lesson learned from these interventions is that men (1) want to be engaged in health and nutrition
activities and (2) need to be engaged to ensure a strong enabling environment in which women feel
supported to adopt improved practices. In addition, male engagement is essential to mitigate the risks and
consequences related to sexual and gender-based violence and to expand and promote the uptake of
family planning. As noted previously, current partners feel that family planning is needed in these areas,
but any efforts to integrate family planning will need to engage men as key players in promoting the
adoption of modern family planning methods.
Lessons Learned: Gender in Maternal and Child Health and Nutrition
Develop an approach from the inception of a project to engage men, such as having leader fathers to work with
men to promote the adoption of family planning practices, improved nutrition practices, and efforts to mitigate
the risk of sexual and gender-based violence within and outside the home.
55
4. REFERENCES
ADRA. 2012. Annual Results Report FY 2012: JENGA/JAMAA 2 Program. P.L. 480 Title II Multi-Year
Assistance Program, FFP-A-11-00006. Goma, DRC. November 4.
———. 2012/2013. Final Baseline Report: JENGA/JAMAA 2 Program. P.L. 480 Title II Multi-Year
Assistance Program, FFP-A-11-00006. Prepared by TANGO International. Goma, DRC. Submitted June
26, 2012. Revised January 20, 2013.
———. 2013. Annual Results Report FY’2013: JENGA/JAMAA 2 Program. P.L. 480 Title II Multi-Year
Assistance Program, FFP-A-11-00006. Goma, DRC. Resubmitted December 4, 2013.
———. 2014. Annual Results Report FY’2014: JENGA/JAMAA 2 Program. P.L. 480 Title II Multi-Year
Assistance Program, FFP-A-11-00006. Goma, DRC. Submitted October 31, 2014.
Bhutta, Z.A. et al. 2013. “Evidence-Based Interventions for Improvement of Maternal and Child
Nutrition: What Can Be Done at What Cost?” The Lancet. Vol. 382, No. 9890, pp. 452–477.
Butcher, T. 2008. Blood River: A Journey to Africa’s Broken Heart. New York: Grove Press.
Carr, R.H. and Halsey, A.H. 1999. Land of a Thousand Hills: My Life in Rwanda. Middlesex, England:
Viking Penguin.
Cox, T.P. 2011. “Farming in the battlefield: the meanings of war, cattle, and soil in South Kivu,
Democratic Republic of the Congo.” Disasters. Vol. 35(4).
Devlin, Larry. 2007. Chief of Station, Congo: Fighting the Cold War in a Hot Zone. New York: Public
Affairs.
Dewey, K.G. and Adu-Afarwuah, S. 2008. “Systematic Review of the Efficacy and Effectiveness of
Complementary Feeding Interventions in Developing Countries.” Maternal and Child Nutrition. Vol. 4,
Supplement 1, pp. 24–85.
Duflo, E. et al. 2011. “Nudging Farmers to Use Fertilizer: Theory and Experimental Evidence from
Kenya.” American Economic Review. Vol. 101(6), pp. 2,350–2,390.
Edgerton, Robert. 2002. The Troubled Heart of Africa: A History of the Congo. New York: St. Martin's
Press.
Fermon, Y. 2008. “Étude de l’état des lieux de la partie nord du lac Tanganyika dans le cadre du
Programme Pêche d’Action Contre la Faim en République Démocratique du Congo.” Report for Action
Contre la Faim. Kalemie, DRC.
FEWS NET. 2015. DRC Literature Review.
FEWS NET. 2015a. Democratic Republic of the Congo: Staple Food Market Fundamentals. Washington,
DC: FEWS NET.
FEWS NET and WFP. 2012. Informal Cross Border Food Trade in Southern Africa. Issue 78.
Fintrac. 2010. USAID Food for Peace Democratic Republic of Congo Bellmon Estimation. Washington,
DC: Fintrac.
56
Food and Agriculture Organization of the United Nations (FAO). 2008. “Land access in rural Africa:
Strategies to fight gender inequality.” FAO-Dimitra workshop: Information and communication strategies
to fight gender inequality as regards land access and its consequences for rural populations in Africa,
Brussels, Belgium, September 22–26.
Food for the Hungry. 2012. Baseline Survey Report. P.L. 480 Title II Multi-Year Assistance Program,
FFP-A-11-00007. Bukavu, DRC.
———. 2013. Annual Results Report FY 2013. P.L. 480 Title II Multi-Year Assistance Program, FFP-A-
11-00007. Bukavu, DRC. Submitted November 4, 2013.
———. 2014a. Annual Results Report FY 2014. P.L. 480 Title II Multi-Year Assistance Program, FFP-
A-11-00007. Bukavu, DRC. Submitted November 3, 2014.
______. 2014b. Mid-Term Evaluation Report. P.L. 480 Title II Multi-Year Assistance Program, FFP-A-
11-00007. Bukavu, DRC. Submitted February 2014.
Food for the Hungry and International Institute for Tropical Agriculture (IITA). 2013. Value Chain
Analysis of Roots and Tubers, Bananas, Grain Legumes, and Cereals in north Katanga and South Kivu,
DR Congo
Hayes, K. et al. 2010. Promines Study: Artisinal Mining in the Democratic Republic of Congo. PACT.
Hochschild, Adam. 1998. King Leopold's Ghost: A Story of Greed, Terror, and Heroism in Colonial
Africa. Boston: Houghton Mifflin.
Humphrey, Jean H. 2009. “Child Undernutrition, Tropical Enteropathy, Toilets, and Handwashing.” The
Lancet. Vol. 374, pp. 1,032–35.
Institut National de la Statistique (INS) et Fonds des Nations Unies pour l’Enfance (UNICEF). 2011.
Enquête par Grappes à Indicateurs Multiples en République Démocratique du Congo (MICS-RDC 2010),
Rapport Final.
IRIN. 2011. “DRC: Keeping track of mineral resources.” IRIN, December 13.
http://www.irinnews.org/report/94465/drc-keeping-track-of-mineral-resources.
———. 2012. “Briefing: Crisis in North Kivu.” IRIN, July 10.
http://www.irinnews.org/report/95836/briefing-crisis-in-north-kivu.
———. 2015. “Why was the UN sidelined in ‘joint’ DRC operation against rebels?” IRIN, February 26.
http://www.irinnews.org/report/101164/why-was-the-un-sidelined-in-joint-drc-operation-against-rebels.
Jourdan, Luca. 2005. “New forms of political order in North Kivu. The case of the governor Eugene
Serufuli.” Paper presented at the conference, Beside the state: New forms of political power in post-
1990’s Africa, Milan, December.
Keita, M.L. 2012. Evaluation of the Baseline Situation in the RISE Intervention Area. P.L. 480 Title II
Multi-Year Assistance Program, FFP-A-11-00008. Final draft: August 31, 2012.
Log Cluster. 2013. “Logistics Capacity Assessment Wiki: Democratic Republic of Congo.” Available at
http://dlca.logcluster.org/display/public/DLCA/Democratic+Republic+of+Congo.
57
Mathys, Ellen and Remancus, Sandra. 2010. USAID Office of Food for Peace Food Security Country
Framework for the Democratic Republic of Congo FY 2011– FY 2015. Washington, DC: Food and
Nutrition Technical Assistance II Project (FANTA-2).
Mercy Corps. 2012. Annual Results Report FY’2012: SIMAMA Program. P.L. 480 Title II Multi-Year
Assistance Program, FFP-A-11-00008. Goma, DRC. Submitted November 3, 2012.
———. 2013. Annual Results Report FY’2013: SIMAMA Program. P.L. 480 Title II Multi-Year
Assistance Program, FFP-A-11-00008. Goma, DRC. Submitted November 4, 2013.
———. 2014. Annual Results Report FY’2014: SIMAMA Program. P.L. 480 Title II Multi-Year
Assistance Program, FFP-A-11-00008. Goma, DRC. Submitted November 3, 2014.
Ministère de l’Agriculture et du Développement Rural (MINAGRI). 2009. Etude du Secteur Agricole:
Rapport Bilan Diagnostic et Note d’Orientation. Tecsult International Limitee.
———. 2013. Democratic Republic of Congo Agriculture Investment Opportunities Brief: CAADP
Investment Facilitation Program.
Ministère du Plan et Macro International. 2008. Enquête Démographique et de Santé, République
Démocratique du Congo 2007. Maryland: Ministère du Plan et Macro International.
Ministère du Plan et Suivi de la Mise en oeuvre de la Révolution de la Modernité (MPSMRM), Ministère
de la Santé Publique (MSP), et ICF International. 2014. Enquête Démographique et de Santé en
République Démocratique du Congo 2013-2014. Maryland: MPSMRM, MSP, et ICF International.
Ministère de la Santé Publique (MSP). 2010. Plan National de Développement Sanitaire 2011–2015.
Mars 2010. Murphy, E.; Baudouin, M’Pia; and Wright, K. 2004. 2004 Bellmon Analysis Democratic
Republic of Congo. ACDI/VOCA, FHI, and World Vision.
Observatoire National des Transports. 2011. Annuaire Des Voies de Communication D’Interet General et
Secondaire. Annuaire. Kinshasa, DRC: Observatoire National des Transports.
Oxfam. 2015. ‘Secure Insecurity’ The continuing abuse of civilians in eastern DRC as the state extends
its control. Oxfam Briefing Paper. Oxford: Oxfam.
PACT. 2010. Artisanal Mining in the Democratic Republic of Congo.
Programme National de Nutrition (PRONANUT). 2008. Plan Directeur de Développement de Nutrition
en RDC 2009–2015.
Prunier, Gerald. 2009. Africa's World War: Congo, the Rwandan Genocide, and the Making of a
Continental Catastrophe. Oxford: Oxford University Press.
République Démocratique du Congo. 2002. Politique Nationale de Nutrition. Octobre 2002.
République Démocratique du Congo. 2013. Politique Nationale de Nutrition. Version 2013.
Rogers, Beatrice and Coates, Jennifer. 2015 (forthcoming). Sustaining Development: A Synthesis of
Results from a Study of Sustainability and Exit Strategies among FFP Development Food Assistance
Projects. Washington, DC: FHI 360/FANTA.
58
Rudolf, M. 2014. Assessing the Humanitarian Response to Chronic Crises in North Kivu. Goma, DRC:
Mercy Corps.
Sadiki, K. 2011. “Conflict and environmental insecurity in the North Kivu Province of DRC.” African
Journal on Conflict Resolution. Vol. 11.
Santos Rocha, J. and van den Berg, M. 2015a. Can one time provision of free input boost capital-
restricted farmers' adoption of agricultural technologies? Unpublished research. DRC: ADRA and
Wageningen University.
Santos Rocha, J. and van den Berg, M. 2015b. Can we make Farmer Field Schools more cost effective?
The experience of DRC. Unpublished research. DRC: ADRA and Wageningen University.
Slegh, H.; Barker, G.; Ruratotoye, B.; and Shand, T. 2012. Gender Relations, Sexual Violence and the
Effects of Conflict on Women and Men in North Kivu, Eastern Democratic Republic of Congo:
Preliminary Results of the International Men and Gender Equality Survey (IMAGES). Cape Town, South
Africa, and Washington, DC: Sonke Gender Justice Network and Promundo-US.
Spears, D. 2013. How Much International Variation in Child Height Can Sanitation Explain? Policy
Research Working Paper. The World Bank.
Sperling, L. 2012 Seed Security Assessment: Northern Katanga (Kalemie and Nyunzu Territories)
Democratic Republic of Congo. DRC. CIAT, CRS, University of East Anglia
Turner, T. 2007. The Congo Wars: Conflict, Myth and Reality. London, UK: Zed Books.
Ulimwengu, J.; Roberts, C.; and Randriamamonjy, J. 2012. “Resource-Rich Yet Malnourished: Analysis
for the Demand for Food Nutrients in the Democratic Republic of Congo.” IFPRI Discussion Paper
01154. Washington, DC. International Food Policy Research Institute.
UNHCR. 2014. “Hundreds of thousands of Congolese flee violence in Katanga province's triangle of
death.” UNHCR, November 18. http://www.unhcr.org/546b2c0a9.html.
UNICEF. 2014. “The State of the World's Children Report 2015 Statistical Tables.” Available at
http://www.data.unicef.org/resources/the-state-of-the-world-s-children-report-2015-statistical-tables.
USAID/DRC. 2010. Property Rights and Resource Governance: Democratic Republic of Congo.
USAID/FFP. 2010. USAID Food for Peace Democratic Republic of Congo Bellmon Estimation.
Washington, DC: Fintrac.
Volcano Discovery. “Nyamuragira Volcano.” Available at:
http://www.volcanodiscovery.com/volcanoes/africa/nyamuragira.html.
World Bank. 2010. Diagnostic Trade Integration Study: Preliminary Version.
World Food Programme (WFP). 2014. Democratic Republic of Congo: Comprehensive Food Security
and Vulnerability Analysis (CFSVA). Rome: WFP.
World Health Organization. 2007. Adolescent Pregnancy: Unmet Needs and Undone Deeds. Geneva:
World Health Organization.
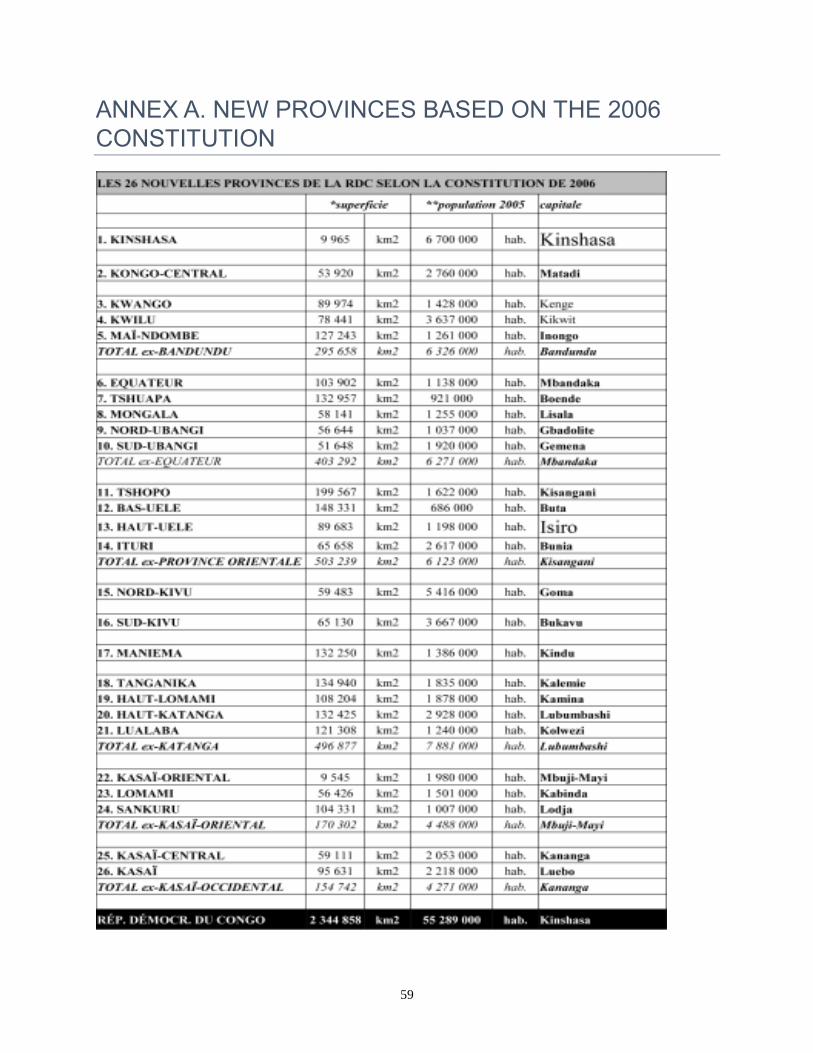
59
ANNEX A. NEW PROVINCES BASED ON THE 2006
CONSTITUTION
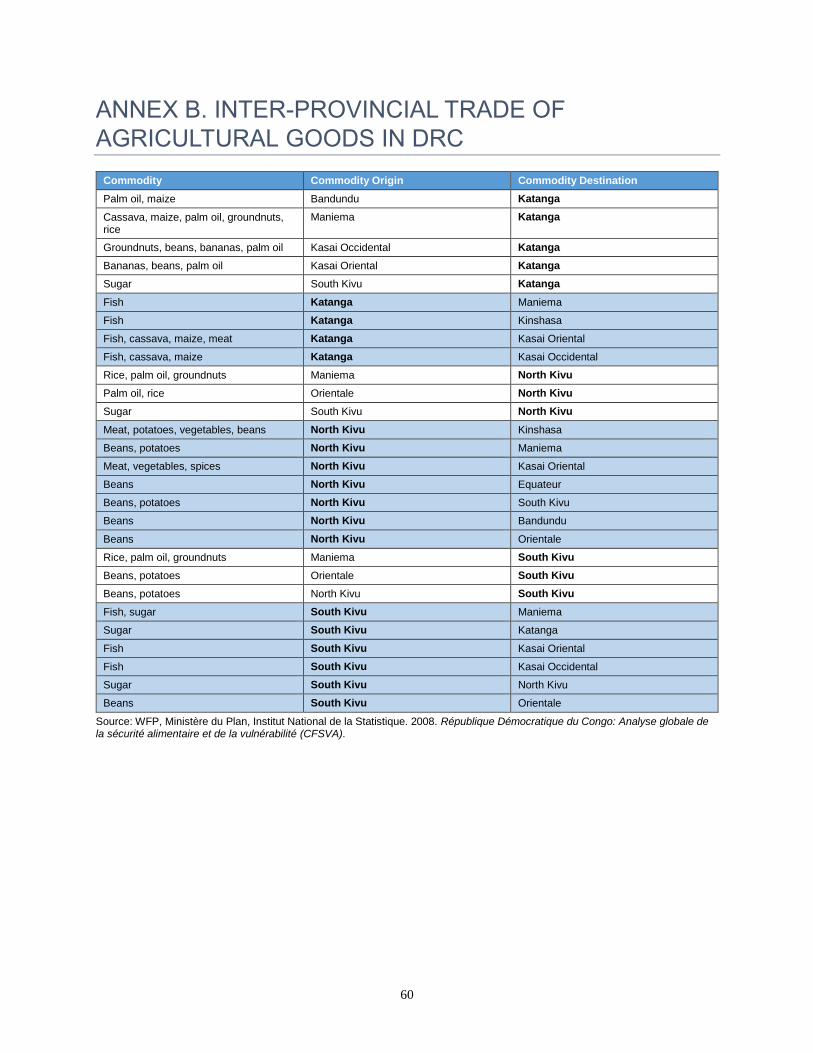
60
ANNEX B. INTER-PROVINCIAL TRADE OF
AGRICULTURAL GOODS IN DRC
Commodity Commodity Origin Commodity Destination
Palm oil, maize Bandundu Katanga
Cassava, maize, palm oil, groundnuts, rice
Maniema Katanga
Groundnuts, beans, bananas, palm oil Kasai Occidental Katanga
Bananas, beans, palm oil Kasai Oriental Katanga
Sugar South Kivu Katanga
Fish Katanga Maniema
Fish Katanga Kinshasa
Fish, cassava, maize, meat Katanga Kasai Oriental
Fish, cassava, maize Katanga Kasai Occidental
Rice, palm oil, groundnuts Maniema North Kivu
Palm oil, rice Orientale North Kivu
Sugar South Kivu North Kivu
Meat, potatoes, vegetables, beans North Kivu Kinshasa
Beans, potatoes North Kivu Maniema
Meat, vegetables, spices North Kivu Kasai Oriental
Beans North Kivu Equateur
Beans, potatoes North Kivu South Kivu
Beans North Kivu Bandundu
Beans North Kivu Orientale
Rice, palm oil, groundnuts Maniema South Kivu
Beans, potatoes Orientale South Kivu
Beans, potatoes North Kivu South Kivu
Fish, sugar South Kivu Maniema
Sugar South Kivu Katanga
Fish South Kivu Kasai Oriental
Fish South Kivu Kasai Occidental
Sugar South Kivu North Kivu
Beans South Kivu Orientale
Source: WFP, Ministère du Plan, Institut National de la Statistique. 2008. République Démocratique du Congo: Analyse globale de la sécurité alimentaire et de la vulnérabilité (CFSVA).
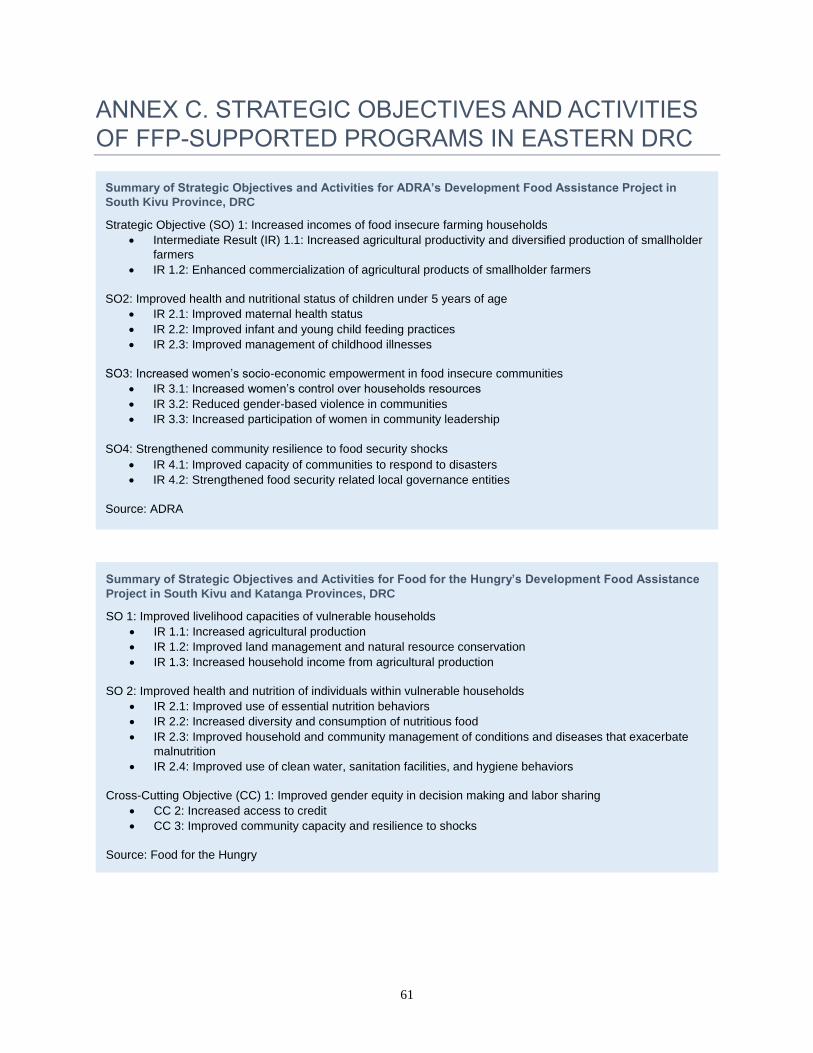
61
ANNEX C. STRATEGIC OBJECTIVES AND ACTIVITIES
OF FFP-SUPPORTED PROGRAMS IN EASTERN DRC
Summary of Strategic Objectives and Activities for ADRA’s Development Food Assistance Project in
South Kivu Province, DRC
Strategic Objective (SO) 1: Increased incomes of food insecure farming households
Intermediate Result (IR) 1.1: Increased agricultural productivity and diversified production of smallholder
farmers
IR 1.2: Enhanced commercialization of agricultural products of smallholder farmers
SO2: Improved health and nutritional status of children under 5 years of age
IR 2.1: Improved maternal health status
IR 2.2: Improved infant and young child feeding practices
IR 2.3: Improved management of childhood illnesses
SO3: Increased women’s socio-economic empowerment in food insecure communities
IR 3.1: Increased women’s control over households resources
IR 3.2: Reduced gender-based violence in communities
IR 3.3: Increased participation of women in community leadership
SO4: Strengthened community resilience to food security shocks
IR 4.1: Improved capacity of communities to respond to disasters
IR 4.2: Strengthened food security related local governance entities
Source: ADRA
Summary of Strategic Objectives and Activities for Food for the Hungry’s Development Food Assistance
Project in South Kivu and Katanga Provinces, DRC
SO 1: Improved livelihood capacities of vulnerable households
IR 1.1: Increased agricultural production
IR 1.2: Improved land management and natural resource conservation
IR 1.3: Increased household income from agricultural production
SO 2: Improved health and nutrition of individuals within vulnerable households
IR 2.1: Improved use of essential nutrition behaviors
IR 2.2: Increased diversity and consumption of nutritious food
IR 2.3: Improved household and community management of conditions and diseases that exacerbate
malnutrition
IR 2.4: Improved use of clean water, sanitation facilities, and hygiene behaviors
Cross-Cutting Objective (CC) 1: Improved gender equity in decision making and labor sharing
CC 2: Increased access to credit
CC 3: Improved community capacity and resilience to shocks
Source: Food for the Hungry
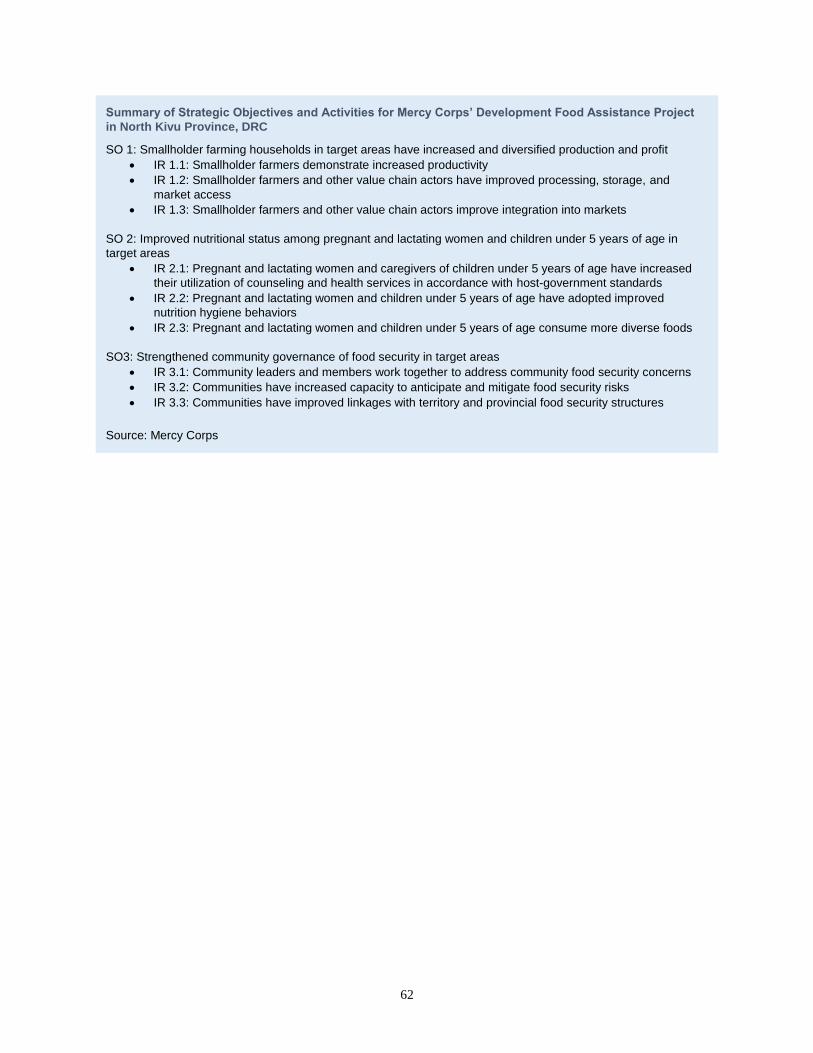
62
Summary of Strategic Objectives and Activities for Mercy Corps’ Development Food Assistance Project
in North Kivu Province, DRC
SO 1: Smallholder farming households in target areas have increased and diversified production and profit
IR 1.1: Smallholder farmers demonstrate increased productivity
IR 1.2: Smallholder farmers and other value chain actors have improved processing, storage, and
market access
IR 1.3: Smallholder farmers and other value chain actors improve integration into markets
SO 2: Improved nutritional status among pregnant and lactating women and children under 5 years of age in
target areas
IR 2.1: Pregnant and lactating women and caregivers of children under 5 years of age have increased
their utilization of counseling and health services in accordance with host-government standards
IR 2.2: Pregnant and lactating women and children under 5 years of age have adopted improved
nutrition hygiene behaviors
IR 2.3: Pregnant and lactating women and children under 5 years of age consume more diverse foods
SO3: Strengthened community governance of food security in target areas
IR 3.1: Community leaders and members work together to address community food security concerns
IR 3.2: Communities have increased capacity to anticipate and mitigate food security risks
IR 3.3: Communities have improved linkages with territory and provincial food security structures
Source: Mercy Corps
Recommended