U.S. Portfolio Holdings of
Foreign Securities
as of June 30, 2017
Department of the Treasury
Federal Reserve Bank of New York
Board of Governors of the Federal Reserve System
April 2018

Contents
Introduction 1
Chapter 1. Results of the June 30, 2017 Survey 3
Primary Findings from the Survey . . . . . . . . . . . . . . . . . . . . . . 3
Exhibit 1: Foreign holdings of U.S. securities by security type, as of selected
survey dates . . . . . . . . . . . . . . . . . . . . . . . . . . 3
Exhibit 1T: Foreign holdings of U.S. securities, by type of security, as of end-
June, selected survey dates (table) . . . . . . . . . . . . . . . . . 4
Shares of U.S. Long-Term Securities That Are Foreign-Owned. . . . . . . . . . . 5
Exhibit 2: Foreign and U.S. holdings of U.S. long-term securities by security
type and share outstanding, as of end-June, selected survey dates. . . . 6
Accounting for Year-to-Year Changes in Foreign Holdings of U.S. Securities . . . . . 7
Exhibit 3: Accounting for changes in foreign holdings of U.S. long-term secu-
rities, by type of security . . . . . . . . . . . . . . . . . . . . . 8
Foreign Holdings of U.S. Securities as Measured by TIC SLT and Annual Survey
Reports . . . . . . . . . . . . . . . . . . . . . . . . . . . . . . . . 9
Exhibit 4: Foreign holdings of long-term U.S. securities as measured by the
survey of portfolio holdings and the TIC SLT, by type of security, as of
June 30, 2017 . . . . . . . . . . . . . . . . . . . . . . . . . 10
Comparison with U.S. Holdings of Foreign Long-Term Securities . . . . . . . . . . 11
Exhibit 5: Net asset position in long-term securities of U.S. residents as of
end-June, selected survey dates . . . . . . . . . . . . . . . . . . 12
i
Foreign Holdings of U.S. Securities by Country of Holder . . . . . . . . . . . . . 12
Exhibit 6: Value of foreign holdings of U.S. securities, by major investing
country and type of security, as of June 30, 2017 . . . . . . . . . . 13
Exhibit 7: Foreign holdings of U.S. long-term corporate and agency debt by
type, as of end-June, selected survey dates . . . . . . . . . . . . . 15
Holdings by Country in the Two Most Recent Surveys . . . . . . . . . . . . . . 15
Exhibit 8: Market value of foreign holdings of U.S. securities by major invest-
ing countries, as of June 30, 2017 . . . . . . . . . . . . . . . . . 16
Holdings of U.S. Securities by Foreign Official Institutions . . . . . . . . . . . . 16
Exhibit 9: Foreign holdings of U.S. long-term securities by type of holder and
security, as of end-June, selected survey dates . . . . . . . . . . . . 17
Exhibit 10: Foreign holdings of U.S. short-term securities by security type, as
of end-June, selected survey dates . . . . . . . . . . . . . . . . . 19
Details on Foreign Holdings of Different Types of U.S. Securities. . . . . . . . . . 20
Foreign Holdings of U.S. Treasury Securities, by Type of Security . . . . . . . 20
Exhibit 11: Foreign holdings of U.S. Treasuries by major investing country,
as of June 30, 2017 . . . . . . . . . . . . . . . . . . . . . . . 21
Foreign Holdings of Equities by Type . . . . . . . . . . . . . . . . . . . 21
Exhibit 12: Foreign holdings of U.S. equities by major investing country and
type of equity, as of June 30, 2017 . . . . . . . . . . . . . . . . 22
Foreign Holdings of Corporate Asset-Backed Securities . . . . . . . . . . . . 23
Exhibit 13: Value of foreign holdings of U.S. long-term corporate asset-backed
securities, by major investing country and type, as of June 30, 2017 . . 23
ii

Portfolio Investment by Region of Investor Country and Survey Year . . . . . . 24
Exhibit 14: Foreign holdings of U.S. long-term securities, by region, as of
end-June, selected survey dates . . . . . . . . . . . . . . . . . . 25
Maturity Structure of Foreign Holdings of U.S. Long-Term Debt Securities . . . 26
Exhibit 15: Maturity structure of foreign holdings of long-term U.S. debt
securities . . . . . . . . . . . . . . . . . . . . . . . . . . . 26
Currency Composition of Foreign Holdings of U.S. Debt Securities . . . . . . . 27
Exhibit 16. Foreign holdings of U.S. debt securities, by currency, as of June
30, 2017 . . . . . . . . . . . . . . . . . . . . . . . . . . . 27
Exhibit 17. Distribution of foreign holdings of U.S. long-term debt securities
by currency, as of end-June, selected survey dates . . . . . . . . . . 28
Foreign Holdings of U.S. Securities by Industry of Issuer . . . . . . . . . . . 28
Exhibit 18: Market value of foreign holdings of U.S. securities, by industry,
as of June 30, 2017 . . . . . . . . . . . . . . . . . . . . . . . 29
Comparison of Different Types of Foreign Portfolio Investment in the United
States as of Selected Dates . . . . . . . . . . . . . . . . . . . . . . 30
Exhibit 19: Forms of foreign portfolio investment in the United States as of
selected survey dates. . . . . . . . . . . . . . . . . . . . . . . 30
Exhibit 19T: Forms of foreign portfolio investment in the United States, as of
selected survey dates (table) . . . . . . . . . . . . . . . . . . . 31
Chapter 2. Survey Methodology 32
Data Collection Methodology. . . . . . . . . . . . . . . . . . . . . . . . . 32
Data Analysis and Editing . . . . . . . . . . . . . . . . . . . . . . . . . . 32
iii

Adjustments and Calculation of Total Foreign Holdings of U.S. Securities . . . . . . 33
Exhibit 20: Adjustments to data to account for over-reporting and for re-
porters omitted from annual panel, as of June 30, 2017 . . . . . . . 34
Treatment of Repurchase and Securities Lending Agreements . . . . . . . . . . . 35
Acknowledgements . . . . . . . . . . . . . . . . . . . . . . . . . . . . . 36
Appendix A: Statistical Appendix A-1
Table A1. Value of foreign holdings of U.S. securities, by country and type of security,
as of June 30, 2017 . . . . . . . . . . . . . . . . . . . . . . . . . . . A-2
Table A2. Value of foreign holdings of U.S. long-term securities, by country and type
of security, as of June 30, 2017 . . . . . . . . . . . . . . . . . . . . . . A-8
Table A3. Value of foreign holdings of U.S. Treasury debt securities, by country and
type of Treasury security, as of June 30, 2017 . . . . . . . . . . . . . . . . A-14
Table A4. Value of foreign holdings of U.S. equity, by country and type of equity, as
of June 30, 2017 . . . . . . . . . . . . . . . . . . . . . . . . . . . . A-19
Table A5. Foreign holdings of U.S. long-term asset-backed securities, by country and
type of security, as of June 30, 2017 . . . . . . . . . . . . . . . . . . . . A-25
Table A6. Foreign holdings of U.S. short-term securities, by country and type of
security, as of June 30, 2017 . . . . . . . . . . . . . . . . . . . . . . . A-29
Table A7. Foreign holdings of U.S. securities, by country, as of selected survey dates . A-33
Table A8. Foreign holdings of U.S. equity, by country, as of selected survey dates . . A-39
Table A9. Foreign holdings of U.S. long-term debt securities, by country, as of selected
survey dates . . . . . . . . . . . . . . . . . . . . . . . . . . . . . . A-45
Table A10. Foreign holdings of U.S. short-term debt securities, by country, as of
selected survey dates . . . . . . . . . . . . . . . . . . . . . . . . . . A-51
Table A11. Foreign holdings of U.S. securities, by industry, as of June 30, 2017 . . . A-56
iv

Appendix B: Data for Exhibits Shown in Graphical Form B-1
Data for Exhibit 1: Foreign holdings of U.S. securities by security type, as of selected
survey dates . . . . . . . . . . . . . . . . . . . . . . . . . . . . . . B-2
Data for Exhibit 2: Foreign and U.S. holdings of U.S. long-term securities by security
type and share outstanding, as of end-June, selected survey dates . . . . . . . B-3
Data for Exhibit 5: Net asset position in long-term securities of U.S. residents, as of
end-June, selected survey dates . . . . . . . . . . . . . . . . . . . . . . B-4
Data for Exhibit 7: Foreign holdings of U.S. long-term corporate and agency debt, by
type, as of end-June, selected survey dates . . . . . . . . . . . . . . . . . B-5
Data for Exhibit 8: Foreign holdings of U.S. securities, by major investing country, as
of June 30, 2017 and June 30, 2016 . . . . . . . . . . . . . . . . . . . . B-6
Data for Exhibit 9: Foreign holdings of U.S. long-term securities, by type of holder
and security, as of end-June, selected survey dates . . . . . . . . . . . . . . B-7
Data for Exhibit 10: Foreign holdings of U.S. short-term securities, by type of holder
and security, as of end-June, selected survey dates . . . . . . . . . . . . . . B-8
Data for Exhibit 11: Foreign holdings of U.S. Treasury securities, by major investing
country, as of June 30, 2017 . . . . . . . . . . . . . . . . . . . . . . . B-9
Data for Exhibit 12: Foreign holdings of U.S. equities, by major investing country and
type of equity, as of June 30, 2017. . . . . . . . . . . . . . . . . . . . . B-10
Data for Exhibit 15. Maturity structure of foreign holdings of long-term U.S debt
securities . . . . . . . . . . . . . . . . . . . . . . . . . . . . . . . B-11
Appendix C: Forms and Instructions C-1
v

IntroductionThis report presents data and analysis of foreign portfolio investment in U.S. securities
based primarily on the Treasury International Capital (TIC) survey of foreign holdings of
U.S. securities as of June 30, 2017.1 TIC data collections are a joint undertaking of the U.S.
Treasury Department, the Federal Reserve Bank of New York, and the Board of Governors
of the Federal Reserve System.2 From 1974 to 2000, benchmark surveys of foreign portfolio
investment in U.S. securities were conducted at approximately five-year intervals.3 Those
surveys, collected from a comprehensive panel of reporters, measured foreign holdings only
of long-term U.S. securities.4 Since 2002, the surveys have improved in two ways. First,
in addition to the benchmark surveys, which have continued at five-year intervals, annual
surveys have been conducted as of the end of June. Second, surveys now measure foreign
holdings of U.S. short-term securities as well as those of long-term securities. In the four
years following each benchmark survey, the annual surveys collect data primarily from the
largest reporters, who collectively reported at least 95 percent of the market value of foreign
holdings as measured by the preceding benchmark survey. Since 2013, the annual survey
panel has been adjusted each year based on reporting from TIC form SLT, “Aggregate
Holdings of Long-Term Securities by U.S. and Foreign Residents.” The June 2014 survey
was a benchmark survey; the next full benchmark survey is planned for June 2019.
The surveys collect data at the individual security level, allowing for analysis along a variety
of dimensions, including country of foreign holder, currency, security type, remaining matu-
rity, type of foreign holder, and industry of issuer. In addition, the security-level detail allows
for extensive data review and for correction of errors that might otherwise go undetected.
Chapter 2 discusses details of the survey collection methodology and the procedures used
for data review and analysis.
The surveys are conducted under the authority of the International Investment and Trade
1 Foreign portfolio investment in U.S. securities, for the purposes of this report, includes all U.S. securitiesowned by foreign residents except where the owner has a direct investment relationship with the U.S.issuer of the securities. “Direct investment” means the ownership or control, directly or indirectly, byone person or by a group of affiliated persons, of 10 percent or more of the voting stock of a businessenterprise. See “direct investment” in the TIC Glossary athttp://ticdata.treasury.gov/Publish/ticglossary-2018march.pdf.
2 For earlier survey reports and historical data files, see the TIC Securities (C) webpage athttp://www.treasury.gov/resource-center/data-chart-center/tic/Pages/fpis.aspx.
3 Prior to 1974, surveys were conducted in 1853, 1869, and 1941 by the Department of the Treasury and in1934 and 1937 by the Department of Commerce.
4 Long-term securities are defined as those without a stated maturity date (such as equities) or with anoriginal term-to-maturity greater than one year.
1
in Services Survey Act (22 U.S.C. 3101 et seq.). Reporting is mandatory for all institutions
meeting the survey reporting criteria, and significant penalties can be imposed for failure
to report. All holdings are measured at market value as of the survey dates. With the
exception of zero-coupon debt securities, all market values reflect “clean” prices, that is,
excluding accrued interest.5
The surveys are part of the U.S. system to measure portfolio investment into and out of the
United States, known as the Treasury International Capital (TIC) reporting system. This
data system is based on location, so the transactions and positions are reported between
U.S. residents and residents of foreign countries and areas. In addition to surveys of foreign
ownership of U.S. securities conducted annually as of the end of June, the TIC system also
conducts annual surveys of U.S. holdings of foreign securities as of the end of December.
The TIC system also collects aggregate monthly data on cross-border securities transactions
and holdings; these data allow for more frequent and timely analysis. The TIC S form,
“Purchases and Sales of Long-Term Securities by Foreign Residents,” collects monthly data
on U.S. residents’ cross-border transactions in long-term securities. The TIC form SLT has,
since late 2011, collected monthly aggregate data on foreign holdings of U.S securities and
U.S. holdings of foreign securities.6
Acknowledgments
The Department of the Treasury, the Federal Reserve Bank of New York and the Board of
Governors of the Federal Reserve System wish to express their appreciation to all survey
respondents whose efforts and information have made this report possible.
5 While the IMF’s Balance of Payments Manual 6 (BPM6) indicates that “dirty” prices (which includeaccrued interest) are preferred, the TIC system uses clean prices because they are more readily availableto respondents and data compilers.
6 The TIC data are published monthly on the Department of the Treasury’s website athttp://www.treasury.gov/resource-center/data-chart-center/tic/Pages/index.aspx. Detailed informationon the methodologies employed by the monthly transactions system and the annual surveys, as well as adiscussion of the introduction of the TIC form SLT can be found in articles posted on the same website athttp://www.treasury.gov/resource-center/data-chart-center/tic/Pages/articles.aspx. See also C. Bertaut,W. Griever, and R. Tryon, “Understanding U.S. Cross-Border Securities Data,” Federal Reserve Bulletin,May 2006, 59-75; E. Brandner, F. Cai, and R. Judson, “Improving the Measurement of Cross-BorderSecurities Holdings: The Treasury International Capital SLT,” Federal Reserve Bulletin, May 2012, 1-28.
2

Chapter 1. Results of the June 30, 2017 Survey
Primary Findings from the Survey
The survey measured foreign holdings of U.S. securities as of June 30, 2017 at $18,412 billion,
a sizeable gain from the previous survey as of June 30, 2016. Of these foreign holdings of
U.S. securities, $17,481 billion were U.S. long-term securities (equities or debt securities with
original term-to-maturity greater than one year), and $930 billion were U.S. short-term debt
securities (Exhibit 1).7
7,778
9,772
10,322
9,641
10,691
12,440
13,261
14,410
16,417
17,134 17,139
18,412
0
5,000
10,000
15,000
20,000
Bill
ions
of d
olla
rs
2006
2007
2008
2009
2010
2011
2012
2013
2014
2015
2016
2017
Total U.S. securities
2,430
4,733
615
3,130
6,007
635
2,969
6,494
858
2,252
6,240
1,149
2,814
6,921
956
3,830
7,731
878
4,237
8,213
811
5,070
8,462
878
6,356
9,183
878
6,655
9,547
932
6,186
10,044
909
7,189
10,292
930
0
5,000
10,000
15,000
20,000
Bill
ions
of d
olla
rs
2006
2007
2008
2009
2010
2011
2012
2013
2014
2015
2016
2017
Total U.S. securities by type
Short−term debtLong−term debtEquities
1,727
984
2,021
1,965
1,304
2,738
2,211
1,464
2,820
2,604
1,196
2,440
3,343
1,086
2,493
4,049
1,031
2,651
4,673
991
2,549
4,916
874
2,672
5,382
827
2,974
5,450
880
3,217
5,585
954
3,505
5,468
980
3,844
0
2,000
4,000
6,000
8,000
10,000
Bill
ions
of d
olla
rs
2006
2007
2008
2009
2010
2011
2012
2013
2014
2015
2016
2017
Long−term U.S. debt
CorporateU.S. agencyU.S. Treasury
253
147
215
229
109
297
379
174
306 862
90
197
743
61
152
658
43
177
63729
145
67925
173
633
42
203
697
49
186
68332
195
67817
236
0
500
1,000
1,500
Bill
ions
of d
olla
rs
2006
2007
2008
2009
2010
2011
2012
2013
2014
2015
2016
2017
Short−term U.S. debt
CorporateU.S. agencyU.S. Treasury
by security type, as of selected survey dates
Exhibit 1: Foreign holdings of U.S. securities
7 Data in this exhibit and subsequent exhibits for prior years may differ in several ways from previousreports due to slight revisions. Data for all exhibits are available athttps://www.treasury.gov/resource-center/data-chart-center/tic/Pages/fpis.aspx. Data for graphicalexhibits are provided in table form in Appendix B.
3

Overall foreign holdings of U.S securities increased on net 7.4 percent. Foreign holdings
of equities reversed losses from the previous year, increasing by $1,003 billion to a level of
$7,189 billion. Foreign holdings of long-term debt securities rose by $248 billion between
the two surveys to reach $10,292 billion in June 2017. This increase is primarily due to
larger holdings of long-term U.S. corporate debt, which increased by $339 billion to a level
of $3,844 billion. In addition, holdings of U.S agency debt rose by $26 billion, marking the
third year of increasing foreign holdings of long-term U.S. agency securities after a steady
decline from $1,464 billion in June 2008 to $827 billion in June 2014. In contrast, foreign
holdings of long-term U.S. Treasury securities decreased by $117 billion to $5,468 billion, the
first June-to-June decline since annual surveys began in 2002. As discussed in more detail
below and outlined in Exhibit 3, valuation changes contributed importantly to some of these
developments. In particular, valuation gains were an important factor in the large increase
in foreign holdings of equity, while valuation losses associated with the rise in Treasury yields
contributed significantly to the decrease in foreign holdings of Treasuries.
Exhibit 1T: Foreign holdings of U.S. securities, by type of security, as of end-June, selectedsurvey dates
Billions of dollars
2010 2011 2012 2013 2014 2015 2016 2017
Long-term securities 9,736 11,561 12,451 13,532 15,539 16,202 16,230 17,481
Equities1 2,814 3,830 4,237 5,070 6,356 6,655 6,186 7,189
Debt 6,921 7,731 8,213 8,462 9,183 9,547 10,044 10,292
U.S. Treasury 3,343 4,049 4,673 4,916 5,382 5,450 5,585 5,468
U.S. agency2 1,086 1,031 991 874 827 880 954 980
Corporate3 2,493 2,651 2,549 2,672 2,974 3,217 3,505 3,844
Short-term debt 956 878 811 878 878 932 909 930
U.S. Treasury 743 658 637 679 633 697 683 678
U.S. agency2 61 43 29 25 42 49 32 17
Corporate3 152 177 145 173 203 186 195 236
Total 10,691 12,440 13,261 14,410 16,417 17,134 17,139 18,412
1. Equities include common and preferred stock; all types of investment company shares, such as open-end
funds, closed-end funds, money market mutual funds, and hedge funds; interests in limited partnerships
and other equity interests that may not involve stocks or shares.
2. Agencies include U.S. government agencies and corporations as well as federally sponsored enterprises,
such as the Federal National Mortgage Association.
3. Corporate debt includes all other non-Treasury and non-agency debt, such as certificates of deposit with
a maturity of over one year, and U.S. municipal debt securities.
Note: In this and subsequent tables, components may not sum to totals due to rounding.
4

Foreign holdings of U.S. short-term securities edged up between the June 2016 and June
2017 surveys by $21 billion, to $930 billion. Foreign holdings of U.S. Treasury bills and
certificates fell by $5 billion to $678 billion. The decrease in short-term Treasury holdings
was more than offset by a $41 billion increase in holdings of short-term corporate debt, to
$236 billion. Similar to last year, foreign holdings of short-term U.S. agency debt decreased
by $15 billion.
Shares of U.S. Long-Term Securities That Are Foreign-Owned
Exhibit 2 shows foreign holdings of U.S. long-term securities as an estimated share of the
total stock outstanding of each security type as of the survey dates. These figures should be
viewed as rough indicators, as it is not possible to obtain data on the total value outstanding
by security type on exactly the same basis as the survey data. For example, while the
charts show the face value outstanding of each type of U.S. long-term debt security, foreign
ownership of these U.S. long-term debt securities is presented at market value. Moreover,
the “equities” category includes foreign holdings of common and preferred stock; all types of
investment company shares, such as open-end funds, closed-end funds, money market mutual
funds, and hedge funds; and interests in limited partnerships and other equity interests that
may not involve stocks or shares. It is difficult to know how much of some of these types of
equity is outstanding. Thus, although the following comparisons will be somewhat imprecise,
they do indicate long-term trends.
At $17,481 billion, foreign holdings of U.S. long-term securities reached a record high, but
as the total outstanding grew at roughly the same rate, the proportion of U.S. long-term
securities outstanding held by foreigners was about unchanged at 21 percent between June
2016 and June 2017. However, the composition of foreign holdings of U.S. long-term securities
relative to the quantity outstanding shifted a bit.
5

7.2
39.6
9.1
44.8
9.5
42.8
8.5
38.6
9.7
40.6
11.6
46.5
12.5
46.9
13.5
52.3
15.5
59.0
16.2
61.2
16.2
61.3
17.5
66.9
0
20
40
60
80
Tril
lions
of d
olla
rs
2006
2007
2008
2009
2010
2011
2012
2013
2014
2015
2016
2017
Total long−term securities
U.S.−ownedForeign−owned
0
10
20
30
40
50
60
70
80
90
100
Per
cent
age
2006
2007
2008
2009
2010
2011
2012
2013
2014
2015
2016
2017
Total long−termTreasury debtAgency debtCorporate debtEquities
Share of Securities Outstanding Held by Foreign Residents
1.7
1.6
2.0
1.5
2.2
1.4
2.6
2.0
3.3
3.0
4.0
3.8
4.7
4.3
4.9
4.9
5.4
5.3
5.4
5.9
5.6
6.3
5.5
6.8
0
5
10
15
Tril
lions
of d
olla
rs
2006
2007
2008
2009
2010
2011
2012
2013
2014
2015
2016
2017
Source: Monthly Statement of the Public Debt of the United States, Table 1, Summary of TreasurySecurities Outstanding, Total Marketable less Bills. Includes holdings of the Federal ReserveSystem.
Treasury debt
U.S.−ownedForeign−owned
1.0
4.7
1.3
5.0
1.5
5.6
1.2
6.1
1.1
6.0
1.0
6.0
1.0
6.1
0.9
6.3
0.8
6.4
0.9
6.5
1.0
6.8
1.0
7.2
0
2
4
6
8
10
Tril
lions
of d
olla
rs
2006
2007
2008
2009
2010
2011
2012
2013
2014
2015
2016
2017
Source: Federal Reserve Statistical Release Z.1, Financial Accounts of the United States, and consolidatedbalance sheets of Freddie Mac, Fannie Mae, and the combined Federal Home Loan Banks. The long−termoutstanding amounts are the total long−term and short−term U.S. Government agency liabilities from Flow of Funds Table L211, row 1, minus short−term debt securities outstanding issued by Freddie Mac, Fannie Mae, and the combined Federal Home Loan Banks. These short−term debt securities outstanding wereapproximately $530 billion as of June 2017. U.S. government agency securities include all securitiesissued by federally−sponsored agencies and corporations, as well as all securities guaranteed by theGovernment National Mortgage Association (GNMA). Amounts outstanding include those held by the FederalReserve System.
Agency debt
U.S.−ownedForeign−owned
2.0
8.5
2.7
8.9
2.8
9.5
2.4
9.8
2.5
9.2
2.7
9.1
2.5
9.2
2.7
9.1
3.0
9.1
3.2
9.2
3.5
9.1
3.8
9.0
0
5
10
15
Tril
lions
of d
olla
rs
2006
2007
2008
2009
2010
2011
2012
2013
2014
2015
2016
2017
Source: Federal Reserve Statistical Release Z.1, Financial Accounts of the United States,Table L213 row 1, minus Table L133 row 27, plus Table L107 row 21.
Corporate debt
U.S.−ownedForeign−owned
2.4
24.8
3.1
29.4
3.0
26.3
2.3
20.6
2.8
22.4
3.8
27.7
4.2
27.4
5.1
32.0
6.4
38.2
6.7
39.5
6.2
39.0
7.2
44.0
0
10
20
30
40
50
Tril
lions
of d
olla
rs
2006
2007
2008
2009
2010
2011
2012
2013
2014
2015
2016
2017
Source: Federal Reserve Statistical Release Z.1, Financial Accounts of the United States, Table L223 row 1,minus Table L133 row 37, plus Table L122 row 1, plus Table L206 row 1
Equities
U.S.−ownedForeign−owned
by security type and share outstanding, as of end−June, selected survey dates
Exhibit 2: Foreign and U.S. holdings of U.S. long−term securities
6

The share of marketable long-term Treasuries held by foreigners dropped 2.3 percentage
points, from 46.8 percent to 44.5 percent, the lowest share since the 2002 survey. Foreign
holdings of U.S. Treasury securities rose strongly during the global financial crisis, with the
foreign ownership share reaching 60.8 percent in 2008. Following the crisis, issuance of these
securities was also unusually large, and as a result, the share held by foreign investors declined
to 51.9 percent by 2011. The proportion of U.S. Treasury securities owned by foreigners
remains higher than the foreign share for other long-term securities largely because of the
large holdings of foreign official institutions, discussed in greater detail below and shown in
Exhibit 9. Foreign investors owned 12.0 percent of agency securities, about unchanged since
the post-crisis trough of 11.4 percent in June 2014. In contrast to the declining or stable
foreign ownership shares of U.S. government-issued securities, the foreign ownership share
of corporate debt securities has been trending up, rising from 21.8 percent in June 2012 to
30.0 percent in June 2017.8 During the same time period, corporate debt issuance, including
issuance abroad, has also been elevated. The share of foreign holdings of equities was 14.1
percent in June 2017, about the same as in the past few years.
Accounting for Year-to-Year Changes in Foreign Holdings of U.S.
Securities
Exhibit 3 decomposes the change in the value of foreign holdings of U.S. long-term securities
between June 2016 and June 2017, shown in column 3, into four components: net purchases of
U.S. long-term securities during the period based on reported transactions on the TIC form S
(column 4); estimated stock swaps (column 5); principal repayments for agency and corporate
asset-backed securities (ABS) (also column 5); and estimated valuation adjustments (column
6).9 Column 7 is the residual change in holdings not explained by any of the other four
factors.
8 Of the $3,844 billion held by foreigners in the “Corporate debt” category, nearly all of the securities areissued by corporations. About $22 billion consists of negotiable certificates of deposit with a maturity ofover one year, and about $83 billion represents foreign holdings of state and local government debtsecurities. Foreign investors also held small amounts of debt issued by nonprofit organizations. In thisreport, this category frequently will be referred to simply as “corporate debt.”
9 When a foreign company acquires a U.S. company and the deal is financed in part through an exchangeof equity, or a stock swap, U.S. residents who held stock in the target company become holders of foreignequity. Likewise, if a U.S. company acquires a foreign company, a stock swap can increase foreignholdings of U.S. equity.
7
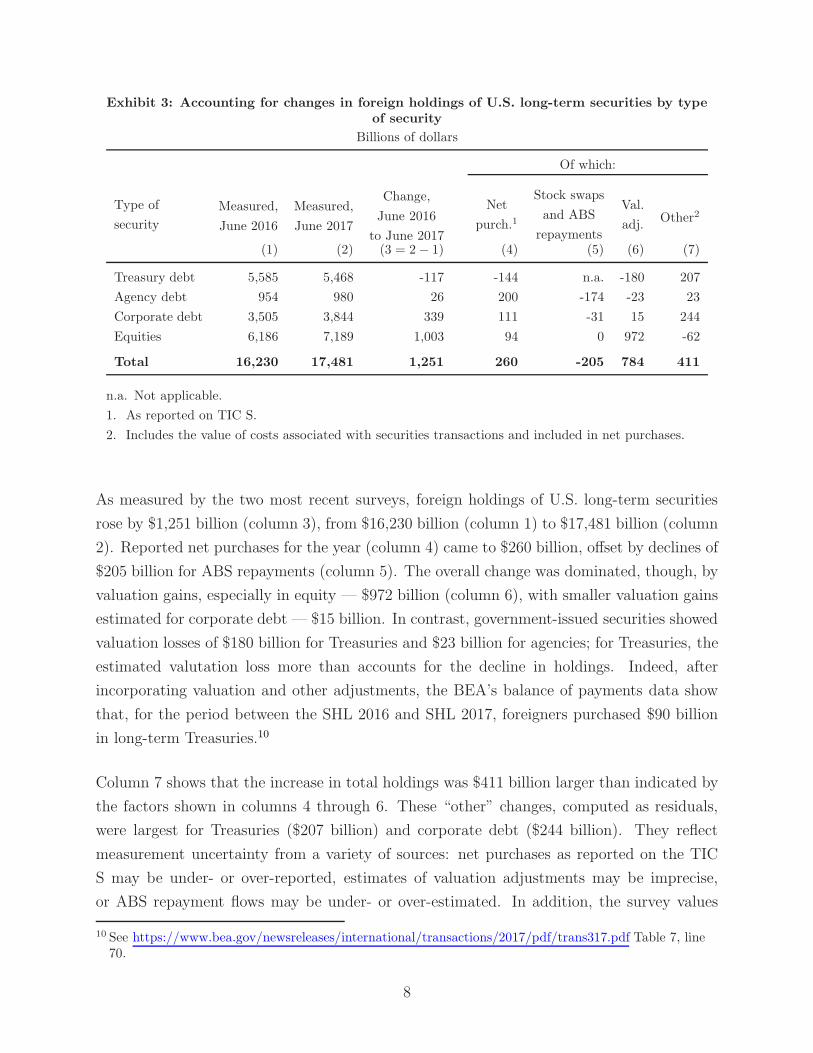
Exhibit 3: Accounting for changes in foreign holdings of U.S. long-term securities by typeof security
Billions of dollars
Of which:
Type of
security
Measured,
June 2016
Measured,
June 2017
Change,
June 2016
to June 2017
Net
purch.1
Stock swaps
and ABS
repayments
Val.
adj.Other2
(1) (2) (3 = 2− 1) (4) (5) (6) (7)
Treasury debt 5,585 5,468 -117 -144 n.a. -180 207
Agency debt 954 980 26 200 -174 -23 23
Corporate debt 3,505 3,844 339 111 -31 15 244
Equities 6,186 7,189 1,003 94 0 972 -62
Total 16,230 17,481 1,251 260 -205 784 411
n.a. Not applicable.
1. As reported on TIC S.
2. Includes the value of costs associated with securities transactions and included in net purchases.
As measured by the two most recent surveys, foreign holdings of U.S. long-term securities
rose by $1,251 billion (column 3), from $16,230 billion (column 1) to $17,481 billion (column
2). Reported net purchases for the year (column 4) came to $260 billion, offset by declines of
$205 billion for ABS repayments (column 5). The overall change was dominated, though, by
valuation gains, especially in equity — $972 billion (column 6), with smaller valuation gains
estimated for corporate debt — $15 billion. In contrast, government-issued securities showed
valuation losses of $180 billion for Treasuries and $23 billion for agencies; for Treasuries, the
estimated valutation loss more than accounts for the decline in holdings. Indeed, after
incorporating valuation and other adjustments, the BEA’s balance of payments data show
that, for the period between the SHL 2016 and SHL 2017, foreigners purchased $90 billion
in long-term Treasuries.10
Column 7 shows that the increase in total holdings was $411 billion larger than indicated by
the factors shown in columns 4 through 6. These “other” changes, computed as residuals,
were largest for Treasuries ($207 billion) and corporate debt ($244 billion). They reflect
measurement uncertainty from a variety of sources: net purchases as reported on the TIC
S may be under- or over-reported, estimates of valuation adjustments may be imprecise,
or ABS repayment flows may be under- or over-estimated. In addition, the survey values
10 See https://www.bea.gov/newsreleases/international/transactions/2017/pdf/trans317.pdf Table 7, line70.
8

themselves may be somewhat imprecise due to missed reporting or reporting errors. Finally,
reported transactions may include transaction costs as well as the cost of securities purchased
or sold.
The difference in column 7 for Treasuries may in part be attributable to cross-border short
sales of Treasuries between U.S. and foreign investors.11 Short sales in which foreign investors
borrow Treasuries from U.S. residents and then sell those securities to other U.S. residents
may result in larger reported net sales on the TIC S form because any initial borrowing of
Treasury securities by U.S. investors is not reported on the TIC S form. Securities borrowing
or lending activity is not a change in actual ownership and thus is not reportable as a
securities transaction. However, all sales of securities (whether initially borrowed or not)
are reportable simply as sales.12 As indicated in column 7, the large gap between reported
holdings on the SHL and reported transactions on the TIC S for corporate debt, $244 billion,
is likely the result of two factors, both mentioned above. First, valuation change is difficult
to estimate and as such is a potential source of mismeasurement. Second, sales of corporate
bonds to foreigners, especially at issuance, may well be underreported on the TIC S. When
issuance of corporate bonds by U.S. firms is strong, as it was in the July 2016-June 2017
period covered by the 2017 SHL, this problem is especially severe.13
Foreign Holdings of U.S. Securities as Measured by TIC SLT and
Annual Survey Reports
Exhibit 4 compares foreign holdings of long-term U.S. securities in June 2017 as measured
by the annual TIC SHL and the monthly TIC SLT.14 As shown in the table, the SLT reports
total foreign holdings of U.S. long-term securities of $17,533 billion, $52 billion higher than
11A short sale is the sale of a security that is not owned by the seller. Typically the securities used in shortsales are borrowed and are then sold on the expectation that their prices will decline, enabling the sellerto repurchase them at a lower price to make a profit.
12Chapter 2 also discusses some of the difficulties in correctly distinguishing actual purchases or sales ofsecurities from changes in holdings resulting from securities lending activities, which might result in anover-estimate of Treasury securities held by foreign investors.
13 See Chapter 2 for additional details.14The SLT began collecting aggregate position data on U.S. cross-border long-term securitiesholdings—U.S. holdings of foreign securities and foreign holdings of U.S. securities—in September 2011,and since December 2011 the SLT data have been collected monthly. Unlike the annual surveys, the SLTcollects data at the aggregate level and not at the individual security level, a significantly lower level ofdetail. However, the SLT has the advantage of providing information on cross-border securities holdingson a timelier basis, without resorting to monthly estimates constructed from reported transactions andvaluation estimates based on price indexes. SLT data corresponding to the SHL 2017 survey date ofJune 30, 2017 for Treasuries were first released on August 15, 2017; June 2017 SLT data for othersecurity types were first released on September 15, 2017.
9

the $17,481 billion reported in the survey. In principle, the SLT and survey data for the same
dates should be very similar because the panels of reporters are comparable, and indeed, the
country-level differences are generally below $1 billion. The overall difference of about $50
billion is concentrated in a small number of countries due to adjustments that can only be
calculated for the security-level SHL data and not for the aggregate SLT data.
Exhibit 4: Foreign holdings of long-term U.S. securities as measured by the survey of portfolioholdings and the TIC SLT, by type of security, as of June 30, 2017
Billions of dollars
Total long-term Equity Long-term debt
Country SHL SLT Diff SHL SLT Diff SHL SLT Diff
Japan 1,941 1,942 -1 490 491 -1 1,450 1,451 -1
Cayman Islands 1,585 1,586 -1 928 929 -1 657 656 1
China1 1,538 1,537 1 194 193 1 1,344 1,344 0
United Kingdom 1,452 1,490 -38 844 859 -15 608 631 -23
Luxembourg 1,303 1,334 -31 532 532 0 771 802 -31
Canada 1,048 1,053 -5 810 809 1 238 245 -7
Ireland 936 935 1 296 296 0 640 639 1
Switzerland 790 793 -3 413 416 -3 378 377 1
Belgium 676 718 -42 38 38 0 638 680 -42
Taiwan 561 561 0 56 56 0 505 505 0
Germany 422 423 -1 208 207 1 215 215 0
Netherlands 383 383 0 254 253 1 129 130 -1
Norway 340 340 0 239 239 0 101 101 0
Singapore 331 332 -1 167 167 0 164 165 -1
Bermuda 294 294 0 95 95 0 199 199 0
Hong Kong 287 287 0 96 96 0 191 191 0
France 276 277 -1 154 154 0 122 123 -1
Korea, South 271 271 0 102 102 0 170 170 0
Australia 262 263 -1 193 193 0 69 71 -2
Brazil 258 258 0 5 5 0 253 253 0
Country Unknown 64 3 61 1 1 0 64 2 62
Rest of world 2,463 2,455 8 1,077 1,076 1 1,386 1,378 8
Total 17,481 17,533 -52 7,189 7,206 -17 10,292 10,327 -35
Of which: Holdings of
foreign official institutions 5,212 5,215 -3 952 954 -2 4,260 4,261 -1
1. Excludes Hong Kong and Macau, which are reported separately.
Most of the $52 billion difference between the SHL and SLT data is in debt — $35 billion.
10

These differences reflect the results of two offsetting adjustments. First, the SLT data for
corporate debt are typically higher than the SHL data because the individual security-
level data on the survey are adjusted downward to account for over-reporting.15 Thus,
the largest discrepancies between the survey and the SLT occur in the countries where
U.S. firms commonly issue debt internationally, including Belgium, Luxembourg, and the
United Kingdom. For these three countries, the SHL positions are $23 to $42 billion smaller
than on the SLT. The second type of adjustment, which offsets the downward overreporting
adjustments, is an upward adjustment to account for unreported securities issued abroad.
The SHL includes data on U.S. securities directly issued into overseas markets, commonly
known as eurobonds. It is assumed that such bonds are held by foreign investors, and
holdings are assigned to Country Unknown. Aa a result, the SHL position for debt held by
Country Unknown is $62 billion larger than that for the SLT.
Aside from the differences related to adjustments described above, the country-level distri-
bution is largely preserved across the two reports.16 In both the survey and the SLT, Japan
is the largest investor country, followed by the Cayman Islands, China, and the United
Kingdom.
Comparison with U.S. Holdings of Foreign Long-Term Securities
Exhibit 5 compares foreign holdings of U.S. long-term securities with estimates of U.S.
holdings of foreign long-term securities as of selected survey dates. At $17,481 billion, foreign
holdings of U.S. long-term securities remained considerably larger than the $10,734 billion in
foreign securities held by U.S. residents at end-June 2017. The increase in U.S. holdings of
foreign securities ($1,564 billion) was slightly larger than the increase for foreign holdings of
U.S. securities ($1,251 billion), with both movements dominated by valuation gains. Foreign
investors saw strong gains on the value of their holdings of U.S. equities, but U.S. investors
had even larger gains on their holdings of foreign equity over this period, contributing to the
uptick in the net position, the first such movement since 2006.
15Over-reporting occurs when securities issued directly into the foreign market are reported by thesecurities issuers as foreign-owned, but some of the same securities are also reported by custodians asforeign-owned.
16 SLT data for all countries are accessible through the Treasury’s TIC website for Holdings of Long-TermSecurities: http://www.treasury.gov/resource-center/data-chart-center/tic/Pages/ticsec3.aspx.
11

−15,000
−10,000
−5,000
0
5,000
10,000
15,000
Bill
ions
of d
olla
rs
2002 2003 2004 2005 2006 2007 2008 2009 2010 2011 2012 2013 2014 2015 2016 2017
U.S. holdings (U.S. assets)Foreign holdings (U.S. liabilities)Net position*
*Net position is defined as U.S. holdings of foreign securities minus foreign holdings of U.S. securities.
as of end−June, selected survey dates
Exhibit 5: Net asset position in long−term securities of U.S. residents
Foreign Holdings of U.S. Securities by Country of Holder
Exhibit 6 reports foreign holdings of U.S. securities by country and security type for the
countries with the highest levels of reported investment. It should be noted that the country
attribution presented in this table is imperfect, because chains of foreign financial interme-
diaries are often involved in the custody or management of these securities, and because
ownership information is not available for bearer securities.
For example, a resident of Germany may buy a U.S. security and place it in the custody
of a Swiss bank. Normally the Swiss bank will then employ a U.S.-resident custodian bank
to act as its subcustodian to actually hold the security in order to facilitate settlement and
custody operations in the United States. When portfolio surveys are conducted, information
is collected only from U.S.-resident entities. Thus, the U.S.-resident bank, acting as the
subcustodian of the Swiss bank, will report this security on the survey. Because the U.S.
bank will typically know only that it is holding the security on behalf of a Swiss bank, it
will report the security as Swiss-held. This “custodial bias” tends to overstate the amounts
for countries with major custodial activities such as Belgium, the United Kingdom, and
Luxembourg.
12

Exhibit 6: Value of foreign holdings of U.S. securities, by major investing country and type ofsecurity, as of June 30, 2017
Billions of dollars
Country Total EquitiesTreas.
LT debt
Agency LT debt Corp. LT debt ST
debtABS1 Other ABS1 Other
Japan 1,998 490 1,034 222 7 14 174 58
Cayman Islands 1,687 928 158 25 8 103 363 102
China2 1,541 194 1,144 178 6 3 13 3
United Kingdom 1,493 844 200 10 2 21 376 41
Luxembourg 1,398 532 174 28 3 39 527 95
Ireland 1,068 296 260 34 11 44 292 132
Canada 1,061 810 67 4 1 25 141 13
Switzerland 824 413 214 14 3 9 138 34
Belgium 691 38 85 2 3 14 534 15
Taiwan 565 56 183 227 * 1 95 4
Country Unknown 64 1 * * * * 64 0
Rest of world 6,022 2,589 1,950 149 45 98 756 435
Total 18,412 7,189 5,468 891 90 371 3,473 930
Of which: Holdings of
foreign official institutions 5,575 952 3,663 384 43 14 157 363
* Greater than zero but less than $500 million.
1. Asset-backed securities. Agency ABS are backed primarily by home mortgages; corporate ABS are backed
by a wide variety of assets, such as car loans, credit card receivables, home and commercial mortgages, and
student loans.
2. Excludes Hong Kong and Macau, which are reported separately.
Another problem in country attribution is that many U.S. securities are issued directly
abroad. Such securities can be issued in either registered or bearer form. Registered securities
issued abroad typically trade in book-entry form with settlement and custody occurring at
international central securities depositories (ICSDs), such as Euroclear or Clearstream. U.S.
survey reporters can typically only report the country in which the ICSD is located and
thus large foreign holdings are attributed to these countries. Among the ten countries with
the largest holdings of U.S. securities on the most recent survey, six—Belgium, the Cayman
Islands, Ireland, Luxembourg, Switzerland, and the United Kingdom—are financial centers
in which substantial amounts of securities owned by residents of other countries are managed
or held in custody.17 If securities are issued in bearer, or unregistered, form, the owners of
17Although liabilities surveys, such as this one, cannot always determine the countries of foreign owners ofU.S. securities, the complementary asset surveys can obtain accurate country attribution, since those
13
such securities do not need to make themselves known, and typically little or no information
is available about them. Long-term bearer securities cannot be issued in the United States,
but U.S. firms can and do issue such securities abroad. Almost all of the $64 billion in
securities attributed to “Country Unknown” in Exhibit 6 are either eurobonds added as part
of our adjustment process (see Chapter 2) or bearer securities.
Bearing these caveats in mind, the data show that at $1,998 billion, total holdings attributed
to Japan exceeded those attributed to any other country. Entities resident in the Cayman
Islands had the next largest holdings, at $1,687 billion, and were the largest holders of
equity. China, in third position with $1,541 billion, was the largest holder of Treasuries.
Investors in United Kingdom had the fourth-largest total securities holdings, with $1,493
billion. Japanese and Chinese investors were the largest holders of debt, accounting for a
combined total of $2,856 billion.
Exhibit 6 splits foreign holdings of agency and corporate long-term debt securities into
asset-backed securities (ABS) and other debt securities. ABS are securities backed by pools
of assets, such as residential home mortgages or car loans, and include collateralized debt
obligations (CDOs). ABS give investors claims against the cash flows generated by the un-
derlying assets. Statistical Appendix Tables A1 through A6 show holdings of different types
of U.S. securities for all countries as of June 2017. Among the top investing countries, the
country distribution of ABS holdings are broadly in line with overall foreign debt holdings,
with most countries’ investors holding between five percent and 17 percent of their U.S. debt
in the form of ABS. On the low end are the United Kingdom, Luxembourg, Belgium, and
Switzerland, whose ABS holdings are below 10 percent of their debt holdings. The outlier
on the high side is Taiwan, whose ABS holdings—almost entirely agency ABS—comprised
a little less than half of their overall debt holdings.
Exhibit 7 shows foreign holdings of long-term corporate and agency debt from 2006 to 2017.
In June 2017, foreign investors held $891 billion in U.S. agency ABS, an increase of $59
billion from June 2016 and the fourth year in a row that foreign holdings of agency ABS
increased. The share of ABS in total foreign-held agency debt has increased consistently
since 2006, rising from below half in 2007 to 91 percent in the year ending June 2017. The
increasing share of agency debt held in the form of ABS is largely due to declining issuance
surveys need only determine the country of foreign security issuers, a relatively straightforward task.Thus, it may be possible to better understand the country attribution of liabilities by examininginformation in other countries’ asset surveys. This subject is explored in the article cited in footnote 6,“Understanding U.S. Cross-Border Securities Data.”
14
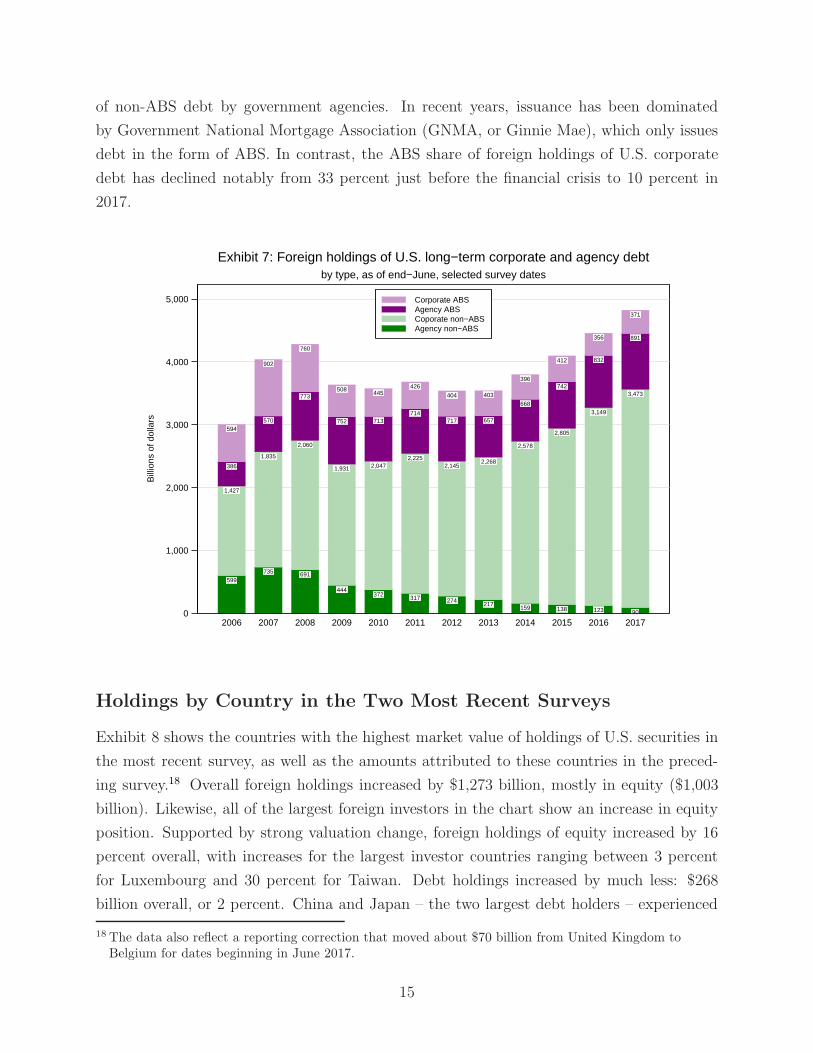
of non-ABS debt by government agencies. In recent years, issuance has been dominated
by Government National Mortgage Association (GNMA, or Ginnie Mae), which only issues
debt in the form of ABS. In contrast, the ABS share of foreign holdings of U.S. corporate
debt has declined notably from 33 percent just before the financial crisis to 10 percent in
2017.
599
1,427
386
594
735
1,835
570
902
691
2,060
773
760
444
1,931
752
508
372
2,047
713
445
317
2,225
714
426
274
2,145
717
404
217
2,268
657
403
159
2,578
668
396
138
2,805
742
412
123
3,149
832
356
90
3,473
891
371
0
1,000
2,000
3,000
4,000
5,000
Bill
ions
of d
olla
rs
2006 2007 2008 2009 2010 2011 2012 2013 2014 2015 2016 2017
by type, as of end−June, selected survey dates
Exhibit 7: Foreign holdings of U.S. long−term corporate and agency debt
Corporate ABSAgency ABSCoporate non−ABSAgency non−ABS
Holdings by Country in the Two Most Recent Surveys
Exhibit 8 shows the countries with the highest market value of holdings of U.S. securities in
the most recent survey, as well as the amounts attributed to these countries in the preced-
ing survey.18 Overall foreign holdings increased by $1,273 billion, mostly in equity ($1,003
billion). Likewise, all of the largest foreign investors in the chart show an increase in equity
position. Supported by strong valuation change, foreign holdings of equity increased by 16
percent overall, with increases for the largest investor countries ranging between 3 percent
for Luxembourg and 30 percent for Taiwan. Debt holdings increased by much less: $268
billion overall, or 2 percent. China and Japan – the two largest debt holders – experienced
18The data also reflect a reporting correction that moved about $70 billion from United Kingdom toBelgium for dates beginning in June 2017.
15

a decline in their debt holdings. Unlike the other top foreign debt holders, the majority of
China and Japan’s holdings are in Treasuries, which (as noted above) experienced significant
valuation losses between the two survey dates.
428
1,532
490
1,508
178
1,452
194
1,347
796
728
928
759
741
686
844
649
516
832
532
866
695
255
810
251
238
693
296
772
351
391
413
411
31
558
38
653
43
476
56
509
0
500
1,000
1,500
2,000
Bill
ions
of d
olla
rs
Japa
n
China
Caym
an Is
lands
United
King
dom
Luxe
mbo
urg
Canad
a
Irelan
d
Switzer
land
Belgium
Taiwan
2016 2017 2016 2017 2016 2017 2016 2017 2016 2017 2016 2017 2016 2017 2016 2017 2016 2017 2016 2017
Note: Mainland China excludes Hong Kong and Macau, which are reported separately.
by major investing countries, as of June 30, 2017
Exhibit 8: Market value of foreign holdings of U.S. securities
DebtEquities
Statistical Appendix Tables A7, A8, A9 and A10 show, respectively, holdings of total securi-
ties, equities, long-term debt securities, and short-term securities, for all countries as of the
dates of recent surveys.
Holdings of U.S. Securities by Foreign Official Institutions
The survey collects information on holdings of U.S. securities by foreign official institutions
(FOI) separately from holdings by private investors to capture differences in their investment
patterns. Foreign official institutions in this report consist primarily of foreign national
government institutions involved in the formulation of monetary policy, such as central banks,
but also include national government-owned investment funds and other national government
institutions.19
19 See http://www.treasury.gov/resource-center/data-chart-center/tic/Pages/foihome.aspx for a partial listof foreign official institutions.
16

2.0
5.2
2.6
6.6
3.1
6.3
3.3
5.2
3.9
5.9
4.4
7.2
4.8
7.7
5.0
8.5
5.3
10.2
5.4
10.8
5.2
11.0
5.2
12.3
0
5
10
15
20
Tril
lions
of d
olla
rs
2006
2007
2008
2009
2010
2011
2012
2013
2014
2015
2016
2017
Total
Foreign privateForeign official
0
10
20
30
40
50
60
70
80
90
100
Per
cent
age
2006
2007
2008
2009
2010
2011
2012
2013
2014
2015
2016
2017
Total Treasury debtAgency debt Corporate debtEquities
Share Held by Foreign Official Institutions
1.2
0.5
1.5
0.5
1.7
0.52.1
0.6 2.6
0.73.1
0.9
3.5
1.2
3.6
1.3
3.8
1.6
3.8
1.6
3.8
1.8
3.7
1.8
0
2
4
6
Tril
lions
of d
olla
rs
2006
2007
2008
2009
2010
2011
2012
2013
2014
2015
2016
2017
Treasury debt
PrivateForeign official
0.5
0.5
0.8
0.6
1.0
0.5
0.8
0.4
0.7
0.4
0.6
0.4
0.5
0.4
0.5
0.4
0.4
0.4
0.5
0.4
0.4
0.5
0.4
0.6
0
.5
1
1.5
Tril
lions
of d
olla
rs
2006
2007
2008
2009
2010
2011
2012
2013
2014
2015
2016
2017
Agency debt
PrivateForeign official
0.1
1.9
0.1
2.6
0.1
2.7
0.1
2.3
0.1
2.4
0.1
2.5
0.1
2.4
0.1
2.5
0.2
2.8
0.2
3.0
0.2
3.3
0.2
3.7
0
1
2
3
4
Tril
lions
of d
olla
rs
2006
2007
2008
2009
2010
2011
2012
2013
2014
2015
2016
2017
Corporate debt
PrivateForeign official
0.2
2.2
0.3
2.9
0.4
2.6
0.3
1.9
0.4
2.4
0.6
3.3
0.6
3.6
0.8
4.3
1.0
5.4
1.0
5.7
0.8
5.4
1.0
6.2
0
2
4
6
8
Tril
lions
of d
olla
rs
2006
2007
2008
2009
2010
2011
2012
2013
2014
2015
2016
2017
Equities
PrivateForeign official
by type of holder and security, as of end−June, selected survey dates
Exhibit 9: Foreign holdings of U.S. long−term securities
17

Distinguishing official from private holders in the surveys is difficult for the same reasons that
obtaining accurate information on the country of foreign owners of U.S. securities is difficult:
in both cases chains of financial intermediaries can obscure the true foreign holders. Thus,
some holdings attributed to private intermediaries, especially in major custodial centers,
may actually reflect holdings of foreign official institutions.
Exhibit 9 summarizes foreign official holdings of U.S. securities. Foreign official investors
held $5,212 billion in U.S. long-term securities in June 2017. The share of foreign holdings
owned by official investors increased rapidly immediately after the financial crisis, from 28
percent in 2007 to nearly 40 percent in 2010, but has gradually declined since, reaching 30
percent in June 2017.20
The majority of the foreign official portfolio is long-term Treasury securities, $3,663 bil-
lion, and foreign official holdings of Treasuries account for two-thirds of all foreign Treasury
holdings. Foreign official Treasury holdings increased rapidly following the financial crisis.
Indeed, from June 2007 to June 2010, foreign official holdings increased by $1,165 billion,
accounting for 85 percent of the $1,378 billion overall increase in total foreign holdings. By
contrast, from June 2010 to June 2015, foreign private investment in long-term Treasury
securities picked up, accounting for half of the $2,107 billion increase in Treasury position
over that time period. However, from June 2015 to June 2017, the foreign official position
declined by $143 billion while the private sector portfolio rose by about the same amount.
Foreign official institutions also purchased U.S. agency securities in the years prior to the
2008 financial crisis. Between the 2006 and 2008 surveys, foreign official holdings of long-
term U.S. agency debt securities increased from less than 50 percent to two-thirds of all
foreign holdings of long-term agency securities. Foreign official agency holdings dropped
precipitously in the five years following the crisis, but have been roughly stable since 2014.
More recently—in the past two years—foreign private holdings have risen. As a result,
foreign official holdings of agency debt in June 2017 accounted for slightly less than half of
all foreign holdings of long-term agency debt, the lowest share since 2005.
The foreign official position in long-term corporate bonds and equities has generally increased
over the time period shown in Exhibit 9, but these holdings account for only 22 percent of
foreign official holdings of U.S. long-term securities.
20At nearly 40 percent, official investors’ share of foreign holdings in 2010 was high relative to the 1990sbut not unprecedented. From 1974 to 1984, foreign official investors accounted for about 40 percent offoreign holdings of U.S. long-term securities.
18

304
311
256
379
373
485
614
535
484
472
438
440
377
434
381
497
372
506
403
529
303
606
363
567
0
500
1,000
1,500
Bill
ions
of d
olla
rs
2006
2007
2008
2009
2010
2011
2012
2013
2014
2015
2016
2017
Total
Foreign privateForeign official
0
10
20
30
40
50
60
70
80
90
100
Per
cent
age
2006
2007
2008
2009
2010
2011
2012
2013
2014
2015
2016
2017
TotalTreasuriesAgenciesCorporate debt
Share Held by foreign official institutions
183
70
159
70 226
153
572
290
454
289
414
244
366
271
363
316
341
292
367
330
272
411
329
349
0
200
400
600
800
Bill
ions
of d
olla
rs
2006
2007
2008
2009
2010
2011
2012
2013
2014
2015
2016
2017
Treasury debt
Foreign privateForeign official
110
37
80
29
130
44
34
56
24
37
16
27
5
24
3
22
8
34
12
37
6
26
0
17
0
50
100
150
200
Bill
ions
of d
olla
rs
2006
2007
2008
2009
2010
2011
2012
2013
2014
2015
2016
2017
Agency debt
Foreign privateForeign official
12
203
17
280
18
288
9
188
6
146
8
169
6
139
15
158
23
180
24
162
25
170
33
203
0
100
200
300
Bill
ions
of d
olla
rs
2006
2007
2008
2009
2010
2011
2012
2013
2014
2015
2016
2017
Corporate debt
Foreign privateForeign official
by security type, as of end−June, selected survey dates
Exhibit 10: Foreign holdings of U.S. short−term securities
19

Exhibit 10 shows foreign official holdings of short-term debt by type of security. Foreign
official investors held about 39 percent ($363 billion) of the U.S. short-term securities owned
by foreigners in June 2017 ($930 billion). Of the $363 billion of short-term securities held
by foreign official institutions, $329 billion, or 91 percent, were U.S. Treasury bills and
certificates. Official holdings of short-term corporate debt grew quickly between 2016 and
2017, but comprise less than a tenth of foreign official holdings of short-term debt.
During the 2008 financial crisis, the proportion of Treasury debt issued in the form of bills
and certificates rose substantially. Reflecting this shift in the pattern of issuance, foreign
official investors more than doubled their holdings of U.S. Treasury bills and certificates from
$226 billion to $572 billion between the June 2008 and June 2009 surveys. This increase
accounted for 72 percent of the rise in total foreign holdings of U.S. Treasury bills and
certificates. Since 2009, issuance of short-term Treasury debt has trended down, and total
foreign holdings of Treasury bills and certificates have decreased by $184 billion, more than
accounted for by a $243 billion decline in holdings by foreign official investors. While official
holdings of short-term Treasury debt remain above pre-crisis levels, official holdings of short-
term agency debt have fallen dramatically, from $130 billion in 2008 to less than $1 billion
in June 2017. Additional data on foreign official holdings are presented in the Appendix
tables.
Details on Foreign Holdings of Different Types of U.S. Securities
Foreign Holdings of U.S. Treasury Securities, by Type of Security
Exhibit 11 reports total holdings of U.S. Treasury securities by type of security for the
countries with the largest holdings. The majority of foreign investment comes from official
institutions, about two-thirds. China and Japan remain the largest country holders, at
$1,146 and $1,090 billion respectively, or over one-third of total foreign holdings of Treasury
securities.
Treasury Inflation-Protected Securities (TIPS), which, as of June 2017, were $1.26 trillion
of the $14 trillion in marketable Treasury securities outstanding, have been increasing in
popularity with some foreign investors. In June 2017, foreign investors held about half ($593
billion) of the total TIPS outstanding, about the same as last year (48 percent) and up from
31 percent in 2011 (not shown). China holds the largest amount of TIPS, $195 billion or 17
percent of its Treasury portfolio. Likewise, TIPS accounted for a significant share of total
foreign holdings of Treasury securities for several other countries: 21 percent for the Cayman
Islands and more than 10 percent for Luxembourg and the United Kingdom.
20

In January 2014, the U.S. Treasury began issuing Floating Rate Notes (FRNs), which have
a maturity of two years and pay an interest rate that varies over time with the rates on
newly issued 13-week Treasury bills. FRNs were initially popular with foreign investors,
who held $27 billion (about one-third of the amount outstanding) in June 2014 and $80
billion (over half of outstanding) in June 2015. The foreign share of FRNs held has declined
since 2015, and stood at 35 percent—or $118 billion of the $341 billion outstanding—in June
2017. Because FRNs have a maturity of two years, foreign holdings of FRNs are included
in nominal long-term debt in Exhibit 11. Statistical Appendix Table A3 shows holdings of
different forms of U.S. Treasury securities for all countries as of June 2017.
0
500
1,000
1,500
Bill
ions
of d
olla
rs
China
Japa
n
Irelan
dBra
zil
Caym
an Is
lands
Switzer
land
United
King
dom
Luxe
mbo
urg
Hong
Kong
Taiwan
by major investing country, as of June 30, 2017
Exhibit 11: Foreign holdings of U.S. Treasuries
FRNTIPSNominal short−termNominal long−term
Foreign Holdings of Equities by Type
Exhibit 12 provides additional detail on foreign holdings of equities in 2016 and 2017 for the
countries with the largest equity holdings. Three-fourths of total foreign holdings of U.S.
equities are in the form of common stock, accounting for $5,454 billion of the total $7,189
billion held. Fund shares ($1,252 billion) account for nearly three-fourths (72 percent) of
the remaining equities held by foreign investors. Foreign holdings of U.S. equities increased
$1,003 billion from last year, with roughly proportionate increases by equity type.
21

As noted in a previous section, “funds” include many different types of investment company
shares issued by U.S.-resident entities, such as open-end funds, closed-end funds, money
market mutual funds, hedge funds, and exchange-traded funds (ETFs).21 Such funds may
invest in a variety of assets, including bonds, real estate, commodities, and foreign-issued
equities as well as U.S. equities; however, the data reported are for foreign holdings of the
fund shares and not the underlying securities held by the funds. The residual “other” column
includes preferred stock as well as interests in limited partnerships and other equity interests.
0
200
400
600
800
1,000
Bill
ions
of d
olla
rs
Caym
an Is
lands
United
King
dom
Canad
a
Luxe
mbo
urg
Japa
n
Switzer
land
Irelan
d
Nethe
rland
s
Norway
Germ
any
2016 2017 2016 2017 2016 2017 2016 2017 2016 2017 2016 2017 2016 2017 2016 2017 2016 2017 2016 2017
by major investing country and type of equity, as of June 30, 2017
Exhibit 12: Foreign holdings of U.S. equities
All otherFund sharesCommon stock
The top five foreign holders of equity (Cayman Islands, United Kingdom, Canada, Lux-
embourg, and Japan) account for slightly more than half of total foreign holdings of U.S.
equities. The Cayman Islands, a major center for offshore incorporation of managed funds,
holds relatively more fund shares and “other” equity than other countries. Statistical Ap-
pendix Table A4 shows holdings of these different types of equity for all countries as of June
2017.
21ETF shares, which are nearly all reported as fund shares, accounted for about $300 billion in equityreporting—or about 22 percent of fund shares—on the SHL in 2017, up from about $160 billion on the2014 SHL.
22

Foreign Holdings of Corporate Asset-Backed Securities
Exhibit 13 splits foreign holdings of U.S. long-term corporate ABS as shown in Exhibit 6 into
those backed by pools of residential home mortgages and commercial mortgages (mortgage-
backed securities, or MBS) and those backed by other types of assets, such as pools of credit
card receivables, automobile loans, or student loans. A similar breakdown is not provided
for agency ABS because nearly all agency ABS are backed by pools of residential home
mortgages.
Exhibit 13: Value of foreign holdings of U.S.long-term corporate asset-backed securities,
by major investing country and type,as of June 30, 2017
Billions of dollars
June 30, 2016 June 30, 2017
Country or region TotalMortgage-
backedOther Total
Mortgage-
backedOther
Cayman Islands 92 72 19 103 77 26
Ireland 37 18 20 44 22 22
Luxembourg 43 18 25 39 16 23
Canada 26 21 5 25 20 5
Bermuda 22 12 10 22 12 10
Germany 14 3 11 21 2 20
United Kingdom 18 9 8 21 8 13
Belgium 20 4 16 14 3 11
Japan 11 5 6 14 5 9
Barbados 13 11 1 11 10 2
Rest of world 61 29 33 57 26 31
Total 356 202 154 371 201 170
Of which: Holdings of
foreign official institutions 17 7 10 14 5 9
Overall, foreign holdings of long-term corporate ABS increased slightly from June 2016 to
June 2017, by $15 billion. The Cayman Islands hold the most corporate ABS, a quarter of
total foreign holdings, as has been the case in previous years. Foreign investment in corporate
ABS, especially MBS, fell sharply in the years following the financial crisis, consistent with
a sharp drop in issuance. In June 2007, foreign holdings of corporate ABS amounted to $902
billion, with nearly two-thirds in MBS (not shown). In June 2017, foreign investors held
$371 billion in corporate ABS, about half MBS. Besides mortgages, the remainder of ABS
23
held in June 2017 were backed by student loans (one-third of the remainder) and to a lesser
extent automobile loans, credit card receivables, and other assets.
Statistical Appendix Table A5 presents the same information on holdings of U.S. long-
term corporate asset-backed securities for all countries as of June 2017. Foreign investors
also held a small amount of short-term ABS in the form of asset backed commercial paper
(ABCP); Table A6 in the Statistical Appendix presents information on holdings of all short-
term securities, including short-term Treasury securities, agency securities, and corporate
securities, as well as CP and ABCP, for all countries as of June 2017.
Portfolio Investment by Region of Investor Country and Survey Year
Exhibit 14 shows holdings of U.S. securities by region of investor country and type of security
as of the last eight survey dates. Total foreign holdings of long-term securities grew by $1,251
billion from June 2016 to June 2017, with increases in all regions (Panel A). Since 2010,
European holdings of long-term securities have grown at a faster rate than Asian holdings.
Between June 2016 and June 2017 European holdings increased by $710 billion to $7,389
billion, while Asian holdings increased by $199 billion, to $5,897 billion.
Holdings of long-term securities by foreign residents in the Americas increased by $319 billion
to $3,717 billion. Of these countries, the Bahamas, Bermuda, the British Virgin Islands, the
Cayman Islands, the former Netherlands Antilles, and Panama—referred to collectively in
the tables and charts as the Caribbean financial centers— continued to account for over half
of all investment attributed to the Americas region.22
Panels B, C, and D show holdings of U.S. equities, long-term debt, and short-term debt
respectively, with the same regional breakdown presented in Panel A. For the two largest
groups of holders by region—Europe and Asia—the composition of holdings is noticeably
different: European investors hold a bit more than half of their U.S. long-term securities in
the form of debt, while Asian investors hold over three-quarters in debt. Shares in long-term
debt relative to total long-term holdings have trended down since 2010 across all regions, but
the patterns across regions have been broadly stable over time. Since the 2010 survey, Asia
has held the highest level of U.S. long-term debt securities, followed by Europe. Likewise,
since the 2010 survey, Europe has held the highest level of foreign equities, followed by the
Americas.
22Netherlands Antilles, which no longer exists as a legal entity, included Curacao; Bonaire, Sint Eustatius,and Saba; and Sint Maarten. The TIC system began collecting data for these three countries separatelyin December 2013.
24

Exhibit 14: Foreign holdings of U.S. securities, by region,as of end-June, selected survey dates
Billions of dollars
2010 2011 2012 2013 2014 2015 2016 2017
A. Long-term securities
Total Europe 3,564 4,376 4,592 5,119 6,161 6,500 6,679 7,389Of which: Euro area 1,907 2,305 2,364 2,721 3,455 3,592 3,714 4,213
Total Asia 4,067 4,562 4,928 5,117 5,566 5,746 5,698 5,897Americas 1,738 2,193 2,537 2,900 3,331 3,466 3,398 3,717Of which: Carib. fin. ctrs. 989 1,186 1,386 1,543 1,810 1,884 1,910 2,108
Australia/Oceania 124 167 169 213 245 253 249 291Total Africa 34 36 41 41 49 50 41 49Intl. and regional orgs. 72 89 96 90 102 89 82 73Country Unknown 136 138 89 51 85 99 82 64Total 9,736 11,561 12,451 13,532 15,539 16,202 16,230 17,481
B. Equity
Total Europe 1,308 1,789 1,856 2,194 2,785 3,011 2,887 3,350Of which: Euro area 630 860 821 998 1,307 1,390 1,345 1,572
Total Asia 648 866 996 1,146 1,367 1,393 1,262 1,481Americas 765 1,048 1,253 1,559 1,997 2,035 1,834 2,118Of which: Carib. fin. ctrs. 399 539 696 832 1,094 1,126 1,019 1,172
Australia/Oceania 81 114 120 158 183 190 184 215Total Africa 6 8 8 9 16 21 14 20Intl. and regional orgs. 5 3 4 4 5 5 4 5Country Unknown 1 2 * * 3 1 * 1Total 2,814 3,830 4,237 5,070 6,356 6,655 6,186 7,189
C. Long-term debt
Total Europe 2,256 2,587 2,736 2,926 3,376 3,489 3,792 4,039Of which: Euro area 1,277 1,446 1,543 1,723 2,148 2,202 2,369 2,641
Total Asia 3,419 3,696 3,932 3,971 4,198 4,353 4,436 4,416Americas 973 1,146 1,284 1,341 1,334 1,431 1,564 1,599Of which: Carib. fin. ctrs. 590 646 690 710 716 758 890 936
Australia/Oceania 42 53 49 55 62 63 65 76Total Africa 29 28 32 32 33 30 27 30Intl. and regional orgs. 68 86 92 86 97 84 78 68Country Unknown 135 136 88 51 81 98 82 64Total 6,921 7,731 8,213 8,462 9,183 9,547 10,044 10,292
D. Short-term debt
Total Europe 359 331 327 377 378 421 446 425Of which: Euro area 216 221 217 237 252 259 320 284
Total Asia 332 333 285 264 248 270 221 276Americas 220 186 178 209 227 217 217 198Of which: Carib. fin. ctrs. 130 130 119 134 130 139 150 143
Australia/Oceania 9 8 9 17 14 11 9 9Total Africa 28 12 3 2 3 3 3 8Intl. and regional orgs. 6 7 9 9 8 9 14 15Country Unknown 2 1 * * * 0 0 0Total 956 878 811 878 878 932 909 930
1. Austria, Belgium, Finland, France, Germany, Greece, Ireland, Italy, Luxembourg, Netherlands, Portugal,
and Spain. Includes Slovenia as of 2007, Cyprus and Malta as of 2008, Slovakia as of 2009, Estonia as of
2011, Latvia as of 2014, and Lithuania as of 2015.
2. Bahamas, Bermuda, British Virgin Islands, Cayman Islands, the former Netherlands Antilles, and Panama.
25

Maturity Structure of Foreign Holdings of U.S. Long-Term Debt Securities
The cumulative maturity distribution of foreign holdings of U.S. long-term debt securities is
shown in Exhibit 15. The blue lines represent the cumulative maturity distribution of foreign
official holdings, and the red lines represent that of foreign private holdings. The remaining
years to maturity should be read as the upper bound: the “1 year” point represents securities
maturing up to one year from the June 30, 2017 survey date, the “2 year” point represents
securities maturing up to two years from the survey date, and so on.
Similar to the June 2016 survey, about half of U.S. long-term debt securities held by foreigners
matures in five years or less. Foreign holdings of long-term Treasury debt securities are more
concentrated at shorter maturities than are holdings of agency debt or corporate debt, with
two-thirds of Treasury holdings maturing in five years or less.
0
25
50
75
100
Per
cent
age
0 5 10 15 20 25 30 Over 30
Years to maturity
TotalPrivateForeign official
Total debt
0
25
50
75
100
Per
cent
age
0 5 10 15 20 25 30 Over 30
Years to maturity
TotalPrivateForeign official
Treasury debt
0
25
50
75
100
Per
cent
age
0 5 10 15 20 25 30 Over 30
Years to maturity
TotalPrivateForeign official
Agency debt
0
25
50
75
100
Per
cent
age
0 5 10 15 20 25 30 Over 30
Years to maturity
TotalPrivateForeign official
Corporate debt
Exhibit 15: Maturity structure of foreign holdings of long−term U.S. debt securities
Foreign official holdings of U.S. long-term debt securities have a shorter average maturity
than foreign private holdings. Slightly more than half of foreign official holdings mature
within four years; for private holdings, the comparable figure is between five and six years.
26
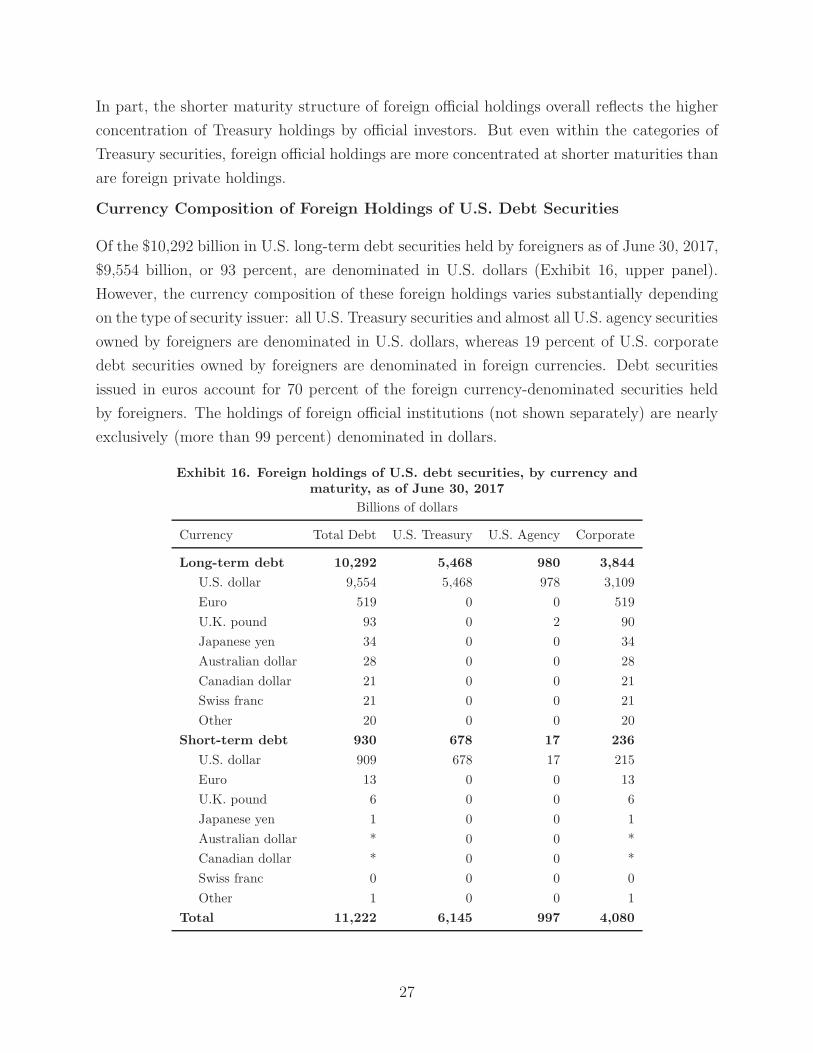
In part, the shorter maturity structure of foreign official holdings overall reflects the higher
concentration of Treasury holdings by official investors. But even within the categories of
Treasury securities, foreign official holdings are more concentrated at shorter maturities than
are foreign private holdings.
Currency Composition of Foreign Holdings of U.S. Debt Securities
Of the $10,292 billion in U.S. long-term debt securities held by foreigners as of June 30, 2017,
$9,554 billion, or 93 percent, are denominated in U.S. dollars (Exhibit 16, upper panel).
However, the currency composition of these foreign holdings varies substantially depending
on the type of security issuer: all U.S. Treasury securities and almost all U.S. agency securities
owned by foreigners are denominated in U.S. dollars, whereas 19 percent of U.S. corporate
debt securities owned by foreigners are denominated in foreign currencies. Debt securities
issued in euros account for 70 percent of the foreign currency-denominated securities held
by foreigners. The holdings of foreign official institutions (not shown separately) are nearly
exclusively (more than 99 percent) denominated in dollars.
Exhibit 16. Foreign holdings of U.S. debt securities, by currency andmaturity, as of June 30, 2017
Billions of dollars
Currency Total Debt U.S. Treasury U.S. Agency Corporate
Long-term debt 10,292 5,468 980 3,844
U.S. dollar 9,554 5,468 978 3,109
Euro 519 0 0 519
U.K. pound 93 0 2 90
Japanese yen 34 0 0 34
Australian dollar 28 0 0 28
Canadian dollar 21 0 0 21
Swiss franc 21 0 0 21
Other 20 0 0 20
Short-term debt 930 678 17 236
U.S. dollar 909 678 17 215
Euro 13 0 0 13
U.K. pound 6 0 0 6
Japanese yen 1 0 0 1
Australian dollar * 0 0 *
Canadian dollar * 0 0 *
Swiss franc 0 0 0 0
Other 1 0 0 1
Total 11,222 6,145 997 4,080
27

Foreign holdings of U.S. short-term debt securities (lower panel) are even more concentrated
in U.S.-dollar-denominated securities: $909 billion of the $930 billion held (98 percent)
are dollar-denominated. As with their holdings of U.S. long-term debt securities, foreign
official holdings of U.S. short-term securities (not shown) are almost entirely U.S. dollar-
denominated.
Exhibit 17 shows the currency composition of total foreign-owned U.S. long-term debt se-
curities (the “Total debt” column in the upper panel of Exhibit 16) for the most recent
eight surveys. During the June 2010-June 2017 period covered by the table, the share of
foreign-owned U.S. long-term debt securities denominated in U.S. dollars trended up until
June 2015, from about 88 percent in 2010 to 94 percent in 2015, but dropped back a bit
since then, to 93 percent as of June 2017. The euro continues to be the second most widely
used currency for foreign holdings of U.S. long-term debt securities by a wide margin, and
its share has increased in each of the past few years amid robust U.S. corporate issuance of
euro-denominated bonds.
Exhibit 17. Distribution of foreign holdings of U.S. long-term debt securities by currency, as ofend-June, selected survey dates
Share of Total
Currency 2010 2011 2012 2013 2014 2015 2016 2017
U.S. dollar 88.3 89.1 92.0 92.8 93.6 93.9 93.8 92.8
Euro 6.9 6.5 4.5 4.0 3.8 3.8 4.1 5.0
U.K. pound 1.8 1.6 1.4 1.4 1.1 1.0 0.8 0.9
Japanese yen 1.4 1.2 0.9 0.6 0.5 0.4 0.4 0.3
Australian dollar 0.3 0.3 0.2 0.3 0.2 0.2 0.2 0.3
Swiss franc 0.5 0.5 0.3 0.2 0.2 0.2 0.2 0.2
Canadian dollar 0.3 0.2 0.2 0.2 0.2 0.2 0.2 0.2
Other 0.5 0.5 0.5 0.5 0.3 0.3 0.2 0.2
Memo: Total holdings, $ billion 6921.0 7731.0 8213.0 8462.2 9182.8 9547.0 10044.0 10292.0
Foreign Holdings of U.S. Securities by Industry of Issuer
Exhibit 18 presents foreign holdings of U.S. securities divided into broad economic sectors
of the industry of issuer. The data in this table are presented using the North American
Industry Classification System (NAICS) developed by the U.S. Census Bureau.23 Additional
23Reports through 2014 classified securities using GICS (Global Industry Classification Standard) codes,developed by Morgan Stanley Capital International and Standard & Poor’s. Beginning with the SHL2015 report, NAICS codes have been used.
28

detail is in Appendix Table A11, which provides data on holdings with a more disaggregated
breakout of industries.
Exhibit 18: Market value of foreign holdings of U.S. securities,by industry, as of June 30, 2017
Billions of dollars
NAICS code1 Industry Total EquityDebt
Long-Term Short-term
21 Mining, quarrying, and oil and gas extraction 268 163 105 *
22-23 Utilities and construction 323 169 150 4
31 Consumer goods manufacturing 492 312 176 5
325 Chemical manufacturing 759 561 190 8
326-333 Other primary and machinery manufacturing 292 189 101 1
334-335 Computer and electronic product manufacturing 754 565 186 3
336-339 All other manufacturing 441 292 146 3
42 Wholesale trade 172 108 60 4
44-45 Retail trade 475 361 113 1
48-49 Transportation and cargo 211 132 78 2
511-515 Publishing and broadcasting 683 504 177 2
517-519 Telecommunications and information services 636 405 231 *
5221 Depository credit intermediation (banking) 1,046 388 549 109
5222-5239 Other financial 2,199 424 1,720 54
524 Insurance 408 288 119 1
525 Funds, trusts, and other financial vehicles 1,586 1,543 38 5
53-81 Services 900 556 336 8
92 Government2 6,178 * 5,499 678
Industry classification unknown 390 85 268 36
All other industries 199 142 51 6
Total 18,412 7,189 10,292 930
* Greater than zero but less than $500 million.
1. Stands for North American Industry Classification System.
2. The government sector includes primarily U.S. Treasuries and also some bonds issued by state and local gov-
ernments. When state and local bonds are clearly associated with a particular industry, such as utilities or
education, they are classified by that industry.
The government sector has the highest level of foreign investment, with foreign holdings of
short-term and long-term government securities at $6,178 billion, all of which were in the form
of debt. The government sector accounted for about a third of all foreign holdings of U.S.
securities in June 2017. The second-largest sector for foreign investment, also concentrated
in debt, remains the “Other financial” sector, with total foreign holdings of $2,199 billion,
29

which includes primarily U.S. agency-backed real estate finance and investment banking.
Other sectors attracting considerable foreign investment were “funds, trusts, and investment
vehicles ($1,586 billion), depository credit intermediation (banking) ($1,046 billion); services
($900 billion); chemical manufacturing ($759 billion), of which $532 billion is pharmaceuti-
cals; and computer and electronic product manufacturing ($754 billion). Except for banking,
investment in these sectors was concentrated in equity.
Comparison of Different Types of Foreign Portfolio Investment in the United
States as of Selected Dates
Exhibit 19 presents a more comprehensive time series of foreign portfolio investment in
the United States than earlier exhibits and compares foreign holdings of U.S. securities
with foreign holdings of deposits, loans, and other investments reported by U.S.-resident
banks and nonbank institutions. The exhibit shows the growing importance of securities in
foreign portfolio investment. In December 1984, foreign holdings of U.S. securities and other
portfolio investments were about equal, but foreign holdings of U.S. securities have increased
far more rapidly over time, reaching $18,412 billion at end-June 2017, more than four times
as large as the total for deposits, loans, and other investments ($4,217 billion).
0
5,000
10,000
15,000
20,000
25,000
Bill
ions
of d
olla
rs
1984 1989 1994 2000 2002 2003 2004 2005 2006 2007 2008 2009 2010 2011 2012 2013 2014 2015 2016 2017
* Includes deposits, brokerage balances, loans, resale agreements, and trade payables and advance payments.
as of selected survey dates
Exhibit 19: Forms of foreign portfolio investment in the United States
U.S. short−term securitiesU.S. long−term securitiesInvestment in U.S. non−financial entities*Investment in U.S. financial entities*
30

Exhibit 19T: Forms of foreign portfolio investment in the United States, as of selectedsurvey dates
Billions of dollars
Securities Other investment1
Date Total
Investment
Total Long-
term
Short-
term
Total Reported by2
Financial
entities
Non-financial
entities
December 1984 712 363 268 95 349 320 29
December 1989 1,690 958 847 111 732 693 39
December 1994 2,402 1,449 1,244 205 953 899 54
March 2000 5,063 3,881 3,558 323 1,182 1,129 53
June 2002 5,948 4,338 3,926 412 1,610 1,540 70
June 2003 6,859 4,978 4,503 475 1,881 1,829 52
June 2004 8,241 6,019 5,431 588 2,222 2,143 79
June 2005 9,405 6,864 6,262 602 2,541 2,479 62
June 2006 10,969 7,778 7,162 615 3,191 3,125 67
June 2007 13,602 9,772 9,136 635 3,830 3,730 100
June 2008 14,370 10,322 9,463 858 4,048 3,947 101
June 2009 13,111 9,641 8,492 1,149 3,471 3,394 77
June 2010 14,327 10,691 9,736 956 3,636 3,551 85
June 2011 16,468 12,440 11,561 878 4,028 3,950 78
June 2012 17,050 13,261 12,451 811 3,789 3,705 83
June 2013 18,411 14,410 13,532 878 4,000 3,906 95
June 2014 20,868 16,417 15,539 878 4,452 4,361 90
June 2015 21,341 17,134 16,202 932 4,206 4,121 85
June 2016 21,361 17,139 16,230 909 4,221 4,137 84
June 2017 22,629 18,412 17,481 930 4,217 4,134 83
1. Includes deposits, brokerage balances, loans, repurchase agreements, and trade payables and ad-
vance receipts.
2. As of December 2013, reporters on the banking forms were grouped into Banks and other financial
firms and Nonfinancial firms.
Sources: Data on long-term securities are from the TIC surveys. Data on deposits, loans, and other
are from the TIC reporting on forms BL1, BL2, BQ2, CQ1, and CQ2; numbers for prior years may
be revised from those published in earlier survey reports.
31

Chapter 2. Survey Methodology
Data Collection Methodology
The U.S. system for measuring foreign-resident holdings of U.S. securities consists of annual
surveys, with “benchmark” surveys every five years. The benchmark surveys collect cross-
border portfolio investment data from a large number of institutions (custodians and end-
investors) in an attempt to capture total U.S.-resident ownership of foreign securities. In
the four years succeeding a benchmark survey, data are collected from a smaller set of
respondents that collectively account for the vast majority of the holdings reported in the
previous benchmark survey. Prior to 2011, the panel for each of the four years was kept
largely unchanged, with the panel respondents selected based on the size of positions as
reported in the benchmark. Since 2011, the panel has been selected based on SLT reporting.
Reporters are still generally chosen based on the overall size of their positions, but the panel
is also selected to ensure relatively complete coverage across countries and asset classes. The
reporting panel for the 2017 survey covered 98.9 percent of all assets reported on the SLT
for June 2017.
The 2017 survey was collected during a non-benchmark year. For the 2017 survey, data
were submitted by U.S.-resident issuers and custodians (including securities depositories)
who were required to report, in detail, U.S. securities issued directly to a foreign resident or
entrusted to their safekeeping on behalf of a foreign-resident client. These holdings are very
concentrated: of the roughly 130 reporting institutions, the 10 largest custodians comprised
84 percent of the total market value. Respondents submitted a total of about 3.2 million
records, of which about 1.9 million were equity records and about 1.3 million were debt
records.
This survey was conducted under the authority of the International Investment and Trade
in Services Survey Act (22 U.S.C. 3101 et seq.). Reporting was mandatory, and subject to
penalties for noncompliance. Data were collected for holdings as of June 30, 2016, and were to
be reported to the Federal Reserve Bank of New York, acting as agent for the Department
of the Treasury, no later than August 31, 2016. A copy of the forms and instructions is
included in Appendix C.
Data Analysis and Editing
The data reported by respondents were subject to extensive analysis and editing. The first
step in the process was to analyze data at the reporter level to identify systemic errors
32

within each respondent’s submission. Respondent data that were filed during the prior year
were analyzed individually and compared against the data submitted in the current year.
Aggregate holdings reported in the survey were also measured against holdings reported
in the monthly Aggregate Holdings of Long-Term Securities by U.S. and Foreign Residents
(TIC Form SLT) to identify and reconcile any major discrepancies between the respondents’
reports as of June 30, 2017.
Once the analysis of the data for each respondent was complete, the data were analyzed on
a security-by-security basis, across all reporters. Securities subject to particular attention
included those reported with a large market value or quantity, those with particularly high
or low prices or price changes relative to SHL 2016, and those comprising a large percentage
of the total amount outstanding.
The third phase was to analyze the data according to various cumulative or “macro” group-
ings. At this level, the data were aggregated by categories such as country of foreign owner,
type of issuer, and type of industry. This review was especially useful in eliminating cases
in which the miscoding of a security with a small market value could have a large relative
impact on a small category. This analysis was performed to explain significant year-over-year
trends or anomalies based on business practices or economic developments, and to identify
the primary contributors driving the shifts in the macro data. Additionally, the data were
compared with reporting on other TIC forms to identify potential systemic issues.
Adjustments and Calculation of Total Foreign Holdings of U.S. Se-
curities
Three important types of adjustments were made to the survey data; the dollar value of
the adjustments is summarized in Exhibit 20. First, the data were adjusted downward to
remove identified cases of over-reporting using the same methodology as that used for the
2016 survey. Over-reporting can occur if an issuer reported debt securities issued directly
into foreign markets and U.S. custodians also reported foreign holdings of those securities.
For the 2017 survey, a total of $112 billion was deducted to account for over-reporting.
Second, in order to make annual survey figures comparable to figures in the benchmark
survey as well as in the TIC form SLT, synthetic securities were created to adjust the 2017
survey data upward using SLT data from reporters on the SLT panel but not on the annual
survey panel (“non-survey SLT reporters”). The SHL 2017 survey panel covered 96.6 percent
of the market value reported in the most recent benchmark survey, which was conducted in
33

2014, and included several new reporters that were added to the panel as a result of market
analysis and review of SLT data. The SLT data provide the aggregate market value by
country of foreign holder and by type of foreign holder (official or private). To determine
the distribution of securities holdings across other relevant characteristics not available from
the SLT (for example, maturity, currency, industry, and security type), data were used from
reporters on the annual survey panel that were considered to be similar to those non-survey
SLT reporters. Securities with a market value below a minimum threshold of $1 million
were omitted to reduce the number of adjustment securities created. These adjustments
amounted to $181 billion in 2017, or about 1 percent of total foreign holdings, of which the
bulk—$141 billion—was in equity.
Exhibit 20: Adjustments to data to account forover-reporting and for reporters omitted from annual
panel, as of June 30, 2017
Millions of dollars
Type of security
and foreign holder
Over-reporting
adjustment
Synthetic
securities
Unreported U.S.
issuance abroad
Total value
of adjustments
Equity
Total 0 140,902 0 140,902
Foreign official holders 0 0 0 0
Other holders 0 140,902 0 140,902
Treasury
Total 0 1,094 0 1,094
Foreign official holders 0 0 0 0
Other holders 0 1,094 0 1,094
Agency
Total 0 453 0 453
Foreign official holders 0 0 0 0
Other holders 0 453 0 453
Corporate
Total -112,123 39,041 79,658 6,575
Foreign official holders 0 0 0 0
Other holders -112,123 39,041 79,658 6,575
34

Finally, data on U.S. securities issued into foreign markets and not reported in the SHL were
collected by the Federal Reserve Board of Governors based on news reports and commercial
data sources. Such issuance has been quite strong in the past two years, and in principle
should be reported in the SHL by the issuers. However, in non-benchmark survey years, the
survey reporting panel is limited to respondents selected and notified by the Federal Reserve
Bank of New York. Many of the issuers are not already on the panels, and the process
of bringing new reporters to the panel is fairly lengthy. Thus, for SHL 2014 through SHL
2017, adjustments to account for the most significant issues were constructed by the Board
of Governors. In SHL 2017, these adjustments accounted for $80 billion.
Treatment of Repurchase and Securities Lending Agreements
Repurchase and securities lending agreements pose a challenge for accurately measuring
cross-border holdings of securities. Following international standards, repurchase and se-
curities lending agreements are treated as collateralized loans, as the return of the same
or similar securities at a set price is agreed upon in advance, and thus the economic risk
of changes in the value of the securities continues to reside with the securities lender (the
economic owner) even though the lender is no longer the legal owner (the securities borrower
is the legal owner). Lenders (or their custodians) are instructed to report securities involved
in such agreements as continuously held by the lender, and borrowers (or their custodians)
are instructed not to report them as holdings of the borrower.
However, reporting entities may not always have sufficient information to report as intended.
That is, custodians may not always be able to distinguish (a) securities transferred in or
transferred out through repurchase and lending activity from (b) those originating from
outright purchases and sales. Thus, correct reporting by custodians, given the information
they have, can result in reporting “errors” from the viewpoint of data collectors and those
compiling balance of payments and international investment position statistics. This type
of reporting error could result in measured foreign holdings being either over- or under-
reported. For instance, under-reporting might occur if a foreign entity (or its agent) lends a
U.S. security to a U.S. resident without either counterparty informing their custodian that
the transaction is a loan rather than a sale. After the change in legal ownership, the U.S.
custodian of the foreign resident delivers out the security and thus would not report the
security as foreign-held. The custodian for the U.S. resident would also not report, because
it holds a U.S. security on behalf of a U.S. resident and not a foreign resident. On the other
hand, over-reporting might occur if a U.S. resident lends a U.S. security to a foreign entity
and again neither custodian is informed that the transaction is a loan rather than a sale. In
35

this case the U.S. custodian for the foreign resident would report foreign ownership of the
U.S. security when in fact it is still U.S.-owned (in the sense of economic ownership).
Another challenge is that a security borrower (the legal owner) has the right to resell a
borrowed security. If a U.S. resident borrows a U.S. security from a foreign entity and
subsequently sells the security to another foreign resident, this can result in two different
foreign residents reporting as holding the same U.S. security. In this case, reporting is correct
according to the instructions, but it can lead to the overstatement of certain statistics, such
as the percentage of U.S. Treasury securities that is foreign-owned.
Finally, securities lending and short sales can introduce a wedge between reported securi-
ties transactions and changes in reported positions. For example, if a foreigner borrows a
Treasury security from a U.S. resident and then sells the security to a U.S. resident, the
transaction reporting system will (correctly) register this transaction as a foreign sale to a
U.S. resident. However, the position reporting system will show no net change in foreign
holdings of U.S. Treasuries. Thus, there will be a wedge between reported net transactions
and the change in reported positions, even after adjusting for valuation changes.
Acknowledgements
The Department of the Treasury, the Federal Reserve Bank of New York, and the Federal
Reserve Board of Governors wish to express their appreciation to the Securities Data Division
of the Federal Reserve Bank of New York for preparation of the U.S. portfolio investment
data. Under the direction of Edward Sapozhnikov and Jason Stein, staff members responsi-
ble for the data analysis were: Terrell Bobb, Karla Cruz, Hilda Hyman, Joseph Lovell, Jorge
Mancebo, Ani Qosja, and Paula Webster. Under the direction of Richard Wang, automa-
tion staff in conjunction with the business area responsible for obtaining properly formatted
data files and for facilitating data loads and updates were: David Carley, Amador Castelo,
Navin Persaud, and Cecelia Valentin-Doval. Under the direction of Helen Yu, Application
Development staff responsible for the application support were: Ashish Sharma, Kumarasel-
varaju Gunasekaran, Nowshad Mohamed, and Kyree Nero-Hattley. Staff members involved
from TSG Quality management office were Arun Nachimuthu and Sowmya Damera. Under
the direction of Victoria Williams, staff responsible for timely data entry are: Mary Ann
Campano, Natasha Fair, and Rita Cek-Dagostin. Federal Reserve Board staff responsible for
additional data analysis and review and the final production and drafting of this report were
Ruth Judson, Colin Weiss, Nyssa Kim, Andrew Loucky, Beau Bressler, Nathanael Coffey,
Matt Guse, and Julio Monge.
36

Appendix A: Statistical Appendix
A-1

Table A1. Value of foreign holdings of U.S. securities, by country and type of security, asof June 30, 2017 Millions of dollars
Debt (LT = long-term; ST = short-term)
Total LT LT LT LT
Countries and Regions (LT and ST) Equities Total Treasury Agency Corp ST Afghanistan 1,176 8 1,168 1,168 0 1 0
Albania 472 3 469 467 0 1 0
Algeria 698 19 * 0 0 * 679
Andorra 2,156 947 1,204 521 40 642 6
Angola 783 602 181 0 0 181 0
Anguilla 16,579 15,288 232 8 17 207 1,060
Antigua and Barbuda 195 137 57 2 10 45 *
Argentina 7,463 4,716 2,379 965 16 1,398 367
Armenia 622 6 615 614 * 1 0
Aruba 1,303 634 636 34 148 454 33
Australia 270,762 193,409 68,890 30,477 2,440 35,973 8,463
Austria 19,934 10,977 8,679 4,125 495 4,058 279
Azerbaijan 7,361 1,182 5,317 541 0 4,776 862
Bahamas 51,899 21,195 25,294 5,811 1,978 17,506 5,411
Bahrain 1,704 820 719 403 132 185 166
Bangladesh 1,005 7 1 0 0 1 998
Barbados 23,793 1,358 21,747 1,399 1,465 18,884 688
Belarus 151 9 142 142 0 0 0
Belgium 690,855 38,116 637,573 84,726 5,035 547,812 15,166
Belize 672 414 243 51 1 191 14
Benin * * * 0 0 * 0
Bermuda 317,836 95,341 198,823 46,259 26,767 125,797 23,672
Bhutan 100 53 47 46 0 1 0
Bolivia 2,187 213 915 431 164 320 1,060
Bonaire, Sint Eustatius & Saba1 109 99 10 2 * 8 *
Bosnia and Herzegovina 1 1 * 0 0 * 0
Botswana 2,019 605 1,393 1,369 3 21 21
Brazil 276,526 4,699 253,492 252,210 464 818 18,334
British Indian Ocean Territory * * * 0 0 * 0
British Virgin Islands 165,506 111,724 43,010 22,495 1,121 19,394 10,771
Brunei 5,398 4,269 986 235 2 749 143
Bulgaria 169 151 18 11 * 8 0
Burkina Faso 206 178 0 0 0 0 28
Burma 224 2 222 222 * * 0
Burundi * * 0 0 0 0 0
Cambodia 2,281 5 2,263 2,048 0 215 13
Cameroon 3 3 0 0 0 0 0
Canada 1,060,832 810,003 237,856 67,282 5,054 165,519 12,973
Cape Verde 13 * 4 0 0 4 9
Cayman Islands 1,686,529 927,697 657,303 158,039 32,682 466,582 101,529
Central African Republic * * 0 0 0 0 0
Chad * * 0 0 0 0 0
Chile 57,224 23,876 23,862 21,072 35 2,755 9,486
* Greater than zero but less than $500,000.n.a. Not available.
A-2

Table A1. Value of foreign holdings of U.S. securities, by country and type of security, asof June 30, 2017 (continued) Millions of dollars
Debt (LT = long-term; ST = short-term)
Total LT LT LT LT
Countries and Regions (LT and ST) Equities Total Treasury Agency Corp ST China, mainland2 1,540,549 193,996 1,343,762 1,144,081 183,393 16,288 2,791
Colombia 45,428 13,169 31,798 28,235 1,316 2,247 461
Comoros 189 189 0 0 0 0 0
Congo (Brazzaville) 2 2 0 0 0 0 0
Congo (Kinshasa) 39 4 34 0 32 3 0
Cook Islands 769 701 67 1 * 66 1
Costa Rica 2,918 890 1,943 1,633 10 300 85
Cote d‘Ivoire (Ivory Coast) 4 4 0 0 0 0 0
Croatia 1,504 230 1,089 1,088 0 1 186
Cuba * * 0 0 0 0 0
Curacao1 6,404 3,385 2,398 780 387 1,230 622
Cyprus 620 466 123 91 1 31 31
Czech Republic 23,507 2,791 20,716 20,631 0 85 1
Denmark 124,571 82,724 40,481 17,213 370 22,898 1,366
Djibouti 1 1 0 0 0 0 0
Dominica 55 37 18 * * 17 *
Dominican Republic 1,823 384 1,413 1,070 6 338 26
East Timor 11,481 3,562 7,899 7,899 0 0 20
Ecuador 954 460 450 196 22 231 45
Egypt 8,548 402 2,336 2,119 200 17 5,810
El Salvador 1,522 325 779 645 11 123 418
Equatorial Guinea * * 0 0 0 0 0
Eritrea * * 0 0 0 0 0
Estonia 457 360 89 65 1 23 8
Ethiopia 7 7 * 0 0 * 0
Falkland Islands 21 17 4 2 0 2 0
Faroe Islands * * * 0 0 * 0
Federated States of Micronesia 133 71 59 19 17 23 3
Fiji 53 3 15 0 15 * 35
Finland 45,098 27,623 17,100 9,640 106 7,353 376
France 291,810 153,504 122,097 56,729 3,481 61,887 16,210
French Guiana 17 14 2 0 0 2 0
French Polynesia 21 14 3 1 * 2 4
Gabon 145 25 120 0 0 120 0
Gambia 7 7 0 0 0 0 0
Georgia 74 5 69 69 * * 0
Germany 427,172 207,687 214,666 63,993 6,177 144,497 4,819
Ghana 1,287 11 1,231 1,204 1 26 45
Gibraltar 1,037 191 177 23 5 150 669
Greece 3,935 1,832 1,538 1,266 22 250 565
Greenland * * 0 0 0 0 0
Grenada 73 57 16 * * 16 *
Guadeloupe3 13 13 0 0 0 0 0
* Greater than zero but less than $500,000.n.a. Not available.
A-3

Table A1. Value of foreign holdings of U.S. securities, by country and type of security, asof June 30, 2017 (continued) Millions of dollars
Debt (LT = long-term; ST = short-term)
Total LT LT LT LT
Countries and Regions (LT and ST) Equities Total Treasury Agency Corp ST Guatemala 4,515 335 4,087 3,182 47 858 93
Guernsey 42,502 31,582 9,606 4,705 322 4,579 1,314
Guinea * * * 0 0 * 0
Guyana 123 33 86 11 61 14 4
Haiti 1,613 119 1,315 106 455 753 180
Holy See (Vatican) 16 5 12 11 0 * 0
Honduras 1,046 84 913 790 46 77 48
Hong Kong 350,178 95,754 190,886 137,470 13,210 40,206 63,538
Hungary 2,557 808 1,463 565 866 32 286
Iceland 3,395 1,079 2,291 2,249 40 1 25
India 133,423 2,653 114,627 114,189 157 281 16,143
Indonesia 33,974 288 31,175 25,356 3,661 2,158 2,511
Iran 2 2 0 0 0 0 0
Iraq 16,012 1 5,985 5,985 0 0 10,026
Ireland 1,068,048 295,681 640,121 259,606 44,229 336,286 132,245
Isle of Man 2,818 951 1,128 719 1 408 739
Israel 87,640 48,853 37,343 29,587 2,056 5,699 1,445
Italy 78,187 27,068 48,784 33,794 1,522 13,469 2,335
Jamaica 976 278 685 117 25 544 12
Japan 1,998,329 490,186 1,450,428 1,033,911 228,466 188,051 57,715
Jersey 24,822 15,889 6,288 2,097 235 3,956 2,644
Jordan 584 85 498 497 * 1 0
Kazakhstan 28,523 5,647 7,861 6,929 61 871 15,015
Kenya 929 31 898 896 * 2 0
Kiribati 289 289 0 0 0 0 0
Korea, South 281,754 101,829 169,602 90,356 46,791 32,455 10,323
Kosovo4 2 1 * 0 0 * 0
Kuwait 229,913 160,368 48,550 28,484 4,806 15,260 20,995
Kyrgyzstan * * 0 0 0 0 0
Laos * * 0 0 0 0 0
Latvia 2,095 125 1,816 257 1,079 481 153
Lebanon 187 170 16 * * 16 0
Lesotho 101 0 83 83 0 0 18
Liberia 1,095 655 433 192 64 177 7
Libya 564 66 498 498 0 0 0
Liechtenstein 3,978 3,251 727 43 81 603 *
Lithuania 281 43 221 218 2 1 18
Luxembourg 1,397,779 531,881 771,013 173,695 31,289 566,030 94,885
Macau 3,806 1,346 2,305 1,124 197 984 155
Macedonia 192 2 190 190 0 * 0
Madagascar 107 10 97 97 0 0 0
Malawi 7 5 2 1 0 2 0
Malaysia 41,094 12,540 28,491 14,272 12,365 1,854 63
* Greater than zero but less than $500,000.n.a. Not available.
A-4

Table A1. Value of foreign holdings of U.S. securities, by country and type of security, asof June 30, 2017 (continued) Millions of dollars
Debt (LT = long-term; ST = short-term)
Total LT LT LT LT
Countries and Regions (LT and ST) Equities Total Treasury Agency Corp ST Maldives * * 0 0 0 0 0
Mali 3 3 0 0 0 0 0
Malta 1,499 621 875 168 4 702 3
Marshall Islands 954 798 128 4 2 121 28
Martinique 2 1 * 0 0 * 0
Mauritania 122 * 122 122 0 0 0
Mauritius 7,884 4,388 2,872 1,535 90 1,247 624
Mexico 97,115 46,958 44,065 27,806 13,110 3,149 6,093
Moldova 668 4 664 664 0 0 0
Monaco 1,786 1,332 363 198 118 46 91
Mongolia 153 1 152 152 0 0 0
Montenegro4 1 1 * 0 0 * 0
Montserrat 18 16 3 2 0 1 0
Morocco 1,811 224 1,588 1,581 * 6 0
Mozambique 355 5 350 339 0 11 0
Namibia 736 689 46 46 0 * 0
Nauru 3 3 0 0 0 0 0
Nepal 860 9 700 700 0 1 150
Netherlands 397,974 253,512 129,491 45,021 12,150 72,320 14,971
New Caledonia 3 1 1 0 * 1 0
New Zealand 26,582 19,155 7,084 4,174 613 2,297 343
Nicaragua 470 75 215 145 30 41 179
Niger 1 1 0 0 0 0 0
Nigeria 2,692 93 2,479 2,018 394 68 120
Norway 340,323 238,952 100,652 53,438 15 47,199 719
Oman 23,071 7,375 15,696 15,521 75 100 0
Pakistan 3,830 66 1,416 1,282 * 135 2,347
Palau 179 133 45 11 14 20 1
Panama 22,244 12,395 8,724 736 1,206 6,782 1,125
Papua New Guinea 23 2 21 21 0 0 0
Paraguay 249 154 86 6 7 72 9
Peru 29,009 10,908 17,563 13,358 1,942 2,263 537
Philippines 42,703 2,851 39,177 37,433 34 1,710 675
Pitcairn Island * * 0 0 0 0 0
Poland 36,035 1,567 34,467 34,077 0 390 *
Portugal 8,358 3,475 4,793 4,047 159 588 91
Qatar 6,935 2,673 1,664 505 241 918 2,599
Reunion * * 0 0 0 0 0
Romania 3,374 69 3,305 3,250 * 55 0
Russia 103,403 423 96,855 96,749 1 104 6,126
Rwanda 189 1 188 188 0 * 0
Saint Kitts and Nevis 3,218 1,782 1,294 522 65 707 142
Saint Lucia 335 191 144 2 1 141 0
* Greater than zero but less than $500,000.n.a. Not available.
A-5

Table A1. Value of foreign holdings of U.S. securities, by country and type of security, asof June 30, 2017 (continued) Millions of dollars
Debt (LT = long-term; ST = short-term)
Total LT LT LT LT
Countries and Regions (LT and ST) Equities Total Treasury Agency Corp ST Saint Martin & Saint Barthelemy3 5 2 2 0 0 2 *
Saint Vincent and the Grenadines 51 46 5 1 * 4 0
Samoa 175 159 14 * 1 12 2
San Marino 1 1 0 0 0 0 0
Saudi Arabia 201,666 45,515 114,051 100,433 5,150 8,467 42,100
Senegal 5 5 * 0 0 * 0
Serbia and Montenegro4 1,748 14 1,504 1,504 0 * 230
Seychelles 167 150 17 5 * 12 0
Sierra Leone * * 0 0 0 0 0
Singapore 347,907 167,099 164,357 102,246 5,438 56,672 16,451
Sint Maarten1 165 134 31 * 5 25 1
Slovakia 314 51 231 226 5 * 33
Slovenia 2,176 1,138 775 383 24 367 263
Solomon Islands * * * 0 0 * 0
Somalia * * 0 0 0 0 0
South Africa 22,393 10,346 11,841 9,862 1,578 401 205
South Sudan * * 0 0 0 0 0
Spain 59,953 17,939 40,858 35,684 1,568 3,606 1,157
Sri Lanka 1,039 29 1,010 1,010 0 * 0
Sudan * * 0 0 0 0 0
Suriname 163 68 51 3 8 40 44
Swaziland 158 9 149 57 10 82 0
Sweden 180,244 130,441 49,530 40,633 121 8,775 274
Switzerland 823,897 412,722 377,657 213,546 17,312 146,799 33,518
Syria 4 4 * 0 0 * 0
Taiwan 564,735 55,862 505,332 182,593 227,195 95,544 3,540
Tajikistan 1 1 0 0 0 0 0
Tanzania 1,698 13 1,685 1,682 0 3 0
Thailand 79,193 2,630 64,173 53,705 3,902 6,567 12,390
Togo 1 1 * 0 0 * 0
Tokelau * * 0 0 0 0 0
Tonga 2 1 * 0 0 * *
Trinidad and Tobago 9,748 2,559 6,781 2,857 964 2,960 408
Tunisia 1,089 871 218 217 0 1 0
Turkey 59,367 645 22,928 22,886 1 41 35,793
Turkmenistan * * 0 0 0 0 0
Turks and Caicos Islands 643 408 230 34 17 179 6
Uganda 1,088 18 552 433 16 103 518
Ukraine 2,270 38 2,232 2,194 0 38 *
United Arab Emirates 147,089 80,452 57,652 49,874 786 6,991 8,985
United Kingdom 1,493,215 844,156 607,737 199,636 11,548 396,553 41,322
Uruguay 9,707 2,070 6,185 4,492 526 1,168 1,452
Uzbekistan 4 3 * 0 0 * 0
* Greater than zero but less than $500,000.n.a. Not available.
A-6

Table A1. Value of foreign holdings of U.S. securities, by country and type of security, asof June 30, 2017 (continued) Millions of dollars
Debt (LT = long-term; ST = short-term)
Total LT LT LT LT
Countries and Regions (LT and ST) Equities Total Treasury Agency Corp ST Vanuatu 23 3 7 7 0 * 13
Venezuela 5,609 3,193 2,231 76 65 2,091 185
Vietnam 13,604 35 13,570 13,568 * 1 *
Wallis and Futuna * * 0 0 0 0 0
West Bank and Gaza * * 0 0 0 0 0
Yemen 80 2 78 77 0 1 0
Zambia 175 2 173 173 0 * 0
Zimbabwe 7 6 1 0 0 1 0
International and regional organizations 88,007 5,257 67,929 47,488 7,921 12,521 14,821
Country Unknown 64,350 513 63,836 * 4 63,833 0
Total 18,411,560 7,189,442 10,291,671 5,467,555 980,212 3,843,904 930,446
of which: Holdings of foreign official institutions 5,575,278 952,306 4,259,968 3,662,609 426,493 170,866 363,004
Totals by Region:
Total Africa 57,331 19,651 29,593 24,717 2,387 2,488 8,086
Total Asia 6,173,684 1,481,402 4,416,002 3,196,430 738,059 481,513 276,280
Total Caribbean 2,288,894 1,182,885 961,448 239,539 66,115 655,795 144,561
Total Europe 7,813,310 3,349,920 4,038,598 1,501,339 138,483 2,398,777 424,792
Total Latin America 565,181 125,067 400,075 356,046 19,087 24,942 40,039
Canada 1,060,832 810,003 237,856 67,282 5,054 165,519 12,973
Australia/Oceania 299,971 214,743 76,334 34,714 3,103 38,517 8,894
Country Unknown 64,350 513 63,836 * 4 63,833 0
International and regional organizations 88,007 5,257 67,929 47,488 7,921 12,521 14,821
* Greater than zero but less than $500,000.n.a. Not available.
1. Separate reporting for certain country groups began with the 2014 survey.
Entries for Bonaire, Sint Eustatius, and Saba; Curacao; and Sint Maarten were previously reported together as Netherlands Antilles.
Entries for Guadeloupe and for Saint Martin and Saint Barthelemy were previously reported together as Guadeloupe.
Entries for Kosovo, Montenegro, and Serbia were previously reported together as Serbia.
2. Excludes Hong Kong and Macau, which are reported separately.
A-7

Table A2. Value of foreign holdings of U.S. long-term securities, by country and type ofsecurity, as of June 30, 2017 Millions of dollars
Total Agency Corporate
Countries and Regions LT Equities Treasury NonABS ABS NonABS ABS Afghanistan 1,176 8 1,168 0 0 1 0
Albania 472 3 467 0 0 1 0
Algeria 19 19 0 0 0 * 0
Andorra 2,150 947 521 1 40 641 1
Angola 783 602 0 0 0 181 0
Anguilla 15,520 15,288 8 1 16 134 73
Antigua and Barbuda 195 137 2 10 * 45 *
Argentina 7,095 4,716 965 7 9 1,396 2
Armenia 622 6 614 * 0 1 0
Aruba 1,270 634 34 134 15 223 231
Australia 262,299 193,409 30,477 203 2,237 32,662 3,311
Austria 19,655 10,977 4,125 12 483 3,942 116
Azerbaijan 6,499 1,182 541 0 0 4,776 0
Bahamas 46,488 21,195 5,811 908 1,069 14,124 3,382
Bahrain 1,538 820 403 1 131 146 39
Bangladesh 7 7 0 0 0 1 0
Barbados 23,105 1,358 1,399 72 1,393 7,420 11,464
Belarus 151 9 142 0 0 0 0
Belgium 675,689 38,116 84,726 3,204 1,831 533,629 14,182
Belize 658 414 51 1 1 191 *
Benin * * 0 0 0 * 0
Bermuda 294,164 95,341 46,259 3,612 23,156 104,231 21,566
Bhutan 100 53 46 0 0 1 0
Bolivia 1,127 213 431 163 1 320 *
Bonaire, Sint Eustatius & Saba1 109 99 2 * 0 8 0
Bosnia and Herzegovina 1 1 0 0 0 * 0
Botswana 1,998 605 1,369 2 * 21 0
Brazil 258,192 4,699 252,210 463 2 817 1
British Indian Ocean Territory * * 0 0 0 * 0
British Virgin Islands 154,735 111,724 22,495 183 939 17,834 1,560
Brunei 5,255 4,269 235 * 1 615 135
Bulgaria 169 151 11 0 * 8 *
Burkina Faso 178 178 0 0 0 0 0
Burma 224 2 222 0 * * 0
Burundi * * 0 0 0 0 0
Cambodia 2,268 5 2,048 0 0 215 0
Cameroon 3 3 0 0 0 0 0
Canada 1,047,859 810,003 67,282 1,408 3,646 140,632 24,888
Cape Verde 4 * 0 0 0 4 0
Cayman Islands 1,585,000 927,697 158,039 7,786 24,897 363,283 103,298
Central African Republic * * 0 0 0 0 0
Chad * * 0 0 0 0 0
Chile 47,738 23,876 21,072 26 9 2,748 6
* Greater than zero but less than $500,000.n.a. Not available.
A-8

Table A2. Value of foreign holdings of U.S. long-term securities, by country and type ofsecurity, as of June 30, 2017 (continued) Millions of dollars
Total Agency Corporate
Countries and Regions LT Equities Treasury NonABS ABS NonABS ABS China, mainland2 1,537,758 193,996 1,144,081 5,847 177,546 12,887 3,401
Colombia 44,967 13,169 28,235 290 1,026 2,245 2
Comoros 189 189 0 0 0 0 0
Congo (Brazzaville) 2 2 0 0 0 0 0
Congo (Kinshasa) 39 4 0 32 0 3 0
Cook Islands 768 701 1 * * 65 1
Costa Rica 2,833 890 1,633 5 5 299 1
Cote d‘Ivoire (Ivory Coast) 4 4 0 0 0 0 0
Croatia 1,319 230 1,088 0 0 1 0
Cuba * * 0 0 0 0 0
Curacao1 5,782 3,385 780 362 25 1,208 22
Cyprus 589 466 91 1 0 31 0
Czech Republic 23,506 2,791 20,631 0 0 85 0
Denmark 123,204 82,724 17,213 39 331 22,158 740
Djibouti 1 1 0 0 0 0 0
Dominica 54 37 * * 0 17 *
Dominican Republic 1,797 384 1,070 2 4 337 1
East Timor 11,461 3,562 7,899 0 0 0 0
Ecuador 910 460 196 19 3 231 *
Egypt 2,737 402 2,119 * 200 15 2
El Salvador 1,104 325 645 2 9 123 *
Equatorial Guinea * * 0 0 0 0 0
Eritrea * * 0 0 0 0 0
Estonia 449 360 65 1 0 23 0
Ethiopia 7 7 0 0 0 * 0
Falkland Islands 21 17 2 0 0 1 *
Faroe Islands * * 0 0 0 * 0
Federated States of Micronesia 129 71 19 12 5 23 0
Fiji 18 3 0 15 0 * 0
Finland 44,722 27,623 9,640 106 0 7,340 14
France 275,600 153,504 56,729 443 3,037 55,626 6,261
French Guiana 17 14 0 0 0 2 0
French Polynesia 17 14 1 * * 2 0
Gabon 145 25 0 0 0 120 0
Gambia 7 7 0 0 0 0 0
Georgia 74 5 69 * * * 0
Germany 422,353 207,687 63,993 590 5,587 123,025 21,471
Ghana 1,242 11 1,204 1 0 25 1
Gibraltar 368 191 23 4 1 150 0
Greece 3,370 1,832 1,266 22 1 250 *
Greenland * * 0 0 0 0 0
Grenada 73 57 * * 0 16 0
Guadeloupe3 13 13 0 0 0 0 0
* Greater than zero but less than $500,000.n.a. Not available.
A-9

Table A2. Value of foreign holdings of U.S. long-term securities, by country and type ofsecurity, as of June 30, 2017 (continued) Millions of dollars
Total Agency Corporate
Countries and Regions LT Equities Treasury NonABS ABS NonABS ABS Guatemala 4,422 335 3,182 38 9 814 44
Guernsey 41,189 31,582 4,705 208 114 4,290 289
Guinea * * 0 0 0 * 0
Guyana 119 33 11 61 * 14 *
Haiti 1,434 119 106 455 * 747 6
Holy See (Vatican) 16 5 11 0 0 * 0
Honduras 998 84 790 46 * 77 *
Hong Kong 286,640 95,754 137,470 4,396 8,815 38,800 1,405
Hungary 2,271 808 565 10 856 32 0
Iceland 3,370 1,079 2,249 40 0 1 0
India 117,280 2,653 114,189 36 121 281 *
Indonesia 31,463 288 25,356 21 3,640 2,093 65
Iran 2 2 0 0 0 0 0
Iraq 5,985 1 5,985 0 0 0 0
Ireland 935,803 295,681 259,606 10,566 33,663 292,293 43,994
Isle of Man 2,078 951 719 * * 408 *
Israel 86,196 48,853 29,587 479 1,578 5,473 227
Italy 75,852 27,068 33,794 1,257 265 13,322 146
Jamaica 963 278 117 25 0 543 *
Japan 1,940,614 490,186 1,033,911 6,939 221,528 174,113 13,938
Jersey 22,177 15,889 2,097 15 220 3,546 410
Jordan 584 85 497 0 * 1 0
Kazakhstan 13,508 5,647 6,929 61 * 871 0
Kenya 929 31 896 * 0 2 0
Kiribati 289 289 0 0 0 0 0
Korea, South 271,431 101,829 90,356 12,900 33,891 30,359 2,096
Kosovo4 2 1 0 0 0 * 0
Kuwait 208,918 160,368 28,484 546 4,260 14,500 760
Kyrgyzstan * * 0 0 0 0 0
Laos * * 0 0 0 0 0
Latvia 1,941 125 257 2 1,077 70 411
Lebanon 187 170 * 0 * 16 0
Lesotho 83 0 83 0 0 0 0
Liberia 1,088 655 192 11 53 133 44
Libya 564 66 498 0 0 0 0
Liechtenstein 3,978 3,251 43 9 72 587 16
Lithuania 264 43 218 2 0 1 0
Luxembourg 1,302,894 531,881 173,695 2,975 28,314 526,993 39,037
Macau 3,651 1,346 1,124 7 190 757 227
Macedonia 192 2 190 0 0 * 0
Madagascar 107 10 97 0 0 0 0
Malawi 7 5 1 0 0 2 0
Malaysia 41,031 12,540 14,272 459 11,905 1,667 188
* Greater than zero but less than $500,000.n.a. Not available.
A-10

Table A2. Value of foreign holdings of U.S. long-term securities, by country and type ofsecurity, as of June 30, 2017 (continued) Millions of dollars
Total Agency Corporate
Countries and Regions LT Equities Treasury NonABS ABS NonABS ABS Maldives * * 0 0 0 0 0
Mali 3 3 0 0 0 0 0
Malta 1,496 621 168 4 0 699 3
Marshall Islands 926 798 4 1 1 120 1
Martinique 2 1 0 0 0 * 0
Mauritania 122 * 122 0 0 0 0
Mauritius 7,259 4,388 1,535 80 10 946 301
Mexico 91,023 46,958 27,806 7,887 5,223 2,963 186
Moldova 668 4 664 0 0 0 0
Monaco 1,695 1,332 198 * 118 39 7
Mongolia 153 1 152 0 0 0 0
Montenegro4 1 1 0 0 0 * 0
Montserrat 18 16 2 0 0 1 0
Morocco 1,811 224 1,581 * 0 6 0
Mozambique 355 5 339 0 0 11 0
Namibia 736 689 46 0 0 * 0
Nauru 3 3 0 0 0 0 0
Nepal 710 9 700 0 0 1 0
Netherlands 383,003 253,512 45,021 688 11,462 68,881 3,439
New Caledonia 3 1 0 * 0 1 0
New Zealand 26,239 19,155 4,174 34 579 2,163 134
Nicaragua 290 75 145 30 * 41 *
Niger 1 1 0 0 0 0 0
Nigeria 2,572 93 2,018 182 211 68 0
Norway 339,604 238,952 53,438 12 2 46,800 399
Oman 23,071 7,375 15,521 * 75 86 14
Pakistan 1,482 66 1,282 * 0 135 0
Palau 178 133 11 9 5 20 *
Panama 21,119 12,395 736 250 956 6,618 164
Papua New Guinea 23 2 21 0 0 0 0
Paraguay 240 154 6 5 2 72 *
Peru 28,472 10,908 13,358 1,941 1 2,249 14
Philippines 42,028 2,851 37,433 13 21 1,710 *
Pitcairn Island * * 0 0 0 0 0
Poland 36,035 1,567 34,077 0 0 390 *
Portugal 8,268 3,475 4,047 11 147 585 2
Qatar 4,337 2,673 505 3 238 447 471
Reunion * * 0 0 0 0 0
Romania 3,374 69 3,250 * 0 55 0
Russia 97,278 423 96,749 * 1 103 1
Rwanda 189 1 188 0 0 * 0
Saint Kitts and Nevis 3,076 1,782 522 55 11 705 2
Saint Lucia 335 191 2 1 * 141 *
* Greater than zero but less than $500,000.n.a. Not available.
A-11

Table A2. Value of foreign holdings of U.S. long-term securities, by country and type ofsecurity, as of June 30, 2017 (continued) Millions of dollars
Total Agency Corporate
Countries and Regions LT Equities Treasury NonABS ABS NonABS ABS Saint Martin & Saint Barthelemy3 5 2 0 0 0 2 0
Saint Vincent and the Grenadines 51 46 1 * * 4 0
Samoa 173 159 * 1 * 12 *
San Marino 1 1 0 0 0 0 0
Saudi Arabia 159,566 45,515 100,433 508 4,642 7,325 1,142
Senegal 5 5 0 0 0 * 0
Serbia and Montenegro4 1,518 14 1,504 0 0 * 0
Seychelles 167 150 5 * * 10 2
Sierra Leone * * 0 0 0 0 0
Singapore 331,456 167,099 102,246 823 4,615 51,141 5,531
Sint Maarten1 165 134 * 1 4 25 *
Slovakia 282 51 226 5 0 * 0
Slovenia 1,913 1,138 383 24 0 367 *
Solomon Islands * * 0 0 0 * 0
Somalia * * 0 0 0 0 0
South Africa 22,187 10,346 9,862 25 1,553 304 97
South Sudan * * 0 0 0 0 0
Spain 58,797 17,939 35,684 975 593 2,537 1,069
Sri Lanka 1,039 29 1,010 0 0 * 0
Sudan * * 0 0 0 0 0
Suriname 119 68 3 7 * 40 *
Swaziland 158 9 57 * 10 2 80
Sweden 179,971 130,441 40,633 32 89 8,109 667
Switzerland 790,379 412,722 213,546 3,445 13,867 138,266 8,533
Syria 4 4 0 0 0 * 0
Taiwan 561,194 55,862 182,593 122 227,073 94,558 986
Tajikistan 1 1 0 0 0 0 0
Tanzania 1,698 13 1,682 0 0 3 0
Thailand 66,804 2,630 53,705 1 3,901 6,557 10
Togo 1 1 0 0 0 * 0
Tokelau * * 0 0 0 0 0
Tonga 2 1 0 0 0 * 0
Trinidad and Tobago 9,340 2,559 2,857 240 724 2,256 704
Tunisia 1,089 871 217 0 0 1 *
Turkey 23,574 645 22,886 1 * 41 0
Turkmenistan * * 0 0 0 0 0
Turks and Caicos Islands 637 408 34 3 14 176 3
Uganda 570 18 433 2 15 34 69
Ukraine 2,270 38 2,194 0 0 38 *
United Arab Emirates 138,104 80,452 49,874 88 698 6,673 319
United Kingdom 1,451,894 844,156 199,636 1,738 9,809 375,937 20,616
Uruguay 8,255 2,070 4,492 55 470 1,140 28
Uzbekistan 4 3 0 0 0 * 0
* Greater than zero but less than $500,000.n.a. Not available.
A-12

Table A2. Value of foreign holdings of U.S. long-term securities, by country and type ofsecurity, as of June 30, 2017 (continued) Millions of dollars
Total Agency Corporate
Countries and Regions LT Equities Treasury NonABS ABS NonABS ABS Vanuatu 10 3 7 0 0 * 0
Venezuela 5,424 3,193 76 49 16 2,081 9
Vietnam 13,604 35 13,568 * * 1 *
Wallis and Futuna * * 0 0 0 0 0
West Bank and Gaza * * 0 0 0 0 0
Yemen 80 2 77 0 0 1 0
Zambia 175 2 173 0 0 * 0
Zimbabwe 7 6 0 0 0 1 0
International and regional organizations 73,186 5,257 47,488 2,589 5,332 5,911 6,610
Country Unknown 64,350 513 * 3 1 63,832 *
Total 17,481,114 7,189,442 5,467,555 89,500 890,712 3,472,812 371,092
of which: Holdings of foreign official institutions 5,212,274 952,306 3,662,609 42,769 383,724 156,554 14,312
Totals by Region:
Total Africa 49,244 19,651 24,717 334 2,053 1,893 595
Total Asia 5,897,404 1,481,402 3,196,430 33,191 704,867 450,560 30,954
Total Caribbean 2,144,333 1,182,885 239,539 13,848 52,266 513,482 142,313
Total Europe 7,388,519 3,349,920 1,501,339 26,504 111,979 2,236,951 161,826
Total Latin America 525,142 125,067 356,046 11,346 7,741 24,483 459
Canada 1,047,859 810,003 67,282 1,408 3,646 140,632 24,888
Australia/Oceania 291,077 214,743 34,714 277 2,826 35,069 3,448
Country Unknown 64,350 513 * 3 1 63,832 *
International and regional organizations 73,186 5,257 47,488 2,589 5,332 5,911 6,610
* Greater than zero but less than $500,000.n.a. Not available.
1. Separate reporting for certain country groups began with the 2014 survey.
Entries for Bonaire, Sint Eustatius, and Saba; Curacao; and Sint Maarten were previously reported together as Netherlands Antilles.
Entries for Guadeloupe and for Saint Martin and Saint Barthelemy were previously reported together as Guadeloupe.
Entries for Kosovo, Montenegro, and Serbia were previously reported together as Serbia.
2. Excludes Hong Kong and Macau, which are reported separately.
A-13

Table A3. Value of foreign holdings of U.S. Treasury debt securities, by country andtype of Treasury security, as of June 30, 2017 Millions of dollars
Treasury LT debt**
of which: of which: of which: Treasury
Countries and Regions Total Total Nominal TIPS FRN ST debt**
Afghanistan 1,168 1,168 1,168 0 0 0
Albania 467 467 466 1 0 0
Algeria 679 0 0 0 0 679
Andorra 526 521 505 16 0 5
Anguilla 1,068 8 8 0 0 1,060
Antigua and Barbuda 3 2 2 0 * *
Argentina 1,303 965 891 74 1 338
Armenia 614 614 614 0 0 0
Aruba 34 34 33 * 0 0
Australia 38,028 30,477 26,746 2,953 777 7,551
Austria 4,382 4,125 3,849 259 17 257
Azerbaijan 541 541 538 2 0 0
Bahamas 8,111 5,811 5,719 66 25 2,300
Bahrain 568 403 361 41 0 165
Bangladesh 998 0 0 0 0 998
Barbados 2,070 1,399 1,382 17 0 671
Belarus 142 142 142 0 0 0
Belgium 97,793 84,726 77,723 6,322 681 13,066
Belize 60 51 50 1 0 9
Bermuda 60,754 46,259 43,563 2,067 629 14,495
Bhutan 46 46 46 0 0 0
Bolivia 482 431 390 * 41 51
Bonaire, Sint Eustatius & Saba1 2 2 2 0 0 0
Botswana 1,391 1,369 1,300 66 4 21
Brazil 269,634 252,210 233,833 13,467 4,910 17,423
British Virgin Islands 30,671 22,495 20,209 2,215 71 8,176
Brunei 377 235 138 97 0 142
Bulgaria 11 11 11 0 0 0
Burkina Faso 28 0 0 0 0 28
Burma 222 222 222 0 0 0
Cambodia 2,061 2,048 2,047 1 0 13
Canada 76,668 67,282 56,232 9,676 1,374 9,386
Cape Verde 9 0 0 0 0 9
Cayman Islands 248,907 158,039 97,829 52,050 8,160 90,868
Chile 27,212 21,072 19,358 1,552 162 6,140
China, mainland2 1,146,426 1,144,081 949,314 194,733 34 2,345
Colombia 28,486 28,235 27,502 733 * 250
Cook Islands 1 1 * 0 * 0
Costa Rica 1,688 1,633 1,632 1 0 56
Croatia 1,274 1,088 1,077 0 11 185
Curacao1 1,312 780 779 1 * 532
Cyprus 115 91 91 * 0 23
* Greater than zero but less than $500,000.n.a. Not available.
A-14
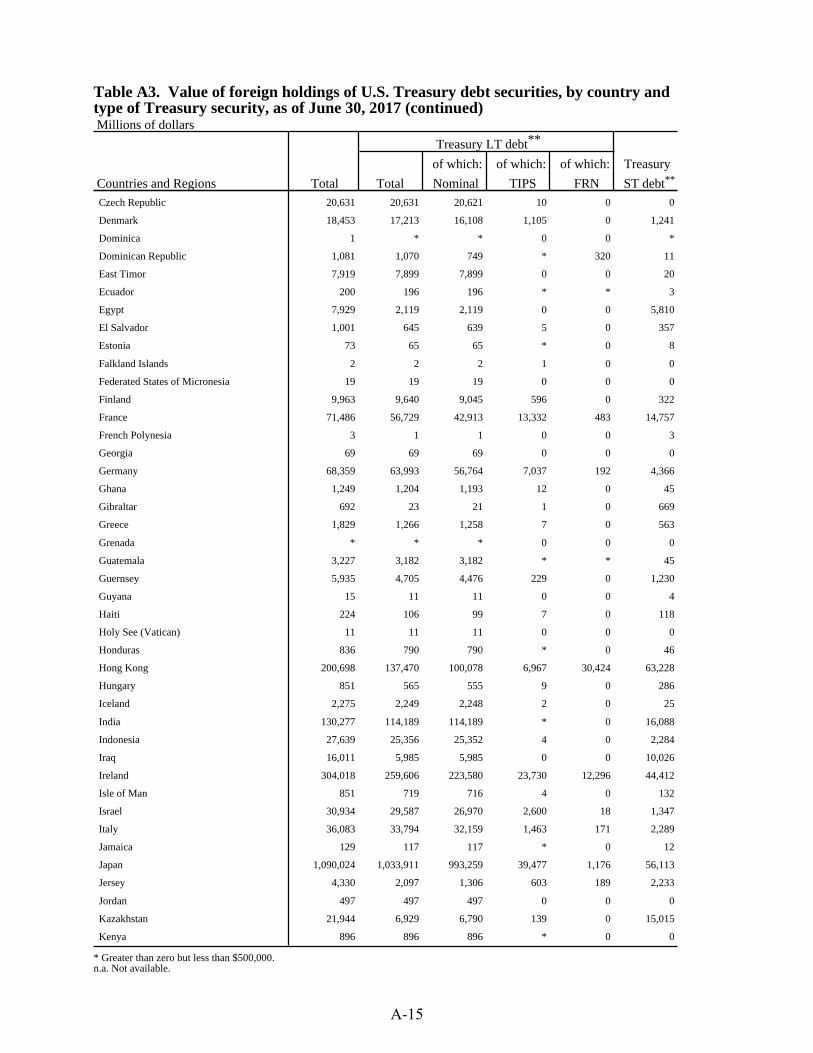
Table A3. Value of foreign holdings of U.S. Treasury debt securities, by country andtype of Treasury security, as of June 30, 2017 (continued) Millions of dollars
Treasury LT debt**
of which: of which: of which: Treasury
Countries and Regions Total Total Nominal TIPS FRN ST debt**
Czech Republic 20,631 20,631 20,621 10 0 0
Denmark 18,453 17,213 16,108 1,105 0 1,241
Dominica 1 * * 0 0 *
Dominican Republic 1,081 1,070 749 * 320 11
East Timor 7,919 7,899 7,899 0 0 20
Ecuador 200 196 196 * * 3
Egypt 7,929 2,119 2,119 0 0 5,810
El Salvador 1,001 645 639 5 0 357
Estonia 73 65 65 * 0 8
Falkland Islands 2 2 2 1 0 0
Federated States of Micronesia 19 19 19 0 0 0
Finland 9,963 9,640 9,045 596 0 322
France 71,486 56,729 42,913 13,332 483 14,757
French Polynesia 3 1 1 0 0 3
Georgia 69 69 69 0 0 0
Germany 68,359 63,993 56,764 7,037 192 4,366
Ghana 1,249 1,204 1,193 12 0 45
Gibraltar 692 23 21 1 0 669
Greece 1,829 1,266 1,258 7 0 563
Grenada * * * 0 0 0
Guatemala 3,227 3,182 3,182 * * 45
Guernsey 5,935 4,705 4,476 229 0 1,230
Guyana 15 11 11 0 0 4
Haiti 224 106 99 7 0 118
Holy See (Vatican) 11 11 11 0 0 0
Honduras 836 790 790 * 0 46
Hong Kong 200,698 137,470 100,078 6,967 30,424 63,228
Hungary 851 565 555 9 0 286
Iceland 2,275 2,249 2,248 2 0 25
India 130,277 114,189 114,189 * 0 16,088
Indonesia 27,639 25,356 25,352 4 0 2,284
Iraq 16,011 5,985 5,985 0 0 10,026
Ireland 304,018 259,606 223,580 23,730 12,296 44,412
Isle of Man 851 719 716 4 0 132
Israel 30,934 29,587 26,970 2,600 18 1,347
Italy 36,083 33,794 32,159 1,463 171 2,289
Jamaica 129 117 117 * 0 12
Japan 1,090,024 1,033,911 993,259 39,477 1,176 56,113
Jersey 4,330 2,097 1,306 603 189 2,233
Jordan 497 497 497 0 0 0
Kazakhstan 21,944 6,929 6,790 139 0 15,015
Kenya 896 896 896 * 0 0
* Greater than zero but less than $500,000.n.a. Not available.
A-15
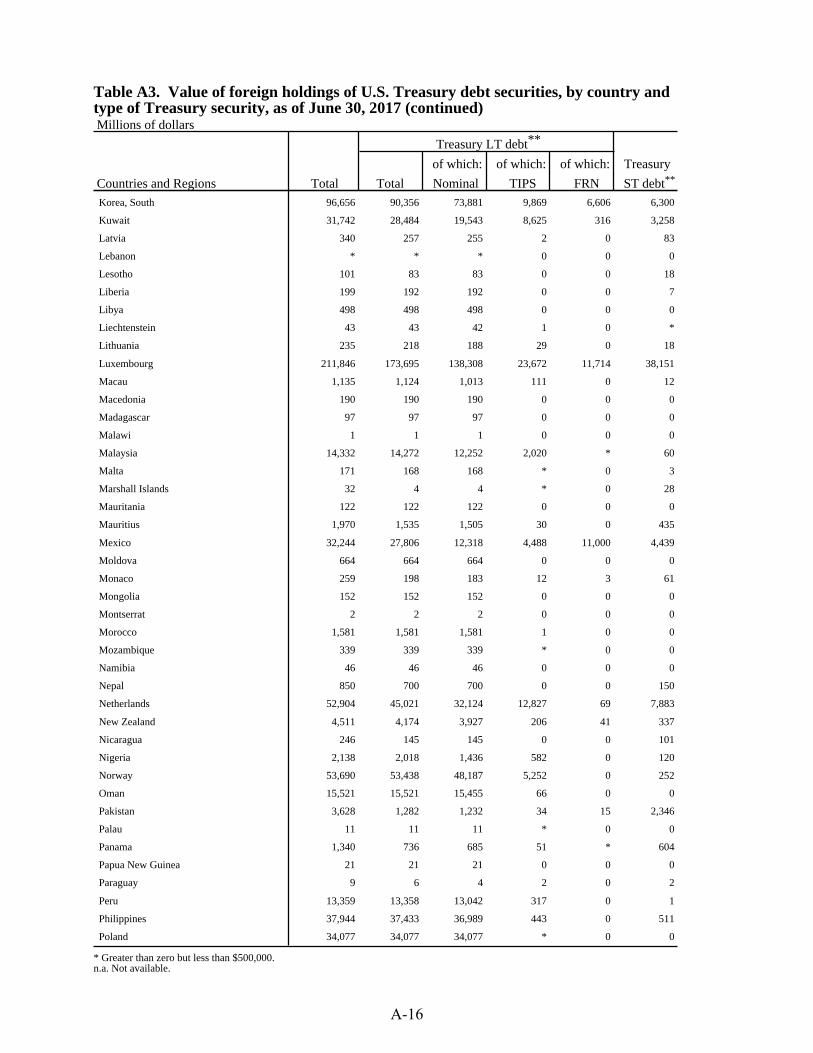
Table A3. Value of foreign holdings of U.S. Treasury debt securities, by country andtype of Treasury security, as of June 30, 2017 (continued) Millions of dollars
Treasury LT debt**
of which: of which: of which: Treasury
Countries and Regions Total Total Nominal TIPS FRN ST debt**
Korea, South 96,656 90,356 73,881 9,869 6,606 6,300
Kuwait 31,742 28,484 19,543 8,625 316 3,258
Latvia 340 257 255 2 0 83
Lebanon * * * 0 0 0
Lesotho 101 83 83 0 0 18
Liberia 199 192 192 0 0 7
Libya 498 498 498 0 0 0
Liechtenstein 43 43 42 1 0 *
Lithuania 235 218 188 29 0 18
Luxembourg 211,846 173,695 138,308 23,672 11,714 38,151
Macau 1,135 1,124 1,013 111 0 12
Macedonia 190 190 190 0 0 0
Madagascar 97 97 97 0 0 0
Malawi 1 1 1 0 0 0
Malaysia 14,332 14,272 12,252 2,020 * 60
Malta 171 168 168 * 0 3
Marshall Islands 32 4 4 * 0 28
Mauritania 122 122 122 0 0 0
Mauritius 1,970 1,535 1,505 30 0 435
Mexico 32,244 27,806 12,318 4,488 11,000 4,439
Moldova 664 664 664 0 0 0
Monaco 259 198 183 12 3 61
Mongolia 152 152 152 0 0 0
Montserrat 2 2 2 0 0 0
Morocco 1,581 1,581 1,581 1 0 0
Mozambique 339 339 339 * 0 0
Namibia 46 46 46 0 0 0
Nepal 850 700 700 0 0 150
Netherlands 52,904 45,021 32,124 12,827 69 7,883
New Zealand 4,511 4,174 3,927 206 41 337
Nicaragua 246 145 145 0 0 101
Nigeria 2,138 2,018 1,436 582 0 120
Norway 53,690 53,438 48,187 5,252 0 252
Oman 15,521 15,521 15,455 66 0 0
Pakistan 3,628 1,282 1,232 34 15 2,346
Palau 11 11 11 * 0 0
Panama 1,340 736 685 51 * 604
Papua New Guinea 21 21 21 0 0 0
Paraguay 9 6 4 2 0 2
Peru 13,359 13,358 13,042 317 0 1
Philippines 37,944 37,433 36,989 443 0 511
Poland 34,077 34,077 34,077 * 0 0
* Greater than zero but less than $500,000.n.a. Not available.
A-16

Table A3. Value of foreign holdings of U.S. Treasury debt securities, by country andtype of Treasury security, as of June 30, 2017 (continued) Millions of dollars
Treasury LT debt**
of which: of which: of which: Treasury
Countries and Regions Total Total Nominal TIPS FRN ST debt**
Portugal 4,137 4,047 4,006 42 0 90
Qatar 3,059 505 481 24 0 2,554
Romania 3,250 3,250 3,250 0 0 0
Russia 102,873 96,749 96,699 50 0 6,124
Rwanda 188 188 188 0 0 0
Saint Kitts and Nevis 571 522 492 1 29 49
Saint Lucia 2 2 2 * 0 0
Saint Vincent and the Grenadines 1 1 1 * 0 0
Samoa * * * 0 0 0
Saudi Arabia 141,521 100,433 88,946 11,237 250 41,088
Serbia and Montenegro4 1,733 1,504 1,434 0 70 230
Seychelles 5 5 4 * 0 0
Singapore 105,995 102,246 66,920 33,920 1,406 3,749
Sint Maarten1 1 * * 0 0 1
Slovakia 259 226 226 * 0 33
Slovenia 647 383 383 0 0 263
South Africa 10,052 9,862 9,099 716 47 189
Spain 36,636 35,684 34,293 1,371 19 952
Sri Lanka 1,010 1,010 1,010 0 0 0
Suriname 47 3 3 0 0 44
Swaziland 57 57 57 * 0 0
Sweden 40,907 40,633 38,085 2,548 0 274
Switzerland 244,514 213,546 190,001 22,332 1,214 30,968
Taiwan 185,912 182,593 168,438 14,090 65 3,318
Tanzania 1,682 1,682 1,682 0 0 0
Thailand 66,064 53,705 50,490 3,215 0 12,360
Trinidad and Tobago 3,185 2,857 2,743 114 0 327
Tunisia 217 217 217 0 0 0
Turkey 58,672 22,886 22,886 * 0 35,786
Turks and Caicos Islands 39 34 28 6 0 6
Uganda 951 433 430 3 0 518
Ukraine 2,194 2,194 2,194 0 0 0
United Arab Emirates 58,759 49,874 29,765 16,021 4,088 8,886
United Kingdom 234,249 199,636 148,046 32,812 18,778 34,612
Uruguay 5,846 4,492 4,466 25 1 1,354
Vanuatu 20 7 7 0 0 13
Venezuela 145 76 67 9 * 69
Vietnam 13,568 13,568 13,568 * 0 0
Yemen 77 77 77 0 0 0
Zambia 173 173 173 0 0 0
International and regional organizations 55,828 47,488 44,902 2,556 30 8,341
Country Unknown * * * 0 0 0
* Greater than zero but less than $500,000.n.a. Not available.
A-17

Table A3. Value of foreign holdings of U.S. Treasury debt securities, by country andtype of Treasury security, as of June 30, 2017 (continued) Millions of dollars
Treasury LT debt**
of which: of which: of which: Treasury
Countries and Regions Total Total Nominal TIPS FRN ST debt**
Total 6,145,286 5,467,555 4,756,140 593,485 117,930 677,731
of which: Holdings of foreign official institutions 3,991,853 3,662,609 3,220,986 381,464 60,160 329,244
Totals by Region:
Total Africa 32,598 24,717 23,258 1,409 51 7,881
Total Asia 3,433,792 3,196,430 2,808,438 343,595 44,397 237,362
Total Caribbean 358,165 239,539 173,759 56,546 9,234 118,626
Total Europe 1,758,207 1,501,339 1,299,610 155,819 45,909 256,868
Total Latin America 387,381 356,046 319,206 20,725 16,116 31,335
Canada 76,668 67,282 56,232 9,676 1,374 9,386
Australia/Oceania 42,646 34,714 30,736 3,160 819 7,932
Country Unknown * * * 0 0 0
International and regional organizations 55,828 47,488 44,902 2,556 30 8,341
* Greater than zero but less than $500,000.n.a. Not available.
** Long-term (LT) denotes original maturity of over one year; short-term (ST) denotes original maturity of one year or less.
1. Separate reporting for certain country groups began with the 2014 survey.
Entries for Bonaire, Sint Eustatius, and Saba; Curacao; and Sint Maarten were previously reported together as Netherlands Antilles.
Entries for Guadeloupe and for Saint Martin and Saint Barthelemy were previously reported together as Guadeloupe.
Entries for Kosovo, Montenegro, and Serbia were previously reported together as Serbia.
2. Excludes Hong Kong and Macau, which are reported separately.
A-18

Table A4. Value of foreign holdings of U.S. equities, by country and type of equities,as of June 30, 2017 Millions of dollars
Total Common Preferred
Countries and Regions Equities Stock Funds and Other Afghanistan 8 2 6 *
Albania 3 3 1 0
Algeria 19 18 1 *
Andorra 947 682 228 37
Angola 602 409 44 149
Anguilla 15,288 14,908 369 10
Antigua and Barbuda 137 102 31 5
Argentina 4,716 1,792 2,488 436
Armenia 6 4 3 0
Aruba 634 364 266 3
Australia 193,409 148,868 21,947 22,594
Austria 10,977 9,576 1,207 193
Azerbaijan 1,182 1,134 48 *
Bahamas 21,195 10,389 10,124 682
Bahrain 820 577 197 46
Bangladesh 7 2 4 *
Barbados 1,358 463 860 35
Belarus 9 9 * 0
Belgium 38,116 31,253 6,344 519
Belize 414 104 254 57
Benin * 0 * 0
Bermuda 95,341 37,978 52,015 5,347
Bhutan 53 0 53 0
Bolivia 213 78 124 11
Bonaire, Sint Eustatius & Saba1 99 19 28 52
Bosnia and Herzegovina 1 1 * 0
Botswana 605 540 59 6
Brazil 4,699 3,468 1,142 89
British Indian Ocean Territory * 0 * *
British Virgin Islands 111,724 48,608 56,174 6,942
Brunei 4,269 1,449 2,669 151
Bulgaria 151 117 34 *
Burkina Faso 178 60 118 *
Burma 2 * 1 *
Burundi * * 0 *
Cambodia 5 2 3 *
Cameroon 3 2 1 *
Canada 810,003 640,713 134,215 35,075
Cape Verde * 0 * 0
Cayman Islands 927,697 530,775 235,981 160,940
Central African Republic * 0 0 *
Chad * * * 0
* Greater than zero but less than $500,000.n.a. Not available.
A-19
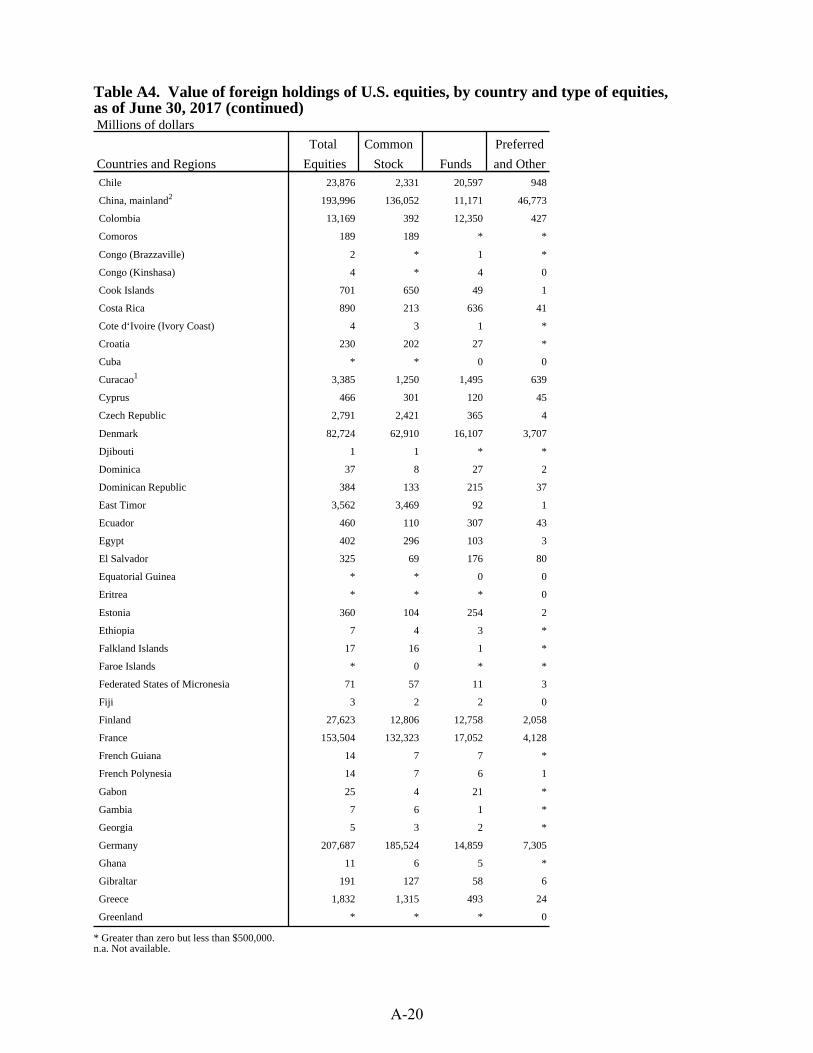
Table A4. Value of foreign holdings of U.S. equities, by country and type of equities,as of June 30, 2017 (continued) Millions of dollars
Total Common Preferred
Countries and Regions Equities Stock Funds and Other Chile 23,876 2,331 20,597 948
China, mainland2 193,996 136,052 11,171 46,773
Colombia 13,169 392 12,350 427
Comoros 189 189 * *
Congo (Brazzaville) 2 * 1 *
Congo (Kinshasa) 4 * 4 0
Cook Islands 701 650 49 1
Costa Rica 890 213 636 41
Cote d‘Ivoire (Ivory Coast) 4 3 1 *
Croatia 230 202 27 *
Cuba * * 0 0
Curacao1 3,385 1,250 1,495 639
Cyprus 466 301 120 45
Czech Republic 2,791 2,421 365 4
Denmark 82,724 62,910 16,107 3,707
Djibouti 1 1 * *
Dominica 37 8 27 2
Dominican Republic 384 133 215 37
East Timor 3,562 3,469 92 1
Ecuador 460 110 307 43
Egypt 402 296 103 3
El Salvador 325 69 176 80
Equatorial Guinea * * 0 0
Eritrea * * * 0
Estonia 360 104 254 2
Ethiopia 7 4 3 *
Falkland Islands 17 16 1 *
Faroe Islands * 0 * *
Federated States of Micronesia 71 57 11 3
Fiji 3 2 2 0
Finland 27,623 12,806 12,758 2,058
France 153,504 132,323 17,052 4,128
French Guiana 14 7 7 *
French Polynesia 14 7 6 1
Gabon 25 4 21 *
Gambia 7 6 1 *
Georgia 5 3 2 *
Germany 207,687 185,524 14,859 7,305
Ghana 11 6 5 *
Gibraltar 191 127 58 6
Greece 1,832 1,315 493 24
Greenland * * * 0
* Greater than zero but less than $500,000.n.a. Not available.
A-20

Table A4. Value of foreign holdings of U.S. equities, by country and type of equities,as of June 30, 2017 (continued) Millions of dollars
Total Common Preferred
Countries and Regions Equities Stock Funds and Other Grenada 57 22 34 1
Guadeloupe3 13 12 1 *
Guatemala 335 161 144 30
Guernsey 31,582 14,348 7,494 9,740
Guinea * * * 0
Guyana 33 10 16 7
Haiti 119 56 34 30
Holy See (Vatican) 5 1 4 *
Honduras 84 23 56 6
Hong Kong 95,754 64,934 24,948 5,872
Hungary 808 160 648 1
Iceland 1,079 482 578 19
India 2,653 2,009 583 61
Indonesia 288 177 89 22
Iran 2 2 * 0
Iraq 1 * * *
Ireland 295,681 265,083 23,861 6,737
Isle of Man 951 462 401 88
Israel 48,853 23,669 21,401 3,783
Italy 27,068 24,554 2,040 474
Jamaica 278 99 175 4
Japan 490,186 394,055 88,287 7,845
Jersey 15,889 10,692 2,673 2,524
Jordan 85 52 32 2
Kazakhstan 5,647 5,562 85 *
Kenya 31 13 17 1
Kiribati 289 0 174 115
Korea, South 101,829 75,694 16,402 9,733
Kosovo4 1 1 1 0
Kuwait 160,368 141,997 9,837 8,534
Kyrgyzstan * * 0 0
Laos * * * 0
Latvia 125 95 30 *
Lebanon 170 106 42 23
Liberia 655 205 398 52
Libya 66 1 * 65
Liechtenstein 3,251 2,755 314 182
Lithuania 43 30 12 *
Luxembourg 531,881 483,672 38,234 9,975
Macau 1,346 382 964 1
Macedonia 2 2 1 *
Madagascar 10 0 10 0
* Greater than zero but less than $500,000.n.a. Not available.
A-21

Table A4. Value of foreign holdings of U.S. equities, by country and type of equities,as of June 30, 2017 (continued) Millions of dollars
Total Common Preferred
Countries and Regions Equities Stock Funds and Other Malawi 5 2 3 0
Malaysia 12,540 11,769 677 94
Maldives * * * 0
Mali 3 * 3 *
Malta 621 352 264 5
Marshall Islands 798 292 473 32
Martinique 1 1 1 0
Mauritania * * * *
Mauritius 4,388 4,310 66 12
Mexico 46,958 10,866 35,295 797
Moldova 4 4 * 0
Monaco 1,332 788 323 221
Mongolia 1 1 * 0
Montenegro4 1 1 0 0
Montserrat 16 14 1 *
Morocco 224 199 21 3
Mozambique 5 5 1 *
Namibia 689 641 46 2
Nauru 3 2 1 *
Nepal 9 2 7 *
Netherlands 253,512 163,610 72,741 17,161
New Caledonia 1 1 * 0
New Zealand 19,155 14,210 4,648 298
Nicaragua 75 24 29 22
Niger 1 1 * *
Nigeria 93 71 9 13
Norway 238,952 223,867 14,810 276
Oman 7,375 2,747 4,242 387
Pakistan 66 44 21 1
Palau 133 77 36 20
Panama 12,395 5,117 6,013 1,264
Papua New Guinea 2 1 1 *
Paraguay 154 68 74 12
Peru 10,908 275 10,368 265
Philippines 2,851 617 2,108 126
Pitcairn Island * * * 0
Poland 1,567 775 791 2
Portugal 3,475 1,565 1,861 49
Qatar 2,673 2,197 47 428
Reunion * * 0 0
Romania 69 61 8 *
Russia 423 259 154 9
* Greater than zero but less than $500,000.n.a. Not available.
A-22

Table A4. Value of foreign holdings of U.S. equities, by country and type of equities,as of June 30, 2017 (continued) Millions of dollars
Total Common Preferred
Countries and Regions Equities Stock Funds and Other Rwanda 1 * * *
Saint Kitts and Nevis 1,782 819 865 98
Saint Lucia 191 43 137 11
Saint Martin & Saint Barthelemy3 2 2 * *
Saint Vincent and the Grenadines 46 20 26 *
Samoa 159 37 119 4
San Marino 1 * 1 0
Saudi Arabia 45,515 34,964 4,434 6,117
Senegal 5 1 4 0
Serbia and Montenegro4 14 11 3 *
Seychelles 150 52 88 10
Sierra Leone * * * 0
Singapore 167,099 136,777 17,240 13,083
Sint Maarten1 134 60 70 4
Slovakia 51 35 15 2
Slovenia 1,138 753 384 1
Solomon Islands * * 0 0
Somalia * * * *
South Africa 10,346 7,621 2,386 339
South Sudan * * 0 0
Spain 17,939 11,195 5,805 938
Sri Lanka 29 21 8 *
Sudan * 0 * 0
Suriname 68 15 46 8
Swaziland 9 6 3 *
Sweden 130,441 115,038 8,485 6,918
Switzerland 412,722 340,788 63,424 8,509
Syria 4 1 4 *
Taiwan 55,862 24,875 28,799 2,189
Tajikistan 1 1 * *
Tanzania 13 7 6 *
Thailand 2,630 834 1,770 27
Togo 1 1 * *
Tokelau * * 0 0
Tonga 1 1 * *
Trinidad and Tobago 2,559 1,919 596 44
Tunisia 871 16 854 *
Turkey 645 239 402 5
Turkmenistan * * 0 0
Turks and Caicos Islands 408 195 186 28
Uganda 18 14 4 0
Ukraine 38 8 27 3
* Greater than zero but less than $500,000.n.a. Not available.
A-23
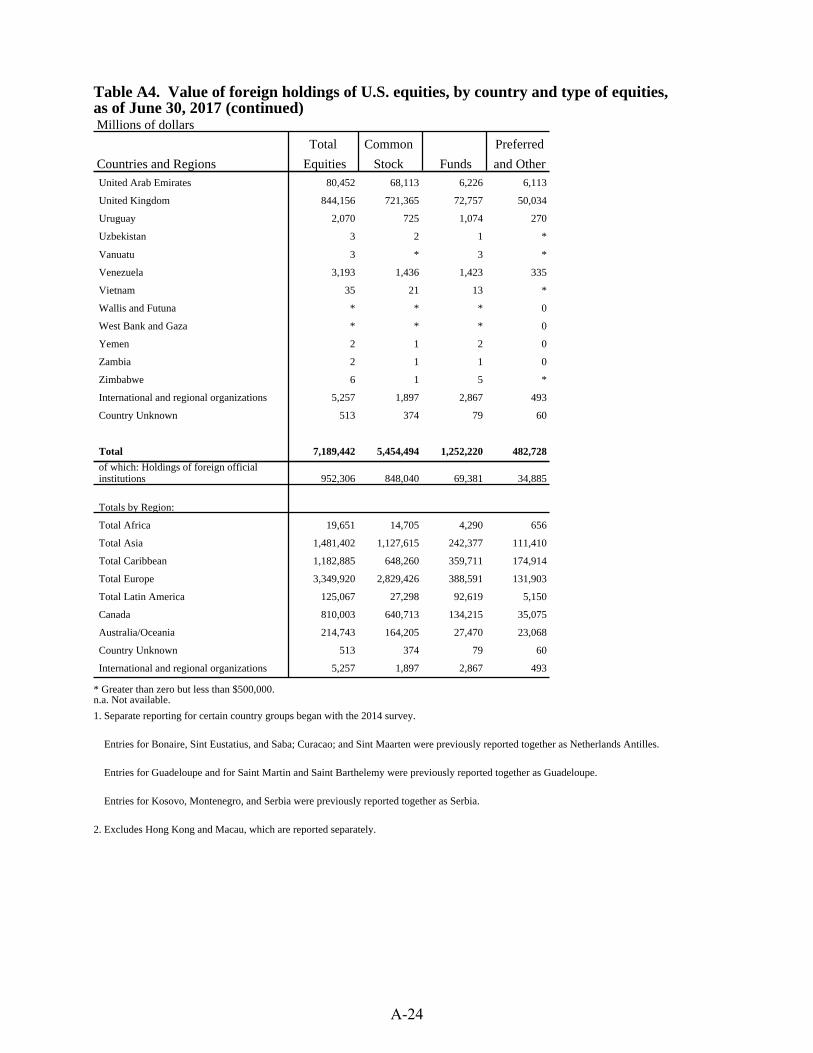
Table A4. Value of foreign holdings of U.S. equities, by country and type of equities,as of June 30, 2017 (continued) Millions of dollars
Total Common Preferred
Countries and Regions Equities Stock Funds and Other United Arab Emirates 80,452 68,113 6,226 6,113
United Kingdom 844,156 721,365 72,757 50,034
Uruguay 2,070 725 1,074 270
Uzbekistan 3 2 1 *
Vanuatu 3 * 3 *
Venezuela 3,193 1,436 1,423 335
Vietnam 35 21 13 *
Wallis and Futuna * * * 0
West Bank and Gaza * * * 0
Yemen 2 1 2 0
Zambia 2 1 1 0
Zimbabwe 6 1 5 *
International and regional organizations 5,257 1,897 2,867 493
Country Unknown 513 374 79 60
Total 7,189,442 5,454,494 1,252,220 482,728
of which: Holdings of foreign official institutions 952,306 848,040 69,381 34,885
Totals by Region:
Total Africa 19,651 14,705 4,290 656
Total Asia 1,481,402 1,127,615 242,377 111,410
Total Caribbean 1,182,885 648,260 359,711 174,914
Total Europe 3,349,920 2,829,426 388,591 131,903
Total Latin America 125,067 27,298 92,619 5,150
Canada 810,003 640,713 134,215 35,075
Australia/Oceania 214,743 164,205 27,470 23,068
Country Unknown 513 374 79 60
International and regional organizations 5,257 1,897 2,867 493
* Greater than zero but less than $500,000.n.a. Not available.
1. Separate reporting for certain country groups began with the 2014 survey.
Entries for Bonaire, Sint Eustatius, and Saba; Curacao; and Sint Maarten were previously reported together as Netherlands Antilles.
Entries for Guadeloupe and for Saint Martin and Saint Barthelemy were previously reported together as Guadeloupe.
Entries for Kosovo, Montenegro, and Serbia were previously reported together as Serbia.
2. Excludes Hong Kong and Macau, which are reported separately.
A-24

Table A5. Foreign holdings of U.S. long-term asset-backed securities, by country andtype of security, as of June 30, 2017 Millions of dollars
Total Agency Corporate ABS
Countries and Regions LT ABS ABS Total MBS NonMBS Andorra 41 40 1 1 0
Anguilla 89 16 73 62 12
Antigua and Barbuda * * * * *
Argentina 11 9 2 1 1
Aruba 246 15 231 * 231
Australia 5,547 2,237 3,311 2,377 934
Austria 599 483 116 9 107
Bahamas 4,451 1,069 3,382 637 2,745
Bahrain 169 131 39 19 20
Barbados 12,857 1,393 11,464 9,609 1,855
Belgium 16,013 1,831 14,182 3,044 11,138
Belize 1 1 * 0 *
Bermuda 44,721 23,156 21,566 11,807 9,758
Bolivia 1 1 * * *
Botswana * * 0 0 0
Brazil 2 2 1 * 1
British Virgin Islands 2,499 939 1,560 1,012 548
Brunei 136 1 135 86 49
Bulgaria * * * 0 *
Burma * * 0 0 0
Canada 28,534 3,646 24,888 20,087 4,800
Cayman Islands 128,195 24,897 103,298 77,181 26,117
Chile 15 9 6 * 6
China, mainland2 180,947 177,546 3,401 2,243 1,158
Colombia 1,028 1,026 2 * 1
Cook Islands 1 * 1 0 1
Costa Rica 5 5 1 * 1
Curacao1 48 25 22 5 17
Denmark 1,072 331 740 490 250
Dominica * 0 * * *
Dominican Republic 5 4 1 * 1
Ecuador 3 3 * * *
Egypt 201 200 2 2 0
El Salvador 9 9 * * *
Falkland Islands * 0 * 0 *
Federated States of Micronesia 5 5 0 0 0
Finland 14 0 14 * 13
France 9,299 3,037 6,261 3,223 3,038
French Polynesia * * 0 0 0
Georgia * * 0 0 0
Germany 27,058 5,587 21,471 1,930 19,542
Ghana 1 0 1 0 1
* Greater than zero but less than $500,000.n.a. Not available.
A-25

Table A5. Foreign holdings of U.S. long-term asset-backed securities, by country andtype of security, as of June 30, 2017 (continued) Millions of dollars
Total Agency Corporate ABS
Countries and Regions LT ABS ABS Total MBS NonMBS Gibraltar 1 1 0 0 0
Greece 1 1 * * 0
Guatemala 53 9 44 14 30
Guernsey 403 114 289 169 120
Guyana * * * 0 *
Haiti 6 * 6 * 6
Honduras 1 * * * 0
Hong Kong 10,220 8,815 1,405 461 945
Hungary 856 856 0 0 0
India 121 121 * * *
Indonesia 3,706 3,640 65 0 65
Ireland 77,656 33,663 43,994 22,148 21,846
Isle of Man * * * 0 *
Israel 1,804 1,578 227 138 89
Italy 411 265 146 33 113
Jamaica * 0 * 0 *
Japan 235,465 221,528 13,938 5,196 8,742
Jersey 630 220 410 383 27
Jordan * * 0 0 0
Kazakhstan * * 0 0 0
Korea, South 35,987 33,891 2,096 1,372 725
Kuwait 5,020 4,260 760 387 373
Latvia 1,488 1,077 411 5 406
Lebanon * * 0 0 0
Liberia 97 53 44 26 18
Liechtenstein 88 72 16 * 16
Luxembourg 67,351 28,314 39,037 16,107 22,930
Macau 417 190 227 56 171
Malaysia 12,093 11,905 188 15 172
Malta 3 0 3 0 3
Marshall Islands 3 1 1 1 *
Mauritius 311 10 301 7 294
Mexico 5,409 5,223 186 2 185
Monaco 125 118 7 * 7
Netherlands 14,901 11,462 3,439 2,802 637
New Zealand 713 579 134 99 35
Nicaragua * * * 0 *
Nigeria 211 211 0 0 0
Norway 402 2 399 88 311
Oman 88 75 14 4 10
Palau 5 5 * 0 *
Panama 1,121 956 164 80 84
* Greater than zero but less than $500,000.n.a. Not available.
A-26

Table A5. Foreign holdings of U.S. long-term asset-backed securities, by country andtype of security, as of June 30, 2017 (continued) Millions of dollars
Total Agency Corporate ABS
Countries and Regions LT ABS ABS Total MBS NonMBS Paraguay 2 2 * * 0
Peru 15 1 14 2 13
Philippines 21 21 * * 0
Poland * 0 * * 0
Portugal 150 147 2 0 2
Qatar 709 238 471 412 59
Russia 2 1 1 * 1
Saint Kitts and Nevis 13 11 2 1 2
Saint Lucia * * * 0 *
Saint Vincent and the Grenadines * * 0 0 0
Samoa * * * * *
Saudi Arabia 5,785 4,642 1,142 459 683
Seychelles 2 * 2 0 2
Singapore 10,146 4,615 5,531 1,103 4,429
Sint Maarten1 4 4 * 0 *
Slovenia * 0 * * 0
South Africa 1,650 1,553 97 97 0
Spain 1,661 593 1,069 11 1,058
Suriname * * * * 0
Swaziland 90 10 80 34 46
Sweden 756 89 667 114 553
Switzerland 22,400 13,867 8,533 5,769 2,764
Taiwan 228,059 227,073 986 831 155
Thailand 3,910 3,901 10 7 3
Trinidad and Tobago 1,428 724 704 34 670
Tunisia * 0 * 0 *
Turkey * * 0 0 0
Turks and Caicos Islands 17 14 3 2 2
Uganda 84 15 69 32 37
Ukraine * 0 * 0 *
United Arab Emirates 1,017 698 319 243 75
United Kingdom 30,425 9,809 20,616 8,066 12,550
Uruguay 498 470 28 * 28
Venezuela 25 16 9 6 4
Vietnam * * * 0 *
International and regional organizations 11,942 5,332 6,610 308 6,301
Country Unknown 1 1 * * 0
* Greater than zero but less than $500,000.n.a. Not available.
A-27

Table A5. Foreign holdings of U.S. long-term asset-backed securities, by country andtype of security, as of June 30, 2017 (continued) Millions of dollars
Total Agency Corporate ABS
Countries and Regions LT ABS ABS Total MBS NonMBS
Total 1,261,804 890,712 371,092 200,951 170,142
of which: Holdings of foreign official institutions 398,036 383,724 14,312 5,337 8,975
Totals by Region:
Total Africa 2,648 2,053 595 197 398
Total Asia 735,821 704,867 30,954 13,033 17,921
Total Caribbean 194,579 52,266 142,313 100,350 41,963
Total Europe 273,805 111,979 161,826 64,394 97,433
Total Latin America 8,200 7,741 459 105 354
Canada 28,534 3,646 24,888 20,087 4,800
Australia/Oceania 6,274 2,826 3,448 2,477 971
Country Unknown 1 1 * * 0
International and regional organizations 11,942 5,332 6,610 308 6,301
* Greater than zero but less than $500,000.n.a. Not available.
1. Separate reporting for certain country groups began with the 2014 survey.
Entries for Bonaire, Sint Eustatius, and Saba; Curacao; and Sint Maarten were previously reported together as Netherlands Antilles.
Entries for Guadeloupe and for Saint Martin and Saint Barthelemy were previously reported together as Guadeloupe.
Entries for Kosovo, Montenegro, and Serbia were previously reported together as Serbia.
2. Excludes Hong Kong and Macau, which are reported separately.
A-28
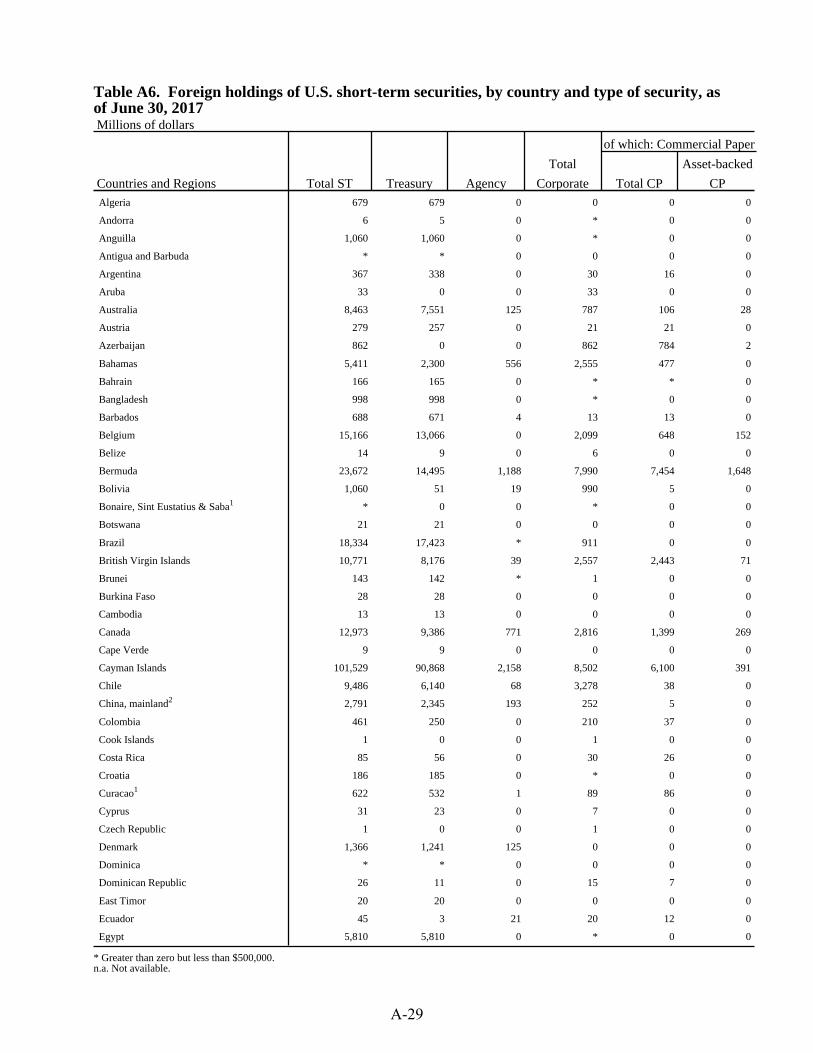
Table A6. Foreign holdings of U.S. short-term securities, by country and type of security, asof June 30, 2017 Millions of dollars
of which: Commercial Paper
Total Asset-backed
Countries and Regions Total ST Treasury Agency Corporate Total CP CP Algeria 679 679 0 0 0 0
Andorra 6 5 0 * 0 0
Anguilla 1,060 1,060 0 * 0 0
Antigua and Barbuda * * 0 0 0 0
Argentina 367 338 0 30 16 0
Aruba 33 0 0 33 0 0
Australia 8,463 7,551 125 787 106 28
Austria 279 257 0 21 21 0
Azerbaijan 862 0 0 862 784 2
Bahamas 5,411 2,300 556 2,555 477 0
Bahrain 166 165 0 * * 0
Bangladesh 998 998 0 * 0 0
Barbados 688 671 4 13 13 0
Belgium 15,166 13,066 0 2,099 648 152
Belize 14 9 0 6 0 0
Bermuda 23,672 14,495 1,188 7,990 7,454 1,648
Bolivia 1,060 51 19 990 5 0
Bonaire, Sint Eustatius & Saba1 * 0 0 * 0 0
Botswana 21 21 0 0 0 0
Brazil 18,334 17,423 * 911 0 0
British Virgin Islands 10,771 8,176 39 2,557 2,443 71
Brunei 143 142 * 1 0 0
Burkina Faso 28 28 0 0 0 0
Cambodia 13 13 0 0 0 0
Canada 12,973 9,386 771 2,816 1,399 269
Cape Verde 9 9 0 0 0 0
Cayman Islands 101,529 90,868 2,158 8,502 6,100 391
Chile 9,486 6,140 68 3,278 38 0
China, mainland2 2,791 2,345 193 252 5 0
Colombia 461 250 0 210 37 0
Cook Islands 1 0 0 1 0 0
Costa Rica 85 56 0 30 26 0
Croatia 186 185 0 * 0 0
Curacao1 622 532 1 89 86 0
Cyprus 31 23 0 7 0 0
Czech Republic 1 0 0 1 0 0
Denmark 1,366 1,241 125 0 0 0
Dominica * * 0 0 0 0
Dominican Republic 26 11 0 15 7 0
East Timor 20 20 0 0 0 0
Ecuador 45 3 21 20 12 0
Egypt 5,810 5,810 0 * 0 0
* Greater than zero but less than $500,000.n.a. Not available.
A-29

Table A6. Foreign holdings of U.S. short-term securities, by country and type of security, asof June 30, 2017 (continued) Millions of dollars
of which: Commercial Paper
Total Asset-backed
Countries and Regions Total ST Treasury Agency Corporate Total CP CP El Salvador 418 357 0 62 0 0
Estonia 8 8 0 0 0 0
Federated States of Micronesia 3 0 * 3 0 0
Fiji 35 0 0 35 0 0
Finland 376 322 0 54 54 0
France 16,210 14,757 1 1,452 1,173 238
French Polynesia 4 3 0 1 0 0
Germany 4,819 4,366 166 287 108 100
Ghana 45 45 0 0 0 0
Gibraltar 669 669 0 0 0 0
Greece 565 563 0 2 0 0
Grenada * 0 0 * 0 0
Guatemala 93 45 0 47 4 0
Guernsey 1,314 1,230 44 40 37 10
Guyana 4 4 0 0 0 0
Haiti 180 118 61 * 0 0
Honduras 48 46 0 2 0 0
Hong Kong 63,538 63,228 53 257 183 0
Hungary 286 286 0 0 0 0
Iceland 25 25 0 0 0 0
India 16,143 16,088 0 55 0 0
Indonesia 2,511 2,284 0 227 0 0
Iraq 10,026 10,026 0 0 0 0
Ireland 132,245 44,412 3,965 83,869 37,000 17,719
Isle of Man 739 132 0 608 277 64
Israel 1,445 1,347 3 95 43 0
Italy 2,335 2,289 6 40 34 34
Jamaica 12 12 0 * 0 0
Japan 57,715 56,113 558 1,044 761 399
Jersey 2,644 2,233 13 399 335 29
Kazakhstan 15,015 15,015 0 0 0 0
Korea, South 10,323 6,300 32 3,991 862 0
Kuwait 20,995 3,258 51 17,686 8,112 4,500
Latvia 153 83 14 56 56 0
Lesotho 18 18 0 0 0 0
Liberia 7 7 0 0 0 0
Liechtenstein * * 0 0 0 0
Lithuania 18 18 0 0 0 0
Luxembourg 94,885 38,151 3,078 53,656 19,885 7,216
Macau 155 12 12 132 8 0
Malaysia 63 60 0 3 1 0
Malta 3 3 0 * 0 0
* Greater than zero but less than $500,000.n.a. Not available.
A-30

Table A6. Foreign holdings of U.S. short-term securities, by country and type of security, asof June 30, 2017 (continued) Millions of dollars
of which: Commercial Paper
Total Asset-backed
Countries and Regions Total ST Treasury Agency Corporate Total CP CP Marshall Islands 28 28 0 * 0 0
Mauritius 624 435 0 189 81 0
Mexico 6,093 4,439 52 1,603 548 0
Monaco 91 61 0 30 30 0
Nepal 150 150 0 0 0 0
Netherlands 14,971 7,883 1,633 5,454 4,622 366
New Zealand 343 337 5 1 0 0
Nicaragua 179 101 0 78 78 0
Nigeria 120 120 0 0 0 0
Norway 719 252 0 467 464 0
Pakistan 2,347 2,346 0 1 0 0
Palau 1 0 0 1 0 0
Panama 1,125 604 1 520 213 0
Paraguay 9 2 0 7 6 0
Peru 537 1 9 527 33 0
Philippines 675 511 0 164 0 0
Poland * 0 0 * 0 0
Portugal 91 90 0 * 0 0
Qatar 2,599 2,554 29 16 16 0
Russia 6,126 6,124 0 1 0 0
Saint Kitts and Nevis 142 49 0 93 13 0
Saint Martin & Saint Barthelemy3 * 0 0 * 0 0
Samoa 2 0 0 2 0 0
Saudi Arabia 42,100 41,088 105 907 406 34
Serbia and Montenegro4 230 230 0 0 0 0
Singapore 16,451 3,749 709 11,993 3,986 1,174
Sint Maarten1 1 1 0 0 0 0
Slovakia 33 33 0 0 0 0
Slovenia 263 263 0 0 0 0
South Africa 205 189 0 16 0 0
Spain 1,157 952 36 169 7 0
Suriname 44 44 0 * 0 0
Sweden 274 274 0 * 0 0
Switzerland 33,518 30,968 56 2,494 1,480 15
Taiwan 3,540 3,318 25 197 0 0
Thailand 12,390 12,360 0 30 0 0
Tonga * 0 0 * 0 0
Trinidad and Tobago 408 327 0 80 33 0
Turkey 35,793 35,786 0 7 6 0
Turks and Caicos Islands 6 6 0 0 0 0
Uganda 518 518 0 0 0 0
Ukraine * 0 0 * 0 0
* Greater than zero but less than $500,000.n.a. Not available.
A-31

Table A6. Foreign holdings of U.S. short-term securities, by country and type of security, asof June 30, 2017 (continued) Millions of dollars
of which: Commercial Paper
Total Asset-backed
Countries and Regions Total ST Treasury Agency Corporate Total CP CP United Arab Emirates 8,985 8,886 14 85 6 0
United Kingdom 41,322 34,612 733 5,976 3,139 1,067
Uruguay 1,452 1,354 0 99 30 0
Vanuatu 13 13 0 0 0 0
Venezuela 185 69 0 116 53 0
Vietnam * 0 0 * 0 0
International and regional organizations 14,821 8,341 31 6,449 2,265 54
Total 930,446 677,731 16,765 235,950 106,124 35,582
of which: Holdings of foreign official institutions 363,004 329,244 427 33,333 11,125 4,520
Totals by Region:
Total Africa 8,086 7,881 0 206 81 0
Total Asia 276,280 237,362 1,784 37,134 14,390 6,108
Total Caribbean 144,561 118,626 4,007 21,927 16,626 2,110
Total Europe 424,792 256,868 9,870 158,053 70,159 27,013
Total Latin America 40,039 31,335 170 8,534 1,099 0
Canada 12,973 9,386 771 2,816 1,399 269
Australia/Oceania 8,894 7,932 130 832 106 28
Country Unknown 0 0 0 0 0 0
International and regional organizations 14,821 8,341 31 6,449 2,265 54
* Greater than zero but less than $500,000.n.a. Not available.
1. Separate reporting for certain country groups began with the 2014 survey.
Entries for Bonaire, Sint Eustatius, and Saba; Curacao; and Sint Maarten were previously reported together as Netherlands Antilles.
Entries for Guadeloupe and for Saint Martin and Saint Barthelemy were previously reported together as Guadeloupe.
Entries for Kosovo, Montenegro, and Serbia were previously reported together as Serbia.
2. Excludes Hong Kong and Macau, which are reported separately.
A-32

Table A7. Foreign holdings of U.S. securities, by country, as of selected survey dates
Billions of dollars
June June June June June June June June
Countries and Regions 2010 2011 2012 2013 2014 2015 2016 2017 Afghanistan 1 1 1 1 1 1 1 1
Albania * * * 1 1 * * *
Algeria 1 1 1 1 1 1 1 1
Andorra 1 2 1 2 2 2 3 2
Angola 1 2 1 1 1 1 1 1
Anguilla 11 17 16 23 17 20 18 17
Antigua and Barbuda * * * * * * * *
Argentina 9 9 8 8 8 7 7 7
Armenia * * * * * * * 1
Aruba 1 1 1 2 1 1 1 1
Australia 118 161 161 215 238 242 237 271
Austria 9 12 13 13 16 18 19 20
Azerbaijan 3 5 7 5 8 8 7 7
Bahamas 29 33 29 29 33 37 42 52
Bahrain 7 6 3 3 3 3 2 2
Bangladesh 2 2 1 1 1 1 * 1
Barbados 19 12 14 13 13 16 23 24
Belarus * * * * * * * *
Belgium 408 443 447 490 713 602 589 691
Belize * * * * 1 1 1 1
Benin * * * * * * * *
Bermuda 249 272 300 325 301 287 307 318
Bhutan * * * * * * * *
Bolivia 2 1 1 1 3 3 2 2
Bonaire, Sint Eustatius & Saba1 n.a. n.a. n.a. n.a. * * * *
Bosnia and Herzegovina * * * * * * * *
Botswana 3 3 3 2 2 2 2 2
Brazil 169 221 252 261 263 268 259 277
British Indian Ocean Territory * * * * * * * *
British Virgin Islands 85 107 131 139 176 173 161 166
Brunei 2 3 4 3 4 3 3 5
Bulgaria * * * * * * * *
Burkina Faso * * * * * * * *
Burma * * * * * * * *
Burundi * * * * * * * *
Cambodia 1 1 1 1 * 2 2 2
Cameroon * * * * * * * *
Canada 424 559 635 814 988 992 951 1,061
Cape Verde * * * * * * * *
Cayman Islands 743 889 1,031 1,168 1,409 1,506 1,525 1,687
Central African Republic * * * * * * * *
Chad * * * * * * * *
* Greater than zero but less than $500 million.n.a. Not available.
A-33
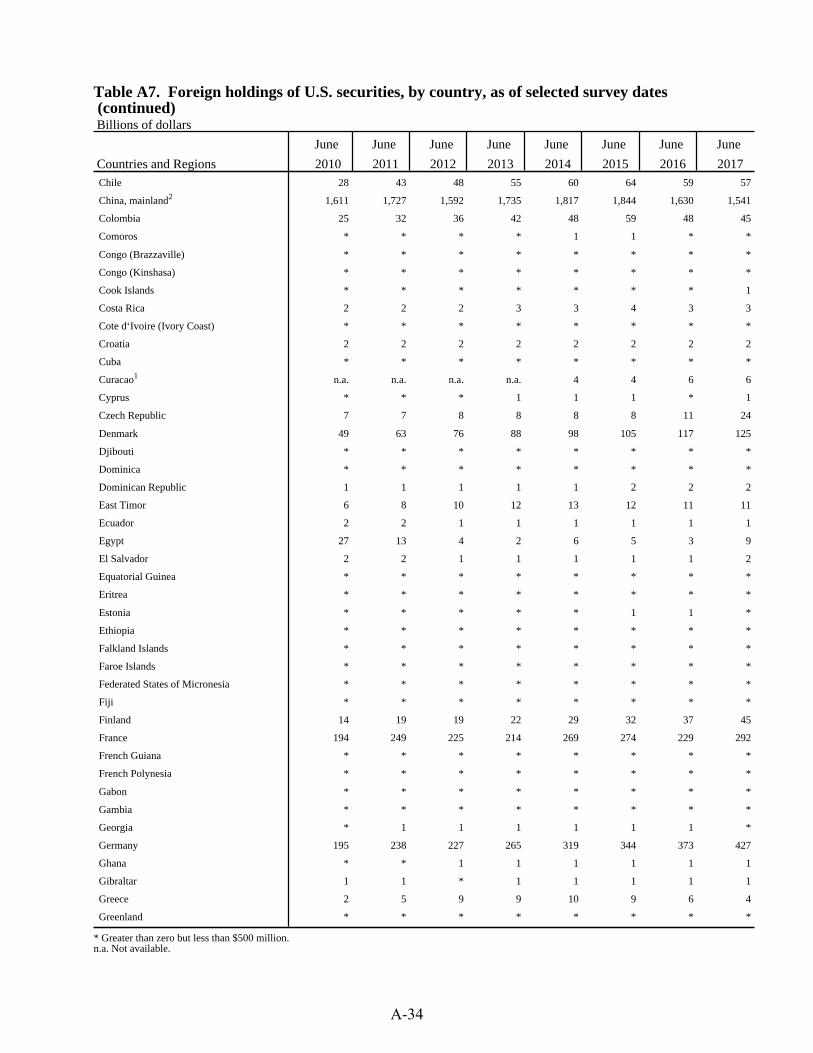
Table A7. Foreign holdings of U.S. securities, by country, as of selected survey dates (continued) Billions of dollars
June June June June June June June June
Countries and Regions 2010 2011 2012 2013 2014 2015 2016 2017 Chile 28 43 48 55 60 64 59 57
China, mainland2 1,611 1,727 1,592 1,735 1,817 1,844 1,630 1,541
Colombia 25 32 36 42 48 59 48 45
Comoros * * * * 1 1 * *
Congo (Brazzaville) * * * * * * * *
Congo (Kinshasa) * * * * * * * *
Cook Islands * * * * * * * 1
Costa Rica 2 2 2 3 3 4 3 3
Cote d‘Ivoire (Ivory Coast) * * * * * * * *
Croatia 2 2 2 2 2 2 2 2
Cuba * * * * * * * *
Curacao1 n.a. n.a. n.a. n.a. 4 4 6 6
Cyprus * * * 1 1 1 * 1
Czech Republic 7 7 8 8 8 8 11 24
Denmark 49 63 76 88 98 105 117 125
Djibouti * * * * * * * *
Dominica * * * * * * * *
Dominican Republic 1 1 1 1 1 2 2 2
East Timor 6 8 10 12 13 12 11 11
Ecuador 2 2 1 1 1 1 1 1
Egypt 27 13 4 2 6 5 3 9
El Salvador 2 2 1 1 1 1 1 2
Equatorial Guinea * * * * * * * *
Eritrea * * * * * * * *
Estonia * * * * * 1 1 *
Ethiopia * * * * * * * *
Falkland Islands * * * * * * * *
Faroe Islands * * * * * * * *
Federated States of Micronesia * * * * * * * *
Fiji * * * * * * * *
Finland 14 19 19 22 29 32 37 45
France 194 249 225 214 269 274 229 292
French Guiana * * * * * * * *
French Polynesia * * * * * * * *
Gabon * * * * * * * *
Gambia * * * * * * * *
Georgia * 1 1 1 1 1 1 *
Germany 195 238 227 265 319 344 373 427
Ghana * * 1 1 1 1 1 1
Gibraltar 1 1 * 1 1 1 1 1
Greece 2 5 9 9 10 9 6 4
Greenland * * * * * * * *
* Greater than zero but less than $500 million.n.a. Not available.
A-34

Table A7. Foreign holdings of U.S. securities, by country, as of selected survey dates (continued) Billions of dollars
June June June June June June June June
Countries and Regions 2010 2011 2012 2013 2014 2015 2016 2017 Grenada * * * * * * * *
Guadeloupe3 * * * * * * * *
Guatemala 4 4 4 4 3 3 3 5
Guernsey 22 22 30 29 38 40 38 43
Guinea * * * * * * * *
Guinea-Bissau * * * * * 0 0 0
Guyana * * * * * * * *
Haiti 1 1 1 2 1 1 1 2
Holy See (Vatican) * * * * * * * *
Honduras 1 1 1 1 1 1 1 1
Hong Kong 293 292 223 215 263 298 305 350
Hungary 1 3 3 3 2 2 3 3
Iceland 1 1 1 2 2 2 3 3
India 41 45 55 62 75 119 119 133
Indonesia 33 47 36 26 28 25 25 34
Iran * * * * * * * *
Iraq 22 32 49 45 26 30 15 16
Ireland 356 405 453 575 729 831 931 1,068
Isle of Man 4 3 2 2 2 2 2 3
Israel 37 47 53 61 67 69 76 88
Italy 41 42 52 63 70 67 78 78
Jamaica 1 * * 1 1 1 1 1
Japan 1,393 1,585 1,835 1,766 1,917 1,903 1,960 1,998
Jersey 29 34 28 25 27 27 30 25
Jordan 2 2 1 1 1 1 * 1
Kazakhstan 23 24 33 31 43 39 27 29
Kenya * * * 1 1 1 1 1
Kiribati * * * * * * * *
Korea, South 122 133 148 155 180 209 236 282
Kosovo4 n.a. n.a. n.a. n.a. * * * *
Kuwait 80 98 122 156 187 191 189 230
Kyrgyzstan * * * * * * * *
Laos * * * * * * * *
Latvia 1 1 1 1 1 2 2 2
Lebanon 1 1 3 1 1 * * *
Lesotho * * * * * * * *
Liberia 2 2 1 1 1 1 1 1
Libya 2 4 4 5 1 * * 1
Liechtenstein 2 3 2 3 4 3 3 4
Lithuania * * * * * * * *
Luxembourg 622 817 837 990 1,198 1,297 1,349 1,398
Macau 1 1 1 1 2 3 4 4
* Greater than zero but less than $500 million.n.a. Not available.
A-35
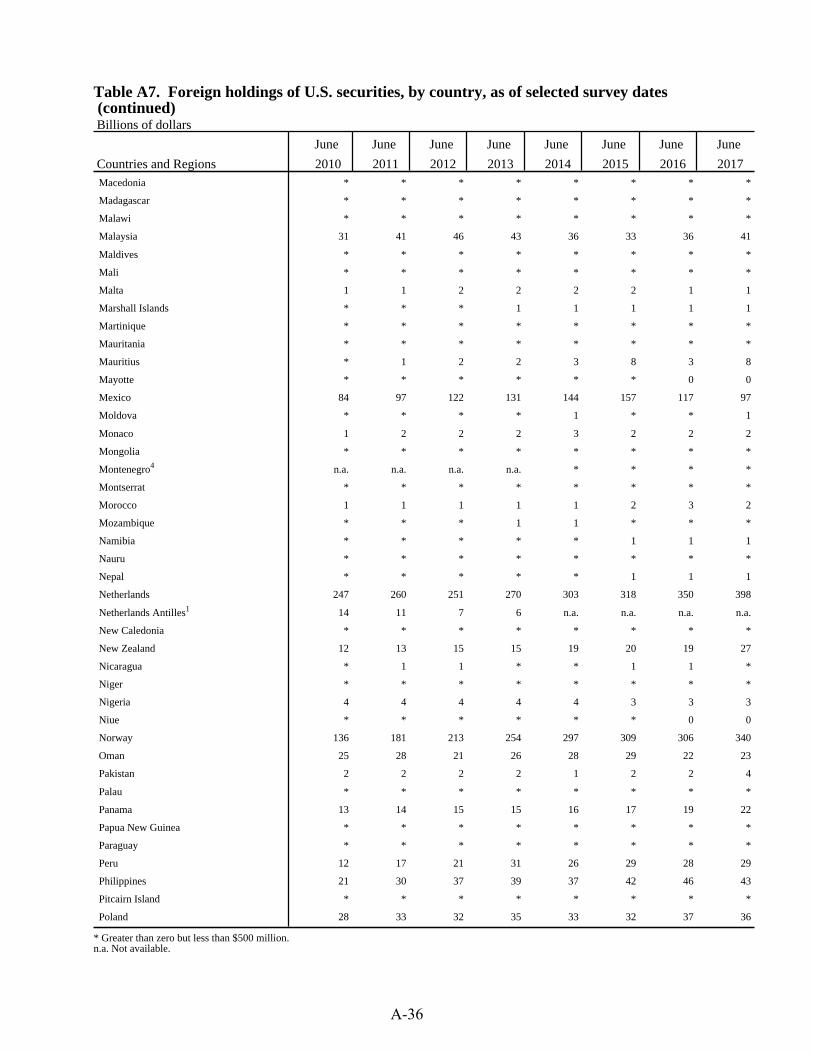
Table A7. Foreign holdings of U.S. securities, by country, as of selected survey dates (continued) Billions of dollars
June June June June June June June June
Countries and Regions 2010 2011 2012 2013 2014 2015 2016 2017 Macedonia * * * * * * * *
Madagascar * * * * * * * *
Malawi * * * * * * * *
Malaysia 31 41 46 43 36 33 36 41
Maldives * * * * * * * *
Mali * * * * * * * *
Malta 1 1 2 2 2 2 1 1
Marshall Islands * * * 1 1 1 1 1
Martinique * * * * * * * *
Mauritania * * * * * * * *
Mauritius * 1 2 2 3 8 3 8
Mayotte * * * * * * 0 0
Mexico 84 97 122 131 144 157 117 97
Moldova * * * * 1 * * 1
Monaco 1 2 2 2 3 2 2 2
Mongolia * * * * * * * *
Montenegro4 n.a. n.a. n.a. n.a. * * * *
Montserrat * * * * * * * *
Morocco 1 1 1 1 1 2 3 2
Mozambique * * * 1 1 * * *
Namibia * * * * * 1 1 1
Nauru * * * * * * * *
Nepal * * * * * 1 1 1
Netherlands 247 260 251 270 303 318 350 398
Netherlands Antilles1 14 11 7 6 n.a. n.a. n.a. n.a.
New Caledonia * * * * * * * *
New Zealand 12 13 15 15 19 20 19 27
Nicaragua * 1 1 * * 1 1 *
Niger * * * * * * * *
Nigeria 4 4 4 4 4 3 3 3
Niue * * * * * * 0 0
Norway 136 181 213 254 297 309 306 340
Oman 25 28 21 26 28 29 22 23
Pakistan 2 2 2 2 1 2 2 4
Palau * * * * * * * *
Panama 13 14 15 15 16 17 19 22
Papua New Guinea * * * * * * * *
Paraguay * * * * * * * *
Peru 12 17 21 31 26 29 28 29
Philippines 21 30 37 39 37 42 46 43
Pitcairn Island * * * * * * * *
Poland 28 33 32 35 33 32 37 36
* Greater than zero but less than $500 million.n.a. Not available.
A-36

Table A7. Foreign holdings of U.S. securities, by country, as of selected survey dates (continued) Billions of dollars
June June June June June June June June
Countries and Regions 2010 2011 2012 2013 2014 2015 2016 2017 Portugal 5 6 5 6 7 6 9 8
Qatar 6 7 4 8 7 7 10 7
Reunion * * * * * * * *
Romania 6 8 6 6 7 2 4 3
Russia 170 154 165 139 115 73 91 103
Rwanda * * * * * * * *
Saint Helena * 0 * 0 0 0 0 0
Saint Kitts and Nevis 1 1 2 2 2 2 3 3
Saint Lucia * * * * * * * *
Saint Martin & Saint Barthelemy3 n.a. n.a. n.a. n.a. * * * *
Saint Pierre and Miquelon * * * * * 0 0 0
Saint Vincent and the Grenadines * * * * * * * *
Samoa * * * * * * * *
San Marino * * * * * * * *
Sao Tome and Principe 0 * 0 * * 0 0 0
Saudi Arabia 125 138 154 170 194 184 152 202
Senegal * * * * * * * *
Serbia and Montenegro4 2 2 2 2 2 2 2 2
Seychelles * * * * * * * *
Sierra Leone * * * * * * * *
Singapore 176 212 241 272 307 331 321 348
Sint Maarten1 n.a. n.a. n.a. n.a. * * * *
Slovakia * * * * * * * *
Slovenia 1 1 1 1 2 2 2 2
Solomon Islands * 0 0 * * * * *
Somalia * * * * * * * *
South Africa 17 14 17 18 24 21 20 22
South Sudan n.a. n.a. n.a. n.a. * * * *
Spain 26 28 38 34 37 48 59 60
Sri Lanka 1 1 1 1 1 * * 1
Sudan * * * * * * * *
Suriname * * * * * * * *
Swaziland * * * * * * * *
Sweden 81 108 112 135 157 169 165 180
Switzerland 397 488 566 581 634 708 742 824
Syria * * * * * * * *
Taiwan 228 232 369 372 397 454 519 565
Tajikistan * * * * * * * *
Tanzania 1 1 1 2 2 2 1 2
Thailand 38 58 57 54 46 37 55 79
Togo * * * * * * * *
Tokelau * * 0 * * * * *
* Greater than zero but less than $500 million.n.a. Not available.
A-37
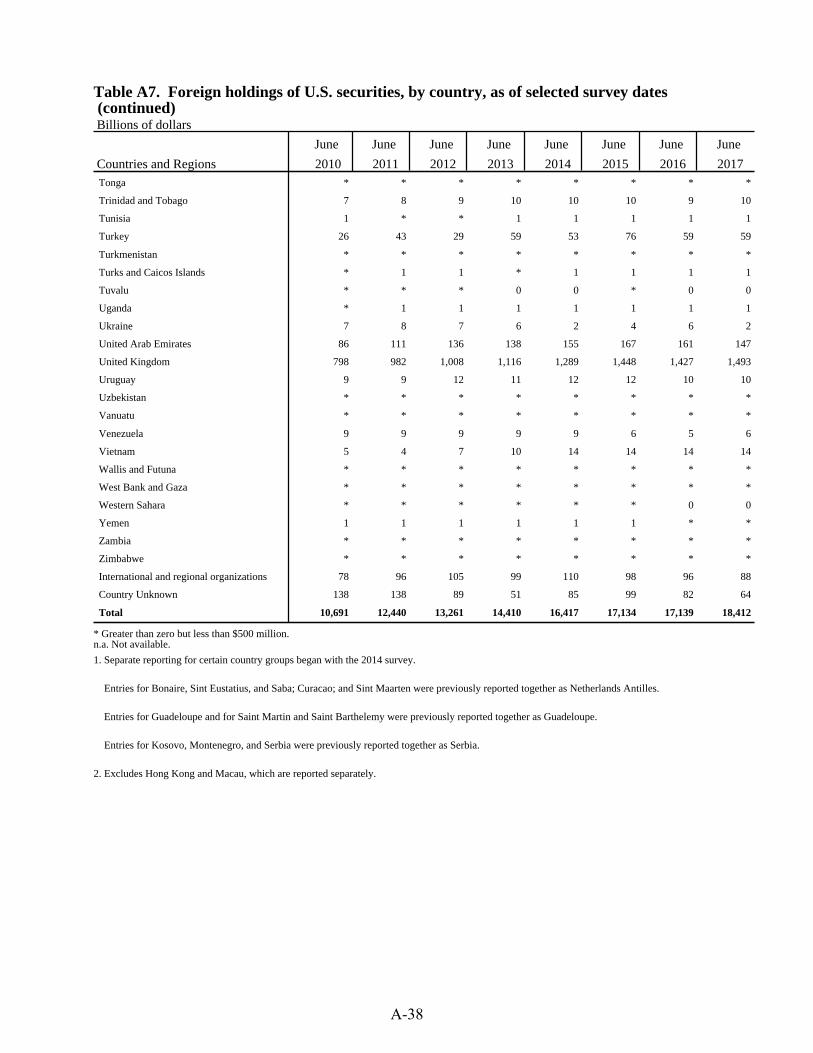
Table A7. Foreign holdings of U.S. securities, by country, as of selected survey dates (continued) Billions of dollars
June June June June June June June June
Countries and Regions 2010 2011 2012 2013 2014 2015 2016 2017 Tonga * * * * * * * *
Trinidad and Tobago 7 8 9 10 10 10 9 10
Tunisia 1 * * 1 1 1 1 1
Turkey 26 43 29 59 53 76 59 59
Turkmenistan * * * * * * * *
Turks and Caicos Islands * 1 1 * 1 1 1 1
Tuvalu * * * 0 0 * 0 0
Uganda * 1 1 1 1 1 1 1
Ukraine 7 8 7 6 2 4 6 2
United Arab Emirates 86 111 136 138 155 167 161 147
United Kingdom 798 982 1,008 1,116 1,289 1,448 1,427 1,493
Uruguay 9 9 12 11 12 12 10 10
Uzbekistan * * * * * * * *
Vanuatu * * * * * * * *
Venezuela 9 9 9 9 9 6 5 6
Vietnam 5 4 7 10 14 14 14 14
Wallis and Futuna * * * * * * * *
West Bank and Gaza * * * * * * * *
Western Sahara * * * * * * 0 0
Yemen 1 1 1 1 1 1 * *
Zambia * * * * * * * *
Zimbabwe * * * * * * * *
International and regional organizations 78 96 105 99 110 98 96 88
Country Unknown 138 138 89 51 85 99 82 64
Total 10,691 12,440 13,261 14,410 16,417 17,134 17,139 18,412
* Greater than zero but less than $500 million.n.a. Not available.
1. Separate reporting for certain country groups began with the 2014 survey.
Entries for Bonaire, Sint Eustatius, and Saba; Curacao; and Sint Maarten were previously reported together as Netherlands Antilles.
Entries for Guadeloupe and for Saint Martin and Saint Barthelemy were previously reported together as Guadeloupe.
Entries for Kosovo, Montenegro, and Serbia were previously reported together as Serbia.
2. Excludes Hong Kong and Macau, which are reported separately.
A-38

Table A8. Foreign holdings of U.S. equities, by country, as of selected survey dates
Billions of dollars
June June June June June June June June
Countries and Regions 2010 2011 2012 2013 2014 2015 2016 2017 Afghanistan * * * * * * * *
Albania * * * * * * * *
Algeria * * * * * * * *
Andorra 1 1 1 1 1 1 1 1
Angola 1 2 1 1 * * * 1
Anguilla 11 16 15 21 17 19 16 15
Antigua and Barbuda * * * * * * * *
Argentina 4 5 5 5 5 5 4 5
Armenia * * * * * * * *
Aruba * * * * * * * 1
Australia 74 106 112 149 170 176 171 193
Austria 5 7 7 7 9 8 9 11
Azerbaijan * * * * * 1 1 1
Bahamas 17 19 18 19 22 21 17 21
Bahrain * 1 1 1 1 1 1 1
Bangladesh * * * * * * * *
Barbados 1 1 1 1 1 2 2 1
Belarus * * * * * * * *
Belgium 19 25 22 29 34 34 31 38
Belize * * * * 1 1 * *
Benin * * * * * * * *
Bermuda 44 59 68 74 93 89 86 95
Bhutan * * * * * * * *
Bolivia 1 * * * * * * *
Bonaire, Sint Eustatius & Saba1 n.a. n.a. n.a. n.a. * * * *
Bosnia and Herzegovina * * * * * * * *
Botswana 1 1 1 1 1 1 * 1
Brazil 2 2 4 4 7 8 5 5
British Indian Ocean Territory * * * * * * * *
British Virgin Islands 42 61 84 101 128 119 105 112
Brunei 1 2 2 2 4 2 2 4
Bulgaria * * * * * * * *
Burkina Faso * * * * * * * *
Burma * * * * * * * *
Burundi * * * * * * * *
Cambodia * * * * * * * *
Cameroon * * * * * * * *
Canada 298 415 471 617 769 761 695 810
Cape Verde * * * * * * * *
Cayman Islands 290 393 516 628 838 884 796 928
Central African Republic * * * * * * * *
Chad * * * * * * * *
* Greater than zero but less than $500 million.n.a. Not available.
A-39
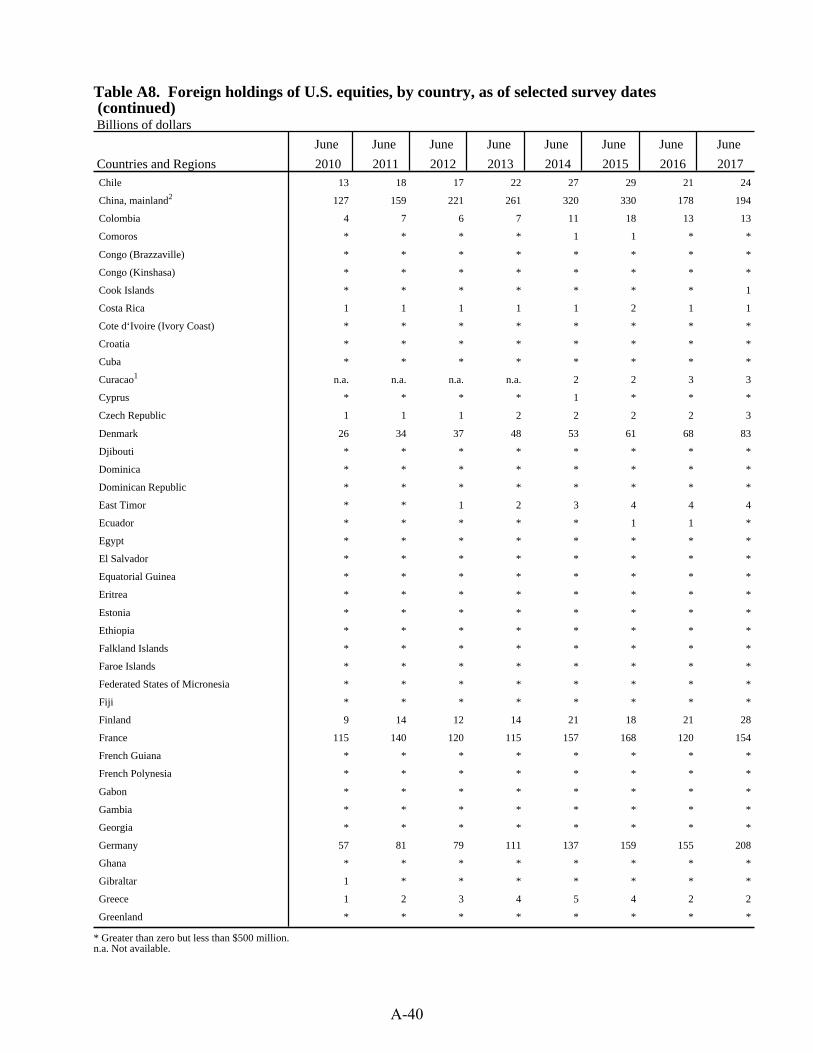
Table A8. Foreign holdings of U.S. equities, by country, as of selected survey dates (continued) Billions of dollars
June June June June June June June June
Countries and Regions 2010 2011 2012 2013 2014 2015 2016 2017 Chile 13 18 17 22 27 29 21 24
China, mainland2 127 159 221 261 320 330 178 194
Colombia 4 7 6 7 11 18 13 13
Comoros * * * * 1 1 * *
Congo (Brazzaville) * * * * * * * *
Congo (Kinshasa) * * * * * * * *
Cook Islands * * * * * * * 1
Costa Rica 1 1 1 1 1 2 1 1
Cote d‘Ivoire (Ivory Coast) * * * * * * * *
Croatia * * * * * * * *
Cuba * * * * * * * *
Curacao1 n.a. n.a. n.a. n.a. 2 2 3 3
Cyprus * * * * 1 * * *
Czech Republic 1 1 1 2 2 2 2 3
Denmark 26 34 37 48 53 61 68 83
Djibouti * * * * * * * *
Dominica * * * * * * * *
Dominican Republic * * * * * * * *
East Timor * * 1 2 3 4 4 4
Ecuador * * * * * 1 1 *
Egypt * * * * * * * *
El Salvador * * * * * * * *
Equatorial Guinea * * * * * * * *
Eritrea * * * * * * * *
Estonia * * * * * * * *
Ethiopia * * * * * * * *
Falkland Islands * * * * * * * *
Faroe Islands * * * * * * * *
Federated States of Micronesia * * * * * * * *
Fiji * * * * * * * *
Finland 9 14 12 14 21 18 21 28
France 115 140 120 115 157 168 120 154
French Guiana * * * * * * * *
French Polynesia * * * * * * * *
Gabon * * * * * * * *
Gambia * * * * * * * *
Georgia * * * * * * * *
Germany 57 81 79 111 137 159 155 208
Ghana * * * * * * * *
Gibraltar 1 * * * * * * *
Greece 1 2 3 4 5 4 2 2
Greenland * * * * * * * *
* Greater than zero but less than $500 million.n.a. Not available.
A-40

Table A8. Foreign holdings of U.S. equities, by country, as of selected survey dates (continued) Billions of dollars
June June June June June June June June
Countries and Regions 2010 2011 2012 2013 2014 2015 2016 2017 Grenada * * * * * * * *
Guadeloupe3 * * * * * * * *
Guatemala * * * * * * * *
Guernsey 10 12 21 21 24 26 27 32
Guinea * * * * * * * *
Guinea-Bissau * * * * * 0 0 0
Guyana * * * * * * * *
Haiti * * * * * * * *
Holy See (Vatican) * * * * * * * *
Honduras * * * * * * * *
Hong Kong 33 43 47 56 74 77 75 96
Hungary 1 1 * 1 1 1 1 1
Iceland * * * 1 1 1 1 1
India 1 1 1 1 2 2 2 3
Indonesia * * * * * * * *
Iran * * * * * * * *
Iraq * * * * * * * *
Ireland 77 105 108 141 204 235 238 296
Isle of Man 1 1 1 1 1 1 1 1
Israel 13 20 23 30 35 41 37 49
Italy 13 15 15 21 27 26 24 27
Jamaica * * * * * * * *
Japan 224 302 314 316 361 391 428 490
Jersey 8 14 11 14 17 18 17 16
Jordan * * * * * * * *
Kazakhstan 1 2 3 5 6 7 5 6
Kenya * * * * * * * *
Kiribati * * * * * * * *
Korea, South 13 20 24 36 59 62 75 102
Kosovo4 n.a. n.a. n.a. n.a. * * * *
Kuwait 45 65 83 112 136 136 131 160
Kyrgyzstan * * * * * * * *
Laos * * * * * * * *
Latvia * * * * * * * *
Lebanon * 1 1 1 1 * * *
Lesotho * * * * * * 0 0
Liberia 1 1 1 1 1 1 1 1
Libya * * * * * * * *
Liechtenstein 2 3 2 3 4 3 3 3
Lithuania * * * * * * * *
Luxembourg 172 291 292 378 502 518 516 532
Macau * * * * 1 1 1 1
* Greater than zero but less than $500 million.n.a. Not available.
A-41

Table A8. Foreign holdings of U.S. equities, by country, as of selected survey dates (continued) Billions of dollars
June June June June June June June June
Countries and Regions 2010 2011 2012 2013 2014 2015 2016 2017 Macedonia * * * * * * * *
Madagascar * * * * * * * *
Malawi * * * * * * * *
Malaysia 2 4 7 8 12 11 10 13
Maldives * * * * * * * *
Mali * * * * * * * *
Malta * * * 1 1 1 1 1
Marshall Islands * * * * 1 1 1 1
Martinique * * * * * * * *
Mauritania * * * * * * * *
Mauritius * 1 2 2 3 6 1 4
Mayotte * * * * * * 0 0
Mexico 17 25 23 32 42 41 36 47
Moldova * * * * * * * *
Monaco 1 1 2 2 2 2 2 1
Mongolia * * * * * * * *
Montenegro4 n.a. n.a. n.a. n.a. * * * *
Montserrat * * * * * * * *
Morocco * * * * * * * *
Mozambique * * * * * * * *
Namibia * * * * * * 1 1
Nauru * * * * * * * *
Nepal * * * * * * * *
Netherlands 152 165 151 164 195 202 210 254
Netherlands Antilles1 7 6 2 2 n.a. n.a. n.a. n.a.
New Caledonia * * * * * * * *
New Zealand 6 8 7 8 12 13 12 19
Nicaragua * * * * * * * *
Niger * * * * * * * *
Nigeria * * * * * * * *
Niue * * * * * * 0 0
Norway 90 124 124 154 176 199 201 239
Oman 2 4 4 4 7 7 6 7
Pakistan * * * * * * * *
Palau * * * * * * * *
Panama 6 8 8 10 11 11 11 12
Papua New Guinea * * * * * * * *
Paraguay * * * * * * * *
Peru 2 3 4 6 10 11 9 11
Philippines 1 1 1 1 2 2 2 3
Pitcairn Island * * * * * * * *
Poland * * 1 2 3 3 3 2
* Greater than zero but less than $500 million.n.a. Not available.
A-42

Table A8. Foreign holdings of U.S. equities, by country, as of selected survey dates (continued) Billions of dollars
June June June June June June June June
Countries and Regions 2010 2011 2012 2013 2014 2015 2016 2017 Portugal 2 3 2 3 3 3 3 3
Qatar * 1 1 2 1 1 5 3
Reunion * * * * * * * *
Romania * * * * * * * *
Russia * * * * * * * *
Rwanda * * * * * * * *
Saint Helena * 0 * 0 0 0 0 0
Saint Kitts and Nevis * 1 1 1 1 1 1 2
Saint Lucia * * * * * * * *
Saint Martin & Saint Barthelemy3 n.a. n.a. n.a. n.a. * * * *
Saint Pierre and Miquelon * * * * * 0 0 0
Saint Vincent and the Grenadines * * * * * * * *
Samoa * * * * * * * *
San Marino * * * * * * * *
Sao Tome and Principe 0 * 0 * * 0 0 0
Saudi Arabia 36 53 65 68 78 52 35 46
Senegal * * * * * * * *
Serbia and Montenegro4 * * * * * * * *
Seychelles * * * * * * * *
Sierra Leone * * * * * * * *
Singapore 91 107 106 129 142 145 136 167
Sint Maarten1 n.a. n.a. n.a. n.a. * * * *
Slovakia * * * * * * * *
Slovenia 1 1 1 1 1 1 1 1
Solomon Islands * 0 0 * * * * *
Somalia * * * * * * * *
South Africa 2 3 3 4 8 10 9 10
South Sudan n.a. n.a. n.a. n.a. * * * *
Spain 6 10 7 8 10 12 13 18
Sri Lanka * * * * * * * *
Sudan * * * * * * * *
Suriname * * * * * * * *
Swaziland * * * * * * * *
Sweden 49 65 70 90 113 119 117 130
Switzerland 162 226 263 266 331 344 351 413
Syria * * * * * * * *
Taiwan 12 16 18 23 31 36 43 56
Tajikistan * * * * * * * *
Tanzania * * * * * * * *
Thailand 1 2 3 3 3 2 2 3
Togo * * * * * * * *
Tokelau * * 0 * * * * *
* Greater than zero but less than $500 million.n.a. Not available.
A-43

Table A8. Foreign holdings of U.S. equities, by country, as of selected survey dates (continued) Billions of dollars
June June June June June June June June
Countries and Regions 2010 2011 2012 2013 2014 2015 2016 2017 Tonga * * * * * * * *
Trinidad and Tobago 1 1 1 2 2 2 2 3
Tunisia * * * 1 1 1 1 1
Turkey * * * * * * 1 1
Turkmenistan * * * * * * * *
Turks and Caicos Islands * * * * * * * *
Tuvalu * * * 0 0 * 0 0
Uganda * * * * * * * *
Ukraine * * * * * * * *
United Arab Emirates 44 65 72 89 94 89 87 80
United Kingdom 324 441 495 584 741 832 741 844
Uruguay 2 2 2 2 2 2 2 2
Uzbekistan * * * * * * * *
Vanuatu * * * * * * * *
Venezuela 2 2 2 2 3 4 3 3
Vietnam * * * * * * * *
Wallis and Futuna * * * * * * * *
West Bank and Gaza * * * * * * * *
Western Sahara * * * * * * 0 0
Yemen * * * * * * * *
Zambia * * * * * * * *
Zimbabwe * * * * * * * *
International and regional organizations 5 3 4 4 5 5 4 5
Country Unknown 1 2 * * 3 1 * 1
Total 2,814 3,830 4,237 5,070 6,356 6,655 6,186 7,189
* Greater than zero but less than $500 million.n.a. Not available.
1. Separate reporting for certain country groups began with the 2014 survey.
Entries for Bonaire, Sint Eustatius, and Saba; Curacao; and Sint Maarten were previously reported together as Netherlands Antilles.
Entries for Guadeloupe and for Saint Martin and Saint Barthelemy were previously reported together as Guadeloupe.
Entries for Kosovo, Montenegro, and Serbia were previously reported together as Serbia.
2. Excludes Hong Kong and Macau, which are reported separately.
A-44

Table A9. Foreign holdings of U.S. long-term debt securities, by country, as of selected survey dates
Billions of dollars
June June June June June June June June
Countries and Regions 2010 2011 2012 2013 2014 2015 2016 2017 Afghanistan 1 1 1 1 1 1 1 1
Albania * * * 1 1 * * *
Algeria * * * * * * * *
Andorra 1 1 1 1 1 1 1 1
Angola * * * * * 1 * *
Anguilla * * 1 2 * * * *
Antigua and Barbuda * * * * * * * *
Argentina 4 4 3 3 3 2 2 2
Armenia * * * * * * * 1
Aruba 1 1 * 1 1 1 1 1
Australia 38 48 43 49 55 56 58 69
Austria 4 5 5 6 7 9 10 9
Azerbaijan 3 5 5 4 7 7 6 5
Bahamas 10 11 9 9 8 12 21 25
Bahrain 5 4 2 2 1 1 1 1
Bangladesh * * * * * * * *
Barbados 6 7 9 9 8 13 21 22
Belarus * * * * * * * *
Belgium 383 412 414 448 666 555 497 638
Belize * * * * * * * *
Benin 0 0 * * * 0 * *
Bermuda 176 185 210 225 184 175 193 199
Bhutan * * 0 0 0 0 0 *
Bolivia * * * * 1 1 * 1
Bonaire, Sint Eustatius & Saba1 n.a. n.a. n.a. n.a. * * * *
Bosnia and Herzegovina * * * * * * * *
Botswana 2 2 2 1 2 2 2 1
Brazil 135 214 239 237 229 239 240 253
British Indian Ocean Territory * * * * * * 0 *
British Virgin Islands 27 29 34 27 31 38 41 43
Brunei 1 1 1 1 1 1 1 1
Bulgaria * * * * * * * *
Burkina Faso * * * * 0 * 0 0
Burma 0 * 0 * * * * *
Burundi * * * * * 0 0 0
Cambodia * * * * * 2 2 2
Cameroon * * * * 0 0 0 0
Canada 114 131 148 174 195 207 235 238
Cape Verde 0 0 0 0 0 0 * *
Cayman Islands 371 416 432 444 486 525 626 657
Central African Republic * * 0 0 * 0 0 0
Chad 0 0 0 0 * 0 0 0
* Greater than zero but less than $500 million.n.a. Not available.
A-45

Table A9. Foreign holdings of U.S. long-term debt securities, by country, as of selected survey dates (continued) Billions of dollars
June June June June June June June June
Countries and Regions 2010 2011 2012 2013 2014 2015 2016 2017 Chile 11 17 20 22 23 25 30 24
China, mainland2 1,479 1,563 1,363 1,469 1,489 1,510 1,450 1,344
Colombia 8 11 30 34 34 39 34 32
Congo (Brazzaville) * * * 0 * * * 0
Congo (Kinshasa) * * * * * * * *
Cook Islands * * * * * * * *
Costa Rica 1 1 2 2 2 2 2 2
Cote d‘Ivoire (Ivory Coast) * * 0 0 0 0 0 0
Croatia * * * * * 1 1 1
Curacao1 n.a. n.a. n.a. n.a. 2 2 2 2
Cyprus * * * * * * * *
Czech Republic 5 6 6 6 6 6 9 21
Denmark 20 26 36 35 45 43 47 40
Djibouti * * 0 0 0 0 0 0
Dominica * * * * * * * *
Dominican Republic 1 1 1 1 1 1 2 1
East Timor 6 7 8 10 10 8 8 8
Ecuador 1 1 1 * * * * *
Egypt 2 3 3 1 4 4 1 2
El Salvador * 1 1 1 1 1 1 1
Equatorial Guinea 0 * 0 0 0 * 0 0
Eritrea * 0 0 0 0 0 0 0
Estonia * * * * * * * *
Ethiopia * * * * * * * *
Falkland Islands 0 0 * * * * * *
Faroe Islands 0 0 0 0 * 0 0 *
Federated States of Micronesia * * * * * * * *
Fiji * * * * 0 * * *
Finland 4 5 7 8 8 13 15 17
France 69 94 93 89 100 98 97 122
French Guiana * * * * * * * *
French Polynesia * * * * * * * *
Gabon * * * * * * * *
Gambia * 0 * 0 0 0 0 0
Georgia * 1 1 1 1 1 1 *
Germany 130 150 142 148 177 180 196 215
Ghana * * 1 1 1 1 1 1
Gibraltar * * * * * * * *
Greece 1 3 5 3 3 2 2 2
Greenland * 0 0 0 0 0 0 0
Grenada * * * * * * * *
Guadeloupe3 * * * * * * 0 0
* Greater than zero but less than $500 million.n.a. Not available.
A-46

Table A9. Foreign holdings of U.S. long-term debt securities, by country, as of selected survey dates (continued) Billions of dollars
June June June June June June June June
Countries and Regions 2010 2011 2012 2013 2014 2015 2016 2017 Guatemala 4 4 4 4 3 2 3 4
Guernsey 11 7 8 7 12 11 10 10
Guinea * * * 0 0 * * *
Guyana * * * * * * * *
Haiti 1 1 1 1 1 1 1 1
Holy See (Vatican) * * * * * * * *
Honduras 1 1 1 1 1 1 1 1
Hong Kong 172 182 136 124 138 162 182 191
Hungary 1 1 1 2 1 1 2 1
Iceland * * 1 1 1 1 2 2
India 24 27 42 57 69 101 110 115
Indonesia 9 19 31 22 23 23 23 31
Iran * * 0 0 0 0 0 0
Iraq * * * 2 7 12 7 6
Ireland 180 186 241 321 396 476 578 640
Isle of Man 3 1 1 1 1 1 1 1
Israel 13 18 20 22 27 23 36 37
Italy 27 25 36 40 42 41 53 49
Jamaica * * * * 1 1 * 1
Japan 1,100 1,216 1,458 1,387 1,494 1,437 1,470 1,450
Jersey 20 19 13 9 8 8 7 6
Jordan 1 1 1 1 1 * * *
Kazakhstan 13 9 8 10 15 12 17 8
Kenya * * * 1 1 1 1 1
Kiribati * * * * * * 0 0
Korea, South 103 109 119 108 108 133 151 170
Kosovo4 n.a. n.a. n.a. n.a. 0 0 * *
Kuwait 23 25 31 36 42 43 46 49
Kyrgyzstan * 0 0 0 0 0 0 0
Laos 0 0 * 0 0 0 0 0
Latvia 1 1 * * 1 1 1 2
Lebanon * * * * * * * *
Lesotho * * * * * * * *
Liberia * * 1 1 * * 1 *
Libya 2 4 4 5 1 0 0 *
Liechtenstein * * * * * * * 1
Lithuania * * * * * * * *
Luxembourg 369 457 474 532 617 681 738 771
Macau 1 1 1 1 1 2 2 2
Macedonia * * * * * * * *
Madagascar * * * * * * * *
Malawi * * * * * * * *
* Greater than zero but less than $500 million.n.a. Not available.
A-47

Table A9. Foreign holdings of U.S. long-term debt securities, by country, as of selected survey dates (continued) Billions of dollars
June June June June June June June June
Countries and Regions 2010 2011 2012 2013 2014 2015 2016 2017 Malaysia 28 37 39 34 24 22 25 28
Mali 0 0 0 0 * 0 0 0
Malta 1 1 1 1 2 1 1 1
Marshall Islands * * * * * * * *
Martinique * * * * * * * *
Mauritania 0 0 0 0 * * * *
Mauritius * * * * * 1 2 3
Mayotte 0 0 * * * * 0 0
Mexico 62 68 88 87 77 100 64 44
Moldova * * * * 1 * * 1
Monaco * * * * * * * *
Mongolia * * * * * * * *
Montenegro4 n.a. n.a. n.a. n.a. 0 0 0 *
Montserrat * * * 0 0 0 * *
Morocco 1 1 1 1 1 2 2 2
Mozambique * * * * * * * *
Namibia * * * * * * * *
Nauru 0 0 * 0 * 0 0 0
Nepal * * * * * 1 1 1
Netherlands 90 89 97 100 99 107 130 129
Netherlands Antilles1 5 6 4 3 n.a. n.a. n.a. n.a.
New Caledonia * * * * * * * *
New Zealand 4 4 6 6 7 7 7 7
Nicaragua * * * * * * * *
Niger 0 0 0 0 0 * 0 0
Nigeria 4 4 4 4 4 3 3 2
Niue * * * 0 0 0 0 0
Norway 46 57 88 99 119 109 104 101
Oman 8 9 15 19 17 15 16 16
Pakistan 1 1 1 1 1 1 1 1
Palau * * * * * * * *
Panama 6 6 6 5 5 6 7 9
Papua New Guinea * * * * * * * *
Paraguay * * * * * * * *
Peru 9 12 16 24 17 17 18 18
Philippines 19 27 35 37 34 40 42 39
Poland 22 27 28 32 30 29 35 34
Portugal 2 2 3 3 4 3 6 5
Qatar * * * * * 1 * 2
Reunion * 0 0 * 0 0 0 0
Romania 3 8 6 6 7 2 4 3
Russia 122 138 159 139 115 72 91 97
* Greater than zero but less than $500 million.n.a. Not available.
A-48

Table A9. Foreign holdings of U.S. long-term debt securities, by country, as of selected survey dates (continued) Billions of dollars
June June June June June June June June
Countries and Regions 2010 2011 2012 2013 2014 2015 2016 2017 Rwanda * * * * * * * *
Saint Kitts and Nevis * * 1 1 1 1 1 1
Saint Lucia * * * * * * * *
Saint Martin & Saint Barthelemy3 n.a. n.a. n.a. n.a. * * * *
Saint Pierre and Miquelon * * * 0 0 0 0 0
Saint Vincent and the Grenadines * * * * * * * *
Samoa * * * * * * * *
San Marino * * * * 0 0 0 0
Saudi Arabia 84 80 85 95 108 126 112 114
Senegal * * * * 0 0 * *
Serbia and Montenegro4 2 2 1 1 1 1 1 2
Seychelles * * * * * * * *
Sierra Leone * * * * * 0 0 0
Singapore 78 98 127 138 155 174 171 164
Sint Maarten1 n.a. n.a. n.a. n.a. * * * *
Slovakia * * * * * * * *
Slovenia * * * * * 1 1 1
Solomon Islands 0 0 0 0 * * * *
Somalia * * * * 0 0 0 0
South Africa 15 11 14 14 15 11 11 12
Spain 16 15 25 23 26 35 44 41
Sri Lanka 1 1 1 1 1 * * 1
Sudan 0 * 0 0 0 0 0 0
Suriname * * * * * * * *
Swaziland * * * * * * * *
Sweden 27 41 41 36 40 44 46 50
Switzerland 210 246 277 284 279 338 359 378
Syria * * * * * * * *
Taiwan 213 213 349 346 364 416 473 505
Tajikistan * * 0 0 0 0 0 0
Tanzania 1 1 1 2 2 2 1 2
Thailand 12 18 20 12 15 16 25 64
Togo * * * * * * * *
Tonga 0 0 0 0 0 * * *
Trinidad and Tobago 5 7 6 6 7 7 7 7
Tunisia * * * * * * * *
Turkey 9 12 12 18 25 19 25 23
Turks and Caicos Islands * * * * * * * *
Uganda * * * * 1 * 1 1
Ukraine 7 8 7 6 2 4 6 2
United Arab Emirates 27 32 40 34 50 65 63 58
United Kingdom 452 524 491 502 511 574 646 608
* Greater than zero but less than $500 million.n.a. Not available.
A-49

Table A9. Foreign holdings of U.S. long-term debt securities, by country, as of selected survey dates (continued) Billions of dollars
June June June June June June June June
Countries and Regions 2010 2011 2012 2013 2014 2015 2016 2017 Uruguay 5 6 10 9 8 8 6 6
Uzbekistan * * * * * * * *
Vanuatu * * * 0 0 0 0 *
Venezuela 7 6 6 6 5 2 2 2
Vietnam 5 4 7 10 14 14 14 14
West Bank and Gaza 0 0 0 * * 0 0 0
Western Sahara 0 0 0 0 * * 0 0
Yemen 1 1 1 1 1 1 * *
Zambia * * * * * * * *
Zimbabwe * * * * * * * *
International and regional organizations 68 86 92 86 97 84 78 68
Country Unknown 135 136 88 51 81 98 82 64
Total 6,921 7,731 8,213 8,462 9,183 9,547 10,044 10,292
* Greater than zero but less than $500 million.n.a. Not available.
1. Separate reporting for certain country groups began with the 2014 survey.
Entries for Bonaire, Sint Eustatius, and Saba; Curacao; and Sint Maarten were previously reported together as Netherlands Antilles.
Entries for Guadeloupe and for Saint Martin and Saint Barthelemy were previously reported together as Guadeloupe.
Entries for Kosovo, Montenegro, and Serbia were previously reported together as Serbia.
2. Excludes Hong Kong and Macau, which are reported separately.
A-50

Table A10. Foreign holdings of U.S. short-term debt securities, by country, as of selected survey dates
Billions of dollars
June June June June June June June June
Countries and Regions 2010 2011 2012 2013 2014 2015 2016 2017 Afghanistan * 0 0 * 0 0 * 0
Albania * 0 * 0 0 * 0 0
Algeria 1 1 1 1 1 1 1 1
Andorra * * * * * * * *
Angola 0 0 0 0 0 * * 0
Anguilla * * 1 1 * * 2 1
Antigua and Barbuda * * * * * * * *
Argentina 1 1 * * * * * *
Armenia * 0 0 0 * 0 0 0
Aruba * * * * * * * *
Australia 6 7 7 16 14 10 9 8
Austria * 1 * * * 1 * *
Azerbaijan * * 1 1 * 1 1 1
Bahamas 2 4 2 2 3 3 4 5
Bahrain 1 1 * * * * * *
Bangladesh 2 2 1 1 1 1 * 1
Barbados 12 4 3 3 4 1 1 1
Belarus 0 0 0 0 0 0 * 0
Belgium 6 6 11 13 13 13 61 15
Belize * * * * * * * *
Bermuda 28 28 22 25 25 22 27 24
Bhutan 0 * 0 0 0 0 0 0
Bolivia 1 1 * 1 2 2 1 1
Bonaire, Sint Eustatius & Saba1 n.a. n.a. n.a. n.a. * * * *
Botswana * * * * * * * *
Brazil 33 5 9 20 26 21 13 18
British Virgin Islands 16 17 12 11 17 16 14 11
Brunei 0 * * * * * * *
Bulgaria * 0 0 * 0 0 0 0
Burkina Faso 0 0 0 0 0 0 0 *
Cambodia * * * * 0 0 * *
Canada 12 13 15 24 24 24 20 13
Cape Verde 0 0 0 0 * * * *
Cayman Islands 82 80 83 96 84 97 103 102
Central African Republic * 0 0 0 0 0 0 0
Chile 4 8 11 11 10 10 8 9
China, mainland2 5 5 9 5 9 3 2 3
Colombia 13 14 1 1 2 1 1 *
Congo (Brazzaville) * 0 0 0 0 0 0 0
Cook Islands * 0 * * * 0 * *
Costa Rica 1 * * 1 1 * * *
Cote d‘Ivoire (Ivory Coast) 0 * 0 0 0 0 0 0
* Greater than zero but less than $500 million.n.a. Not available.
A-51

Table A10. Foreign holdings of U.S. short-term debt securities, by country, as of selected survey dates (continued) Billions of dollars
June June June June June June June June
Countries and Regions 2010 2011 2012 2013 2014 2015 2016 2017 Croatia 1 1 1 1 1 * * *
Curacao1 n.a. n.a. n.a. n.a. * * 1 1
Cyprus * * * * * * * *
Czech Republic 1 * 0 * 0 * * *
Denmark 4 4 4 5 1 1 1 1
Dominica * * * * * * * *
Dominican Republic * * * * * * * *
East Timor * * * * 0 * 0 *
Ecuador * * * * * * * *
Egypt 25 9 1 * 1 1 1 6
El Salvador 1 1 * * * * * *
Estonia * * * * * * * *
Ethiopia * * 0 0 0 0 * 0
Federated States of Micronesia * * * * * * 0 *
Fiji 0 0 0 * * * * *
Finland * * * 1 1 * * *
France 10 14 13 11 12 8 13 16
French Polynesia * * * * * * * *
Gabon 0 0 0 * 0 0 0 0
Gambia * * * * 0 0 0 0
Georgia * * * 0 * * 0 0
Germany 8 7 6 5 5 5 22 5
Ghana * * * * * * 0 *
Gibraltar * * * * * 0 * 1
Greece * * 2 2 2 3 3 1
Grenada 0 0 * 0 0 * * *
Guatemala * * * * * * * *
Guernsey 1 2 1 1 2 3 2 1
Guyana * 0 0 * * 0 0 *
Haiti * * * * * * * *
Honduras * * * * * * * *
Hong Kong 88 66 40 35 50 59 48 64
Hungary * * 1 1 * * * *
Iceland * * * * * * * *
India 16 17 12 4 4 16 7 16
Indonesia 23 28 5 4 4 2 1 3
Iraq 22 32 49 43 19 18 8 10
Ireland 99 114 104 114 129 120 115 132
Isle of Man * * * * * * * 1
Israel 11 9 10 9 5 4 2 1
Italy 2 2 1 2 * 1 1 2
Jamaica * * * * * 0 * *
* Greater than zero but less than $500 million.n.a. Not available.
A-52

Table A10. Foreign holdings of U.S. short-term debt securities, by country, as of selected survey dates (continued) Billions of dollars
June June June June June June June June
Countries and Regions 2010 2011 2012 2013 2014 2015 2016 2017 Japan 69 67 63 63 62 75 62 58
Jersey 1 1 4 2 2 2 5 3
Jordan 1 1 * * 0 * * 0
Kazakhstan 8 13 21 16 21 20 6 15
Kenya * * * 0 0 0 0 0
Korea, South 6 5 5 12 13 13 10 10
Kosovo4 n.a. n.a. n.a. n.a. 0 0 * 0
Kuwait 12 8 7 8 9 13 11 21
Latvia * * * * * * * *
Lebanon * * 3 * 0 0 0 0
Lesotho * * 0 0 0 0 0 *
Liberia 1 1 * * * * * *
Libya * 0 0 0 0 0 0 0
Liechtenstein * * * * 0 * 0 *
Lithuania 0 0 0 0 0 * * *
Luxembourg 82 69 72 80 80 98 94 95
Macau * * * * * * * *
Macedonia * 0 * 0 0 0 0 0
Malawi * 0 0 0 0 0 0 0
Malaysia 1 1 * * * * * *
Malta * * * * * * * *
Marshall Islands * * * * * * * *
Martinique * 0 0 0 0 0 0 0
Mauritius * 0 * * * * * 1
Mexico 5 3 11 11 25 15 18 6
Moldova * 0 0 0 0 0 0 0
Monaco * * * * * * * *
Mongolia * * 0 * 0 0 0 0
Morocco * * * * * 0 * 0
Mozambique 0 * * * * * 0 0
Namibia * 0 0 0 0 0 0 0
Nepal * * * * * * * *
Netherlands 5 5 3 6 9 9 10 15
Netherlands Antilles1 2 * 1 * n.a. n.a. n.a. n.a.
New Caledonia * * * * * * 0 0
New Zealand 3 1 2 1 * 1 1 *
Nicaragua * * * * * * * *
Niger 0 0 0 * 0 0 0 0
Nigeria * * * * * * * *
Norway 1 1 * 2 2 1 1 1
Oman 14 15 3 2 4 8 * 0
Pakistan 1 1 1 1 * * 1 2
* Greater than zero but less than $500 million.n.a. Not available.
A-53

Table A10. Foreign holdings of U.S. short-term debt securities, by country, as of selected survey dates (continued) Billions of dollars
June June June June June June June June
Countries and Regions 2010 2011 2012 2013 2014 2015 2016 2017 Palau * 0 0 0 0 0 0 *
Panama 1 1 * * * * 1 1
Papua New Guinea 0 * 0 0 0 0 0 0
Paraguay * * * * * * * *
Peru 1 3 1 * * 1 1 1
Philippines 1 1 1 1 1 1 1 1
Poland 6 6 3 1 0 * * *
Portugal * * * * * * * *
Qatar 5 6 3 6 5 5 5 3
Romania 3 * * 0 0 0 0 0
Russia 48 16 5 * * * * 6
Rwanda * 0 0 0 0 0 0 0
Saint Kitts and Nevis * * * * * * * *
Saint Lucia * * * * * * 0 0
Saint Martin & Saint Barthelemy3 n.a. n.a. n.a. n.a. 0 0 * *
Saint Pierre and Miquelon * 0 0 0 0 0 0 0
Saint Vincent and the Grenadines * 0 0 0 0 0 * 0
Samoa 0 0 * * 0 * * *
San Marino 0 0 * 0 0 0 0 0
Saudi Arabia 4 5 5 7 8 5 5 42
Serbia and Montenegro4 * * * * 1 1 * *
Seychelles * 0 0 0 0 0 * 0
Singapore 8 7 9 5 10 12 14 16
Sint Maarten1 n.a. n.a. n.a. n.a. * 0 * *
Slovakia * * * * * * * *
Slovenia * * * * * * * *
South Africa * * * * * * * *
Spain 3 3 6 3 2 1 1 1
Sri Lanka * * 0 0 0 0 0 0
Suriname * * * * * * * *
Swaziland * 0 0 0 * 0 0 0
Sweden 5 2 1 8 5 6 2 *
Switzerland 25 16 26 32 24 27 32 34
Syria * * * * 0 0 0 0
Taiwan 3 3 2 3 1 2 3 4
Tanzania * 0 0 0 0 0 0 0
Thailand 24 38 34 39 28 19 28 12
Tonga 0 0 0 0 0 0 0 *
Trinidad and Tobago 1 1 2 2 1 1 * *
Tunisia 1 * 0 * 0 0 0 0
Turkey 17 31 17 41 28 57 34 36
Turks and Caicos Islands * * * * * * * *
* Greater than zero but less than $500 million.n.a. Not available.
A-54

Table A10. Foreign holdings of U.S. short-term debt securities, by country, as of selected survey dates (continued) Billions of dollars
June June June June June June June June
Countries and Regions 2010 2011 2012 2013 2014 2015 2016 2017 Uganda * * * * * * * 1
Ukraine * * * * 0 0 * *
United Arab Emirates 14 14 24 15 11 13 11 9
United Kingdom 22 16 22 30 37 42 40 41
Uruguay 2 1 * 1 1 1 1 1
Vanuatu 0 * 0 0 0 * * *
Venezuela 1 * * * * * * *
Vietnam * * * * * * * *
Yemen * * * 0 0 0 0 0
Zambia * * * 0 0 * 0 0
Zimbabwe * 0 0 0 0 0 0 0
International and regional organizations 6 7 9 9 8 9 14 15
Country Unknown 2 1 * * * 0 0 0
Total 956 878 811 878 878 932 909 930
* Greater than zero but less than $500 million.n.a. Not available.
1. Separate reporting for certain country groups began with the 2014 survey.
Entries for Bonaire, Sint Eustatius, and Saba; Curacao; and Sint Maarten were previously reported together as Netherlands Antilles.
Entries for Guadeloupe and for Saint Martin and Saint Barthelemy were previously reported together as Guadeloupe.
Entries for Kosovo, Montenegro, and Serbia were previously reported together as Serbia.
2. Excludes Hong Kong and Macau, which are reported separately.
A-55

Table A11: Foreign Holdings of U.S. Securities, by industry, as ofJune 30, 2017
Billions of dollars
Industry NAICS code1 Total EquityDebt
Long-term
Short-term
Mining, quarrying, and oil and gas extraction 21 268 163 105 *Oil and gas extraction 2111 169 101 67 *Metal ore mining 2122 29 16 13 0Oil and gas well drilling and support 213111-213112 51 31 20 *Support activities for metal mining 213114 2 1 1 0Other 18 14 4 *
Utilities and construction 22-23 323 169 150 4Electric power generation and distribution 2211 220 111 106 3Natural gas distribution 2212 56 34 22 *Water, sewage, and other systems 2213 8 6 2 *Construction 23 39 18 20 0
Consumer goods manufacturing 31 492 312 176 5Food manufacturing 311 135 81 52 2Beverage manufacturing 3121 177 95 81 2Tobacco product manufacturing 3122 124 87 37 *Other 55 49 6 *
Chemical manufacturing 325 759 561 190 8Pharmaceutical and medicine manufacturing 3254 532 397 133 2Other 227 164 57 7
Other primary and machinery manufacturing 326-333 292 189 101 1Primary metal manufacturing 331 29 18 11 0Machinery manufacturing 333 193 127 66 *Other 69 44 24 1
Computer and electronic product manufacturing 334-335 754 565 186 3Computer and peripheral equipment manufacturing 3341 327 234 91 2Communications equipment manufacturing 3342 25 11 15 *Semiconductor and other electronic component mfg. 3344 226 176 50 *Navigational, measuring, electromed., control instr. mfg. 3345 129 104 25 *Electrical equipment, appliance, and component mfg. 335 44 37 6 *Other 3 3 * *
All other manufacturing 336-339 441 292 146 3Motor vehicle manufacturing 3361 131 43 86 3Motor vehicle parts manufacturing 3363 30 25 5 0Aircraft manufacturing 3364 95 75 19 *Rail, ship, and other transportation manufacturing 3365-3369 11 8 3 *Medical equipment and supplies manufacturing 3391 151 124 27 *Other 23 17 6 *
Wholesale trade 42 172 108 60 4Merchant wholesalers, durable goods 423 72 36 33 3Merchant wholesalers, nondurable goods 424-425 100 72 27 *
Retail trade 44-45 475 361 113 1Food and beverage stores 445 20 13 7 *Clothing and clothing accessories stores 448 47 40 6 0Other 408 308 100 1
A-56

Table A11: Foreign Holdings of U.S. Securities, by industry, as ofJune 30, 2017 (continued)
Billions of dollars
Industry NAICS code1 Total EquityDebt
Long-term
Short-term
Transportation and cargo 48-49 211 132 78 2Air transportation 481 31 27 4 *Rail transportation 482 58 42 16 *Water transportation 483 2 2 1 0Pipeline transportation 486 60 23 37 *Support activities for transportation 488 13 9 4 0Other 46 29 16 1
Publishing and broadcasting 511-515 683 504 177 2Publishing industries (except internet) 511 382 303 78 1Motion picture and sound recording industries 512 67 47 20 0Broadcasting (except internet) 515 234 155 79 1
Telecommunications and information services 517-519 636 405 231 *Wired telecommunications carriers 5171 23 4 19 *Wireless telecommunications carriers (except satellite) 5172 29 8 21 0Other telecommunications 5179 260 100 160 *Other information services 519 266 256 10 0Other 58 37 21 *
Depository credit intermediation (banking) 5221 1,046 388 549 109
Other financial 5222-5239 2,199 424 1,720 54Real estate credit 522292 370 1 368 *Other credit intermed 52239 924 2 921 1Inv. banking 5231 260 55 197 8Other 646 366 234 45
Insurance 524 408 288 119 1
Funds, trusts, and other financial vehicles 525 1,586 1,543 38 5
Services 53-81 900 556 336 8Real estate rental and leasing 531 80 34 46 *Architectural, engineering, and related services 5413 7 5 2 0Computer systems design and related services 5415 151 120 31 0Management, scientific, and technical consulting services 5416 24 19 5 0Offices of bank and other holding companies 5511 13 6 6 *Administrative and support services 561 131 96 32 3Education, health care, and social services 61-62 94 44 49 1Arts, entertainment, and recreation 71 36 16 20 *Accommodation and food services 72 140 102 37 1Other 225 114 108 3
Government2 92 6,178 * 5,499 678
Industry classification unknown 390 85 268 36
All other industries 176 125 45 6
Total 18,412 7,189 10,292 9301 Stands for North American Industry Classification System.2 The government sector includes primarily U.S. Treasuries and also some bonds issued by state and localgovernments. When state and local bonds are clearly associated with a particular industry, such as utilitiesor education, they are classified by that industry. Debt issued by international and regional organizationsis classified as private.
A-57

Appendix B: Data for Exhibits Shown in Graphical Form
B-1
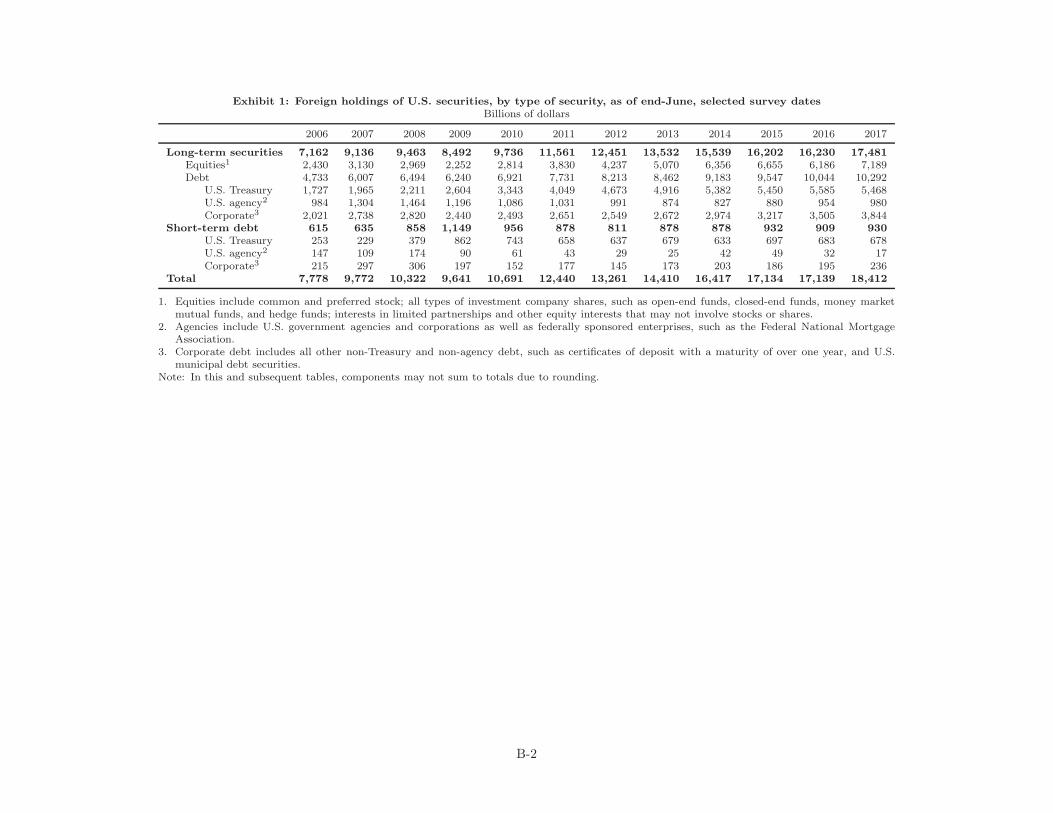
Exhibit 1: Foreign holdings of U.S. securities, by type of security, as of end-June, selected survey datesBillions of dollars
2006 2007 2008 2009 2010 2011 2012 2013 2014 2015 2016 2017
Long-term securities 7,162 9,136 9,463 8,492 9,736 11,561 12,451 13,532 15,539 16,202 16,230 17,481Equities1 2,430 3,130 2,969 2,252 2,814 3,830 4,237 5,070 6,356 6,655 6,186 7,189Debt 4,733 6,007 6,494 6,240 6,921 7,731 8,213 8,462 9,183 9,547 10,044 10,292
U.S. Treasury 1,727 1,965 2,211 2,604 3,343 4,049 4,673 4,916 5,382 5,450 5,585 5,468U.S. agency2 984 1,304 1,464 1,196 1,086 1,031 991 874 827 880 954 980Corporate3 2,021 2,738 2,820 2,440 2,493 2,651 2,549 2,672 2,974 3,217 3,505 3,844
Short-term debt 615 635 858 1,149 956 878 811 878 878 932 909 930U.S. Treasury 253 229 379 862 743 658 637 679 633 697 683 678U.S. agency2 147 109 174 90 61 43 29 25 42 49 32 17Corporate3 215 297 306 197 152 177 145 173 203 186 195 236
Total 7,778 9,772 10,322 9,641 10,691 12,440 13,261 14,410 16,417 17,134 17,139 18,412
1. Equities include common and preferred stock; all types of investment company shares, such as open-end funds, closed-end funds, money marketmutual funds, and hedge funds; interests in limited partnerships and other equity interests that may not involve stocks or shares.
2. Agencies include U.S. government agencies and corporations as well as federally sponsored enterprises, such as the Federal National MortgageAssociation.
3. Corporate debt includes all other non-Treasury and non-agency debt, such as certificates of deposit with a maturity of over one year, and U.S.municipal debt securities.
Note: In this and subsequent tables, components may not sum to totals due to rounding.
B-2

Exhibit 2: Value of foreign-owned U.S. long-term securities and share of the total outstanding, by asset class, as of end-June, selected survey datesBillions of dollars
Security Type Jun 2006 Jun 2007 Jun 2008 Jun 2009 Jun 2010 Jun 2011 Jun 2012 Jun 2013 Jun 2014 Jun 2015 Jun 2016 Jun 2017
EquitiesTotal outstanding1 27,216 32,577 29,293 22,871 25,239 31,494 31,596 37,022 44,521 46,199 45,225 51,157Foreign-owned 2,430 3,130 2,969 2,252 2,814 3,830 4,237 5,070 6,356 6,655 6,186 7,189Percent foreign-owned 8.9 9.6 10.1 9.8 11.2 12.2 13.4 13.7 14.3 14.4 13.7 14.1
Marketable U.S. Treasury debtTotal outstanding2 3,337 3,470 3,636 4,606 6,320 7,803 8,926 9,825 10,696 11,316 11,923 12,292Foreign-owned 1,727 1,965 2,211 2,604 3,343 4,049 4,673 4,916 5,382 5,450 5,585 5,468Percent foreign-owned 51.7 56.6 60.8 56.5 52.9 51.9 52.4 50.0 50.3 48.2 46.8 44.5
U.S. government agency debtTotal outstanding3 5,723 6,292 7,029 7,292 7,042 7,054 7,129 7,208 7,255 7,387 7,724 8,137Foreign-owned 985 1,304 1,464 1,196 1,086 1,031 991 874 827 880 954 980Percent foreign-owned 17.2 20.7 20.8 16.4 15.4 14.6 13.9 12.1 11.4 11.9 12.4 12.0
Corporate and other debtTotal outstanding4 10,482 11,625 12,281 12,287 11,739 11,710 11,701 11,801 12,047 12,458 12,628 12,795Foreign-owned 2,021 2,738 2,820 2,440 2,493 2,651 2,549 2,672 2,974 3,217 3,505 3,844Percent foreign-owned 19.3 23.5 23.0 19.9 21.2 22.6 21.8 22.6 24.7 25.8 27.8 30.0
Total U.S. long-term securitiesTotal outstanding 46,758 53,964 52,239 47,055 50,340 58,061 59,351 65,855 74,518 77,360 77,500 84,381Foreign-owned 7,162 9,136 9,463 8,492 9,736 11,561 12,451 13,533 15,539 16,202 16,230 17,481Percent foreign-owned 15.3 16.9 18.1 18.0 19.3 19.9 21.0 20.5 20.9 20.9 20.9 20.7
1. Source: Federal Reserve Statistical Release Z.1, Financial Accounts of the United States, Table L223, row 1, minus Table L133, row 37, plus Table L224, row 1, plus TableL206, row 1.
2. Source: Bureau of the Public Debt, Table 1, Summary of Public Debt Summary of Treasury Securities Outstanding, Total marketable held by the public including the FederalReserve System, less Bills.
3. Source: Federal Reserve Statistical Release Z.1, Financial Accounts of the United States, and consolidated balance sheets of Freddie Mac, Fannie Mae, and the combinedFederal Home Loan Banks. The long-term outstanding amounts are the total long-term and short-term U.S. Government agency liabilities from Flow of Funds Table L211,row 1, minus short-term debt securities outstanding issued by Freddie Mac, Fannie Mae, and the combined Federal Home Loan Banks. These short-term debt securitiesoutstanding were approximately $529 billion as of June 2017. U.S. government agency securities include all securities issued by federally sponsored agencies and corporations,as well as all securities guaranteed by the Government National Mortgage Association (GNMA). Amounts outstanding include those held by the Federal Reserve System.
4. Source: Federal Reserve Statistical Release Z.1, Financial Accounts of the United States, Table 213 line 1, minus Table 133 line 27, plus Table 107 line 21.
B-3

Exhibit 5: Market value of U.S. holdings of foreign long-term securities andforeign holdings of U.S. long-term securities, as of selected survey dates
Billions of dollars
U.S. holdings offoreign long-term
securities1
(assets)
Foreign holdings ofU.S. long-term
securities(liabilities)
U.S. holdings asa share of foreign
holdings(assets/liabilities)
Net asset positions inlong-term securitiesof U.S. residents2
Dec. 1994 870 1,244 0.70 -374Mar. 2000 2,678 3,558 0.75 -880Jun. 2002 2,129 3,926 0.54 -1,797Jun. 2003 2,367 4,503 0.53 -2,136Jun. 2004 3,027 5,431 0.56 -2,404Jun. 2005 3,728 6,262 0.60 -2,534Jun. 2006 4,799 7,162 0.67 -2,363Jun. 2007 6,429 9,136 0.70 -2,707Jun. 2008 6,324 9,463 0.67 -3,139Jun. 2009 4,615 8,492 0.54 -3,877Jun. 2010 5,282 9,736 0.54 -4,454Jun. 2011 6,830 11,561 0.59 -4,731Jun. 2012 6,834 12,451 0.55 -5,616Jun. 2013 7,842 13,532 0.58 -5,691Jun. 2014 9,531 15,539 0.61 -6,008Jun. 2015 9,730 16,202 0.60 -6,473Jun. 2016 9,170 16,230 0.56 -7,060Jun. 2017 10,734 17,481 0.61 -6,747
1. Staff estimates from March 1994 to December 2010. Because surveys of foreign holdings of U.S.long-term securities were collected on different dates from the surveys of U.S. holdings of foreignsecurities, estimated positions are shown for the between-survey values of foreign holdings. Theseestimates are subject to revision. For Dec. 2011 onward, source is TIC SLT.
2. Net foreign holdings are defined as U.S. holdings of foreign securities minus foreign holdings of U.S.securities.
B-4

Exhibit 7: Foreign holdings of U.S. long-term corporate and agency debt,as of selected survey datesBillions of dollars
Agency debt Corporate debt
Total ABS Non-ABS ABS share Total ABS Non-ABS ABS share
Jun. 2006 984 386 599 0.39 2,021 594 1,427 0.29Jun. 2007 1,304 570 735 0.44 2,738 902 1,835 0.33Jun. 2008 1,464 773 691 0.53 2,820 760 2,060 0.27Jun. 2009 1,196 752 444 0.63 2,440 508 1,931 0.21Jun. 2010 1,086 713 372 0.66 2,493 445 2,047 0.18Jun. 2011 1,031 714 317 0.69 2,651 426 2,225 0.16Jun. 2012 991 717 274 0.72 2,549 404 2,145 0.16Jun. 2013 874 657 217 0.75 2,672 403 2,268 0.15Jun. 2014 827 668 159 0.81 2,974 396 2,578 0.13Jun. 2015 880 742 138 0.84 3,217 412 2,805 0.13Jun. 2016 954 832 123 0.87 3,505 356 3,149 0.10Jun. 2017 980 891 90 0.91 3,844 371 3,473 0.10
B-5

Exhibit 8: Value of foreign holdings of U.S. long- and short-term securities, bymajor investing country, as of June 30, 2017 and June 30, 2016
Billions of dollars
June 30, 2016 June 30, 2017
Country Total Equities Debt Total Equities Debt
Japan 1,960 428 1,532 1,998 490 1,508Cayman Islands 1,525 796 728 1,687 928 759China1 1,630 178 1,452 1,541 194 1,347United Kingdom 1,427 741 686 1,493 844 649Luxembourg 1,349 516 832 1,398 532 866Ireland 931 238 693 1,068 296 772Canada 951 695 255 1,061 810 251Switzerland 742 351 391 824 413 411Belgium 589 31 558 691 38 653Taiwan 519 43 476 565 56 509Country Unknown 82 * 82 64 1 64Rest of world 5,436 2,168 3,268 6,022 2,589 3,434
Total 17,139 6,186 10,954 18,412 7,189 11,222
Of which: Holdings offoreign official institutions 5,504 821 4,683 5,575 952 4,623
1. Excludes Hong Kong and Macau, which are reported separately.
B-6

Exhibit 9: Value of long-term securities held by foreign official institutions, and the percentage of total foreign holdingsthese represent, by type of security, as of end-June, selected survey dates
Billions of dollars
Security Type 2006 2007 2008 2009 2010 2011 2012 2013 2014 2015 2016 2017
Equities1
Total foreign holdings 2,430 3,130 2,969 2,252 2,814 3,830 4,237 5,070 6,356 6,655 6,186 7,189Of which: Foreign official 215 266 363 311 426 567 630 799 956 961 821 952Percent foreign official 8.8 8.5 12.2 13.8 15.1 14.8 14.9 15.8 15.0 14.4 13.3 13.2
Treasury debtTotal foreign holdings 1,727 1,965 2,211 2,604 3,343 4,049 4,673 4,916 5,382 5,450 5,585 5,468
Of which: Foreign official 1,213 1,452 1,684 2,054 2,617 3,103 3,489 3,648 3,765 3,806 3,761 3,663Percent foreign official 70.2 73.9 76.2 78.9 78.3 76.6 74.7 74.2 70.0 69.8 67.3 67.0
Agency debtTotal foreign holdings 984 1,304 1,464 1,196 1,086 1,031 991 874 827 880 954 980
Of which: Foreign official 473 750 966 794 721 635 543 452 434 456 446 426Percent foreign official 48.0 57.5 66.0 66.4 66.4 61.6 54.8 51.7 52.5 51.9 46.7 43.5
Corporate debtTotal foreign holdings 2,021 2,738 2,820 2,440 2,493 2,651 2,549 2,672 2,974 3,217 3,505 3,844
Of which: Foreign official 96 99 106 107 97 104 110 127 156 167 173 171Percent foreign official 4.8 3.6 3.7 4.4 3.9 3.9 4.3 4.7 5.2 5.2 4.9 4.4
All long-term securitiesTotal foreign holdings 7,162 9,136 9,463 8,492 9,736 11,561 12,451 13,532 15,539 16,202 16,230 17,481
Of which: Foreign official 1,997 2,567 3,119 3,266 3,862 4,409 4,772 5,025 5,311 5,391 5,201 5,212Percent foreign official 27.9 28.1 33.0 38.5 39.7 38.1 38.3 37.1 34.2 33.3 32.0 29.8
Note: Percentages are calculated from unrounded dollar value figures and may differ slightly from percentages calculated from rounded dollarvalues shown in this table.
1. Equities include common and preferred stock; all types of investment company shares, such as open-end funds, closed-end funds, moneymarket mutual funds, and hedge funds; as well as interests in limited partnerships and other equity interests that may not involve stocks orshares.
B-7

Exhibit 10: Value of short-term securities held by foreign official institutions, and the percentage oftotal foreign holdings these represent, by type of security, as of end-June, selected survey dates
Billions of dollars
Security Type 2007 2008 2009 2010 2011 2012 2013 2014 2015 2016 2017
Treasury debtTotal foreign holdings 229 379 862 743 658 637 679 633 697 683 678
Of which: Foreign official 159 226 572 454 414 366 363 341 367 272 329Percent foreign official 69.6 59.6 66.3 61.2 62.9 57.5 53.4 53.8 52.6 39.9 48.6
Agency debtTotal foreign holdings 109 174 90 61 43 29 25 42 49 32 17
Of which: Foreign official 80 130 34 24 16 5 3 8 12 6 0Percent foreign official 73.2 74.8 37.3 38.7 37.7 17.2 11.9 18.3 24.9 20.1 2.5
Corporate debtTotal foreign holdings 297 306 197 152 177 145 173 203 186 195 236
Of which: Foreign official 17 18 9 6 8 6 15 23 24 25 33Percent foreign official 5.6 5.9 4.7 3.9 4.4 3.8 8.7 11.3 12.9 12.7 14.1
All short-term securitiesTotal foreign holdings 635 858 1,149 956 878 811 878 878 932 909 930
Of which: Foreign official 256 373 614 484 438 377 381 372 403 303 363Percent foreign official 40.3 43.5 53.5 50.6 49.9 46.5 43.4 42.3 43.2 33.4 39.0
Note: Percentages are calculated from unrounded dollar value figures and may differ slightly from percentages calculatedfrom rounded dollar values shown in this table.
B-8

Exhibit 11: Value of foreign holdings of U.S. Treasury securities, by major investingcountry, as of June 30, 2017
Billions of dollars
Treasury long-term debt1 Treasury
Country Total Totalof which:Nominal
of which:TIPS2
of which:FRN
short-termdebt1
China3 1,146 1,144 949 195 * 2Japan 1,090 1,034 993 39 1 56Ireland 304 260 224 24 12 44Brazil 270 252 234 13 5 17Cayman Islands 249 158 98 52 8 91Switzerland 245 214 190 22 1 31United Kingdom 234 200 148 33 19 35Luxembourg 212 174 138 24 12 38Hong Kong 201 137 100 7 30 63Taiwan 186 183 168 14 * 3Rest of world 2,009 1,713 1,513 170 29 296
Total 6,145 5,468 4,756 593 118 678
Of which: Holdings offoreign official institutions 3,992 3,663 3,221 381 60 329
* Greater than zero but less than $500 million.1. Long-term denotes original maturity of over one year; short-term denotes original maturity of one year
or less.2. TIPS are Treasury Inflation-Protected Securities.3. Excludes Hong Kong and Macau, which are reported separately.
B-9

Exhibit 12: Value of foreign holdings of U.S.equities, by major investing country,
as of June 30, 2017Billions of dollars
June 30, 2016 June 30, 2017
Country or region TotalCommonstock
Fundshares
Other1 TotalCommonstock
Fundshares
Other1
Cayman Islands 796 441 199 156 928 531 236 161United Kingdom 741 625 67 48 844 721 73 50Canada 695 562 105 28 810 641 134 35Luxembourg 516 472 36 8 532 484 38 10Japan 428 325 96 7 490 394 88 8Switzerland 351 288 57 6 413 341 63 9Ireland 238 213 19 6 296 265 24 7Netherlands 210 135 60 15 254 164 73 17Norway 201 186 15 * 239 224 15 *Germany 155 136 13 7 208 186 15 7Rest of world 1,854 1,283 406 165 2,177 1,505 493 179
Total 6,186 4,665 1,073 448 7,189 5,454 1,252 483
Of which: Holdings offoreign official institutions 821 728 60 34 952 848 69 35
* Greater than zero but less than $500 million.1. Includes preferred stock, interests in limited partnerships, and other types of equity.2. Excludes Hong Kong and Macau, which are reported separately.
B-10

Exhibit 15: Maturity structure of foreign-held U.S. long-term debt securities, as of June 30, 2017Billions of dollars
Total U.S. Treasuries U.S. agencies U.S. corporate
Years to maturity Total FOI Private Total FOI Private Total FOI Private Total FOI Private
One year or less 9.7 11.2 8.7 13.0 12.2 14.6 2.7 3.2 2.3 7.0 9.8 6.81 to 2 years 12.3 16.3 9.4 17.7 18.3 16.4 2.1 2.5 1.8 7.3 8.8 7.22 to 3 years 11.2 14.5 8.7 14.2 16.1 10.1 1.9 2.5 1.4 9.2 10.6 9.23 to 4 years 9.2 10.6 8.2 10.8 11.9 8.6 0.7 0.6 0.8 9.0 8.5 9.04 to 5 years 9.2 9.6 9.0 10.2 10.6 9.6 1.0 1.0 0.9 9.9 9.9 9.95 to 6 years 6.6 6.9 6.4 6.9 7.7 5.1 0.4 0.3 0.5 7.9 7.4 8.06 to 7 years 6.0 6.4 5.6 6.8 7.2 6.1 0.4 0.3 0.6 6.2 6.4 6.17 to 8 years 4.3 3.5 4.9 4.0 3.8 4.5 0.9 0.3 1.3 5.6 5.5 5.68 to 9 years 3.9 3.2 4.3 3.9 3.5 4.9 0.5 0.3 0.7 4.6 5.1 4.69 to 10 years 3.8 2.4 4.9 3.3 2.4 5.3 0.9 0.4 1.2 5.3 6.5 5.210 to 15 years 2.7 0.9 4.0 1.1 0.7 2.1 4.4 2.0 6.4 4.4 3.1 4.515 to 20 years 3.1 0.6 5.0 0.3 0.1 0.7 3.4 3.1 3.7 7.1 3.9 7.220 to 25 years 4.8 4.4 5.1 3.0 3.1 2.8 13.7 15.3 12.4 5.1 3.9 5.225 to 30 years 11.8 9.3 13.6 4.7 2.5 9.2 65.6 67.7 64.0 8.2 8.0 8.2More than 30 years 1.3 0.2 2.1 0.0 0.0 0.0 1.4 0.6 2.0 3.1 2.7 3.2Total 100.0 100.0 100.0 100.0 100.0 100.0 100.0 100.0 100.0 100.0 100.0 100.0
B-11

Appendix C: Forms and Instructions
C-1

OMB Control No. 1505-0123
Approval Expires: 6/30/2020
MANDATORY REPORT TO THE FEDERAL RESERVE BANK OF NEW YORK
FOREIGN-RESIDENTS’ HOLDINGS OF U.S. SECURITIES,
INCLUDING SELECTED MONEY MARKET
INSTRUMENTS (SHL(A))
As of the last day of June
Mandatory Report Response Required
By Law (22 U.S.C. 3101 et seq.)
Department of the Treasury
Federal Reserve Bank of New York
Board of Governors of the Federal Reserve System
December
2016

TABLE OF CONTENTS
Page I. INTRODUCTION 1-3
A. PURPOSE 1 B. AUTHORITY 2 C. CONFIDENTIALITY OF DATA REPORTED 2 D. PENALITIES FOR FAILURE TO REPORT 2 E. PAPERWORK REDUCTION ACT NOTICE 2
II. GENERAL INSTRUCTIONS 4-6 A. WHO MUST REPORT 4 B. CONSOLIDATION RULES 5 C. REPORTING DATES 5 D. SUBMISSION INSTRUCTIONS AND CONTACT INFORMATION 5
III. WHAT SECURITIES MUST BE REPORTED 7-17 A. FOREIGN-RESIDENT OWNERSHIP 7 B. REPORTABLE U.S. SECURITIES 8 C. DO NOT REPORT 9 D. ASSET-BACKED SECURITIES 10 E. FUNDS AND RELATED EQUITY OWNERSHIP 10 F. SECURITIES INVOLVED IN REPURCHASE AND SECURITIES LENDING 13
ARRANGEMENTS G. STRIPPED SECURITIES 13 H. U.S. GOVERNMENT AGENCIES OR FEDERALLY SPONSORED 13
ENTERPRISES I. DIRECT INVESTMENT 14 J. SECURITIES HELD BY U.S. CENTRAL SECURITIES DEPOSITORIES 14 K. LIMITED PARTNERSHIPS 15 L. ACCOUNTING RULES, VALUATION OF SECURITIES, AND 16
CALCULATION OF U.S. DOLLAR VALUES M. DATA RETENTION PERIOD 17 N. REVIEW OF DATA AND REQUEST FOR REVISED DATA 17
IV. LINE-BY-LINE INSTRUCTIONS FOR SCHEDULE 1-REPORTER 18-20 CONTACT INDENTIFICATION AND SUMMARY OF FINANCIAL INFORMATION
V. LINE-BY-LINE INSTRUCTIONS FOR SCHEDULE 2-DETAILS OF 21-25 SECURITIES

APPENDICES A. SAMPLE REPORTING SCHEDULES
B. FLOWCHARTS SHOWING REPORTING RESPONSIBILITY DETERMINING REPORTABLE SECURITIES
26 27-28
C. LIST OF COUNTRY CODES AND CODES FOR 30 INTERNATIONAL AND REGIONAL ORGANIZATIONS D. LIST OF FOREIGN OFFICIAL INSTITUTIONS
31
E. LIST OF CURRENCY CODES 32-33 F. GLOSSARY 34G. TECHNICAL INFORMATION FOR ELECTRONIC SUBMISSION H. LIST OF FEDERAL AGENCIES AND FEDERALLY SPONSORED
ENTERPRISES
35 36

1
1. INTRODUCTION A. PURPOSE The Department of the Treasury, with the assistance of the Board of Governors of the Federal Reserve System and
the Federal Reserve Bank of New York (FRBNY), is conducting a mandatory annual survey of holdings of U.S.
securities, including selected money markets instruments, by foreign residents as of June 30 of each year. The data
will be collected by the FRBNY, acting as fiscal agent for the Department of the Treasury. The data collected will
be used by the U.S. Government in the computation of the U.S. balance of payments accounts, the U.S.
international investment position, and in the formulation of international economic and financial policies. These
data also will be used to provide aggregate information to the public on these foreign portfolio investments and to
meet international reporting commitments. In order to reduce reporting burden and costs to the government, there will be a substantial reduction in the number
of reporters in four out of every five years. A benchmark survey Report of Foreign Holdings of U.S. Securities,
Including Selected Money Market Instruments (Form SHL) of all significant U.S.-resident custodians and issuers
will continue to be held approximately every five years. In non- benchmark years, the Annual Report of Foreign
Holdings of U.S. Securities, Including Selected Money Market Instruments (Form SHLA) will require reports
from only the largest U.S.- resident custodians and issuers. The data reported under these annual surveys (Form
SHLA) will be used in conjunction with the results of the previous benchmark survey to compute estimates for the
non- benchmark years. The next full Benchmark survey will be as of June 30, 2019. The determination of who must report on the annual reports (Form SHLA) will be based upon the data submitted
during the previous Benchmark survey and Aggregate Holdings of Long-Term Securities by U.S. and Foreign
Residents (TIC SLT) report as of December of the preceding year. Designated U.S.-resident custodians and
issuers will be required to file detailed security data on Schedule 2, in the same manner as they did on the June 30,
2014 benchmark survey. B. AUTHORITY This mandatory survey is conducted under the authority of the International Investment and Trade in Services Survey
Act (22 U.S.C. 3101 et seq., [the Act]) and Executive Order 11961 of January 19, 1977. The Act specifies that the
President has the authority to conduct a regular data collection program, including such studies and reports as may
be necessary and feasible, to secure current information on international investment, including (but not limited to)
such information as may be necessary for computing and analyzing the balance of payments accounts and the
international investment position of the United States (22 U.S.C. 3103). In Executive Order 11961 §2, the President
designated the Secretary of the Treasury to be responsible for collecting data on portfolio investment required by
the Act.

2
C. CONFIDENTIALITY OF DATA REPORTED The information collected by this survey may be used only for analytical and statistical purposes and to enforce the
Act. Access to the information is available only to officials and employees (including consultants and contractors
and their employees) designated to perform functions under the Act. Persons having access to individual company
information submitted pursuant to the Act are subject to penalties for unauthorized disclosure (22 U.S.C. §3104
and 18 U.S.C. §1905). The results of this survey will be made available to the general public at an aggregated
level so that neither the U.S. persons or organizations providing information nor individual or organizational
ownership of U.S. securities can be identified.
D. PENALTIES FOR FAILURE TO REPORT Reporting as directed in this package is mandatory for any U.S.-resident person or entity subject to the reporting
requirements set forth in the report instructions. Failure by an entity to provide timely and accurate data can result
in a civil penalty of not less than $2,500 and not more than $25,000, or injunctive relief ordering such person to
comply, or both (22 U.S.C. §3105 (a) and (b)). Willfully failing to submit any required information under the Act can result in a fine of not more than $10,000;
and, if an individual, may result in imprisonment for not more than a year, or both. Any officer, director, employee
or agent who knowingly participates in such violation, upon conviction, may be punished by a like fine,
imprisonment, or both (22 U.S.C. §3105 (c)). E. PAPERWORK REDUCTION ACT NOTICE
This report titled “Foreign Holdings of U.S. Securities, Including Selected Money Market Instruments” in the
Federal Register Notice and has been reviewed and approved by the Office of Management and Budget in
accordance with the Paperwork Reduction Act of 1995 and assigned OMB Control Number 1505-0123. The
purpose is to collect accurate and complete data that will enable the Treasury Department to fulfill its
responsibility under the Act. The estimated average burden associated with this collection of information is 486
hours per report for each U.S.-resident custodian reporting detailed information on Schedule 2, and 110 hours per
report for each U.S.-resident issuer of U.S. securities providing detailed information on Schedule 2. The amount of
time required to complete the report will vary depending on the amount of data to report. Comments concerning
the accuracy of these burden estimates and suggestions for reducing the reporting burden should be directed to:
Administrator, International Portfolio Investment Data Systems
U.S. Department of the Treasury
1500 Pennsylvania Avenue NW, Room 5422MT
3
Washington, DC 20220, or
The Office of Management and Budget
Paperwork Reduction Project (1505-0123)
Washington, DC 20503 No person is required to respond to any U.S. Government collection of information unless it displays a currently
valid OMB control number.

4
II. GENERAL INSTRUCTIONS
A. WHO MUST REPORT
All U.S.-resident entities that been contacted by the Federal Reserve Bank of New
York must report, regardless of the size of their consolidated holdings. All other entities are exempt from
reporting.
Types of reporting entities include U.S.-resident custodians (including U.S.-resident central securities
depositories) and U.S.-resident issuers. Entities that provide multiple services (i.e., provide custodial
services and issue securities) should report securities that meet the reporting criteria for each role and
ensure that securities are not double counted.
• U.S.-resident custodians, including brokers and dealers, must report all U.S. securities they
hold in custody (or manage the safekeeping of) for the account of foreign residents (including
their own foreign branches, subsidiaries, and affiliates). These securities must be reported by the
U.S.- resident custodian even if the securities are in turn held at DTC, Euroclear, or another
central securities depository, since the central securities depository knows only that it is holding
securities on behalf of the U.S.-resident custodian, whereas the U.S.-resident custodian knows
that it is holding these securities on behalf of a foreign resident. However, if a U.S.-resident
custodian uses a U.S.- resident sub-custodian, the custodian should report if (and only if), it does
not maintain separate accounts at and disclose the clients to the sub-custodian. (If the custodian
does maintain separate accounts at and disclose the clients to the sub-custodian, it should not
report, to prevent double counting.)
• U.S.-resident central securities depositories, must report all U.S. securities they hold in
custody (or manage the safekeeping of) directly on behalf of foreign residents with which they
have established direct relationships, including foreign-resident brokers, dealers, exchanges, and
central securities depositories.
• U.S.-resident issuers, must report all securities issued by U.S.-resident units , which are:
1. Owned by foreign residents for which neither a U.S.-resident custodian nor a U.S.
resident central securities depository is used. Transfer or paying agents should be able to
provide the U.S.- resident issuer with this information;
2. In book entry form that are held at a foreign-resident central securities depository; or
3. Bearer securities.
Please refer to Section III, What Securities Must Be Reported, to identify reportable U.S. securities.

5
B. CONSOLIDATION RULES
U.S.-resident organizations, including bank holding companies (BHC), financial holding companies
(FHC), and intermediate holding companies (IHC) should include all reportable securities for all U.S.-
resident parts of their organization, including all U.S.-resident branches and subsidiaries. U.S. residents
include entities located in the Commonwealth of Puerto Rico and the U.S. territories. Please see
Appendix F for the complete definition of United States. It is the responsibility of the U.S. parent entity in
each organization to ensure that its report includes all applicable entities within its organization.
Securities issued by U.S.-resident trusts and special purpose entities (SPEs) for which the reporter is the
trustee or primary beneficiary should be included. Shares of U.S.-resident funds that are managed by the
reporting entity should be included unless a U.S.-resident custodian other than the reporting entity is used.
U.S. branches and agencies of a foreign bank located in the same state and within the same Federal Reserve
District should submit a consolidated report for these offices. U.S. branches and agencies of a foreign bank
that are located in either different states or different Federal Reserve Districts, should submit separate
reports.
C. REPORTING DATES
Report data as of the last business day of June. All data should be submitted to the Federal Reserve Bank of
New York no later than the last business day of August.
D. SUBMISSION INSTRUCTIONS AND CONTACT INFORMATION
If your organization is submitting 100 or more Schedule 2 records, the Schedule 2 data must be submitted
electronically.
Federal Reserve Reporting Central System:
• Submit the SHL(A) report using the Federal Reserve Reporting Central System. The Reporting
Central System is fast, easy to use, and secure. You can submit reports quickly and easily either
using online data entry or via XML file transfer. Reporting Central provides a confirmation of data
receipt at the Federal Reserve Bank and checks the validity of your submission. Reporting Central
saves time and delivery costs, avoids possible mail delays, and eliminates paper and fax
transmissions.

6
• For more information on how to submit data using the Reporting Central system, log on
to https://www.frbservices.org/centralbank/reportingcentral/index.html, or contact the SHL staff at
212-720-6300 or at [email protected]. A n application to register for Reporting Central can
be obtained at: https://www.frbservices.org/centralbank/reportingcentral/application_setup.html
Completed applications should be sent to:
Federal Reserve Bank of New York Statistics Function, 4th Floor 33 Liberty Street New York, NY 10045-0001 or faxed to (212) 720-2598
Alternative Methods of Reporting:
• If your organization is submitting less than 100 Schedule 2 records, these records may be
submitted using Reporting Central or on paper, using the form contained in Appendix A. Data
may also be reported on computer printouts in the same format as the printed reports. Schedule
1 must be submitted in the same package as the Schedule 2 data.
Please contact FRBNY staff with questions pertaining to the report or if any of the following conditions
apply:
1. Your entity requires additional time to complete your report.
2. Your entity received a copy of the report booklet and is not the U.S. parent entity in your
organization.
3. Your entity cannot submit a single report for its entire organization.
4. Your reporter contact information or technical contact information changes after you submit your
Schedule 1 report.
Reports can be mailed or sent by courier to:
Federal Reserve Bank of New York Statistics Function, 4th Floor 33 Liberty Street New York, NY 10045-0001 FRBNY staff can be reached at:
Phone: 212-720-6300 or 646-720-6300 Email: [email protected] Additional copies of the reporting forms and instructions may be printed from the Internet at:

7
https://www.treasury.gov/resource-center/data-chart-center/tic/Pages/forms-sh.aspx#shl
8
III. WHAT SECURITIES MUST BE REPORTED
This report collects information on securities issued by U.S.-residents that are owned by foreign residents, including
U.S. equities (including shares in funds), U.S. short-term debt securities (including selected money market
instruments), U.S. long-term debt securities, and U.S. asset-backed debt securities.
Reportable securities may be traded or issued in the United States or in foreign countries, and may be denominated
in any currency. Neither the country in which the securities are traded or issued, nor the currency in which the
securities are denominated, is relevant in determining whether the securities are reportable. Securities held as part
of a direct investment relationship should not be reported. (See Section III.I.)
A. FOREIGN-RESIDENT OWNERSHIP
Securities are considered to be foreign owned if, according to the reporter's records; the holder of record is not a
resident of the United States. In addition, all outstanding bearer bonds should be assumed to be owned by foreign
residents and reported by the U.S.-resident issuer. Bearer bonds should also be reported by U.S.-resident
custodians, but only if the reporter’s records indicate a foreign-resident owner (or foreign-resident custodian).
The following are considered to be foreign residents:
• Residents of foreign countries, including foreign-resident custodians and foreign-resident central securities
depositories. (These include residents of Canada, Mexico, and offshore centers.)
• International organizations with extra-territorial status (even if located in the United States), such as the
International Bank for Reconstruction and Development (World Bank), the International Monetary Fund
(IMF) and the Inter-American Development Bank. 1 (See Appendix C for a complete list of these
organizations.)
• Foreign subsidiaries of U.S. entities and foreign-resident branches of U.S. banks.
• Offshore and other non-U.S. funds.
• Entities or individuals that file an IRS Form W-8, indicating that they are foreign residents. Please note that
there may be exceptions (such as Puerto Rico). However, if an IRS Form is not available, the mailing
address can be used to determine residency.
1 Pension plans of international and regional organizations, if located in the United States, are U.S.-resident entities; therefore, any securities owned by these
pension plans should be excluded from this report.
9
B. REPORTABLE U.S. SECURITIES
U.S. securities are securities issued by U.S.-resident entities, with the exception of Depositary Receipts (DRs) that
are backed by foreign securities and securities issued by international organizations that have extra-territorial status,
such as the World Bank and the Inter-American Development Bank. U.S. securities can be issued in any country,
denominated in any currency, and traded on any exchange.
U.S.-resident entities include U.S.-resident branches of foreign banks and U.S.-resident subsidiaries of foreign
companies. Securities issued by foreign branches or subsidiaries of U.S. entities are not U.S. securities unless, due
to merger, reorganization, or default, a U.S.-resident entity assumes direct responsibility for the payment of a
previously issued foreign security.
Reportable securities include:
Equity Securities
• Common stock
• Preferred stock (participating and nonparticipating preference shares)
• Restricted stock
• U.S.-resident fund shares (open-end and closed-end), REITS, money market mutual funds, index- linked
equity securities including unit investment trusts (including SPDRs, DIAMONDs, etc.)
• All other equity, including shares or units of ownership in unincorporated business enterprises, such as
limited partnerships
Debt Securities
• Debt, registered and bearer, including bonds and notes (unstripped and stripped) and bonds with multiple
call options
• Convertible debt and debt with attached warrants
• Zero-coupon debt and discount notes
• Index-linked debt securities (e.g., property index certificates)
• Commercial paper (including asset-backed commercial paper)
• Bankers' acceptances and trade acceptances
• Negotiable certificates of deposit, bank notes, and deposit notes
• Notes, including those issued under note issuance facilities and revolving underwriting facilities medium-
term notes, promissory notes, deep-discounted, currency-linked (e.g., dual-currency), floating rate notes
(FRN), such as perpetual notes (PRN), variable rate notes (VRN), structured FRN, reverse FRN, collared

10
FRN, step up recovery FR (SURF), and range/corridor/accrual notes
• Asset-backed securities (see Section III.D)
• All other long-term and short-term debt securities
(Note: U.S. debt securities that are still outstanding as of June 30 should be reported even if the maturity date has
passed.)
C. DO NOT REPORT
Do not report any:
• Derivative contracts (including futures, forwards, swaps, options and warrants) meeting the definition of a
derivative under ASC 815 (formerly FAS 133). Embedded derivatives that are not bifurcated under ASC
815 should be included in the value of the host contract. However, if an embedded derivative is bifurcated
the derivative should be excluded from the report.
• Securities which have been temporarily received as collateral under resale agreements or similar financing
agreements (see Section III.F)
• Loans and loan participation certificates
• Letters of credit
• Non-negotiable certificates of deposit
• Bank deposits, including time (except for negotiable CDs) and demand deposits
• Annuities, including variable rate annuities
• Foreign securities, including:
1. Depositary receipts (DRs) backed by foreign securities, including ADRs (American Depositary
Receipts), ADSs (American Depositary Shares), GDRs (Global Depositary Receipts), and IDRs
(International Depositary Receipts).
2. Securities issued by international and regional organizations with extra-territorial status, such as the
International Bank for Reconstruction and Development (IBRD or World Bank) or the Inter-
American Development Bank (IDB). (See Appendix C for a list of these organizations.)
3. Securities issued in the United States by foreign-resident entities (e.g., Canadian or Mexican
entities), even if they are denominated in U.S. dollars and traded on U.S. securities exchanges.
4. Securities issued by foreign subsidiaries of U.S. entities (e.g., GMAC Canada) or foreign branches
of U.S. banks, even if they are guaranteed by the U.S. parent company, or issued in the United
States.
5. Securities issued by foreign-resident entities under Section 144A of the SEC Act.
6. Securities issued by corporations that were incorporated outside of the United States by the report

11
as of date, including companies incorporated offshore in countries such as the Cayman Islands and
Bermuda.
D. ASSET-BACKED SECURITIES
Asset-backed securities (ABS) are securitized interests in a pool of assets, which give the purchaser a claim against
the cash flows generated by the underlying assets. Securities backed by revolving credits, such as pools of credit
card receivables, are reported as ABS if the return to the owner is based upon these credits, (i.e., the credits do not
merely serve as collateral). Foreign-owned ABS should be reported if the issuer securitizing the assets is a U.S.
resident. The underlying asset should not be used to determine if the ABS are reportable.
Include as ABS all collateralized mortgage obligations (CMOs), collateralized bond obligations (CBOs),
collateralized loan obligations (CLOs), collateralized debt obligations (CDOs), and other securities backed by pools
of:
• mortgages;
• credit card receivables;
• automobile loans;
• consumer and personal loans;
• commercial and industrial loans and other whole loans; and
• other assets.
E. FUNDS AND RELATED EQUITY OWNERSHIP
Report foreign-residents’ ownership of shares/units of funds and investment trusts legally established in the
United States (U.S.-resident funds) as equity securities. All foreign-residents’ ownership of U.S.- resident fund
shares should be assigned security type = 3 (fund shares), and not categorized as a debt security, regardless of the
types of securities held by the fund.
For purposes of this report, funds include all investment vehicles that pool investors’ money and invest the pooled
money in one or more of a variety of assets. Funds include, but are not limited to:
• mutual funds (including both open-end and closed-end mutual funds);
• money market funds;
• investment trusts;
• index-linked funds;
• exchange-traded funds (ETFs);
12
• hedge funds; and
• common trust funds.
• private funds
The determination of whether a fund’s shares are a U.S. security is based on the country in which the fund is legally
established, not based on the residence of the issuers of the securities the fund purchases. For example, if a foreign
resident owns shares in a fund organized in New York, these shares are reportable U.S. securities, whether or not
the fund purchases foreign securities. Conversely, foreign- resident ownership of shares of “offshore” or other
foreign-resident funds that purchase U.S. securities should not be reported.
Many funds established outside of the United States have names that are similar to U.S.-resident fund names. This
often occurs when the fund is managed by a group that also manages many U.S.-resident funds and therefore may
be thought of as managing only U.S.-resident funds. If there is doubt as to whether the investment should be
classified as a fund or whether a fund is U.S. or foreign, please contact FRBNY staff at 212-720-6300 or 646-720-
6300.
Report the ownership of U.S. securities by foreign-resident funds. Although ownership of shares of foreign-
resident funds are excluded from this report, any U.S. securities owned by foreign-resident funds for their portfolio
are reportable. These are distinct investments and, therefore, are not duplicate reporting. U.S. securities owned by
foreign-resident funds should be classified as either equity, debt, or asset-backed securities, as indicated in Section
III.B.
Reporting guidelines for Hedge Funds and other alternative investments
Investment advisors, managers, administrators or similar types of legal entities that create master and
feeder funds both outside and inside the U.S. should report as follows:
• Investments between the U.S. and foreigner entities (affiliates) of a hedge fund that the investment manager
establishes and the investments the manager makes in these entities, are portfolio investment and should
be reported on this report as long as they meet the criteria for the direct investment exception for private
funds described below.
Example 1
A U.S. investment manager creates a hedge fund comprised of a U.S. Master Fund, a Cayman Feeder Fund,
and a U.S Feeder Fund. The investment that the foreign feeder fund has in the master fund is portfolio
investment and should be reported in the TIC system. Purchase and sales of the master fund shares by the

13
foreign feeder fund should be reported on the TIC S by the U.S. based master fund and the master fund should
report the ownership of their “shares” by the foreign feeder funds as issuer of the “domestic security” on the
SHL(A) report. If a U.S. custodian is involved in the holding the “domestic security” then the reporting
responsibility would be on the U.S. custodian to report on the SHL(A).
Example 2
A foreign hedge fund creates a U.S. based Master Fund, a Cayman Feeder Fund, and a U.S. Feeder Fund.
The investment that the foreign feeder fund has in the master fund is portfolio investment and should be
reported in the TIC system. Purchase and sales of the master fund shares by the foreign feeder fund should
be reported on the TIC S by the U.S. based master fund and the master fund should also report the
ownership of their “shares” by the foreign feeder funds as issuer of the “domestic security” on the SHL(A)
report. If a U.S. custodian is involved in the holding of the “domestic security” then the reporting
responsibility would be on the U.S. custodian to report on the SHL(A).
Direct investment exception for private funds (see Direct Investment in the glossary)
While investments in U.S. entities of 10 percent or more of their voting interest by a foreign entity are typically
excluded from TIC reports, investments in private funds, or between the entities of a private fund, are included in
TIC surveys regardless of ownership share if they meet BOTH of the following criteria:
• The private fund does not own, directly or indirectly through another business enterprise, an “operating company” – i.e., a business enterprise that is not a private fund or a holding company— in which the foreign parent owns at least 10 percent of the voting interest,
AND
• If the private fund is owned indirectly (through one or more other U.S. business enterprises), there are no “operating companies” between the foreign parent and the indirectly-owned private fund.
Note: The descriptions of the various examples are based on common master/feeder fund structures. It is possible
for there to be different types of structures when creating these funds and they may be called different names by
some entities. Ultimately, if the entity 1) has less than 10% voting interest, 2) non-voting interest in the U.S. private
fund, or 3) meets the criteria above regarding “operating companies”, it is not a direct investment and will fall into
the category of portfolio investment and needs to be reported as part of the TIC system.
F. SECURITIES INVOLVED IN REPURCHASE AND SECURITIES LENDING ARRANGEMENTS
A repurchase agreement (repo) is an arrangement involving the sale of securities at a specified price with a
14
commitment to repurchase the same or similar securities at a specified price on a future date. A reverse repo is an
agreement whereby a security is purchased at a specified price with a commitment to resell the same or similar
securities at a specified price on a specified future date. Securities lending/borrowing arrangements are agreements
whereby the ownership of a security is transferred in return for collateral, usually another security or cash, under
condition that the security or similar security will revert to its original owner at a future date.
Securities "sold" by foreign residents under repurchase agreements or buy/sell back agreements, lent under
securities lending arrangements, or delivered out as collateral as part of a reverse repurchase agreement or security
borrowing agreement should be reported as if the securities were continuously held by the foreign resident. That is,
the security lender’s U.S. custodian should report the U.S. security as if no repurchase agreement or buy/sell back
agreement occurred.
Securities temporarily acquired by foreign residents as collateral under reverse repurchase agreements, securities
lending or borrowing arrangements, or buy/sell back agreements should NOT be reported. That is, the security
borrower’s U.S. custodian should exclude the U.S. security as if no resale agreement or buy/sell back agreement
occurred.
However, if cash was temporarily received as collateral and was used to purchase securities, those securities should
be reported.
G. STRIPPED SECURITIES
Separate Trading of Registered Interest and Principal Securities (STRIPS) and other similar instruments are
securities that have been transformed from a principal amount with periodic interest coupons into a series of zero-
coupon securities, with the range of maturities matching the coupon payment dates and the redemption date of the
principal amount.
The residency of the STRIPS and similar instruments is the residence of the entity that issued the stripped security.
However, the type of issuer of STRIPS and similar instruments is based upon the type of issuer of the underlying
security. For example, U.S. Treasury STRIPS should be classified as U.S. Treasury securities even though the
Treasury does not issue or sell STRIPS directly to investors. In addition, all ‘teddy bears’ (TBRs), ‘tigers’
(TIGRs), ‘cats’ (CATS) and ‘cougars’ (COUGRs) should also be classified as U.S. Treasury securities. Holdings of
TIPS and Floating Rate Notes should be reported at fair market value and should not include inflation accretion.
Foreign holdings of stripped securities where the underlying security is not an ABS, both the interest-only (IO)
component and the principal-only (PO) component, should be reported as security type = 10 (bond or note,

15
stripped).
Foreign holdings of stripped securities where the underlying security is an ABS, tranches of stripped ABS, any IO
component, and any PO component, should be reported as security type = 12 (asset-backed security).
H. U.S. GOVERNMENT AGENCIES OR FEDERALLY SPONSORED ENTERPRISES
Securities that are issued by U.S. government agencies or federally sponsored enterprises and owned by foreign
residents are reportable. In addition, foreign owned securities that are issued by a U.S.-resident entity and
guaranteed by U.S. government agencies or federally sponsored enterprises are reportable. For purposes of
Schedule 2, item 11 (type of issuer), all these securities should be coded as type 2 (agencies). For example,
securities that are guaranteed by the Government National Mortgage Association (GNMA) or the Small Business
Administration (SBA) should be reported as U.S. government agency securities.
I. DIRECT INVESTMENT
A direct investment relationship exists when a U.S. company owns 10% or more of the voting equity securities of
an incorporated foreign business (or an equivalent interest in an unincorporated foreign business, including a
branch), or when a foreign company owns 10% or more of the voting equity securities of an incorporated U.S.
business (or an equivalent interest in an unincorporated U.S. business, including a branch). Limited partners in a
limited partnership do not have voting rights and therefore cannot have direct investment. (See Section III.K) If a
direct investment relationship exists, then in general, all financial positions between the firms are considered direct
investment. If a direct investment relationship exists between non-banking entities, all securities held by the parent
entity that were issued by the affiliate of the parent are considered direct investment. However, if one of the entities
is a banking or securities brokerage firm, the inter-company holdings are considered direct investment only if they
provide permanent capital. Also, certain cross-border investments by or into private funds where these investments
do not involve operating companies (companies that are not other private funds or holding companies)should be
reported as portfolio investment on TIC reports rather than on BEA reports as direct Investment (see section III.F).
All holdings known to be direct investment should be excluded from TIC reports.
J. SECURITIES HELD BY U.S. CENTRAL SECURITIES DEPOSITORIES
U.S.-resident central securities depositories must report all U.S. securities they are holding in custody (or managing
the safekeeping of) directly on behalf of foreign residents, such as foreign-resident brokers and dealers who may be
members of the depository, or foreign-resident securities exchanges or depositories that have established direct
relationships with the U.S.-resident central securities depository.
16
U.S.-resident custodians should report all U.S. securities that are shown on their records as being owned by foreign
residents (or held in custody by its foreign-resident custodian) even if the safekeeping or settlement of the security
is done at a U.S.-resident central securities depository.
K. LIMITED PARTNERSHIPS
Foreign-resident limited partner ownership interests in U.S.-resident limited partnerships should be reported as
security type = 4 (All other equity). Limited partners’ ownership interests do not carry voting rights; therefore, all
ownership interests, even those greater than 10%, are reportable. The Number of Shares field on Schedule 2 (item
18) should be defaulted to the value reported in the US$ Fair Value field (item 16) because limited partnerships do
not issue shares.
General partner ownership interests may be considered to be direct investment, in which case such interests should
be excluded from this report (see Section III.I for a more complete definition of direct investment.)
L. ACCOUNTING RULES, VALUATION OF SECURITIES, AND CALCULATION OF U.S. DOLLAR
VALUES
Accounting Rules
All securities should be reported using settlement date accounting. Gross long positions should be reported. Do
not net any short positions from long positions. Do not enter decimals or negative values in any cells.
Valuation of Securities
Report the fair value of securities as of close of business on the last business day of June. The fair value follows the
definition under ASC 820 (formerly FAS 157). For coupon bonds, valuations should be based on “clean” prices,
that is, excluding accrued interest.
U.S.-resident custodians should, at a minimum, report the fair value to the extent that it is available as part of the
services provided to their customers, even if the price available is for a date prior to the last business day of June. If
there is doubt as to whether to report the available fair value or to report a fair value of zero, please contact FRBNY
report staff at 212-720-6300 or 646-720-6300.
For ABS, the value of the unpaid principal amount outstanding at close of business on the last business day of June
should be reported; if principal has been repaid, this value will not be the same as the original face value, revalued

17
at end-period market prices.
Foreign Currency Denominated Securities – CALCULATION OF U.S. DOLLAR VALUES
If the security is not denominated in U.S. dollars (US$) and a U.S. dollar fair value is not available in your system,
convert the foreign currency denominated fair value into US$ using the spot exchange rate as of the close of
business on the last business day of June. If you need assistance locating an exchange rate, please contact FRBNY
staff at 212-720-6300 or 646-720-6300.
If the exchange rate is normally quoted in units of foreign currency per US$, such as ¥105.75/US$, divide foreign
currency values by the foreign exchange rate to obtain the US$ values. For example, if the value of a U.S. security
issued in Japan is ¥ 200,000, and the exchange rate is ¥105.75/US$, divide ¥ 200,000 by 105.75 to obtain US$
1,891.
If the exchange rate is normally quoted in US$ per units of the foreign currency, such as US$1.75/UK£, multiply
foreign currency values by the US$ exchange rate value of the foreign currency to obtain the US$ values. For
example, if the value of a U.S. security issued in the United Kingdom is UK £1,000 and the exchange rate is
US$1.75/UK£, multiply UK £1,000 by 1.75 to obtain US$ 1,750.
M. DATA RETENTION PERIOD
All data used to create this report must be retained by the reporter for a period of 36 months from the date of the
report's submission.
N. REVIEW OF DATA AND REQUEST FOR REVISED DATA
Data submitted on the reporting schedules are reviewed by FRBNY staff. As a result of this review, the reporter
may be asked by FRBNY staff to provide supplemental information, including reasons for significant data changes
between reporting periods, or corrected data. In addition, FRBNY staff may request: (1) information to ensure that
all reportable U.S. securities have been reported; (2) information to ensure that all reported U.S. securities are
owned by foreign residents (or held by foreign-resident custodians or foreign-resident central securities
depositories); or (3) other information that helps to explain or corroborate the submitted data.
Reporters filing data on electronic media that are not formatted per the specifications in Appendix G will
be required to resubmit the data in the proper format.
18
Each quarter, FRBNY staff obtains a list of debt securities issued abroad by U.S. companies. Experience has shown
that most such issues are largely or completely foreign held. FRBNY staff will compare this information with the
reports submitted by U.S.-resident issuers of foreign placed debt securities to ensure that foreign-issued securities
are being properly reported. FRBNY will ask the issuers of such securities for additional information in cases of
apparent under- or over-reporting.

19
IV. LINE-BY-LINE INSTRUCTIONS FOR SCHEDULE 1- REPORTER CONTACT IDENTIFICATION
AND SUMMARY OF FINANCIAL INFORMATION
A Schedule 1 must be completed by all entities that receive this report booklet. This schedule is used to provide basic
identifying information and summaries of data reported on Schedule 2 records. Please type or print all information.
(Please enter your ten-digit Reporter Identification Number (RSSD) at the top of each page of Schedule 1.)
REPORTER CONTACT IDENTIFICATION AND SUMMARY OF FINANCIAL INFORMATION
1. Reporter Identification Number (RSSD) - Enter the ten-digit Reporter Identification Number that. If you do
not know the Reporter Identification Number for your entity, please contact FRBNY staff at 212-720-6300 or
646-720-6300.
2. Organization Name - Enter the full legal name of the reporting entity.
For items 3 through 6, enter reporting entity’s full mailing address.
7. Reporting Status - Select “1” only if your parent organization has received authorization to file an
unconsolidated report but you are exempt (meaning you have no reportable securities in custody or have not
issued any reportable securities). All other entities should select "2" and file the appropriate Schedule 2
records.
8. Reporter Type - Enter one of the following that best describes your organization (Refer to Appendix F -
Glossary for specific definition of reporters type)
1 = Depository Institution 4 = Insurance Company 7 = Foundation, Trust, or Estate 2 = Fund/Fund Manager/Sponsor 5 = Other Financial Organization 8 = Institution of Higher Learning (excluding a pension fund) (including BHC,FHC& IHC) (e.g., university) 3 = Pension Fund 6= Non-Financial Organization 9 = Other (not listed above)
9. Name of Contact - Enter the name of the person who will be the primary contact for this report and can
answer questions about the data reported.
10. For items 10 through 12, enter title, telephone number and email address of the contact identified in item 9.
13. Name of Service Provider or Vendor Used - If a service provider or vendor was used to prepare the data
reported, enter the name of the service provider.

20
14. Name of Technical Contact - Enter the name of a person who will serve as a contact should any technical
issues, such as incorrect file formats. If a service provider was used to prepare the data reported, the
technical contact may be a vendor employee.
15. For items 15 through 17, enter title, telephone number and email address of the contact identified in item 14.
18. Valuation Technique(s) Used to Determine Fair Value - For each reporting unit, describe the valuation
technique(s) used to calculate the reported fair values. If securities are automatically valued at zero after a
specified time period of inactivity, please specify the time period and whether this applies to the security or to
the client’s holdings of the security. Also, please specify how securities not actively traded on the report date
and those with internally generated security identification numbers are valued. If your organization has more
than four reporting units, please attach additional copies of Schedule 1, page 2, with item 18 completed.
SUMMARY OF SCHEDULE 2 INFORMATION
This section contains summary data for the information reported on Schedule 2 records.
19. Total Number of Schedule 2 Records Submitted - Enter the total number of Schedule 2 records
submitted.
20. Total U.S. $ Fair Value of All Equity Securities reported on Schedule 2 records - Enter the sum of the
U.S.$ fair value of all equity security records (records with Schedule 2, Item 18 = security types 1, 2, 3, or
4), rounded to the nearest U.S. dollar.
21. Total U.S. $ Fair Value of All Short-Term Debt Securities (excluding asset-backed securities) reported
on Schedule 2 records - Enter the sum of the U.S. $ fair value of all such security records (records with
Schedule 2, Item 19 = security types 5, 6, 7, 8, 9, 10, or 11), rounded to the nearest U.S. dollar.
22. Total U.S. $ Fair Value of All Long-Term Debt Securities (excluding asset-backed securities) reported
on Schedule 2 records - Enter the sum of the U.S. $ fair value of all such security records (records with
Schedule 2, Item 19 = security types 5, 6, 7, 8, 9, 10, or 11), rounded to the nearest U.S. dollar.
23. Total U.S. $ Fair Value of All Asset-Backed Securities reported on Schedule 2 records - Enter the sum
of the U.S. $ fair value of all such security records (records with Schedule 2, Item 20 = security type 12),
rounded to the nearest U.S. dollar.

21
CERTIFICATION INFORMATION
This section must be completed by all reporters.
By signing and dating the certification, the Certifier acknowledges that:
• He/she has read and understood the reporting requirements of this report;
• He/she is aware that both civil and criminal penalties may be imposed for filing a false report; and
• He/she is sufficiently knowledgeable about the activities and functions of this entity that he/she can
knowingly and with reasonable confidence certify that the information provided in this report is both
accurate and complete.
For items 24 through 28. Sign and date the form. Enter the name, job title, telephone number, and email address of
the person in your organization who certifies that the information provided is complete and accurate.
22
V. LINE-BY-LINE INSTRUCTIONS FOR SCHEDULE 2 - DETAILS OF SECURITIES
(Please enter your ten-digit Reporter Identification Number (RSSD) at the top of each page of Schedule 2.)
1. Reporter Identification Number (RSSD) - Enter the ten-digit Reporter Identification Number that is printed
on the mailing label on the report booklet. If you do not know the Reporter Identification Number for your
entity, please contact FRBNY staff at 212-720-6300 or 646-720-6300.
2. Sequence Number - Enter the sequence number of this record, right justified. The first record should be
assigned sequence number 1 and each subsequent Schedule 2 record should be sequentially numbered.
3. Reporting Unit Code - If data being submitted are collected from multiple databases or reporting systems,
please report an internal code that will enable you to identify the database or system from which the
information on this Schedule 2 came. This information will greatly reduce the costs of identifying and fixing
any reporting errors that may occur.
4. Name of Reporting Unit - Enter a description or name of the reporting unit or area that corresponds to the
code reported in item 3.
5. Reporting as - Enter "1" for issuer if your entity issued this security (even if you are also acting as the
custodian). Enter "2" if your entity did not issue this security.
6. Security ID - Enter the security ID code used to identify the security reported on this Schedule 2. CUSIP
codes are strongly preferred. If the CUSIP is not available, please try to provide the ISIN, CINS, Common
code or SEDOL. Do not use internally generated codes unless this security has not been assigned a code
by any recognized numbering agency (e.g., limited partnerships). Records for securities for which a portion
is restricted and a portion is not restricted should be reported with the numbering agency code assigned to the
unrestricted portion. If excessive internal codes are used, we may have to contact your institution to help
identify characteristics of certain individual securities. Please include the security ID’s check digit
and exclude any internal coding characters added to the CUSIP or other numbering agency code.
7. Security ID System - Select the appropriate number from the list shown on the form. For example, if the
security ID number entered in Item 6 is a CUSIP number, enter “1”; if it is a CINS, enter “3.” If the security
ID system used is not listed, enter a code of "7" (Other) and provide the name of the organization generating
the code in item 8.
23
8. Comment Line - If you entered a code of "7" (Other) in item 7 you must provide the name of the
organization generating the security ID code.
9. Security Description - Briefly describe the security, providing any relevant descriptive information available.
Ideally, this would include the type of security, the maturity date if debt or ABS, and: (a) for preferred stock
the annual dividend; (b) for debt securities, the interest rate; (c) for floating rate notes, how the interest rate is
calculated (e.g., Libor plus 1.5); and (d) for stripped securities the type of security/tranche. This information is
particularly important for securities with an internally generated or other security ID not generated by a
recognized numbering agency, (i.e., security ID system codes = 6 or 7).
10. Name of Issuer - Enter the name of the entity that issued the security. Please try to provide the full legal
name of the issuer. For branches of banks, please provide the location of the branch.
11. Type of Issuer –
• Enter “1” if the security was issued by the United States government or Federal Financing Bank.
• Enter “2” if the security was issued or guaranteed by a federal agency (e.g., Government National
Mortgage Association (GNMA)) or issued by or guaranteed by a federally sponsored enterprise (e.g.,
Federal National Mortgage Association (FNMA)). See Appendix H for a list of these entities.
• Enter "3" if the security was issued by a state or local government (e.g., New York State bonds).
• Enter "4" if the security was issued by a depository institution.
• Enter "5" if the security was issued by all other financial organizations (including BHC, FHC and
IHC)
• Enter "6" if the security was issued by a nonfinancial organization.
12. Security Type - Enter the security type code from the list below that most closely describes the type of security
being reported. (Refer to Appendix F - Glossary for specific definition of Security Type)
Equity Debt (excluding asset-backed securities) Asset-backed securities
1. Common stock 5. Commercial paper 9. Bond or note, unstripped 12. Asset-backed security 2. Preferred stock 6. Negotiable CD 10. Bond or note, stripped 3. Fund shares 7. Convertible debt security 11. All other debt 4. All other equity 8. Zero-coupon bond or note
Type 1 should be used to report all common stock, including restricted common shares.
Type 2 should be used to report all preferred stock, including participating preference shares,
nonparticipating preference shares, convertible preferred stock, and restricted preferred shares.
Type 3 should be used to report all shares of funds, including funds that invest primarily or exclusively in
money market instruments and in long-term debt, exchange traded funds, open-end and closed – end

24
mutual funds, and unit investment trusts. (See Section III.E)
Type 4 should be used to report all other types of equity, including foreign-resident limited partner
ownership of U.S.-resident limited partnerships and any other form of equity not specified in security
types 1, 2, and 3.
Type 5 should be used to report all commercial paper, including asset-backed commercial paper.
Type 6 should be used to report long-term and short-term negotiable certificates of deposits, including
negotiable bank notes and negotiable deposit notes issued by U.S. institutions, including U.S.
branches of U.S. or foreign banks. Non-negotiable certificates of deposit are not reportable.
Type 7 should be used to report all convertible debt securities, including convertible bonds and zero-
coupon convertible debt. However, non-convertible debt securities with embedded warrants or
options should be reported as either type 8 (if a zero-coupon bond or note) or type 9.
Type 8 should be used to report bonds and notes that do not provide interest payments, such as discount
notes. However: (1) zero-coupon convertible debt should be reported as type 7; (2) stripped non-
asset-backed securities, both the interest-only (IO) and principal-only (PO) components, should be
reported as type 10; (3) U.S. Treasury bills should be reported as type 11; and (4) stripped asset-
backed securities, the tranches, and the IO and PO components, should be reported as type 12.
Type 9 should be used to report bonds or notes that: (1) cannot be converted to equity securities, (2)
provide interest payments, (3) have not been stripped (i.e., not an IO or PO), and (4) do not give the
owner a claim against the cash flows generated by the underlying assets (i.e., ABS). These bonds
and notes are commonly referred to as “straight debt.”
Type 10 should be used to report all components of stripped securities, including the IO and PO
components. However, all tranches of stripped asset-backed securities should be reported as type
12.
Type 11 should include all debt other than asset-backed securities that is not covered in types 5-10,
including U.S. Treasury bills, TBRs, TIGRs, CATS, and COUGRs.
Type 12 should include only short-term and long-term securities that represent securitized interests in a
pool of assets and give the investor a claim against the cash flows generated by the underlying
assets. All tranches of stripped asset-backed securities, as well as unstripped asset-backed securities,
should be reported as type 12. Debt which is collateralized by assets (real or financial), but only
give the investor a claim against the underlying interest if the issuer defaults, should be reported as
types5-11, as appropriate.
13. Country of Residence of Foreign Holder - Enter the country code from Appendix C that corresponds to
the country of residence of the owner of the security. If the country of residence of the owner is not
known, report the country of residence of the foreign-resident custodian or foreign-resident central
securities depository. Positions of international and multinational regional organizations, whether located
in the United States or elsewhere, should be reported opposite the classification “International,” if
25
worldwide, or opposite the classifications “European,” “Latin American,” “Caribbean,” “Asian,”
“African,” or “Middle Eastern” regional organizations as indicated in Appendix D. If no country
information is available (as will often be the case with bearer bonds), enter code 88862. If an excessive
number of "country unknowns" is reported for securities other than bearer bonds, we will contact your
institution for further information.
14. Currency of Denomination - Enter the ISO code from Appendix E that corresponds to the currency in
which the security is denominated.
15. Type of Foreign Holder
• Enter "1" if the owner is an official institution (see Appendix C or D) even if the account is held in the
name of a foreign custodian or other foreign nominee.
• Enter “2” for all other owners, including personal trusts and other investment vehicles even if the
beneficial owner is an individual.
16. U.S. $ Fair Value- Enter the U.S. $ fair value of foreign-residents' ownership of this security, rounded to
the nearest U.S. dollar. (See Section III.L, Valuation of Securities, for more information on how to
calculate the fair value.)
17. Fair Value in Currency of Denomination - Enter the fair value of foreign-residents' ownership of this
security, rounded to the nearest currency unit. For ABS, the fair value should be calculated based on the
remaining principal outstanding (item 19) rather than the original face value. If the currency of issue is
US$, report the same value as in item 20. (See Section III.L, Valuation of Securities, for more information
on how to calculate the fair value.)
FOR EQUITY SECURITIES ONLY
18. Number of Shares - Enter the number of shares owned by foreigners, including fractional shares, rounded to
the nearest share. Wherever possible, combine partial shares with other ownership shares of the same security
to reduce reporting disparities introduced by rounding partial shares. Securities for which the amount foreign
owned is zero should not be reported.
FOR ALL DEBT SECURITIES (NON-ABS AND ABS)
19. Face Value or Remaining Principal in Currency of Denomination - Enter the face value held in the
currency of denomination, rounded to the nearest whole currency unit. If a security is traded in units, then

26
calculate the face value as: (face value of each unit) * (the number of units held) and report the result in this
field. Securities for which the amount held is zero should not be reported or Enter the remaining principal
outstanding as of June 30, in the currency of denomination, rounded to the nearest whole currency unit. This
will equal the original face value if no principal has been repaid. If a security is traded in units, then
calculate the remaining face value as: (remaining face value of each unit) * (the number of units held) and
report the result in this field. Securities for which the amount held is zero should not be reported.
FOR ASSET-BACKED SECURITIES ONLY
20. Original Face Value in Currency of Denomination - Enter the original face value owned by foreigners in the
currency of denomination, rounded to the nearest whole currency unit. This is the value that is (would have
been) outstanding if no principal has been (had been) repaid. If a security is traded in units, then calculate the
original face value as: (original face value of each unit) * (the number of units) and report the result in this field.
FOR ALL DEBT SECURITIES (NON-ASSET BACKED AND ASSET-BACKED SECURITIES)
21. Issue Date - Enter the issue date of this security in MMDDYYYY format. For example, if the security was
issued on October 4, 1985, enter 10041985. If there are multiple issue dates, enter the first such issue date.
22. Maturity Date - Enter the final maturity date (when all remaining principal and interest are due) of this
security in MMDDYYYY format. For example, if the security's final maturity date is January 5, 2010, enter
01052010.
27
APPENDIX A
SAMPLE REPORTING FORM SHL/SHLA
This form is also available separately at the following Treasury website:
https://www.treasury.gov/resource-center/data-chart-center/tic/Pages/forms-sh.aspx

Department of the Treasury OMB No. 1505-0123 Approval Expires 12/31/2017
.
Report of Foreign Holdings of U.S. Securities, Including Selected Money Market Instruments
(SHL(A))
SCHEDULE 1: REPORTER CONTACT IDENTIFICATION AND SUMMARY OF FINANCIAL INFORMATION
1. Reporter Identification Number (RSSD): …………………………………………….
2. Organization Name:
3. Street Address:
4. City: 5. State: 6. Zip Code:
7. Reporting Status:……………………………………..……..……………………………………………………………….
1 = Exempt - Under the exemption level 2 = Not Exempt - Schedule 2 records being submitted
8. Reporter Type:……………………..…………………………………………….……………….……….…………………
1 = Depository Institution 4 = Insurance Company 7 = Foundation, trust, estate 2 = Fund/Fund Manager/Sponsor
(excluding pension fund) 5 = Other Financial Organization
(including BHC, FHC, broker/dealers) 8 = Institution of higher learning
(e.g., university) 3 = Pension Fund 6 = Non-financial Organization 9 = Other (not listed above)
If you would like to provide more than one contact name, please attach additional copies of page 1, Schedule 1, with items 9 through 13 completed. Business Contact Information: 9. Name: __________________________________________________________________________________ 10. Title: __________________________________________________________________________________ 11. Telephone Number: ____________________________ 12. Email Address: ____________________________________________________________________________
13. Name of Service Provider or Vendor Used (if applicable): ___________________________________________
Technical Contact Information: 14. Name: __________________________________ 15. Title: ___________________________________________ 16. Telephone Number: ______________________ 17. Email Address: ___________________________________
SHL(A) Schedule 1, Page 1 of 3

Department of the Treasury OMB No. 1505-0123 Approval Expires 12/31/2017
Reporter Identification Number (RSSD):...……………………………………………….
18. Valuation Technique(s) Used to Determine Fair Values
For each reporting unit, please describe the valuation technique(s) used to determine reported fair values. If securities are automatically valued at zero after a specified time period of inactivity, please specify the time period and whether this applies to the security or to the client’s holdings of the security. Also, please specify how securities not actively traded on the report date and those with internally generated security identification numbers are valued.
Reporting Unit Valuation Description
SHL(A) Schedule 1, Page 2 of 3

Department of the Treasury OMB No. 1505-0123 Approval Expires 12/31/2017
Reporter Identification Number (RSSD)…………………………………………...……..
SUMMARY OF SCHEDULE 2 INFORMATION 19. Total Number of Schedule 2s Submitted……………………….…………………………….. , , 20. Total US$ Fair Value of All Equity Securities ………………. , , , , Reported on Schedule 2(s) 21. Total US$ Fair Value of All Short-Term Debt Securities… , , , , (excluding asset-backed securities) Reported on Schedule 2(s) 22. Total US$ Fair Value of All Long-Term Debt Securities…. , , , , (excluding asset-backed securities) Reported on Schedule 2(s) 23. Total US$ Fair Value of All Asset-Backed………………. , , , , Securities Reported on Schedule 2(s)
CERTIFICATION INFORMATION
By signing the certification below you acknowledge that: You have read and understood the reporting requirements of this report; You are aware that both civil and criminal penalties may be imposed for filing a false report; and You are sufficiently knowledgeable about the activities and functions of your organization that you can knowingly and
with reasonable confidence certify that the information provided in this report is both accurate and complete.
Certifier's Signature: 24. Date Signed:
25. Certifier's Name:
26. Certifier's Title:
27. Certifier's Telephone Number:
28. Certifier's Email Address:
SHL(A) Schedule 1, Page 3 of 3

Department of the Treasury OMB No. 1505-0123 Approval Expires 12/31/2017
…
….
….
…
…
…
…
…
SCHEDULE 2: DETAILS OF SECURITIES 1. Reporter Identification Number (RSSD):……………….……………………..………… 2. Sequence Number: …………………………………………………………………………..…… , , , , 3. Reporting Unit:……………………………………………………………..………….………….…………..……….. 4. Name of Reporting Unit: ____________________________________________________________________________ 5. Reporting As: …………………………………………………………………………………………………………...… 1 = Issuer 2 = Custodian
6. Security ID………………………………………………………………………
7. Security ID System: ………………………………….………………………………………………………………..…..
1 = CUSIP 2 = ISIN 3 = CINS 4 = Common Code 5 = SEDOL 6 = Internally Generated 7 = Other (provide answer to 8)
8. For code of Other (7) enter the name of the organization or system that assigned the Security ID:
9. Security Description:
10. Name of Issuer:
11. Type of Issuer: ……………………………………………………………………………………………………………
1 = United States Treasury and Federal Financing Bank 4 = Depository institution 2 = Federal agency or federally sponsored enterprise 5 = Other financial organization (including BHC, FHC, broker/dealer) 3 = State or local government, including their subdivisions 6 = Nonfinancial organization
12. Security Type: …………………………………..……………………………………………………………………
Equities Debt (excluding asset-backed securities) Asset-Backed Securities
1 = Common stock 5 = Commercial paper 9 = Bond or note, unstripped 12 = Asset-backed security 2 = Preferred stock 6 = Negotiable CD 10 = Bond or note, stripped 3 = Fund shares 7 = Convertible debt security 11 = All other debt 4 = All other equity 8 = Zero-coupon bond or note
13. Country of Residence of Foreign Holder: (Refer to Appendix C)………………………………………
14. Currency of Denomination: (Refer to Appendix E)………………………………………………………………
15. Type of Foreign Holder: (Refer to Appendix C and D) ……………………………………………………………..…..
1 = Official 2 = Other
SHL(A) Schedule 2, Page 1 of 2

Department of the Treasury OMB No. 1505-0123 Approval Expires 12/31/2017 Reporter Identification Number (RSSD): …………………………………………….……… 16. US$ Fair Value of Security:….………………….………………………… … … , , ,
17. Fair Value of Security in the Currency of Denomination:…………………… , , ,
(Security Types 1, 2, 3 or 4)
18. Number of Shares:………………………………………………………….…. , , ,
FOR ALL DEBT SECURITIES (NON-ASSET-BACKED AND ASSET-BACKED SECURITIES)
(Security Types 5, 6, 7, 8, 9, 10, 11, or 12) 19. Face Value (for non-ABS) or Remaining Principal Outstanding (for ABS) in the Currency of Denomination: ……………….…………………..… , , , , , ,
(Security Type 12) 20. Original Face Value in the Currency of Denomination: ……………….…….. , , ,
(Security Types 5, 6, 7, 8, 9, 10, 11, or 12) 21. Issue Date: (MMDDYYYY)…………………………………………………………………… 22. Maturity Date: (MMDDYYYY)…………………….………………………………………….
SHL(A) Schedule 2, Page 2 of 2
FOR EQUITIES ONLY
FOR ASSET-BACKED SECURITIES ONLY
FOR ALL DEBT SECURITIES (NON-ASSET-BACKED AND ASSET-BACKED SECURITIES)

28
APPENDIX B - FLOWCHARTS SHOWING REPORTING RESPONSIBILITY
A. FLOWCHART FOR U.S.-RESIDENT CUSTODIANS (all securities, including all book-
entry securities held at a U.S.-resident central securities depository)
1. A foreign-resident investor or custodian uses U.S.-resident custodian to hold U.S. securities for its account and the U.S.-resident custodian does not use a U.S. resident sub-custodian.
Foreign-resident owner
or Foreign-resident
custodian
U.S.-resident
custodian
U.S.-resident central securities depository
Reports on Schedule 2 Reports only if no U.S.-resident custodian is used
2. A foreign-resident investor or custodian uses U.S.-resident custodian to hold U.S. securities for its account and the U.S.-resident custodian uses a U.S. resident sub-custodian.
Foreign-resident owner
or Foreign-resident
custodian
U.S.-resident
custodian
U.S.-resident sub-custodian
Reports on Schedule 2 if they don’t fully disclose the client information to the sub-custodian
Reports on Schedule 2 if they know the foreign client
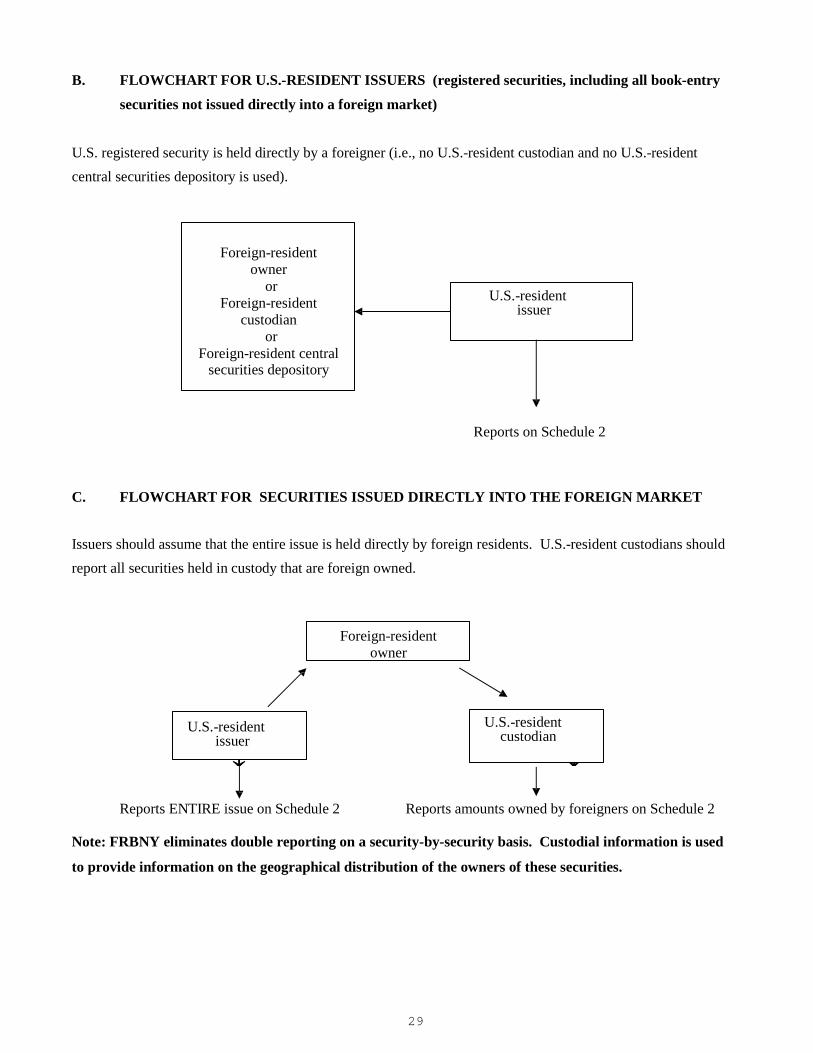
29
↓
↓
B. FLOWCHART FOR U.S.-RESIDENT ISSUERS (registered securities, including all book-entry securities not issued directly into a foreign market)
U.S. registered security is held directly by a foreigner (i.e., no U.S.-resident custodian and no U.S.-resident central securities depository is used).
Foreign-resident owner
or Foreign-resident
custodian or
Foreign-resident central securities depository
U.S.-resident
issuer
Reports on Schedule 2
C. FLOWCHART FOR SECURITIES ISSUED DIRECTLY INTO THE FOREIGN MARKET
Issuers should assume that the entire issue is held directly by foreign residents. U.S.-resident custodians should report all securities held in custody that are foreign owned.
Foreign-resident owner
U.S.-resident issuer
U.S.-resident custodian
Reports ENTIRE issue on Schedule 2 Reports amounts owned by foreigners on Schedule 2
Note: FRBNY eliminates double reporting on a security-by-security basis. Custodial information is used
to provide information on the geographical distribution of the owners of these securities.

30
FLOWCHART FOR DETERMINING REPORTABLE SECURITIES
Is this an equity security, a debt security (including
ABS), or a reportable money market instrument?
Do not report non- securities such as
NO derivatives, loans, and non- negotiable deposits.
YES Is this security
issued by a U.S. resident?
(See Note)
Do not report securities issued by foreign residents,
NO including foreign branches and subsidiaries of U.S. entities.
YES
YES
Is the owner of the
U.S. security a foreign resident?
Do not report U.S. securities owned
NO by U.S. residents because this investment does not represent a cross-border investment.
If a U.S. equity security, does the investment NO
represent less than 10% of the issuer’s voting equity?
YES
This security is reportable. Please refer to Flowcharts A through C to determine who is responsible for reporting detailed Schedule 2 data.
In most cases, do not report investments that represent 10% or more of the issuer’s voting equity, i.e., direct investments. (See Section III.I for a complete definition of direct investment.)
Note: Depositary receipts/shares backed by foreign securities are considered “foreign.” In addition, all securities issued by the multinational organizations listed in Appendix Dare considered foreign.

31
APPENDIX C DEPARTMENT OF THE TREASURY
GEOGRAPHICAL CLASSIFICATION CODES FOR COUNTRIES, AREAS & INTERNATIONAL/REGIONAL ORGANIZATIONS
TO BE USED FOR PURPOSES OF REPORTING ON TREASURY INTERNATIONAL CAPITAL FORMS
The most recent version of this appendix is now a separate document. A copy is in Column A on the Treasury website at:
https://www.treasury.gov/resource-center/data-chart-center/tic/Pages/foihome.aspx

32
APPENDIX D DEPARTMENT OF THE TREASURY
CERTAIN FOREIGN INSTITUTIONS CLASSIFIED AS OFFICIAL, A LIST TO BE USED ONLY FOR PURPOSES OF REPORTING ON
TREASURY INTERNATIONAL CAPITAL (TIC) FORMS
The most recent version of this appendix is now a separate document. A copy is in column B on the Treasury website at:
https://www.treasury.gov/resource-center/data-chart-center/tic/Pages/foihome.aspx

33
APPENDIX E: LIST OF CURRENCY CODES
Code Currency Code Currency AFN Afghan Afghani CYP Cypriot Pound ALL Albanian Lek CZK Czech Koruna DZD Algerian Dinar DKK Danish Krone ADP Andorran Peseta DJF Djiboutian Franc AOA Angolan Kwanza DOP Dominican Peso ARS Argentine Peso XCD East Caribbean Dollar AMD Armenian Dram EGP Egyptian Pound AWG Aruban Guilder SVC Salvador Colon AUD Australian Dollar ERN Eritrean Nakfa AZN Azerbaijani Manat EEK Estonian Kroon BSD Bahamian Dollar ETB Ethiopian Birr BHD Bahraini Dinar EUR Euro BDT Bangladeshi Taka FKP Falkland Islands Pound BBD Barbadian Dollar FJD Fijian Dollar BYR Belarusian Ruble GMD Gambian Dalasi BZD Belizian Dollar GEL Georgian Lari BMD Bermudian Dollar GHS Ghanaian Cedi BTN Bhutanese Ngultrum GIP Gibraltar Pound BOB Bolivian Boliviano GTQ Guatemalan Quetzal BWP Botswana Pula GWP Guinea-Bissau Peso BAM Bosnia & Herzegovina GNF Guinean Franc Convertible Mark GYD Guyana Dollar BRL Brazilian Real HTG Hatian Gourde BND Bruneian Dollar HNL Honduran Lempira BGN Bulgarian Lev HKD Hong Kong Dollar BIF Burundian Franc HUF Hungarian Forint KHR Cambodian Riel ISK Icelandic Krona CAD Canadian Dollar INR Indian Rupee CVE Cape Verdean Escudo IDR Indonesian Rupiah KYD Cayman Islands Dollar IRR Iranian Rial XOF CFA Franc BCEAO IQD Iraqi Dinar XAF CFA Franc BEAC JMD Jamaican Dollar XPF CFP Franc JPY Japanese Yen CLP Chilean Peso JOD Jordanian Dinar CNY Chinese Yuan Renminbi KZT Kazakhstani Tenge COP Colombian Peso KES Kenyan Shilling KMF Comorian Franc KWD Kuwaiti Dinar CDF Congolese Franc KGS Kyrgyzstani Som CRC Costa Rican Colon LAK Laotian Kip HRK Croatian Kuna LVL Latvian Lats CUP Cuban Peso
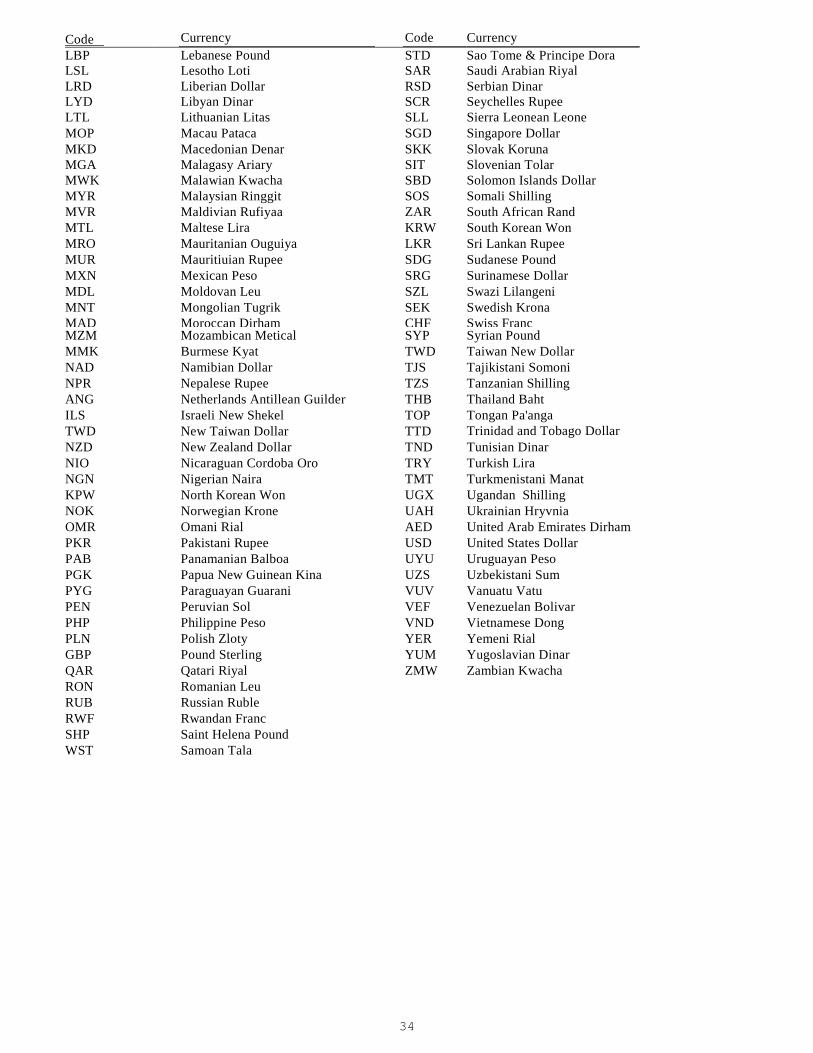
34
Code Currency Code Currency LBP Lebanese Pound STD Sao Tome & Principe Dora LSL Lesotho Loti SAR Saudi Arabian Riyal LRD Liberian Dollar RSD Serbian Dinar LYD Libyan Dinar SCR Seychelles Rupee LTL Lithuanian Litas SLL Sierra Leonean Leone MOP Macau Pataca SGD Singapore Dollar MKD Macedonian Denar SKK Slovak Koruna MGA Malagasy Ariary SIT Slovenian Tolar MWK Malawian Kwacha SBD Solomon Islands Dollar MYR Malaysian Ringgit SOS Somali Shilling MVR Maldivian Rufiyaa ZAR South African Rand MTL Maltese Lira KRW South Korean Won MRO Mauritanian Ouguiya LKR Sri Lankan Rupee MUR Mauritiuian Rupee SDG Sudanese Pound MXN Mexican Peso SRG Surinamese Dollar MDL Moldovan Leu SZL Swazi Lilangeni MNT Mongolian Tugrik SEK Swedish Krona MAD Moroccan Dirham CHF Swiss Franc MZM Mozambican Metical SYP Syrian Pound MMK Burmese Kyat TWD Taiwan New Dollar NAD Namibian Dollar TJS Tajikistani Somoni NPR Nepalese Rupee TZS Tanzanian Shilling ANG Netherlands Antillean Guilder THB Thailand Baht ILS Israeli New Shekel TOP Tongan Pa'anga TWD New Taiwan Dollar TTD Trinidad and Tobago Dollar
NZD New Zealand Dollar TND Tunisian Dinar NIO Nicaraguan Cordoba Oro TRY Turkish Lira NGN Nigerian Naira TMT Turkmenistani Manat KPW North Korean Won UGX Ugandan Shilling NOK Norwegian Krone UAH Ukrainian Hryvnia OMR Omani Rial AED United Arab Emirates Dirham PKR Pakistani Rupee USD United States Dollar PAB Panamanian Balboa UYU Uruguayan Peso PGK Papua New Guinean Kina UZS Uzbekistani Sum PYG Paraguayan Guarani VUV Vanuatu Vatu PEN Peruvian Sol VEF Venezuelan Bolivar PHP Philippine Peso VND Vietnamese Dong PLN Polish Zloty YER Yemeni Rial GBP Pound Sterling YUM Yugoslavian Dinar QAR Qatari Riyal ZMW Zambian Kwacha RON Romanian Leu RUB Russian Ruble RWF Rwandan Franc SHP Saint Helena Pound WST Samoan Tala

35
APPENDIX – F
GLOSSARY
The most recent version of this appendix is now a separate document.
A copy is on the TIC website at:
http://ticdata.treasury.gov/Publish/ticglossary-june2014.pdf

36
APPENDIX – G
Technical Information for Electronic Submission
The instruction guide on how to submit through Reporting Central can be found at the link below:
https://www.frbservices.org/files/reporting/pdf/external_user_guide.pdf
APPENDIX – H

37
LIST OF FEDERAL AGENCIES AND FEDERALLY SPONSORED ENTERPRISES
A. U.S. FEDERAL GOVERNMENT AGENCIES and CORPORATIONS
Architect of the Capital Commodity Credit Corporation (CCC) Department of Agriculture, including former Rural Electrification Administration (REA), and
former Farmers Housing Administration (FmHA). Department of Defense and Military Services (e.g. Air Force) Department of Housing and Urban Development (HUD) Department of Interior Export-Import Bank of the United States (Ex-Im Bank) Federal Communication Commission (FCC) Farm Credit System Financial Assistance Corporation (FCSFAC) Federal Deposit Insurance Corporation (FDIC), including FSLIC Resolution Fund Federal Housing Administration (FHA) Financing Corporation (FICO) General Services Administration (GSA) Government National Mortgage Association (GNMA or Ginnie Mae) Maritime Administration National Archives and Records Administration (NARA) National Consumer Cooperative Bank Overseas Private Investment Corporation (OPIC) Resolution Funding Corporation (REFCORP) Rural Telephone Bank Small Business Administration (SBA) Tennessee Valley Authority (TVA), including lease obligations Washington Metropolitan Area Transit Authority (WMATA)
B. FEDERALLY SPONSORED ENTERPRISES
Farm Credit System: Agricultural Credit Bank (ACB) Farm Credit Banks (FCB)
Federal Agricultural Mortgage Corporation (FAMC or Farmer Mac) Federal Home Loan Banks (FHLB) Federal Home Loan Mortgage Corporation (FHLMC or Freddie Mac) Federal National Mortgage Association (FNMA or Fannie Mae)
Recommended


![PUBLISH] - United States Courtsmedia.ca11.uscourts.gov/opinions/pub/files/200010510.OPN.pdffiled u.s. court of appeals eleventh circuit mar 22, 2001 thomas k. kahn clerk [publish]in](https://img.pdfslide.us/doc/110x75/5b0384277f8b9a6c0b8c6f09/publish-united-states-us-court-of-appeals-eleventh-circuit-mar-22-2001-thomas.jpg)