U.S. energy-by-rail data methodology
December 2018
Independent Statistics & Analysis
www.eia.gov
U.S. Department of Energy
Washington, DC 20585

December 2018
U.S. Energy Information Administration | U.S. energy-by-rail data methodology
This report was prepared by the U.S. Energy Information Administration (EIA), the statistical and analytical agency within the U.S. Department of Energy. By law, EIA’s data, analyses, and forecasts are independent of approval by any other officer or employee of the United States Government. The views in this report therefore should not be construed as representing those of the U.S. Department of Energy or other federal agencies.
December 2018
U.S. Energy Information Administration | U.S. energy-by-rail data methodology i
Table of Contents Introduction .................................................................................................................................................. 1
Overview of methodology ............................................................................................................................ 2
Sources of data and methods ....................................................................................................................... 4
Carload waybill sample data .................................................................................................................... 4
Converting to barrels ............................................................................................................................... 5
Crude oil ............................................................................................................................................ 5
Ethanol, biodiesel, asphalt, and petroleum coke .............................................................................. 7
Hydrocarbon gas liquids .................................................................................................................... 7
Near-month estimates ........................................................................................................................... 13
PSM revision schedule ........................................................................................................................... 14
Illustrative energy-by-rail calculations ........................................................................................................ 15
Glossary of terms ........................................................................................................................................ 17
December 2018
U.S. Energy Information Administration | U.S. energy-by-rail data methodology ii
Figures Figure 1. Petroleum Administration for Defense District map ..................................................................... 1 Figure 2. EIA's energy-by-rail data process for products except HGL integrates multiple data streams ..... 2 Figure 3. EIA's HGL-by-rail data process mirrors other energy-by-rail processes but adds product apportionment .............................................................................................................................................. 3 Figure 4. EIA refining district map ................................................................................................................. 9
Tables Table 1. Calculation of the EIA reporting period........................................................................................... 5 Table 2. Standard Transportation Commodity Codes used in EIA rail data .................................................. 6 Table 3. Illustrative example of PADD-to-PADD carload weight calculation ................................................ 7 Table 4. HGL weight-to-volume conversion factors ..................................................................................... 7 Table 5. HGL STCCs and allocations .............................................................................................................. 8 Table 6. Illustrative allocation for butane/butylene mix .............................................................................. 9 Table 7. Station type assignments used for LPG rail movement-allocation ............................................... 10 Table 8. Illustrative allocation for import/export terminal......................................................................... 11 Table 9. Illustrative allocation for a petrochemical facility ......................................................................... 11 Table 10. Illustrative allocation for a refinery as an origin ......................................................................... 11 Table 11. Illustrative allocation example for a refinery as a termination ................................................... 12 Table 12. Illustrative allocation for a gas plant and fractionator as an origin ............................................ 13 Table 13. Illustrative allocation example for HGL storage terminals .......................................................... 13 Table 14. Illustrative calculation from a waybill sample ............................................................................. 15 Table 15. Converting carloads to barrels of crude oil in any quarter ......................................................... 16 Table 16. Choosing near-month estimate models ...................................................................................... 16
September 2018
U.S. Energy Information Administration | U.S. energy-by-rail data methodology 1
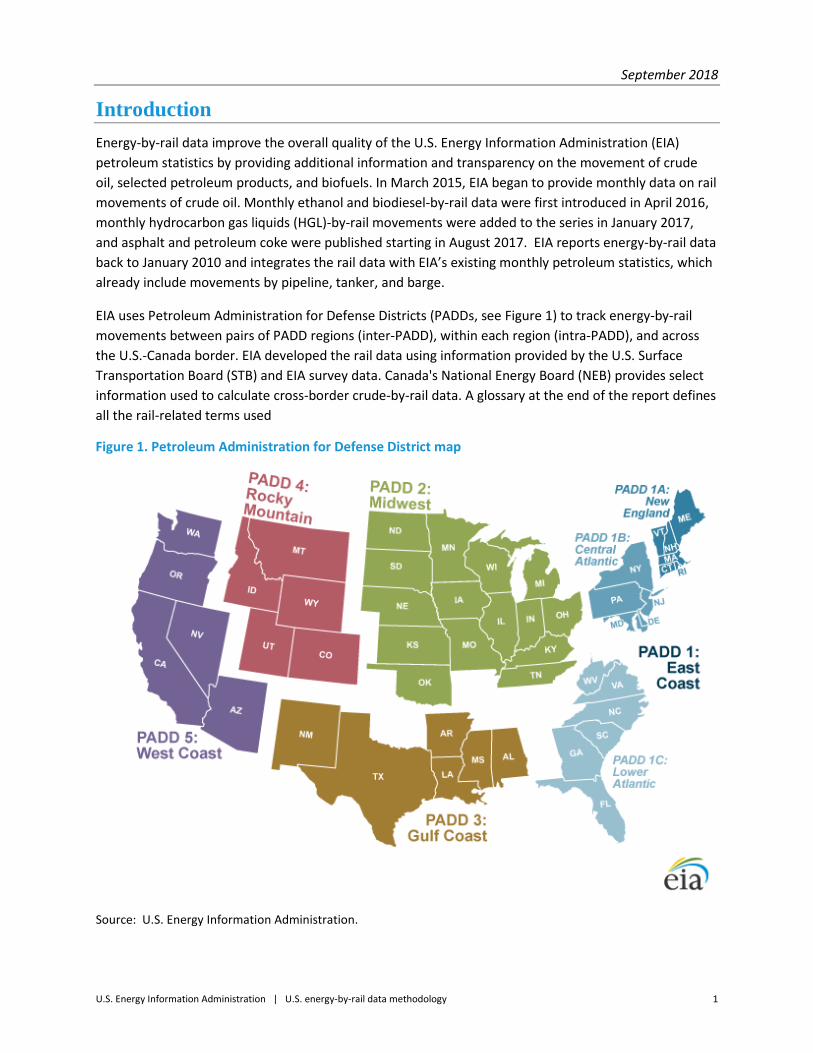
Introduction Energy-by-rail data improve the overall quality of the U.S. Energy Information Administration (EIA) petroleum statistics by providing additional information and transparency on the movement of crude oil, selected petroleum products, and biofuels. In March 2015, EIA began to provide monthly data on rail movements of crude oil. Monthly ethanol and biodiesel-by-rail data were first introduced in April 2016, monthly hydrocarbon gas liquids (HGL)-by-rail movements were added to the series in January 2017, and asphalt and petroleum coke were published starting in August 2017. EIA reports energy-by-rail data back to January 2010 and integrates the rail data with EIA’s existing monthly petroleum statistics, which already include movements by pipeline, tanker, and barge.
EIA uses Petroleum Administration for Defense Districts (PADDs, see Figure 1) to track energy-by-rail movements between pairs of PADD regions (inter-PADD), within each region (intra-PADD), and across the U.S.-Canada border. EIA developed the rail data using information provided by the U.S. Surface Transportation Board (STB) and EIA survey data. Canada's National Energy Board (NEB) provides select information used to calculate cross-border crude-by-rail data. A glossary at the end of the report defines all the rail-related terms used
Figure 1. Petroleum Administration for Defense District map
Source: U.S. Energy Information Administration.
September 2018
U.S. Energy Information Administration | U.S. energy-by-rail data methodology 2
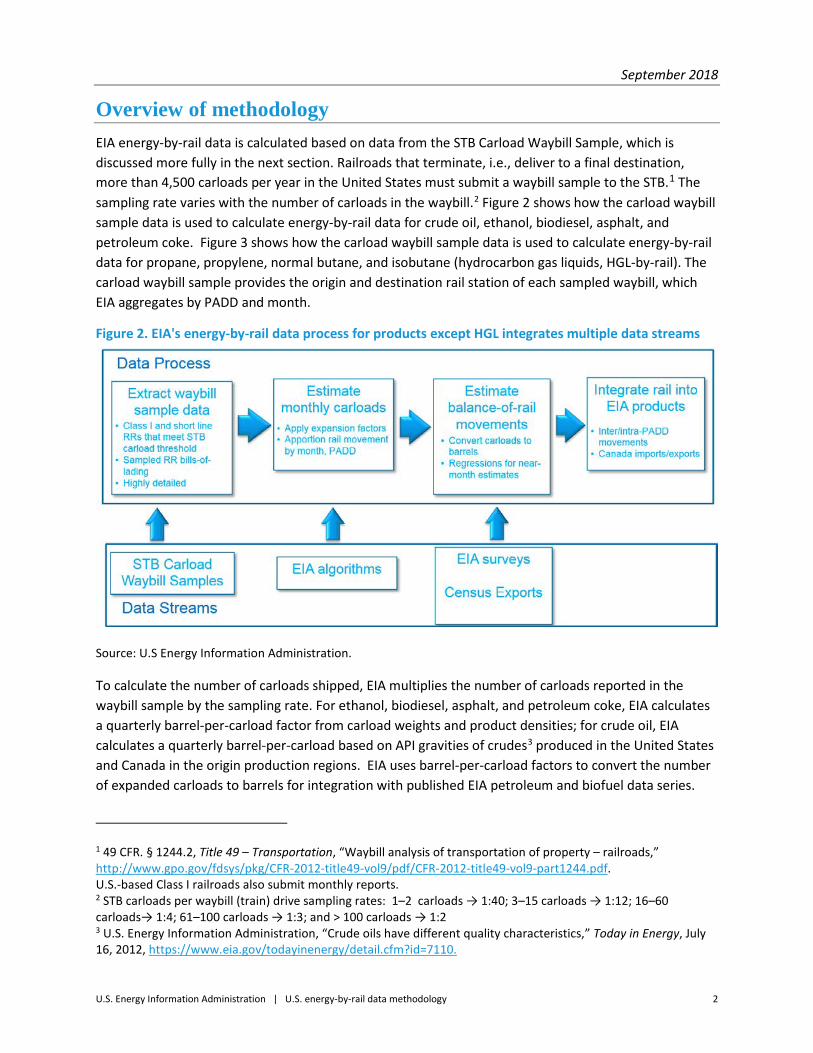
Overview of methodology EIA energy-by-rail data is calculated based on data from the STB Carload Waybill Sample, which is discussed more fully in the next section. Railroads that terminate, i.e., deliver to a final destination, more than 4,500 carloads per year in the United States must submit a waybill sample to the STB.1 The sampling rate varies with the number of carloads in the waybill.2 Figure 2 shows how the carload waybill sample data is used to calculate energy-by-rail data for crude oil, ethanol, biodiesel, asphalt, and petroleum coke. Figure 3 shows how the carload waybill sample data is used to calculate energy-by-rail data for propane, propylene, normal butane, and isobutane (hydrocarbon gas liquids, HGL-by-rail). The carload waybill sample provides the origin and destination rail station of each sampled waybill, which EIA aggregates by PADD and month.
Figure 2. EIA's energy-by-rail data process for products except HGL integrates multiple data streams
Source: U.S Energy Information Administration.
To calculate the number of carloads shipped, EIA multiplies the number of carloads reported in the waybill sample by the sampling rate. For ethanol, biodiesel, asphalt, and petroleum coke, EIA calculates a quarterly barrel-per-carload factor from carload weights and product densities; for crude oil, EIA calculates a quarterly barrel-per-carload based on API gravities of crudes3 produced in the United States and Canada in the origin production regions. EIA uses barrel-per-carload factors to convert the number of expanded carloads to barrels for integration with published EIA petroleum and biofuel data series.
1 49 CFR. § 1244.2, Title 49 – Transportation, “Waybill analysis of transportation of property – railroads,” http://www.gpo.gov/fdsys/pkg/CFR-2012-title49-vol9/pdf/CFR-2012-title49-vol9-part1244.pdf. U.S.-based Class I railroads also submit monthly reports. 2 STB carloads per waybill (train) drive sampling rates: 1–2 carloads → 1:40; 3–15 carloads → 1:12; 16–60 carloads→ 1:4; 61–100 carloads → 1:3; and > 100 carloads → 1:2 3 U.S. Energy Information Administration, “Crude oils have different quality characteristics,” Today in Energy, July 16, 2012, https://www.eia.gov/todayinenergy/detail.cfm?id=7110.
September 2018
U.S. Energy Information Administration | U.S. energy-by-rail data methodology 3
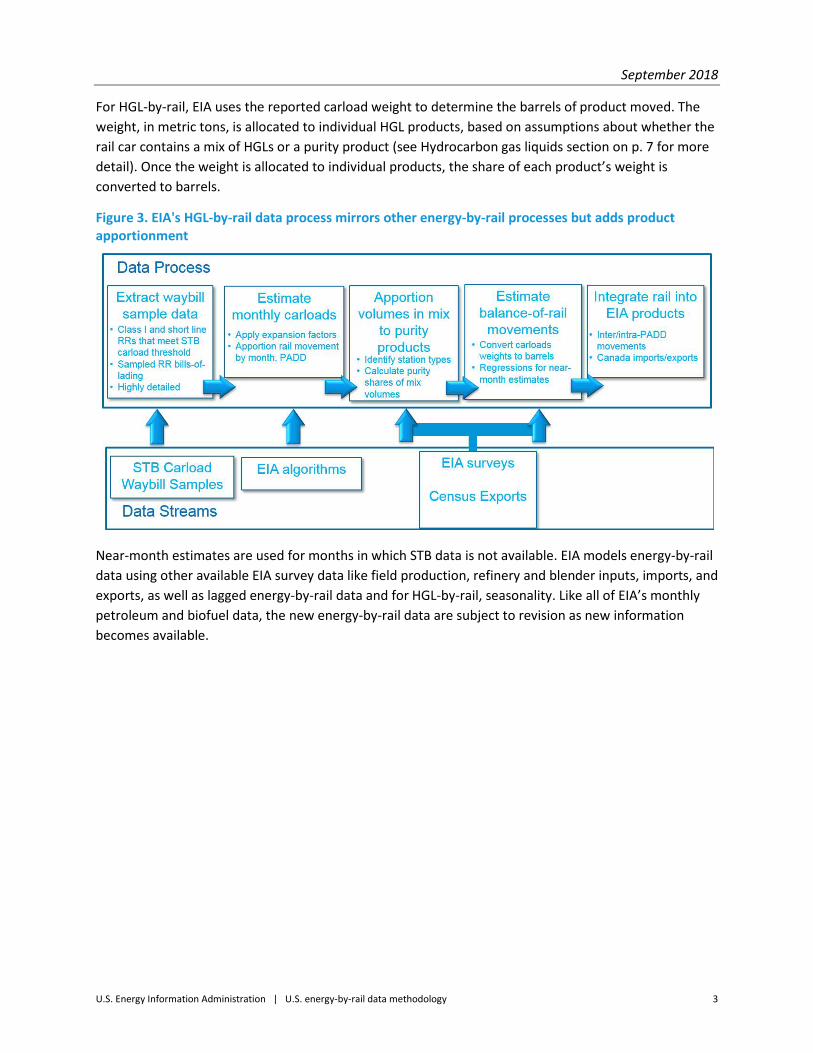
For HGL-by-rail, EIA uses the reported carload weight to determine the barrels of product moved. The weight, in metric tons, is allocated to individual HGL products, based on assumptions about whether the rail car contains a mix of HGLs or a purity product (see Hydrocarbon gas liquids section on p. 7 for more detail). Once the weight is allocated to individual products, the share of each product’s weight is converted to barrels.
Figure 3. EIA's HGL-by-rail data process mirrors other energy-by-rail processes but adds product apportionment
Near-month estimates are used for months in which STB data is not available. EIA models energy-by-rail data using other available EIA survey data like field production, refinery and blender inputs, imports, and exports, as well as lagged energy-by-rail data and for HGL-by-rail, seasonality. Like all of EIA’s monthly petroleum and biofuel data, the new energy-by-rail data are subject to revision as new information becomes available.
September 2018
U.S. Energy Information Administration | U.S. energy-by-rail data methodology 4
Sources of data and methods
Carload waybill sample data
STB provides a stratified carload waybill sample on a monthly, quarterly, and annual basis to EIA under a special confidential waybill agreement for specific Standard Transportation Commodity Codes (STCC). The carload waybill sample consists of waybills submitted by railroads annually terminating 4,500 or more revenue carloads passing through the United States.4
The carload waybill sample includes waybills for both hazardous material (hazmat) and non-hazmat STCCs at the 7-digit level. Release of the annual waybill sample can be delayed up to one year beyond the accounting period, but the quarterly and monthly waybill samples are both available with an approximate two-month lag after the end of the accounting period. The monthly waybill sample is not complete for the first two months in a given calendar quarter; the first two months’ sample does not include waybills from some Class II and Class III railroads. 5
Each railroad selects its own systematic sample of waybills, and waybills for larger shipments are sampled with greater frequency. Sampling rates range from 1:2 for 101+ carload unit train shipments to 1:40 for single-carload manifest shipments. Railroads provide 192 fields of data6 to the STB in the annual carload waybill sample. Of interest to EIA, regardless of the time frequency of the waybill, are the waybill date, the number of carloads, the sampling rate, the carload weight, the origin and destination of the shipment, and any interchange of the shipment between railroads.
EIA does not use the sample accounting periods identified by the railroads because they do not always align with the waybill dates, e.g., some Class I railroads have bundled all quarterly transactions in the third month of a quarterly accounting period, and other railroads have sampled waybills that appear in accounting periods two-to-five months following the waybill date. EIA calculates an “EIA reporting period” from the waybill date, adding a number of days that vary by the type of train,7 commodity carried, and number of railroads involved in the movement, as shown in Table 1. Energy-by-rail movements can involve multiple waybills and railroads, such as Rule 11 transactions involving the transfer of cars in the Chicago area.8 The time to complete a transaction increases with the number of
4 49 CFR. § 1244.2, Title 49 – Transportation, “Waybill analysis of transportation of property – railroads,” http://www.gpo.gov/fdsys/pkg/CFR-2012-title49-vol9/pdf/CFR-2012-title49-vol9-part1244.pdf. 5 The seven Class I railroads are Burlington Northern Santa Fe (BNSF), CSX, Kansas City Southern (KCS), Norfolk Southern (NS), Union Pacific (UP), Canadian National (CN), and Canadian Pacific (CP). All other railroads are either Class II or Class III. 6 Surface Transportation Board, 2015 Surface Transportation Board Carload Waybill Sample Reference Guide, September 1, 2017, https://www.stb.gov/stb/docs/Waybill/2015%20STB%20Waybill%20Reference%20Guide.pdf. 7 Unit trains are composed of 80 or more like cars hauling a single bulk commodity, while manifest trains are composed of mixed rail cars (i.e., tank cars, boxcars) carrying multiple commodities. 8 Rule 11 is an accounting rule governing shipments involving two or more railroads in which each railroad submits its own waybill for the same shipment. See Association of American Railroads, Railway Accounting Rules, https://www.railinc.com/rportal/documents/18/260749/RAR.pdf for background.
September 2018
U.S. Energy Information Administration | U.S. energy-by-rail data methodology 5
railroads involved in a single movement. The “EIA reporting period” month is used to aggregate the energy-by-rail data.
Table 1. Calculation of the EIA reporting period
Commodity Number of railroads involved in waybill
Number of days added to the waybill date by train type
Unit Manifest Crude Oil, Asphalt, Petroleum Coke
1 4 12 2+ 6 16
Ethanol, Biodiesel, Hydrocarbon gas liquids
1 6 14 2+ 8 18
Source: U.S. Energy Information Administration.
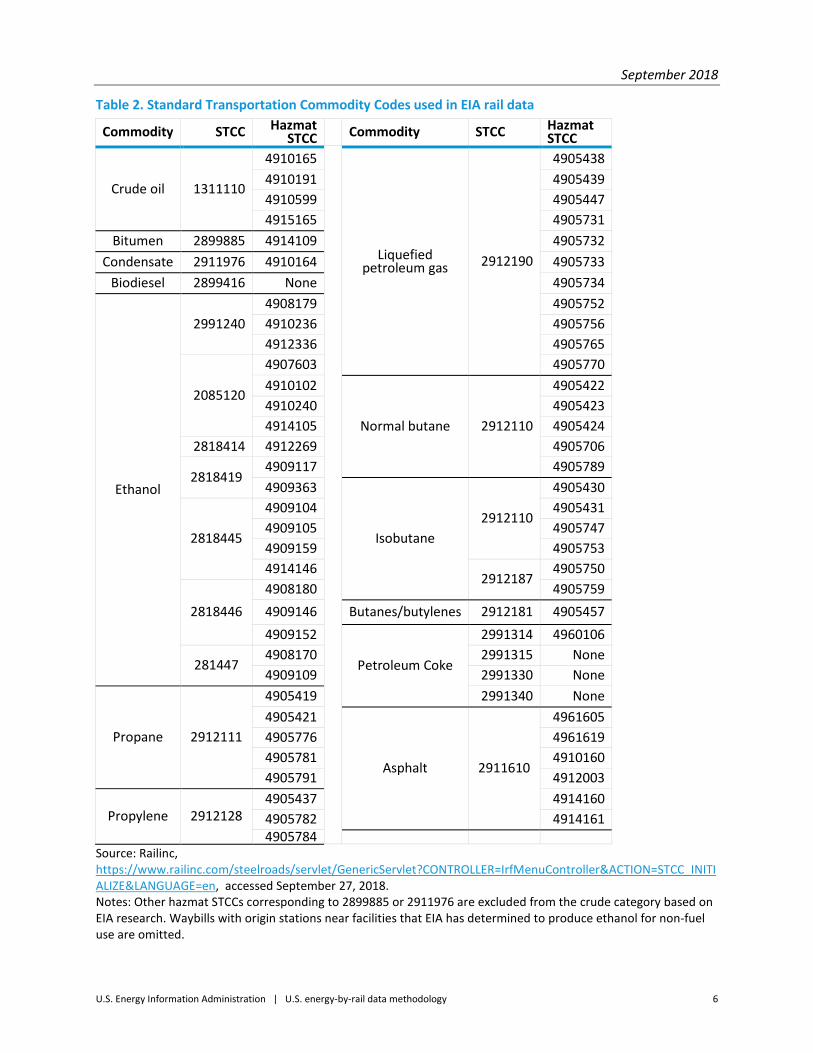
Table 2 shows the STCCs that EIA currently uses to calculate movements of petroleum, biofuels, and HGL. Because STCCs used by the railroads can change without notice, the table is subject to revision. Bitumen and condensate are included in the crude-by-rail data. Volumes moved under Liquefied petroleum gas and Butanes/butylenes mix commodity codes may represent purity HGL products or mixes of HGL products, and are subject to allocations by purity product, as explained in the Hydrocarbon gas liquids section.
Converting to barrels
Crude oil
API gravity is a measure of how heavy or light a petroleum liquid is compared with water. If its API gravity is greater than 10, a liquid is lighter than water and floats; if its API gravity is less than 10, it is heavier than water and sinks. Even though API gravity is an inverse measure of the relative density of a petroleum liquid with respect to the density of water, it is used to compare the relative densities of petroleum liquids. For data from 2015 to the present, EIA uses the volume-weighted mid-point of the API gravity9 aggregated by PADD from the EIA-914 and the car weights found in the carload waybill sample data to convert carloads to barrels for U.S.-originated crude-by-rail movements. For data from 2010-2014, EIA uses crude production estimates from the National Energy Modeling System/Oil and Gas Supply Module (OGSM) by OGSM regions as defined in the Annual Energy Outlook, Appendix F, 10 combined with a representative API gravity for each crude type to calculate barrel-per-car averages by quarter and originating PADD.
9 API gravity table for data entry on new EIA-914 form, Monthly Crude Oil, Lease Condensate, and Natural Gas Production Report, section 4.1, page 9, http://www.eia.gov/survey/form/eia_914/form.pdf, is reported monthly on http://www.eia.gov/petroleum/production/. 10 U.S. Energy Information Administration, Annual Energy Outlook 2015, April 2015, http://www.eia.gov/forecasts/aeo/pdf/0383%282015%29.pdf.
September 2018
U.S. Energy Information Administration | U.S. energy-by-rail data methodology 6
Table 2. Standard Transportation Commodity Codes used in EIA rail data
Commodity STCC Hazmat STCC Commodity STCC Hazmat
STCC
Crude oil 1311110
4910165
Liquefied petroleum gas 2912190
4905438 4910191 4905439 4910599 4905447 4915165 4905731
Bitumen 2899885 4914109 4905732 Condensate 2911976 4910164 4905733
Biodiesel 2899416 None 4905734
Ethanol
2991240 4908179 4905752 4910236 4905756 4912336 4905765
2085120
4907603 4905770 4910102
Normal butane 2912110
4905422 4910240 4905423 4914105 4905424
2818414 4912269 4905706
2818419 4909117 4905789 4909363
Isobutane 2912110
4905430
2818445
4909104 4905431 4909105 4905747 4909159 4905753 4914146
2912187 4905750
2818446 4908180 4905759 4909146 Butanes/butylenes 2912181 4905457 4909152
Petroleum Coke
2991314 4960106
281447 4908170 2991315 None 4909109 2991330 None
Propane 2912111
4905419 2991340 None 4905421
Asphalt 2911610
4961605 4905776 4961619 4905781 4910160 4905791 4912003
Propylene 2912128 4905437 4914160 4905782 4914161 4905784
Source: Railinc, https://www.railinc.com/steelroads/servlet/GenericServlet?CONTROLLER=IrfMenuController&ACTION=STCC_INITIALIZE&LANGUAGE=en, accessed September 27, 2018. Notes: Other hazmat STCCs corresponding to 2899885 or 2911976 are excluded from the crude category based on EIA research. Waybills with origin stations near facilities that EIA has determined to produce ethanol for non-fuel use are omitted.
September 2018
U.S. Energy Information Administration | U.S. energy-by-rail data methodology 7
EIA’s approach is different for Canadian-originating carloads. The National Energy Board (NEB) of Canada regulates the export of crude oil and petroleum products and requires export orders or licenses for these commodities leaving Canada. Holders of export authorizations report monthly on their export activities to NEB, indicating the mode of transport – rail or pipeline. The aggregated export data are publicly available on a monthly basis from 2012, but by special agreement between NEB and EIA, unpublished details such as API gravity, province of origin, and destination are shared. EIA calculates barrel-per-car averages by quarter for Canadian exports based on NEB data, which are used to convert Canadian-originating carloads to barrels.
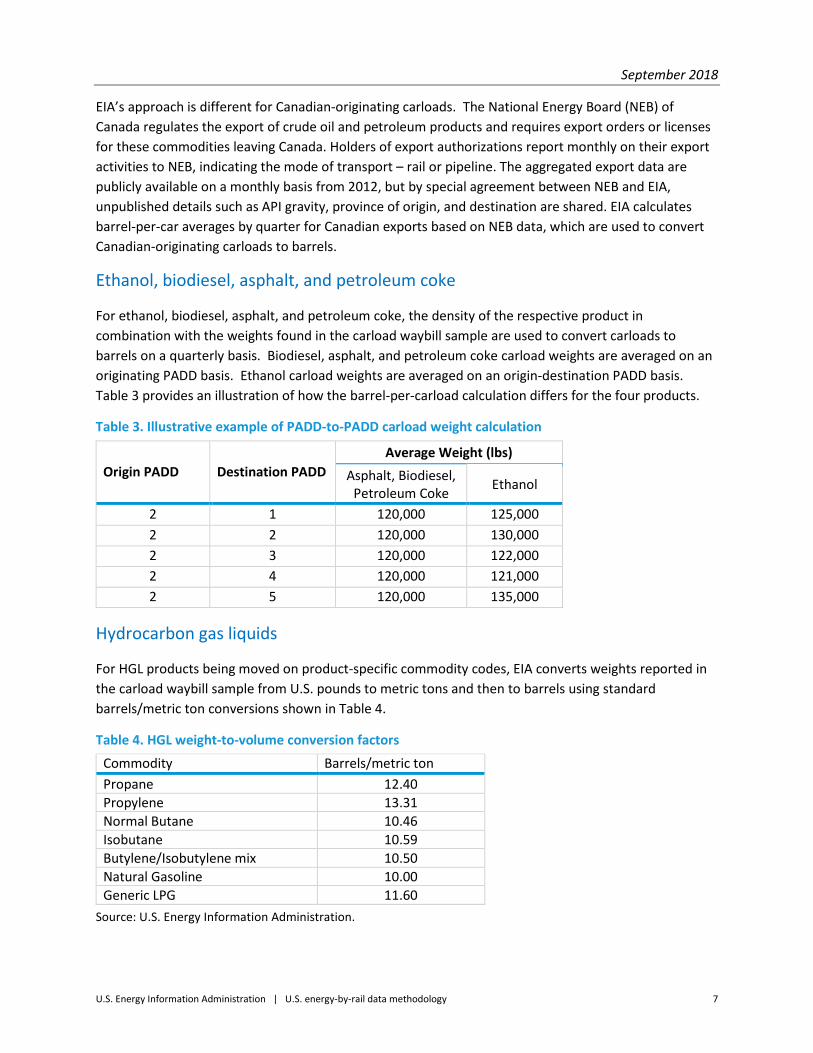
Ethanol, biodiesel, asphalt, and petroleum coke
For ethanol, biodiesel, asphalt, and petroleum coke, the density of the respective product in combination with the weights found in the carload waybill sample are used to convert carloads to barrels on a quarterly basis. Biodiesel, asphalt, and petroleum coke carload weights are averaged on an originating PADD basis. Ethanol carload weights are averaged on an origin-destination PADD basis. Table 3 provides an illustration of how the barrel-per-carload calculation differs for the four products.
Table 3. Illustrative example of PADD-to-PADD carload weight calculation
Origin PADD Destination PADD Average Weight (lbs)
Asphalt, Biodiesel, Petroleum Coke Ethanol
2 1 120,000 125,000 2 2 120,000 130,000 2 3 120,000 122,000 2 4 120,000 121,000 2 5 120,000 135,000
Hydrocarbon gas liquids
For HGL products being moved on product-specific commodity codes, EIA converts weights reported in the carload waybill sample from U.S. pounds to metric tons and then to barrels using standard barrels/metric ton conversions shown in Table 4.
Table 4. HGL weight-to-volume conversion factors
Commodity Barrels/metric ton Propane 12.40 Propylene 13.31 Normal Butane 10.46 Isobutane 10.59 Butylene/Isobutylene mix 10.50 Natural Gasoline 10.00 Generic LPG 11.60
Source: U.S. Energy Information Administration.
September 2018
U.S. Energy Information Administration | U.S. energy-by-rail data methodology 8
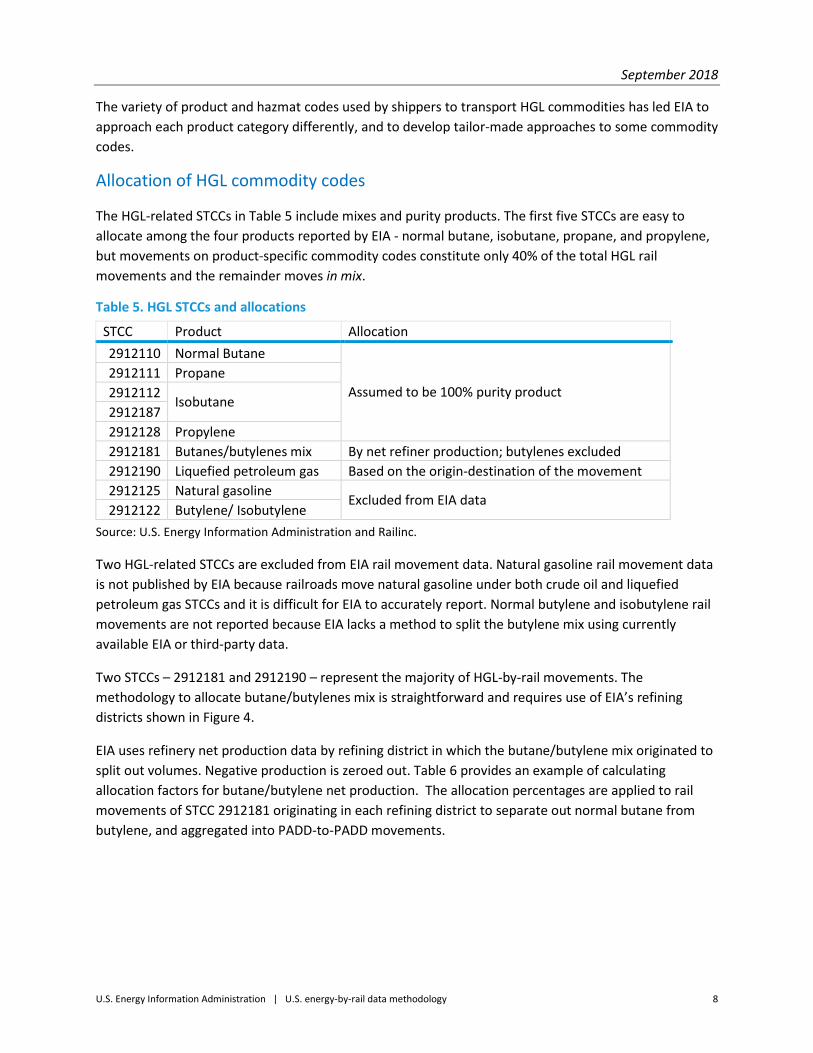
The variety of product and hazmat codes used by shippers to transport HGL commodities has led EIA to approach each product category differently, and to develop tailor-made approaches to some commodity codes.
Allocation of HGL commodity codes
The HGL-related STCCs in Table 5 include mixes and purity products. The first five STCCs are easy to allocate among the four products reported by EIA - normal butane, isobutane, propane, and propylene, but movements on product-specific commodity codes constitute only 40% of the total HGL rail movements and the remainder moves in mix.
Table 5. HGL STCCs and allocations
STCC Product Allocation 2912110 Normal Butane
Assumed to be 100% purity product 2912111 Propane 2912112 Isobutane 2912187 2912128 Propylene 2912181 Butanes/butylenes mix By net refiner production; butylenes excluded 2912190 Liquefied petroleum gas Based on the origin-destination of the movement 2912125 Natural gasoline
Excluded from EIA data 2912122 Butylene/ Isobutylene
Source: U.S. Energy Information Administration and Railinc.
Two HGL-related STCCs are excluded from EIA rail movement data. Natural gasoline rail movement data is not published by EIA because railroads move natural gasoline under both crude oil and liquefied petroleum gas STCCs and it is difficult for EIA to accurately report. Normal butylene and isobutylene rail movements are not reported because EIA lacks a method to split the butylene mix using currently available EIA or third-party data.
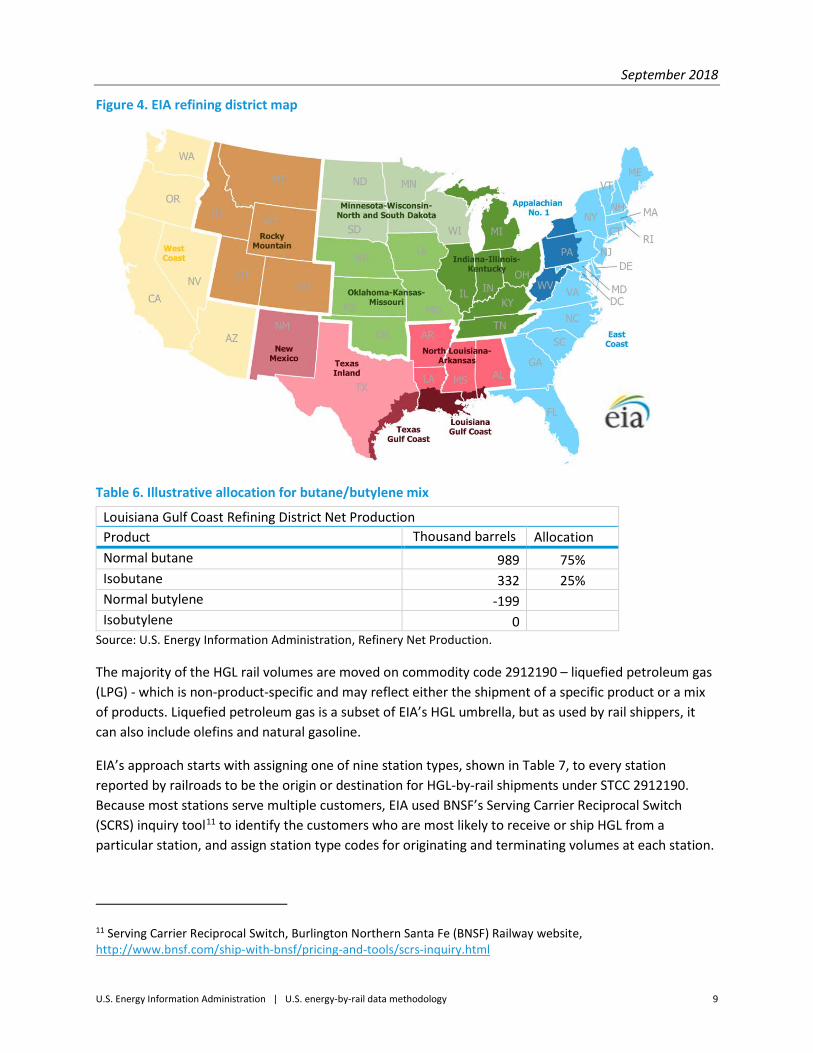
Two STCCs – 2912181 and 2912190 – represent the majority of HGL-by-rail movements. The methodology to allocate butane/butylenes mix is straightforward and requires use of EIA’s refining districts shown in Figure 4.
EIA uses refinery net production data by refining district in which the butane/butylene mix originated to split out volumes. Negative production is zeroed out. Table 6 provides an example of calculating allocation factors for butane/butylene net production. The allocation percentages are applied to rail movements of STCC 2912181 originating in each refining district to separate out normal butane from butylene, and aggregated into PADD-to-PADD movements.
September 2018
U.S. Energy Information Administration | U.S. energy-by-rail data methodology 9
Figure 4. EIA refining district map
Table 6. Illustrative allocation for butane/butylene mix
Louisiana Gulf Coast Refining District Net Production Product Thousand barrels Allocation Normal butane 989 75% Isobutane 332 25% Normal butylene -199 Isobutylene 0
Source: U.S. Energy Information Administration, Refinery Net Production.
The majority of the HGL rail volumes are moved on commodity code 2912190 – liquefied petroleum gas (LPG) - which is non-product-specific and may reflect either the shipment of a specific product or a mix of products. Liquefied petroleum gas is a subset of EIA’s HGL umbrella, but as used by rail shippers, it can also include olefins and natural gasoline.
EIA’s approach starts with assigning one of nine station types, shown in Table 7, to every station reported by railroads to be the origin or destination for HGL-by-rail shipments under STCC 2912190. Because most stations serve multiple customers, EIA used BNSF’s Serving Carrier Reciprocal Switch (SCRS) inquiry tool11 to identify the customers who are most likely to receive or ship HGL from a particular station, and assign station type codes for originating and terminating volumes at each station.
11 Serving Carrier Reciprocal Switch, Burlington Northern Santa Fe (BNSF) Railway website, http://www.bnsf.com/ship-with-bnsf/pricing-and-tools/scrs-inquiry.html
September 2018
U.S. Energy Information Administration | U.S. energy-by-rail data methodology 10
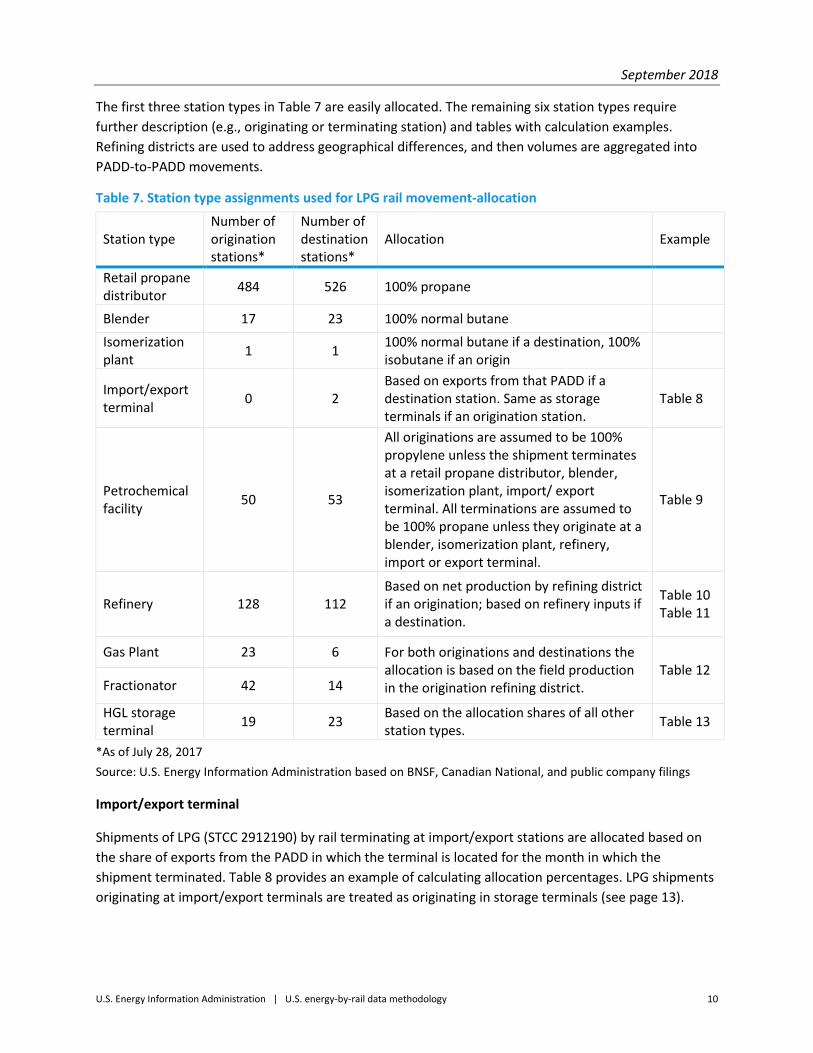
The first three station types in Table 7 are easily allocated. The remaining six station types require further description (e.g., originating or terminating station) and tables with calculation examples. Refining districts are used to address geographical differences, and then volumes are aggregated into PADD-to-PADD movements.
Table 7. Station type assignments used for LPG rail movement-allocation
Station type Number of origination stations*
Number of destination stations*
Allocation Example
Retail propane distributor 484 526 100% propane
Blender 17 23 100% normal butane Isomerization plant 1 1 100% normal butane if a destination, 100%
isobutane if an origin
Import/export terminal 0 2
Based on exports from that PADD if a destination station. Same as storage terminals if an origination station.
Table 8
Petrochemical facility 50 53
All originations are assumed to be 100% propylene unless the shipment terminates at a retail propane distributor, blender, isomerization plant, import/ export terminal. All terminations are assumed to be 100% propane unless they originate at a blender, isomerization plant, refinery, import or export terminal.
Table 9
Refinery 128 112 Based on net production by refining district if an origination; based on refinery inputs if a destination.
Table 10 Table 11
Gas Plant 23 6 For both originations and destinations the allocation is based on the field production in the origination refining district.
Table 12 Fractionator 42 14
HGL storage terminal 19 23 Based on the allocation shares of all other
station types. Table 13
*As of July 28, 2017 Source: U.S. Energy Information Administration based on BNSF, Canadian National, and public company filings
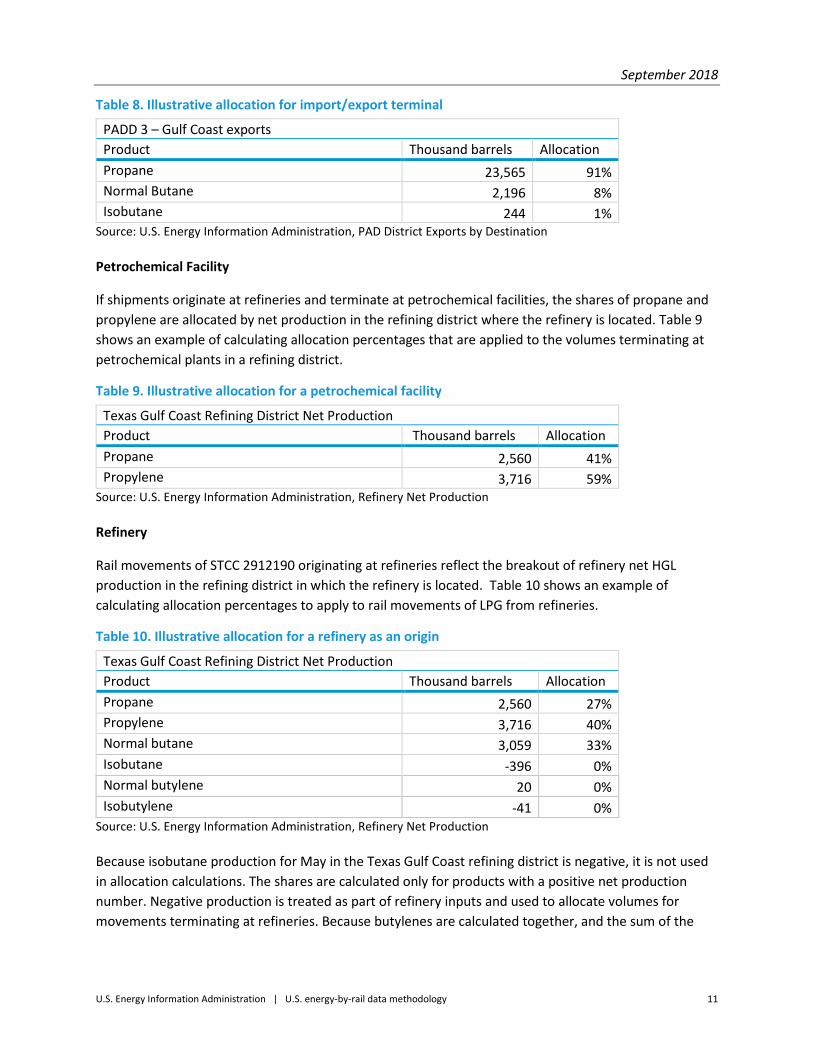
Import/export terminal
Shipments of LPG (STCC 2912190) by rail terminating at import/export stations are allocated based on the share of exports from the PADD in which the terminal is located for the month in which the shipment terminated. Table 8 provides an example of calculating allocation percentages. LPG shipments originating at import/export terminals are treated as originating in storage terminals (see page 13).
September 2018
U.S. Energy Information Administration | U.S. energy-by-rail data methodology 11
Table 8. Illustrative allocation for import/export terminal
PADD 3 – Gulf Coast exports Product Thousand barrels Allocation Propane 23,565 91% Normal Butane 2,196 8% Isobutane 244 1%
Source: U.S. Energy Information Administration, PAD District Exports by Destination
Petrochemical Facility
If shipments originate at refineries and terminate at petrochemical facilities, the shares of propane and propylene are allocated by net production in the refining district where the refinery is located. Table 9 shows an example of calculating allocation percentages that are applied to the volumes terminating at petrochemical plants in a refining district.
Table 9. Illustrative allocation for a petrochemical facility
Texas Gulf Coast Refining District Net Production Product Thousand barrels Allocation Propane 2,560 41% Propylene 3,716 59%
Source: U.S. Energy Information Administration, Refinery Net Production
Refinery
Rail movements of STCC 2912190 originating at refineries reflect the breakout of refinery net HGL production in the refining district in which the refinery is located. Table 10 shows an example of calculating allocation percentages to apply to rail movements of LPG from refineries.
Table 10. Illustrative allocation for a refinery as an origin
Texas Gulf Coast Refining District Net Production Product Thousand barrels Allocation Propane 2,560 27% Propylene 3,716 40% Normal butane 3,059 33% Isobutane -396 0% Normal butylene 20 0% Isobutylene -41 0%
Source: U.S. Energy Information Administration, Refinery Net Production
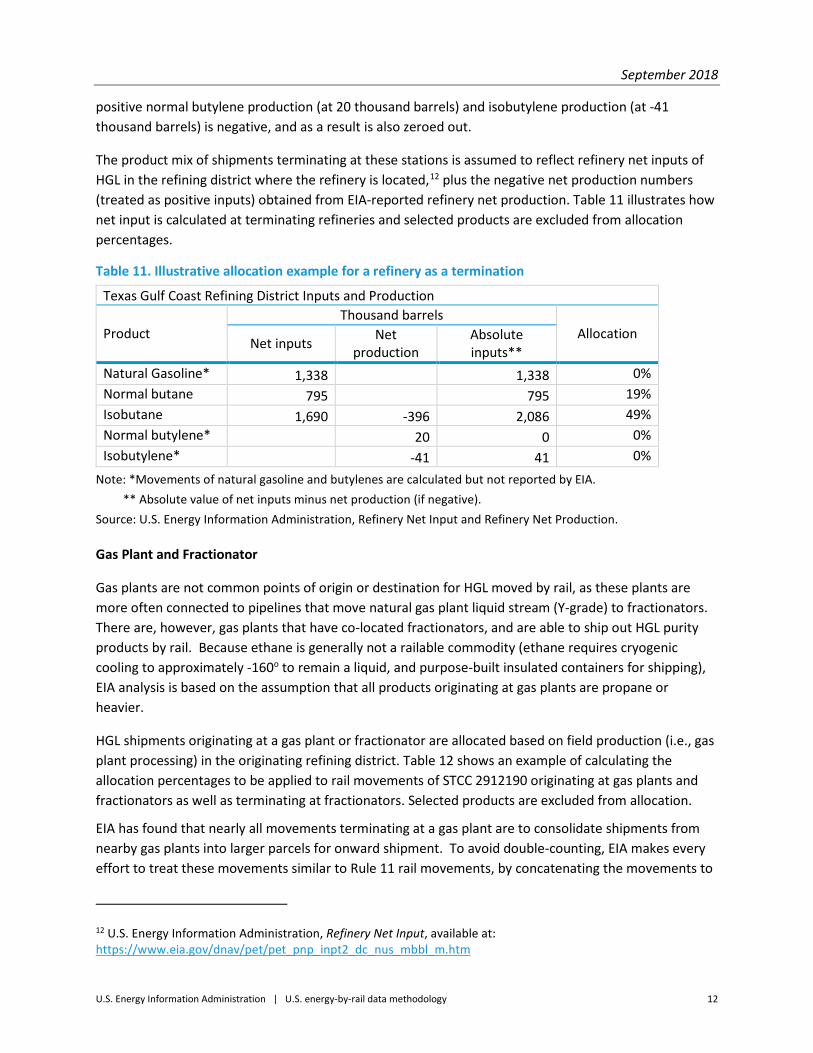
Because isobutane production for May in the Texas Gulf Coast refining district is negative, it is not used in allocation calculations. The shares are calculated only for products with a positive net production number. Negative production is treated as part of refinery inputs and used to allocate volumes for movements terminating at refineries. Because butylenes are calculated together, and the sum of the
September 2018
U.S. Energy Information Administration | U.S. energy-by-rail data methodology 12
positive normal butylene production (at 20 thousand barrels) and isobutylene production (at -41 thousand barrels) is negative, and as a result is also zeroed out.
The product mix of shipments terminating at these stations is assumed to reflect refinery net inputs of HGL in the refining district where the refinery is located,12 plus the negative net production numbers (treated as positive inputs) obtained from EIA-reported refinery net production. Table 11 illustrates how net input is calculated at terminating refineries and selected products are excluded from allocation percentages.
Table 11. Illustrative allocation example for a refinery as a termination
Texas Gulf Coast Refining District Inputs and Production
Product Thousand barrels
Allocation Net inputs Net
production Absolute inputs**
Natural Gasoline* 1,338 1,338 0% Normal butane 795 795 19% Isobutane 1,690 -396 2,086 49% Normal butylene* 20 0 0% Isobutylene* -41 41 0%
Note: *Movements of natural gasoline and butylenes are calculated but not reported by EIA. ** Absolute value of net inputs minus net production (if negative). Source: U.S. Energy Information Administration, Refinery Net Input and Refinery Net Production.
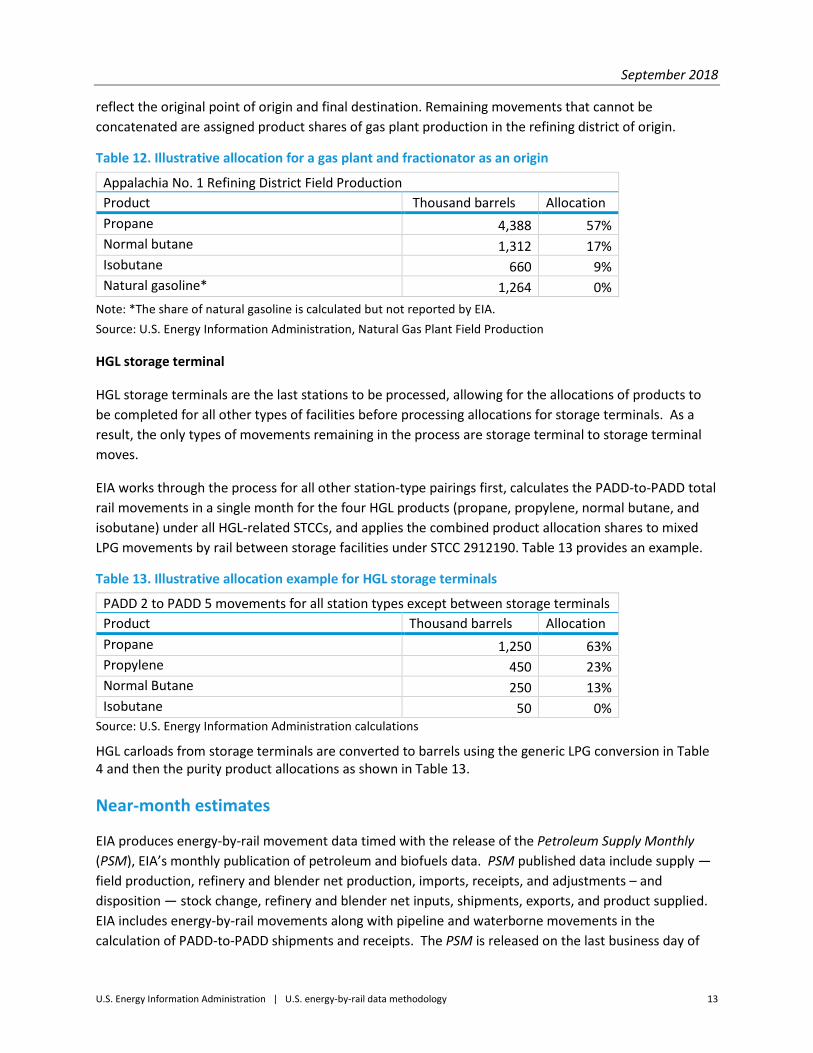
Gas Plant and Fractionator
Gas plants are not common points of origin or destination for HGL moved by rail, as these plants are more often connected to pipelines that move natural gas plant liquid stream (Y-grade) to fractionators. There are, however, gas plants that have co-located fractionators, and are able to ship out HGL purity products by rail. Because ethane is generally not a railable commodity (ethane requires cryogenic cooling to approximately -160o to remain a liquid, and purpose-built insulated containers for shipping), EIA analysis is based on the assumption that all products originating at gas plants are propane or heavier.
HGL shipments originating at a gas plant or fractionator are allocated based on field production (i.e., gas plant processing) in the originating refining district. Table 12 shows an example of calculating the allocation percentages to be applied to rail movements of STCC 2912190 originating at gas plants and fractionators as well as terminating at fractionators. Selected products are excluded from allocation.
EIA has found that nearly all movements terminating at a gas plant are to consolidate shipments from nearby gas plants into larger parcels for onward shipment. To avoid double-counting, EIA makes every effort to treat these movements similar to Rule 11 rail movements, by concatenating the movements to
12 U.S. Energy Information Administration, Refinery Net Input, available at: https://www.eia.gov/dnav/pet/pet_pnp_inpt2_dc_nus_mbbl_m.htm
September 2018
U.S. Energy Information Administration | U.S. energy-by-rail data methodology 13
reflect the original point of origin and final destination. Remaining movements that cannot be concatenated are assigned product shares of gas plant production in the refining district of origin.
Table 12. Illustrative allocation for a gas plant and fractionator as an origin
Appalachia No. 1 Refining District Field Production Product Thousand barrels Allocation Propane 4,388 57% Normal butane 1,312 17% Isobutane 660 9% Natural gasoline* 1,264 0%
Note: *The share of natural gasoline is calculated but not reported by EIA. Source: U.S. Energy Information Administration, Natural Gas Plant Field Production
HGL storage terminal
HGL storage terminals are the last stations to be processed, allowing for the allocations of products to be completed for all other types of facilities before processing allocations for storage terminals. As a result, the only types of movements remaining in the process are storage terminal to storage terminal moves.
EIA works through the process for all other station-type pairings first, calculates the PADD-to-PADD total rail movements in a single month for the four HGL products (propane, propylene, normal butane, and isobutane) under all HGL-related STCCs, and applies the combined product allocation shares to mixed LPG movements by rail between storage facilities under STCC 2912190. Table 13 provides an example.
Table 13. Illustrative allocation example for HGL storage terminals
PADD 2 to PADD 5 movements for all station types except between storage terminals Product Thousand barrels Allocation Propane 1,250 63% Propylene 450 23% Normal Butane 250 13% Isobutane 50 0%
Source: U.S. Energy Information Administration calculations
HGL carloads from storage terminals are converted to barrels using the generic LPG conversion in Table 4 and then the purity product allocations as shown in Table 13.
Near-month estimates
EIA produces energy-by-rail movement data timed with the release of the Petroleum Supply Monthly (PSM), EIA’s monthly publication of petroleum and biofuels data. PSM published data include supply — field production, refinery and blender net production, imports, receipts, and adjustments – and disposition — stock change, refinery and blender net inputs, shipments, exports, and product supplied. EIA includes energy-by-rail movements along with pipeline and waterborne movements in the calculation of PADD-to-PADD shipments and receipts. The PSM is released on the last business day of

September 2018
U.S. Energy Information Administration | U.S. energy-by-rail data methodology 14
the month and contains data for the penultimate month prior to publication. Energy-by-rail estimates are published in PSM Tables 57-62.13
The most current monthly STB waybill sample may not be received with sufficient lead time to be processed and included in the PSM publication. Further, STB aggregates and provides waybills based on the accounting period, while EIA is interested in the waybill date, which can differ by several months from the accounting period. In addition, waybills from non-Class I railroads might only be included in the sample for the last month of a calendar quarter. As a result, EIA may estimate anywhere from one to three months of rail movements, relying on historical averages or near-month model estimates for those months to be published in the PSM for which incomplete or no STB data are available.
To develop near-month estimates, EIA runs four different models:
• Ordinary least squared model (OLS) • Auto-regressive model (AR) • Average of the previous six months of data • Repeat of the last available data
EIA also calculates the following hybrid models with equal weighting for each component:
• OLS/AR • AR/6-month average • AR/OLS/6-month average
Generally, historical averages are used to estimate the Class II and III railroad waybills that are not included in the monthly sample. When needed, EIA prepares one to three months of near-month estimates and evaluates the accuracy of the estimates using three-month out-of-sample forecasts (OSF). EIA uses a pair of three-month OSFs (six monthly data points) to calculate a root-mean squared error (RMSE). For each of the region-to-region rail movements, EIA uses the RMSE estimates, in combination with analyst judgment, to select model-based near-month estimates.
PSM revision schedule
EIA may revise energy-by-rail data back to January of the penultimate year during any PSM monthly publication cycle. This means that for any PSM published through July 2018, EIA can revise energy-by-rail data back to January 2016. When the Petroleum Supply Annual is published, typically in August, EIA may revise energy-by-rail data back ten years – rail movements are available back to January 2010.
EIA revises energy-by-rail data monthly, revising model-based near-month estimates with sample-based data from the STB waybill sample and revising other historical data as more accurate information becomes available.
13 U.S. Energy Information Administration, Petroleum Supply Monthly, Tables 57-62, http://www.eia.gov/petroleum/supply/monthly/.
September 2018
U.S. Energy Information Administration | U.S. energy-by-rail data methodology 15
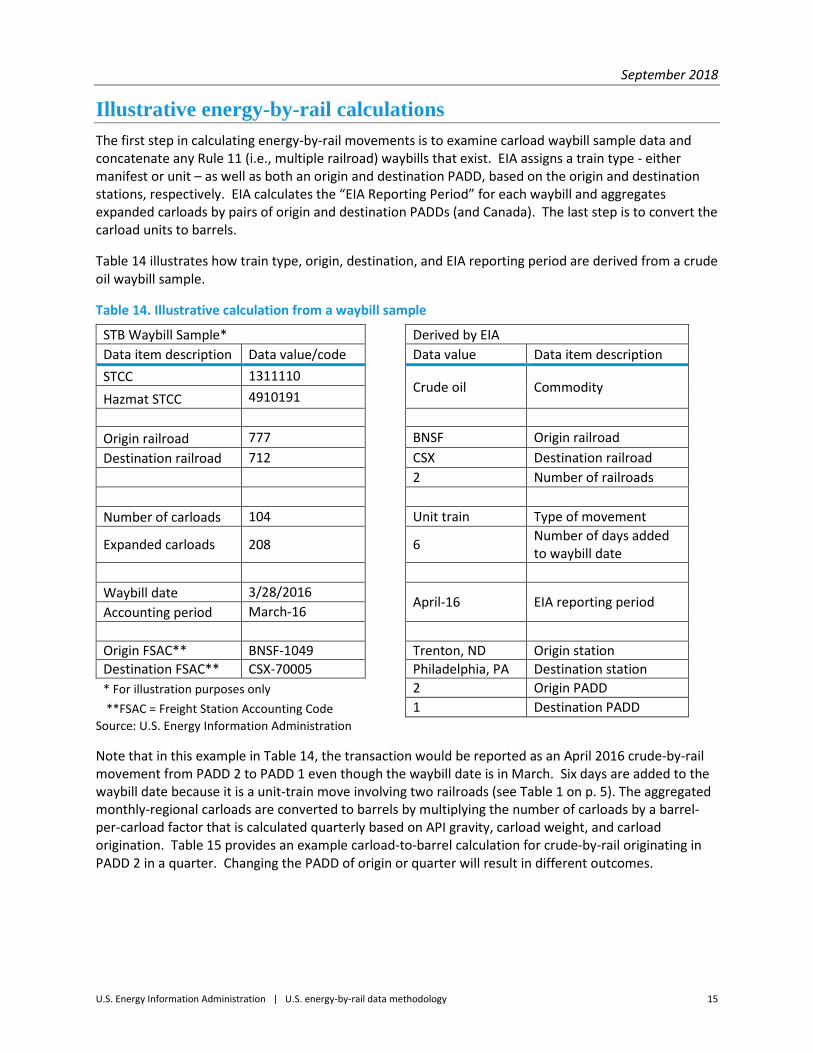
Illustrative energy-by-rail calculations
The first step in calculating energy-by-rail movements is to examine carload waybill sample data and concatenate any Rule 11 (i.e., multiple railroad) waybills that exist. EIA assigns a train type - either manifest or unit – as well as both an origin and destination PADD, based on the origin and destination stations, respectively. EIA calculates the “EIA Reporting Period” for each waybill and aggregates expanded carloads by pairs of origin and destination PADDs (and Canada). The last step is to convert the carload units to barrels.
Table 14 illustrates how train type, origin, destination, and EIA reporting period are derived from a crude oil waybill sample.
Table 14. Illustrative calculation from a waybill sample STB Waybill Sample* Derived by EIA Data item description Data value/code Data value Data item description STCC 1311110
Crude oil Commodity Hazmat STCC 4910191 Origin railroad 777 BNSF Origin railroad Destination railroad 712 CSX Destination railroad 2 Number of railroads Number of carloads 104 Unit train Type of movement
Expanded carloads 208 6 Number of days added to waybill date
Waybill date 3/28/2016
April-16 EIA reporting period Accounting period March-16 Origin FSAC** BNSF-1049 Trenton, ND Origin station Destination FSAC** CSX-70005 Philadelphia, PA Destination station * For illustration purposes only 2 Origin PADD **FSAC = Freight Station Accounting Code 1 Destination PADD
Source: U.S. Energy Information Administration
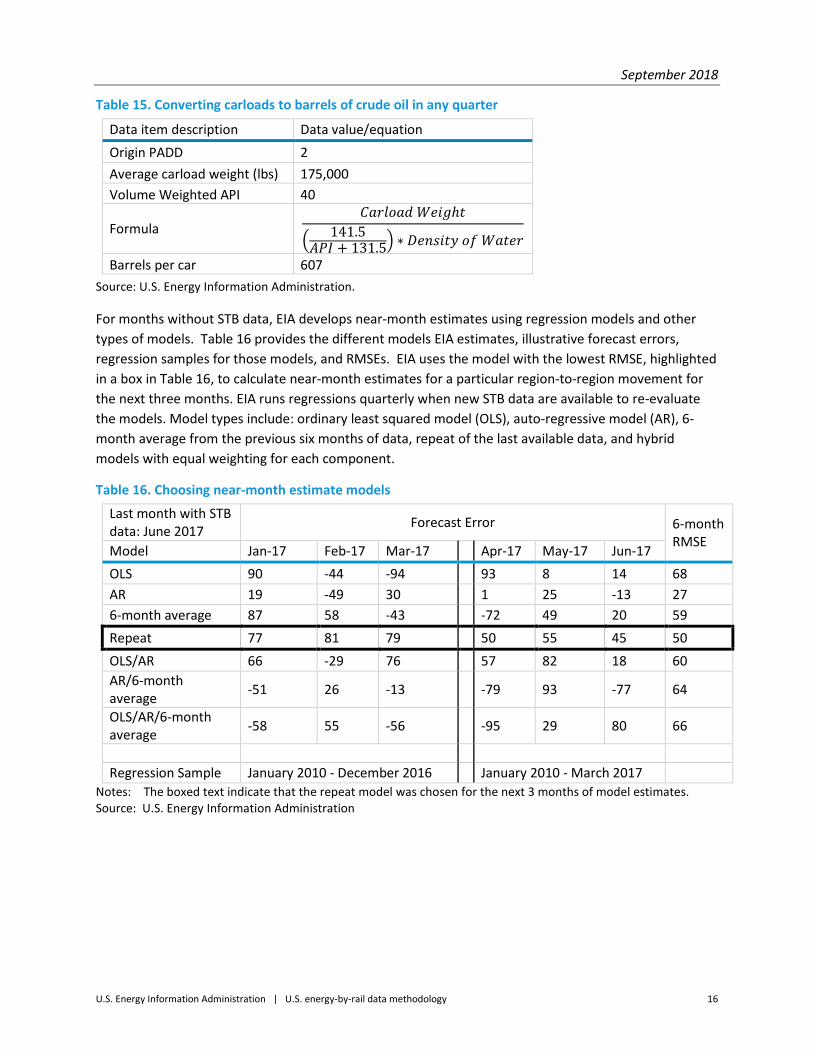
Note that in this example in Table 14, the transaction would be reported as an April 2016 crude-by-rail movement from PADD 2 to PADD 1 even though the waybill date is in March. Six days are added to the waybill date because it is a unit-train move involving two railroads (see Table 1 on p. 5). The aggregated monthly-regional carloads are converted to barrels by multiplying the number of carloads by a barrel-per-carload factor that is calculated quarterly based on API gravity, carload weight, and carload origination. Table 15 provides an example carload-to-barrel calculation for crude-by-rail originating in PADD 2 in a quarter. Changing the PADD of origin or quarter will result in different outcomes.
September 2018
U.S. Energy Information Administration | U.S. energy-by-rail data methodology 16
Table 15. Converting carloads to barrels of crude oil in any quarter Data item description Data value/equation Origin PADD 2 Average carload weight (lbs) 175,000 Volume Weighted API 40
Formula 𝐶𝐶𝐶𝐶𝐶𝐶𝐶𝐶𝐶𝐶𝐶𝐶𝐶𝐶 𝑊𝑊𝑊𝑊𝑊𝑊𝑊𝑊ℎ𝑡𝑡
� 141.5𝐴𝐴𝐴𝐴𝐴𝐴 + 131.5� ∗ 𝐷𝐷𝑊𝑊𝐷𝐷𝐷𝐷𝑊𝑊𝑡𝑡𝐷𝐷 𝐶𝐶𝑜𝑜 𝑊𝑊𝐶𝐶𝑡𝑡𝑊𝑊𝐶𝐶
Barrels per car 607 Source: U.S. Energy Information Administration.
For months without STB data, EIA develops near-month estimates using regression models and other types of models. Table 16 provides the different models EIA estimates, illustrative forecast errors, regression samples for those models, and RMSEs. EIA uses the model with the lowest RMSE, highlighted in a box in Table 16, to calculate near-month estimates for a particular region-to-region movement for the next three months. EIA runs regressions quarterly when new STB data are available to re-evaluate the models. Model types include: ordinary least squared model (OLS), auto-regressive model (AR), 6-month average from the previous six months of data, repeat of the last available data, and hybrid models with equal weighting for each component.
Table 16. Choosing near-month estimate models
Last month with STB data: June 2017 Forecast Error 6-month
RMSE Model Jan-17 Feb-17 Mar-17 Apr-17 May-17 Jun-17 OLS 90 -44 -94 93 8 14 68 AR 19 -49 30 1 25 -13 27 6-month average 87 58 -43 -72 49 20 59 Repeat 77 81 79 50 55 45 50 OLS/AR 66 -29 76 57 82 18 60 AR/6-month average -51 26 -13 -79 93 -77 64
OLS/AR/6-month average -58 55 -56 -95 29 80 66
Regression Sample January 2010 - December 2016 January 2010 - March 2017
Notes: The boxed text indicate that the repeat model was chosen for the next 3 months of model estimates. Source: U.S. Energy Information Administration

September 2018
U.S. Energy Information Administration | U.S. energy-by-rail data methodology 17
Glossary of terms Accounting period - The month and year during which the study waybill is entered into the railroad’s revenue accounting system
Barrel per carload factor – Number used to convert carloads to barrels
Carload – Another term for a rail car – the smallest unit of shipment by rail; includes tankcars to move liquids and hoppers to carry solids
Carload Waybill Sample - Is a sample of carload waybills (stratified by sampling rate) for U.S. freight rail traffic submitted by those rail carriers terminating 4,500 or more revenue carloads annually
Carload weight – Weight in hundreds of pounds as reported to the Surface Transportation Board
Destination – Termination point or station where rail movements ends
EIA reporting period – Month and year in which EIA reports a rail movement
Export Orders – Canada’s National Energy Board issued order for the export of energy commodities
Export License – Canada’s National Energy Board issued license for the export of energy commodities
Fractionator - Facilities that separate a mix of hydrocarbon gas liquids coming from a gas processing plant into purity products that are sold into commerce
Gas plant - Facilities designed to recover natural gas liquids from a stream of wet natural gas from field production that may or may not have passed through lease separators and/or field separation facilities
Interchange – A rail station where the railroad operating the locomotive moving the cargo changes to another railroad operator
Origin – The station where a rail movement starts
Purity product (purity HGL) – individual streams consisting of a minimum of 90% of one type of hydrocarbon gas liquid, e.g., ethane, propane, normal butane, and isobutane
Revenue Carload – A carload shipment that generates revenue tracked by the Surface Transportation Board
Rule 11 – A railroad accounting rule that allows railroads to charge different rates for shipping the same cargo across track owned/operated by different railroads
Sampling rate – Statutorily-defined frequency of counting the number of carloads in a shipment; railroads self-sample following instructions in 49 CFR 1244.4 - Sampling of waybills
Standard Transportation Commodity Code (STCC) - Seven-digit numeric code used by the Surface Transportation Board representing 38 commodity groupings and hazardous materials

September 2018
U.S. Energy Information Administration | U.S. energy-by-rail data methodology 18
Stratified sampling – A sample drawn from different strata (in this case, groups of carloads carrying the same commodity within a single train
Station type – EIA determined designation for a rail station: retail propane distributor, blender, isomerization plant, import/export terminal, petrochemical facility, refinery, gas plant, fractionator, HGL storage terminal
Waybill – A document used in the usual course of business that identifies the date, origin, destination, and quantity of a shipment
Waybill date – The date identified by the originating railroad as the date of departure for the carloads
Recommended